



Abstract
Globally, material footprint assessments reveal the consumption perspective of resource use in economic growth, scarcity of critical raw materials, resource productivity dynamics of nations, and how they affect environmental quality. France is a key international voice on climate change crusades due largely to its share of nuclear power generation in its energy mix, but it has difficulty reaching domestic environmental targets. Given the increasing global concerns for environmental policy action, this paper explores the role of transport infrastructure investments and total energy supply on a material footprint for the case of France between 1995Q1–2020Q4, using the novel nonlinear autoregressive distributive lag techniques (NARDL). To realize this goal, renewable energy consumption and economic growth were considered as controlled variables. The outcomes of the study reveal that (a) transport infrastructure investments exert either a positive or negative impact on material footprint depending on the shock period; (b) energy supply also increases material footprint. These are policy suggestions: (i) To ensure sustainable resource use, France could increase its commitment to resource efficiency roadmap outlined in the Europe 2020 strategy for green growth. Additionally, policies are needed in offshore material sourcing to detect the driving forces behind domestic material consumption. (ii) The transport sector contributes 32% of France's total greenhouse gas emissions. With this insight, France should promote and heavily invest in renewable energy sources and incentivize the switch from combustion engines to electric car investments through taxation or budgetary allocations.
Introduction
Global resource use has recently risen to levels never seen before and is largely driven by the never-ending quest to increase economic growth. Available data on material footprint of nations reveals increasing competition over strategic resources, complexities in global supply chains, and the urgent need for consumer responsibility. Particularly, the unhealthy global competition over strategic resources has created environmental degradation concerns. 1 Instructively, recent major wars and conflicts worldwide have been attributed to competition over strategic resources. 1 Significantly, environmental consequences of material footprint of nations have been found to include water resources depletion, biodiversity losses, and pollution from agrochemicals or oil spillages. These environmental consequences serve as existential threats against humanity, and experts have called for urgent academic and policy action towards dealing with this threat.
Contemporary studies on the flow of materials, resource productivity, and emissions-free growth have indicated the possibility of reducing local material consumption and footprint through the dislocation of material-intensive industries and by substituting domestic extraction with import alternatives. 2 Material footprint of nations refers to total biomass, fossil energy, as well as metal and non-metal ores extracted to meet final consumption demands. According to Wiedmann et al., 3 it also refers to the globally extracted raw materials or those imported for economic action. This is contrasted with traditional material flow accounting, as it elaborates on relations between initial production and end processes.
One of the factors identified by researchers to significantly influence material footprint is transport infrastructure investments. 4 Transport infrastructure facilitates and ensures human mobility. 5 Studies on accessibility of human mobility confirms significant effect on total energy demand in cities. Evidence from these studies indicates rising energy demand due to horizontal mobility especially, micro mobility in vertical directions. 6 There are several studies that confirm that the transportation sector contributes immensely to rising material footprint and carbon dioxide emissions.7,8 These findings are validated by recent studies of Churchill et al., 9 which claim current transport sector activities majorly use fossil fuels, which cause environmental pollution and global warming. Some environmental scientists claim the transport sectors consume significant quantities of fossil energy and resources, 10 which have a serious negative impact on environmental quality. Studies that have validated this finding include Ayadi and Hammami 11 ; Georgatzi et al.; 12 and González et al. 13 However, some critical researchers have argued that this argument does not hold in environmental sustainability discussions if transport infrastructure investments are made in the eco-friendly sectors. Many have suggested that environmental policies on transport energy use could encourage the adoption of environmental-friendly energy sources such as LPG, biofuels, and hydro-based electricity,14,15 Others have also suggested adopting digital and electronic economies could help reduce transport-sector carbon emissions. Notwithstanding these, proponents have, however, classified these claims as simplistic views of reducing CO2 emissions – because realizing such objectives requires a myriad of policy actions over a longer period. 16 To them, arguably, these arguments are particularly the major reasons for critical policy intervention on enhanced echo-friendly investments needed in the transportation sector.12,16
Another factor found to influence material footprint of nations and remains central in both global policy discussions and academic debates is total energy supply. Total energy supply is defined to mean the overall energy supply required in an economy, excluding international aviation and maritime bunkers. Experts claim total energy supply might also include other fuels purchased for use elsewhere (e.g., ‘fuel tourism’ for cases of road transport). The consensus among environmental academics is that replacing fossil energy sourcing and use is necessary for ensuring global environmental quality. Additionally, resource availability warnings focused on the ‘Limits to Growth’ report 17 have received increasing attention globally in reviewing the incessant quest for fossil-energy sourcing and use. Besides, the recent war in Ukraine has created supply problems and highlighted major tensions between the energy sector growth and material supply, given that the latter is required for continuous energy supply. Scientific debates are indicating that technological advancement for renewable energy sourcing also creates new desires for material sourcing–a scenario which is so significant to hinder global quest for dematerialization processes.18,19 Additionally, critics claim technological progress directly linked to economic growth has a high potential for more material sourcing needs, especially in developing countries. Notwithstanding, proponents of environmental technology advancement argue that technological progress is measured differently but manifests itself through efficient utilization of resources, especially by helping to replace fossil energy sourcing at least, for the case of global electricity supply.
Unfortunately, although there remains pressing problem of rising material footprint, these two global material sustainability factors have never been given significant research and policy attention. Given imminent resource scarcity concerns, along with human and societal vulnerabilities to disasters and tragedies, it has become increasingly vital to understand factors affecting the globally rising material footprint for urgent policy action. Theoretically, economies can experience more growth without creating a large material footprint thanks to innovations and technological advancements.20,21 To validate this theory and close the gap in the literature, this paper investigates the effect of transport infrastructure investments and total energy supply on material footprint. In the process, the research answers the following haunting academic questions: (i) Can material footprint be linked to transport infrastructure investments and total energy supply? and (ii) why? To get answers to these questions, France presents a suitable case for scientific investigation.
In general, where countries get their energy to power economic growth remains problematic precisely because of the globally increasing policy direction to shift away from fossil fuels towards low-carbon energy sourcing. In the case of France, total material footprint in 2019 was calculated to be approximately 13.7 t/capita, although domestic material footprint stood at 11.5 t/capita—indicating the effects of imports. On energy, per capita energy consumption in 2022 stood at 3.1 toe. This is estimated to be 7% above the EU average. In crude oil consumption, France has ensured that beginning from its peak in 2001 at 89 Mt, the economy has seen an annual decrease of 1.6% to 63 Mt in 2022. Due to increases in production of refined products by 16% to 42 Mt, imports of crude oil rebounded by 21% to 41 Mt in 2022. For natural gas, France has since 2010 ensured an average decline of 1.7%, except in 2022, when there was a significant fall of a whopping 9.5%. Coal consumption has seen an annual fall since 2013 of 5.8%, and a major fall of 10% in 2022 precisely because all French coal-fired power plants were shut down. For the case of renewable energy sourcing, France has an ambitious target set in its 2021 national energy consumption program for 2030 by 33%. Additionally, the target for energy decarbonization has been set to 58% by 2030 and 71% by 2035. Under the policy, renewables share in heating and cooling is set at 45% by 2030 (297 TWh) and 55% in 2035 (330–419 TWh). The country expects to produce 50 TWh of biogas and 48 TWh of biofuels by 2030. Significantly, the economy has pursued an aggressive energy policy which ensured that annual GHG emissions fell by 2.7% in 2022, except carbon sinks, despite a surprise rebound in 2021 by 5.7%. Figure 1 summarizes France's historical energy consumption by source.
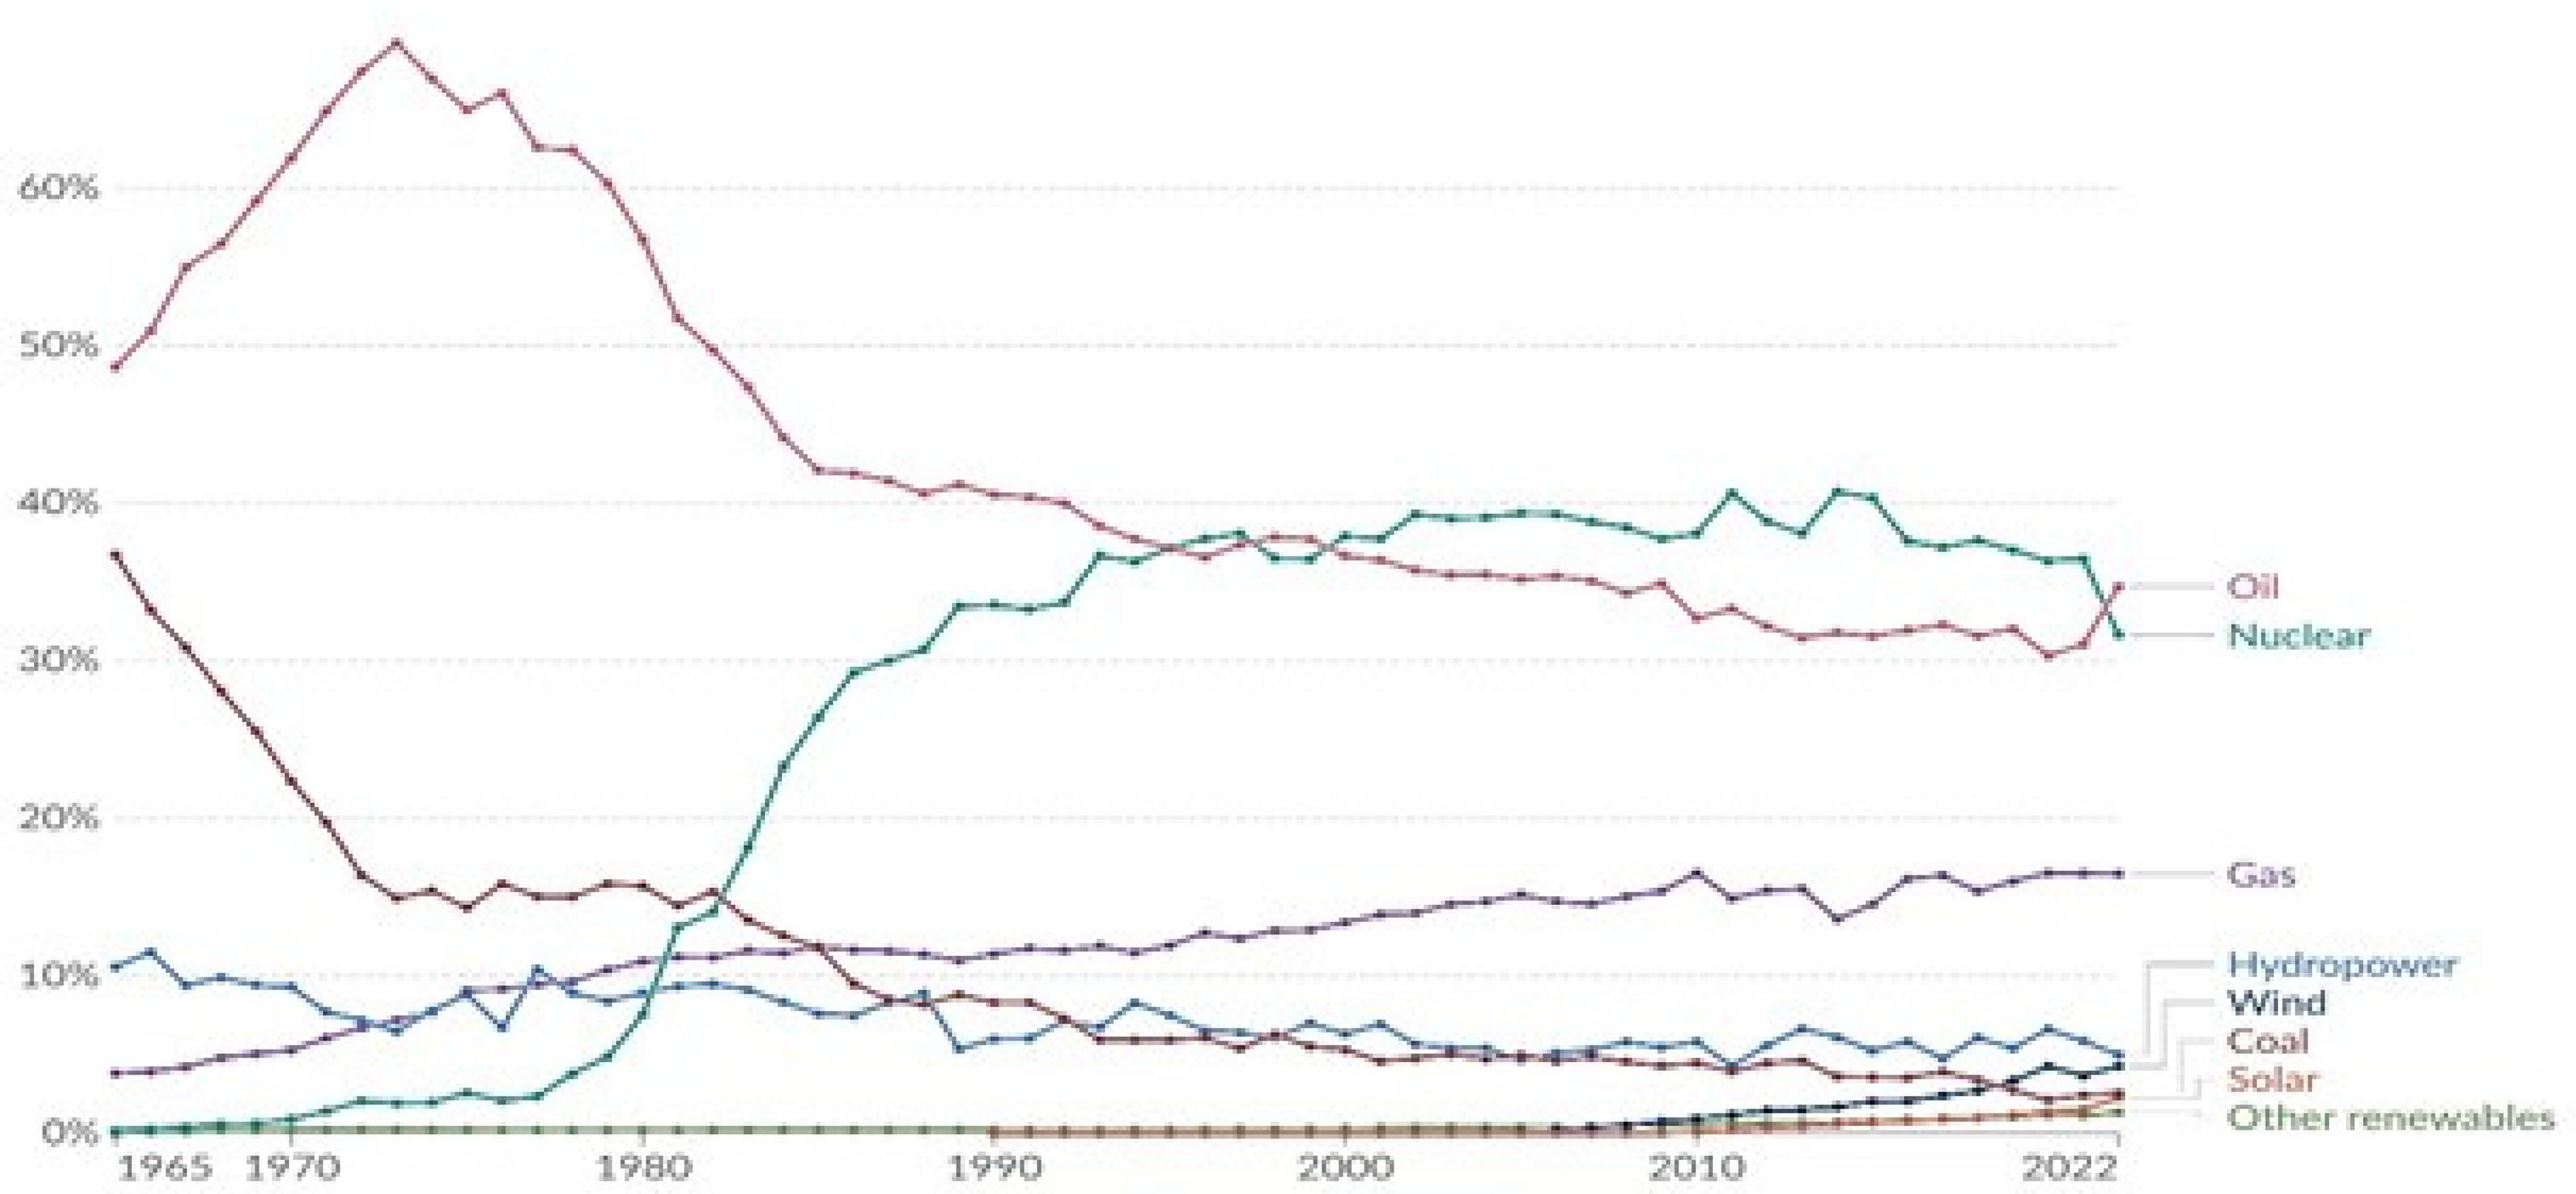
France's energy consumption by source.
Regarding transport infrastructure investments, France has a chequered history, although it has impressive performance (Figure 2). Currently, France is implementing a go-getting policy toward reducing their carbon footprint by taking steps to invest 100 billion euros in the rail sector by 2040. 22 This plan aims to expand and upgrade all rail networks in major cities. Under the clean transport investment plan popularly known as the ‘France 2030 investment plans’, the country is investing EUR 2.5 billion toward supporting the production of about two million electric and hybrid vehicles and placed EUR 1.2 billion on R&D activities towards developing low-carbon airlines. Further, the country budgeted EUR 100 million towards building electric charging infrastructure by the close of 2024. 23 As part of this green policy, a 2040 ban on combustion-powered vehicles has already been enshrined into law to be operational in 2035. The country expects completion in 2050, when the carbon footprint of personal mobility will be reduced by almost 70% towards achieving climate neutrality (95% reduction in emissions). However, critics claim the country is failing to deliver its energy transition targets, notwithstanding vital reforms made. For example, critics argue that although the country's power sector has low quantities of CO2 emissions, its energy consumption is dominated by fossil fuels, culminating in high transport emissions. Additionally, in their critical review of France's transport development investments, Reigner and Brenac 24 noted that sustainable mobility was used for urban planning but did not reduce overall transport pollution record since bypass roads infrastructure was deliberately constructed to reduce negative impacts on inner cities. In this study, they concluded that the transport policies serve merely as urban marketing strategies and largely tend to relocate problems to other parts of urban territories.
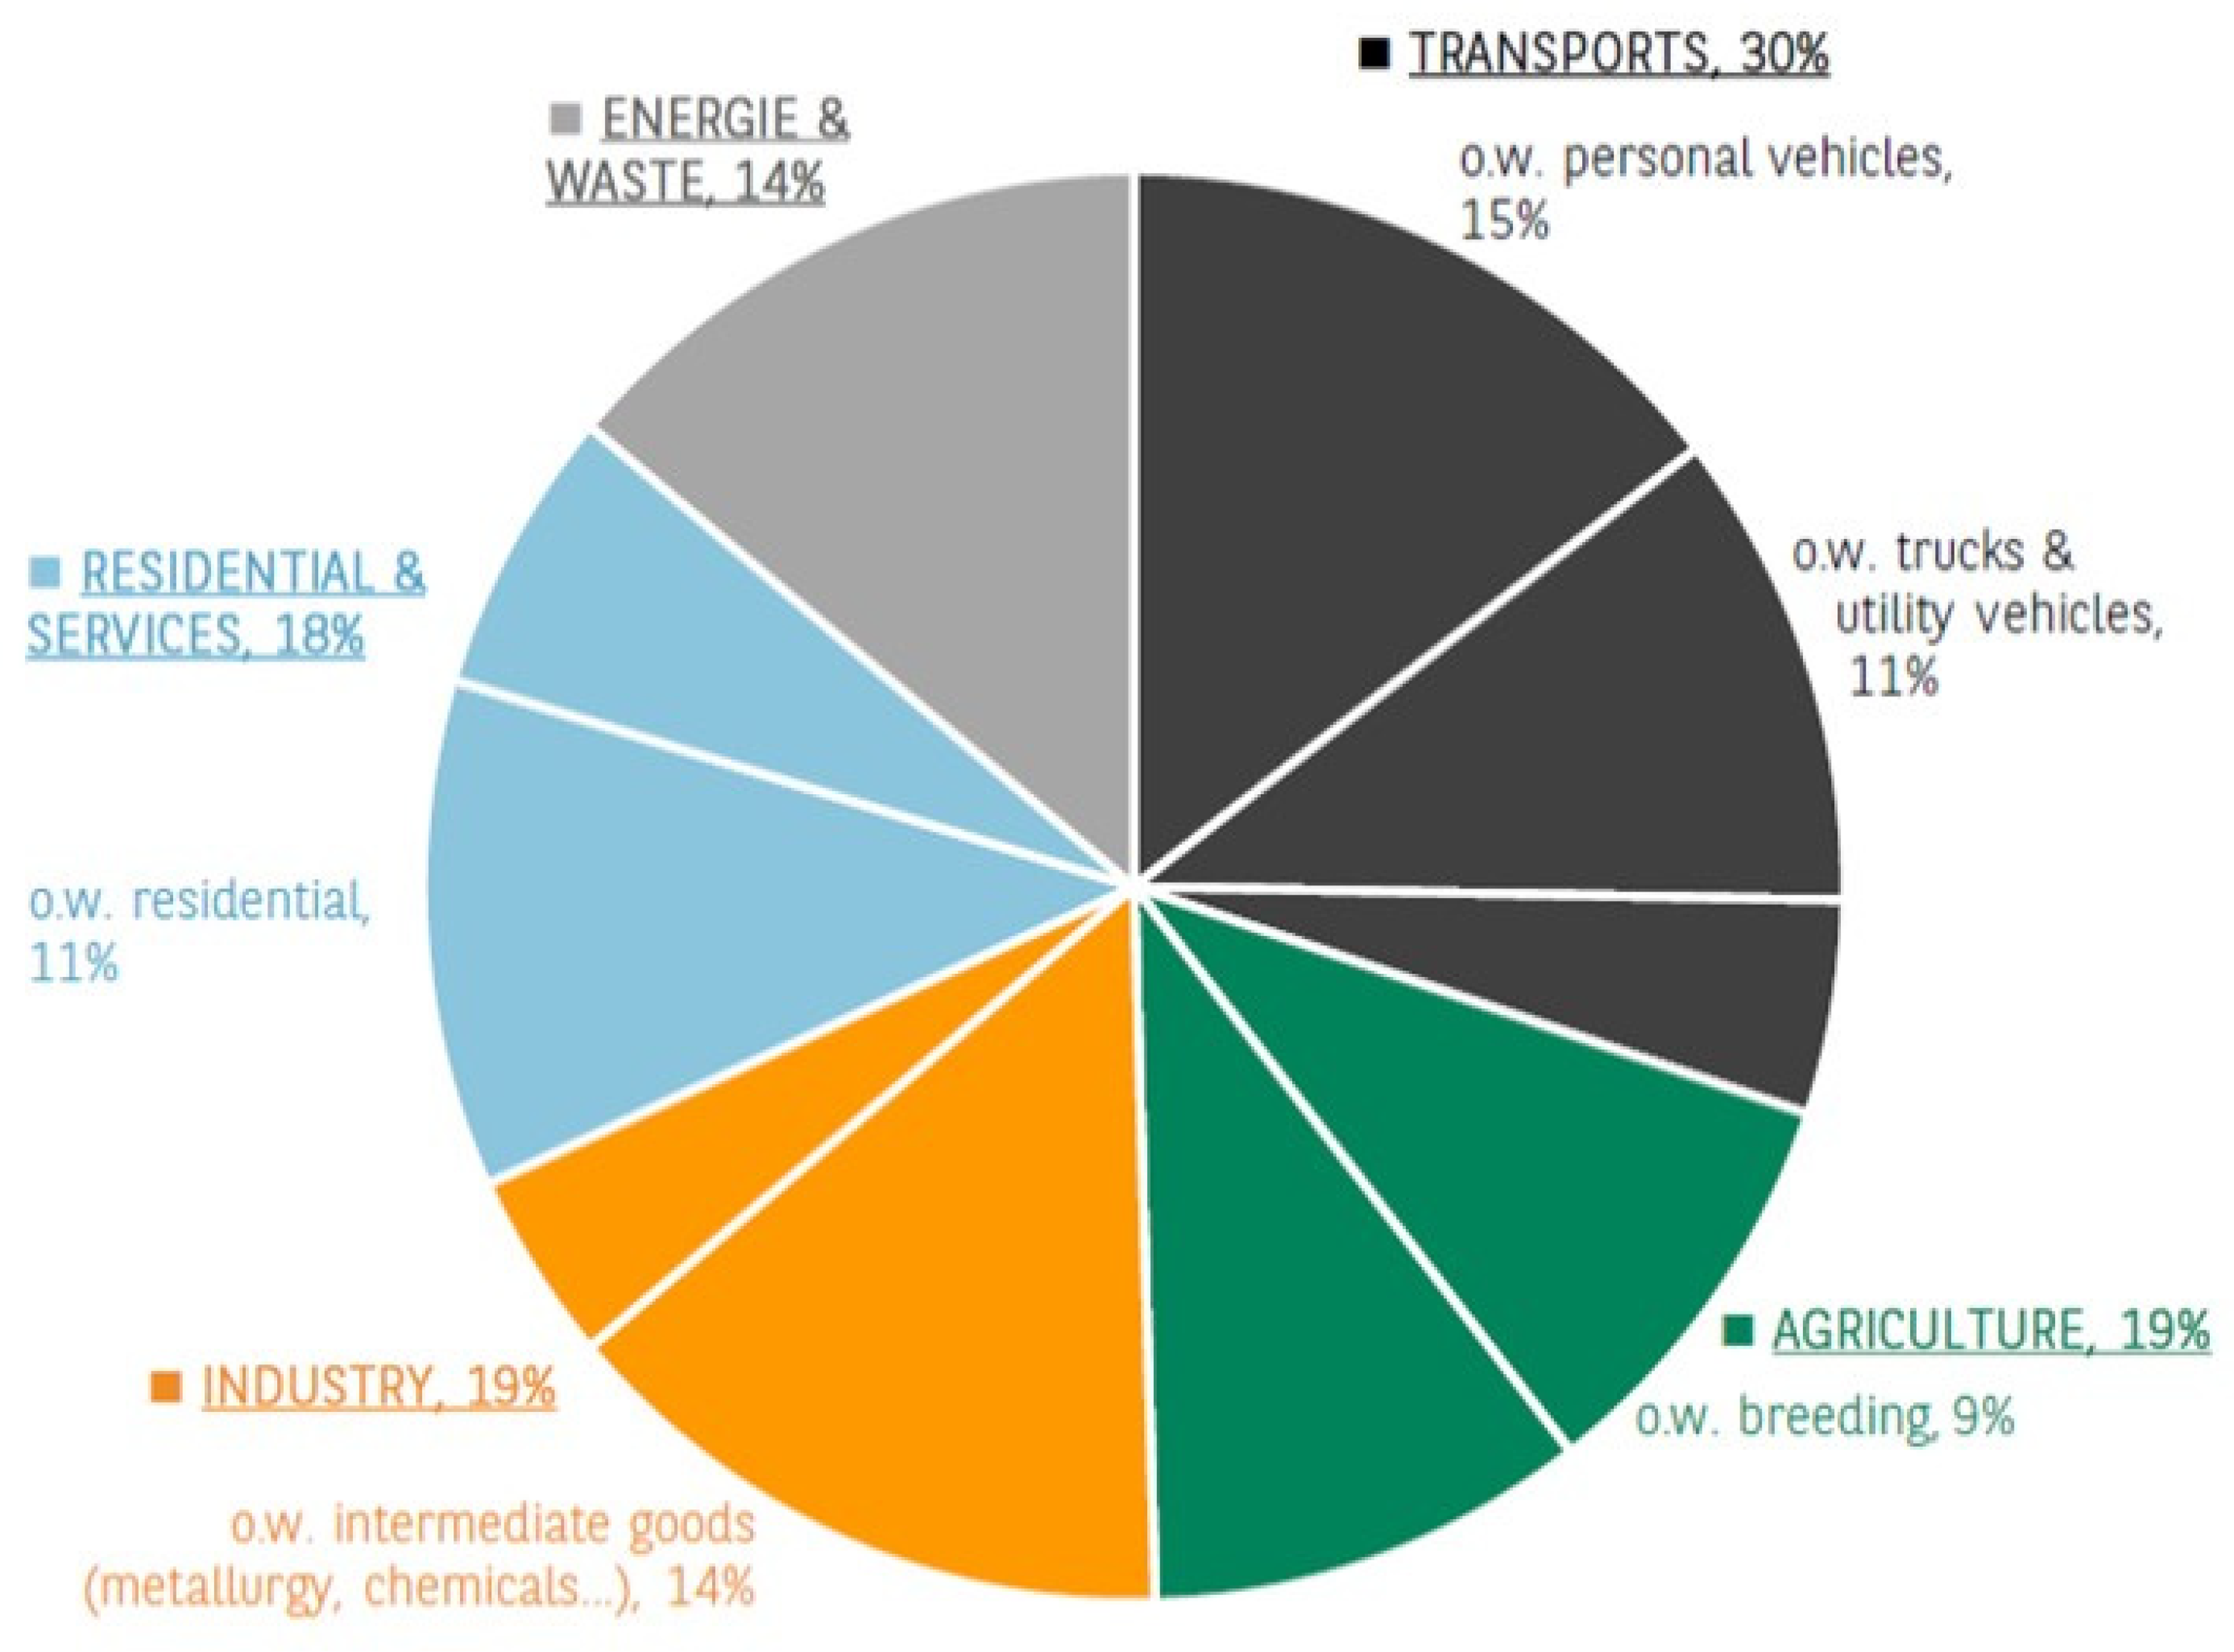
France's distribution of CO2 emissions by sector (2021).
Based on this, validating this theoretical claim by the estimation of the material footprint of transport infrastructure investments and total energy supply of the global economy (and in particular, for the case of France) has yielded inconclusive outcomes and continues to remain a lingering debate and an empirical gap. To close this gap and bring finality to the lingering debates, the paper investigates the effect of transport infrastructure investments and total energy supply on material footprint in the case of France between 1995Q1–2020Q4, using the novel non-linear autoregressive distributive lag (NARDL) approaches. NARDL approach is used because it is validated to help accurately capture long-run asymmetries among the time series variables.25,26 Additionally, the use of NARDL estimator can decompose and differentiate positive from negative shocks of the independent to dependent variable. 27 Significantly, this robust estimator has not been extensively used in the context of France, especially to estimate the linkage between transport infrastructure investments, total energy supply, economic growth, renewable energy supply and material footprint. Theoretically, economies can experience more growth without creating a large material footprint thanks to innovations and technological advancements. 20 Insights from France could provide significant answers to questions asked in this paper, serve as a guide for global environmental policy action (especially on pollution and dematerialization) and further provide academic cues for future material footprint investigations. In particular, outcomes of the paper could encourage investments in energy-sourcing technologies and finance to increase green innovations for economic growth without increasing material footprint. Additionally, given that globally policy attention on natural resource security has become a mainstay amidst increasing recognition of rising dependence on international trade for critical raw materials due to scarcity and concerns about rising prices for primary materials, outcomes of the paper could serve as vital policy guide on material sourcing and use. Further, outcome of this paper could provide additional information to existing literature on sustainable environmental governance.
The remaining part of the study is organized as the next section reviews relevant past studies. This is followed by data and methods used. The paper thereafter discusses the outcomes, and the final section concludes the paper and makes policy recommendations.
Literature review
This section reviews relevant studies on the topic with the view to generating a conceptual framework for the study and establishing a hypothesis on the variable of interest.
Transport infrastructure investments and material footprint
In their study, Kapur et al. 28 defined transportation infrastructure as the fundamental transport development frame that provides enabling environment for the transport system (including airports, roads, railways, seaports, and canals) to function properly. However, the delivery of such a framework requires a great deal of financial investments, material resources, and policy decisions, which, until now, have remained controversial for politicians and researchers. While some researchers argue that advanced and innovative technology growth in developed countries helps to improve transportation services with less material footprint and pollution, 29 some critics claim that globalization and trade create increases in material footprint and carbon emissions. In recent years, environmental scholars have argued that pollution only increases when there is complete negligence of green investments in the transportation infrastructure of the economy.12,30–32 This finding was validated by Georgatzi et al. 12 who studied 12 European economies and found transportation investments helped to reduce environmental degradation.
Hypothesis 1: Transport infrastructure investments increase or decrease material footprint in France
Transportation infrastructure delivery requires huge financial investments and material resources. If the investments are in the green and digital sectors, material footprint theoretically reduces and vice versa.12,30,31 This finding was validated by Georgatzi et al.
12
who studied 12 European economies and found transportation investments helped to reduce environmental degradation. Based on the review, the paper assumes increased investments in green and digital sectors of transport infrastructure create a fall in the material footprint of France. i.e., i.e
Total energy supply and material footprint
Global energy consumption has over the years increased by a third since 2000 and is projected to rise amidst current economic growth levels in business-as-usual situations. Studies indicate 83% of this energy use is sourced from fossils, followed by coal and natural gas. These energy-sourcing methods have been seen as increasingly dependent on using limited natural resources, creating waste and causing climate change as a result. Theoretically, industrial and other energy-consuming activities of an economy produce environmental pollution.33,34 Although several theoretical frameworks capture complexities in energy-economic growth-pollution linkages, the evidence of associated pollution and material footprints in the literature abounds. 35 Against this background, experts have found and suggested that current economic and industrial development could be driven through innovation and technology. This way, they claim, economies could eventually dematerialize and decarbonize production systems. 36 Other studies claim that advanced economies have successfully managed to decouple economic growth from environmental pollution.37,38 Further, recent sustainability experts claim that reducing material footprint is possible and requires shifting from unit to system-level focus by incorporating concepts such as close-loop modeling, energy efficiency, system optimization, and business model transformation.
Hypothesis 2: Total energy supply causes varied material footprints in France
Based on the review, the energy mix of the economy for economic output can determine a worsening environment (both in rising material footprint and carbon emissions.39,40 Theoretically, investment in renewable energy causes a declining material footprint and carbon emissions. The study, therefore hypothesizes that in the case of France, the total energy supply dominated by fossil-based energy causes rising material footprint and carbon emissions, i.e
Economic growth and material footprint
Globally, economic and human development depend largely on the throughput of materials and energy which have been seen to culminate in waste generation, environmental pollution and material depletion.41,42 Historically, early discussions of economic growth and environmental sustainability gained tempo in the early 1990s, when Grossman and Krueger 43 propounded the environmental Kuznets curve (EKC) hypothesis. By explaining this, Grossman and Krueger 43 claimed the existence of inverted U-shaped linkages between economic growth and pollution. To them, pollution increases with rising economic growth until a given optimum level before it begins to fall. This framework has received validation by several studies.44,45 A study by Wiedmann et al. 46 noted that metrics on resource productivity employed by global economies suggest developed economies have reduced exploitation of natural resources in economic growth pursuit (i.e., relative decoupling) or have used alternative resources in economic through innovation (i.e., absolute decoupling). However, by investigating the material footprint of nations, they found that very limited decoupling activity had been achieved than variously reported in the literature.
Hypothesis 3: Economic growth positively and negatively impact on the material footprint in France
Economic growth and the worsening environment (both in rising material footprint and carbon emissions) have been leading academic debates for decades.3,47,48 The environmental Kuznet Curve (EKC) curve suggests that an initial increase in economic growth can cause a rising material footprint and carbon emissions. Based on the review, this paper hypothesized rising economic growth helps to increase the material footprint in France, i.e
Renewable energy and material footprint
Energy sourcing is needed to facilitate economic growth. However, sourcing energy from fossil-based materials causes environmental pollution through the release of CO2 emissions. Besides, the availability of materials for generating the required global economic growth is becoming increasingly limited. In energy sourcing, technological progress causes improvements in the efficiency of resources, especially in the application of renewable energy, which is widely considered a pathway to replacing fossil energy sourcing–at least in electricity generation. Although this has been validated by several researchers,50,51 there is a growing number of environmental experts who argue that the growth of renewable energy sourcing creates new needs for natural resources. 52 In this case, renewable energy sourcing, overwhelmingly touted as a panacea for fossil energy use, can potentially hinder global dematerialization goals. 18
Hypothesis 4: Increased investments in renewable energy supply reduce or increase the material footprint of France
Historically, studies have indicated human activities are causes of accelerated energy demand, especially for fossil-based fuels noted for causing rising global warming.49,53 Based on the review, the paper argues that energy use in production has two impact pathways, namely, positive and negative correlation Table 1. As a result, the paper assumes that increased investments in renewable energy supply will create a fall in France's material footprint i.e
Summary of other relevant literature.

Note: TRI denotes transport infrastructure investment; MF denotes material footprint; TES denotes a total energy supply.
Data and research methodology
Data sourcing
The paper investigates the effect of transport infrastructure investments and total energy supply on material footprint for the case of France. To realize this objective, both economic growth and renewable energy supply were considered to serve as controlled variables. (i) Total energy supply is defined to mean the overall energy supply required in an economy, excluding international aviation and maritime bunkers. Data on the total energy supply was collected from the International Energy Association database. (ii) Transport infrastructure investments refer to investments in the fundamental transport development frame of an economy that provide an enabling environment for the operation of an effective transport system. 28 Data was sourced from the OECD database and measured by share of GDP. (iii) Data was taken on GDP per capita (GDP, in constant 2015 USD to serve as a proxy variable for economic growth); sourced from the World Bank database, 2020; Economic growth refers to growth in production and consumption of economic products and services. 64 GDP per capita calculates per unit total gross value of residents by mid-year population, plus any product taxes; (iv) Data on renewable energy was sourced from the International Energy Agency's database; Renewable energy refers to regeneratable energy naturally. (v) Measured in tonnes/capita, data on Material Footprints was taken from the Global Material Flows Database of the UNEP International Resource Panel. The material footprint of nations refers to total biomass, fossil energy, as well as extracted metal and non-metal ores. Data selection was based on theories and empirical insights from the literature. 65 Scaling problems were controlled by transforming and expressing them in natural logarithm form 66 except renewable energy supply. Figure 3 illustrates the methodological flowchart of the study. The present study used EVIEWS-12 software for the estimations.
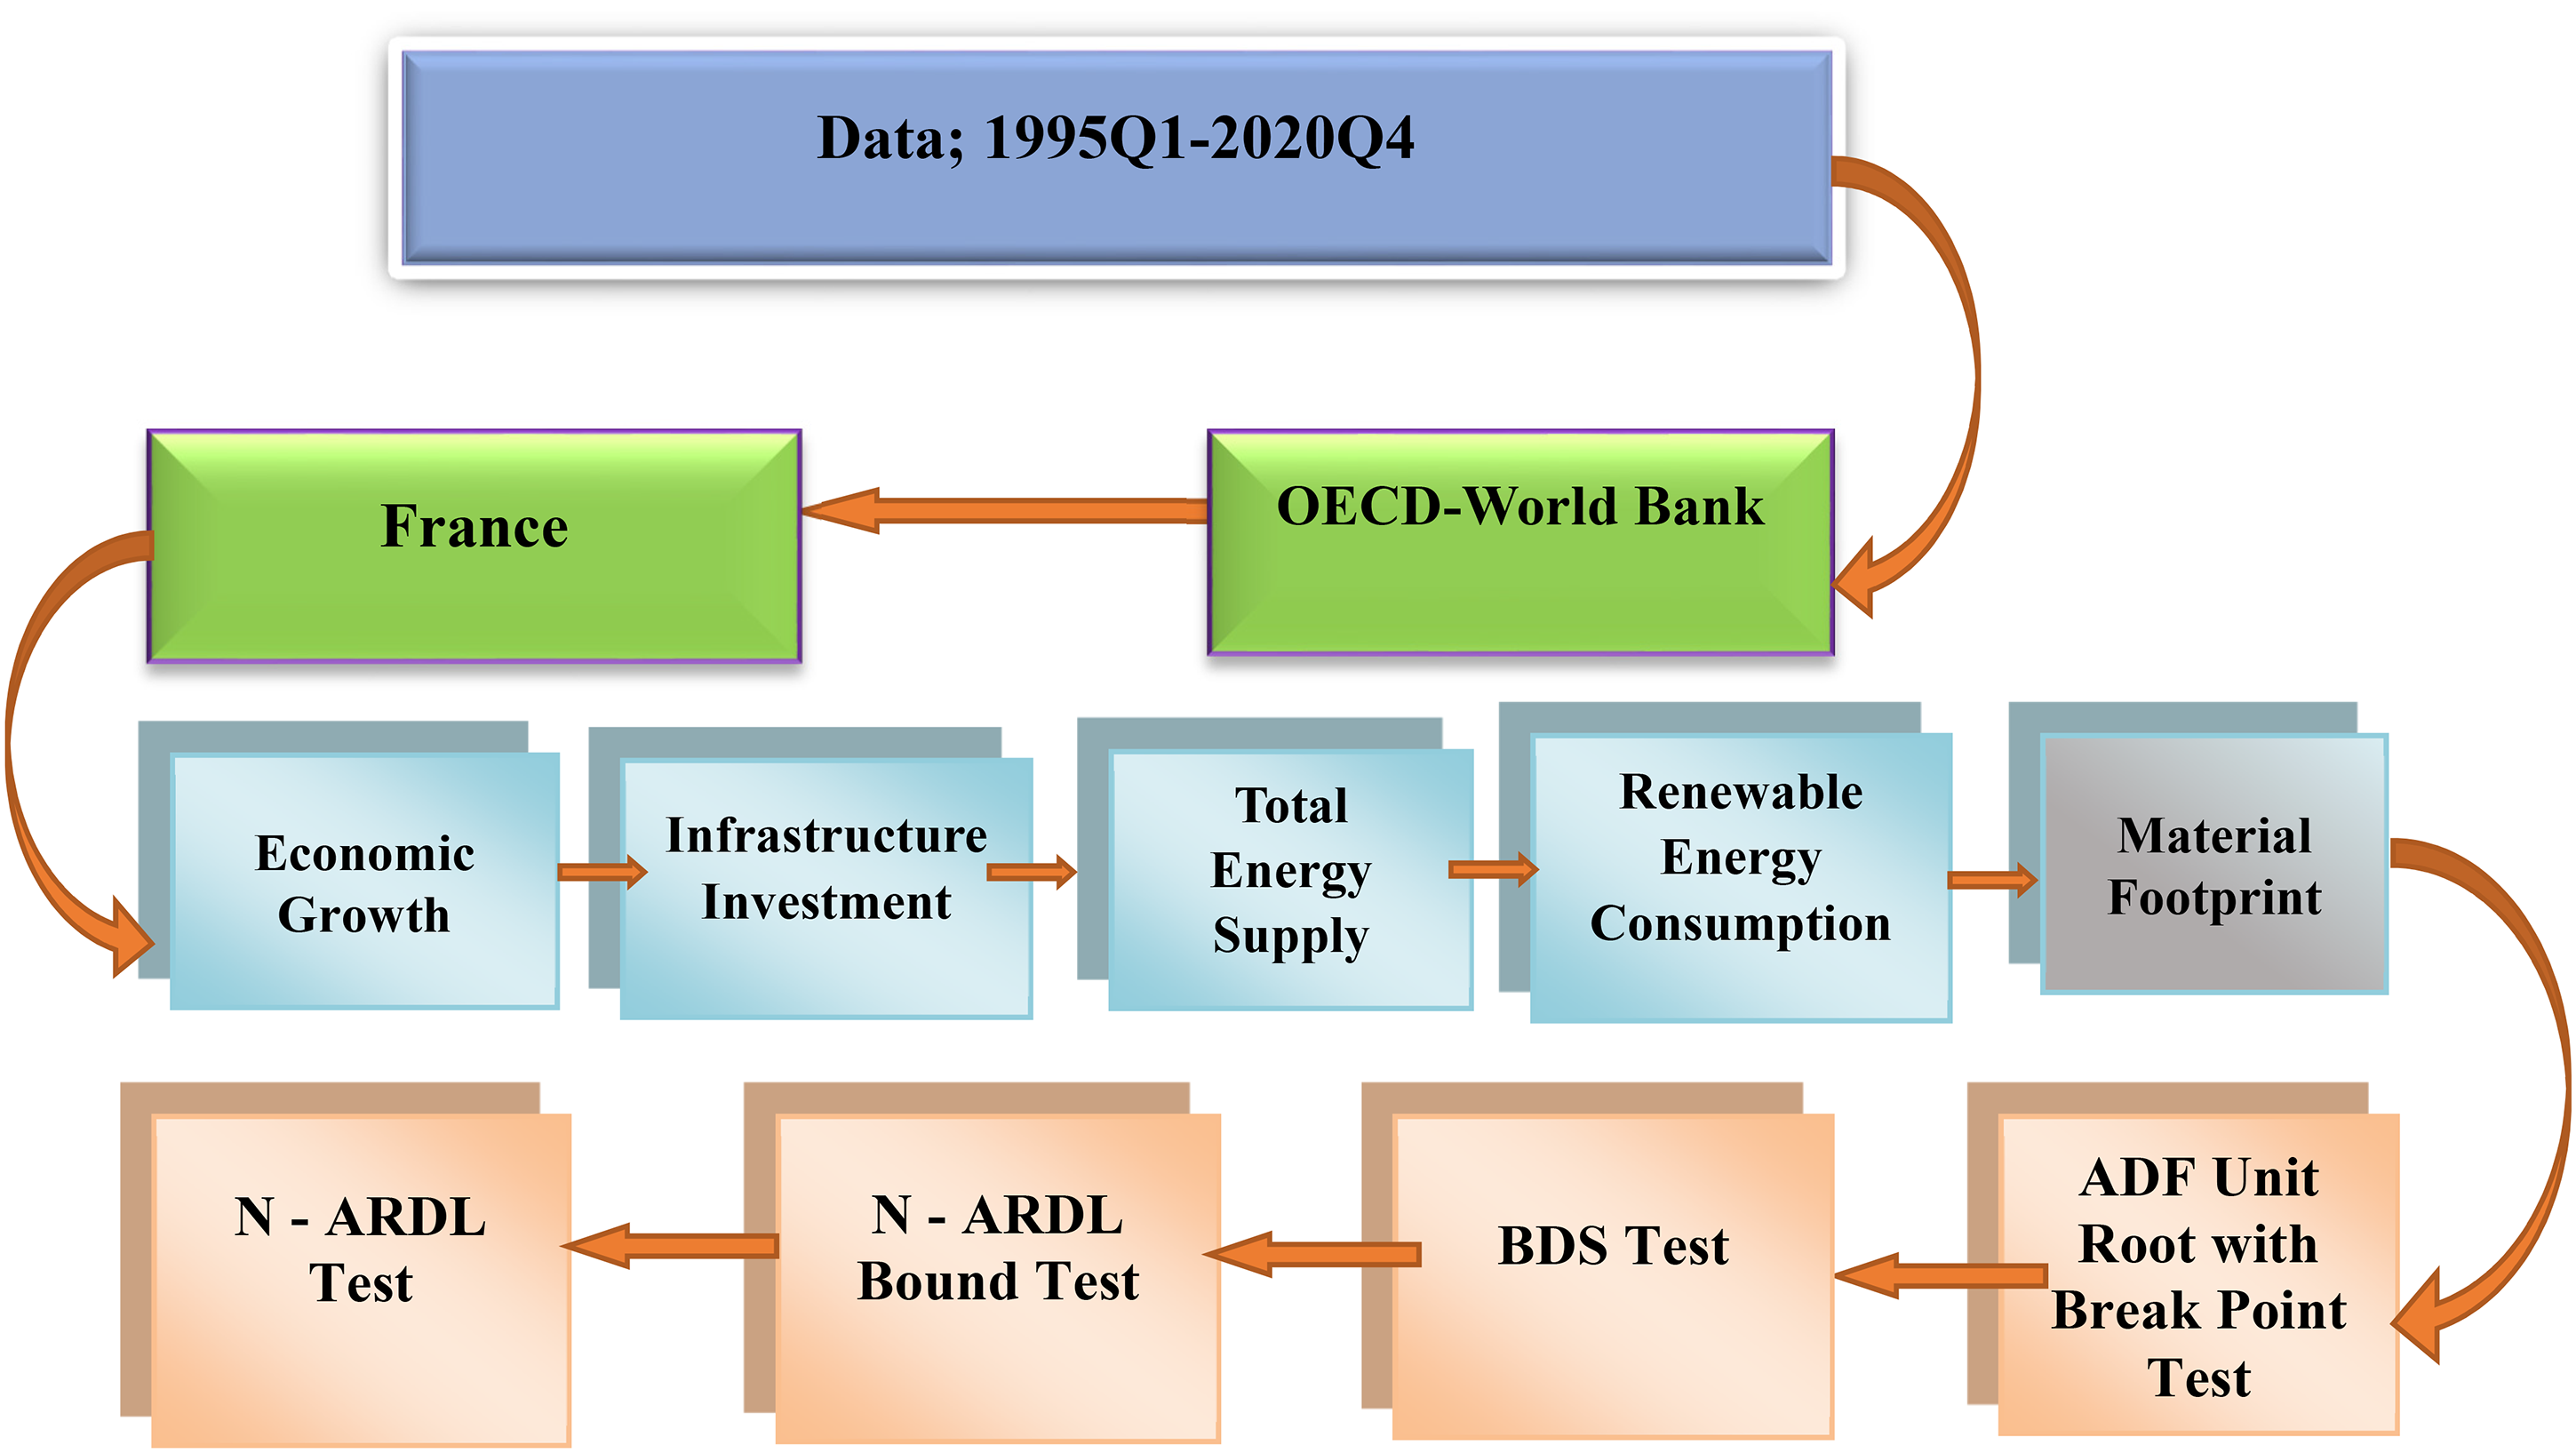
Analysis flowchart.
It must noted that from the methodological description above, both economic growth and renewable energy supply have been used as controlled variables in order to ensure that robust outcomes are generated for policy recommendations.
Empirical model
Nonlinear model
The empirical model is based on nonlinear relationships between the explanatory variable x and response variable y. In this case, the effects of the regressors are decomposed into positive and negative shocks. The nonlinear decomposed functional forms are:

Econometric approaches
BDS test
The present study employs Brock's
67
BDS test, which has the capacity to detect any stochastic hidden nonlinear patterns. For hypothesis testing, a level of significance of 5% is taken. The hypothesis of the test is as follows: H0: The data are independently and identically distributed (I.I.D.) H1: The data are not I.I.D.; this implies that the time series are non-linearly dependent if the first differences of the natural logarithm have been taken. This test helps to detect model misspecification and is expressed as:
Unit root tests
Establishing stationarity of variables is good for avoiding spurious regression estimates.
69
The paper employed the ADF Unit Root Test with Break Point by Dickey and Fuller.
69
The mathematical application for these unit root tests is structured in the following equations:

NARDL bounds test of cointegration test
Modern econometrics assessment requires determining positive and negative shocks to accurately find hidden long-run cointegration. This paper follows NARDL models of cointegration initially used by.25,26 The method demonstrates that the dependent variable, 

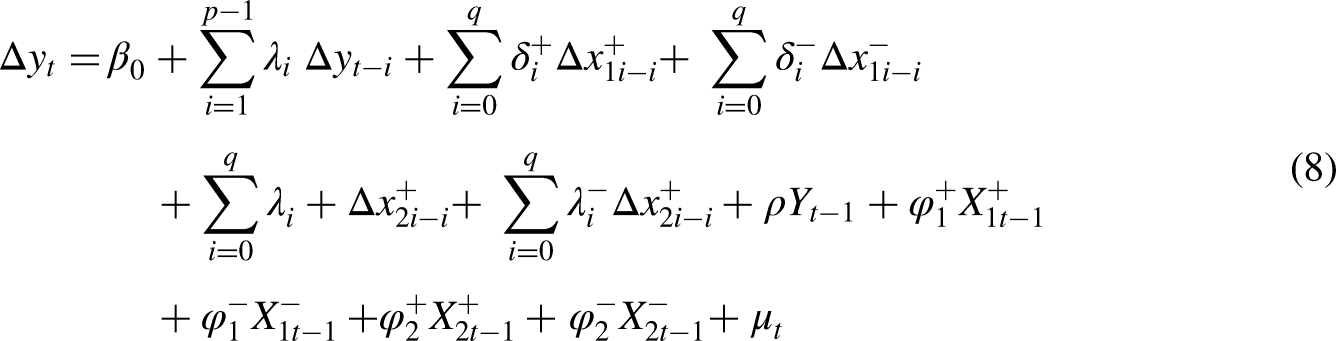
The NARDL model for this study is shown as.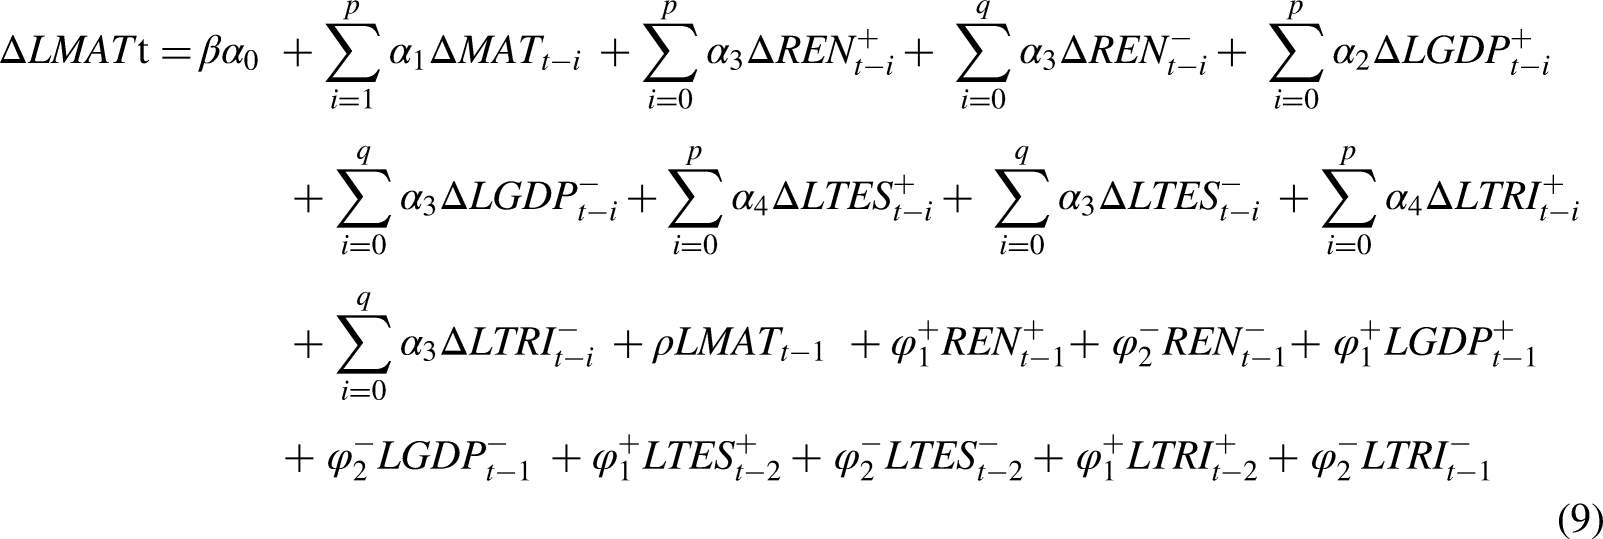
Empirical outcomes and discussion
This paper investigates the effect of transport infrastructure investments and total energy supply on material footprint for the case of France from 1995Q1 to 2020Q4. To realize this goal, both economic growth and renewable energy supply are used as controlled variables. The variables assessed are listed and statistically explained in Table 2.
Descriptive statistics.

The BDS estimates (see, Table 3) indicate hidden nonlinear patterns since all variables have "dimensional critical values" bigger than the BDS estimates. In this case, we know that the null hypothesis that variables are independent and identically distributed (I.D.D) is rejected. This means the variables are non-linearly dependent on each other after taking the first differences of their natural logarithm, and have an indication of a chaotic relationship.
BDS test.
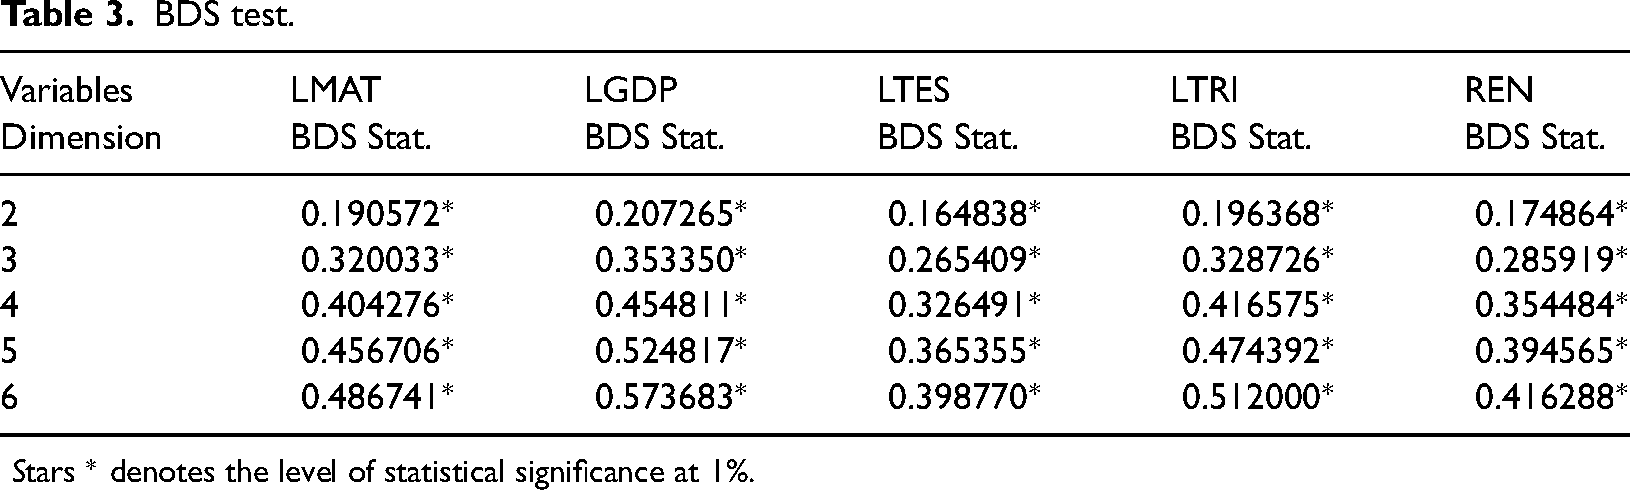
Stars * denotes the level of statistical significance at 1%.
The paper next employs the ADF Unit Root Test with breaks to determine variables’ unit root features. The outcomes of the ADF Unit Root Test with Break Point tests are shown in Table 4.
ADF unit root test with break point.

Note: **, and *** denote statistically significant at the 5% and 10% levels, respectively. Test critical values at 1%, 5% and 10% are −4.949, −4.443, and −4.193, respectively.
Outcomes of ADF Unit Root Test with breaks unit root tests (Table 4) indicate that all variables are integrated at the order I(1) with different breakpoints at a 1% significance level. At a 5% significance level, LTRI seems I(0). Based on the outcome of the ADF Unit Root Test with breaks unit root tests, the paper next estimates long-run relationships among the variables using a N-ARDL Bounds test.
As seen in Table 5, the F-statistics is greater than the critical value, implying that there is a long-run linkage among the variables.
N - ARDL bounds and long run results.
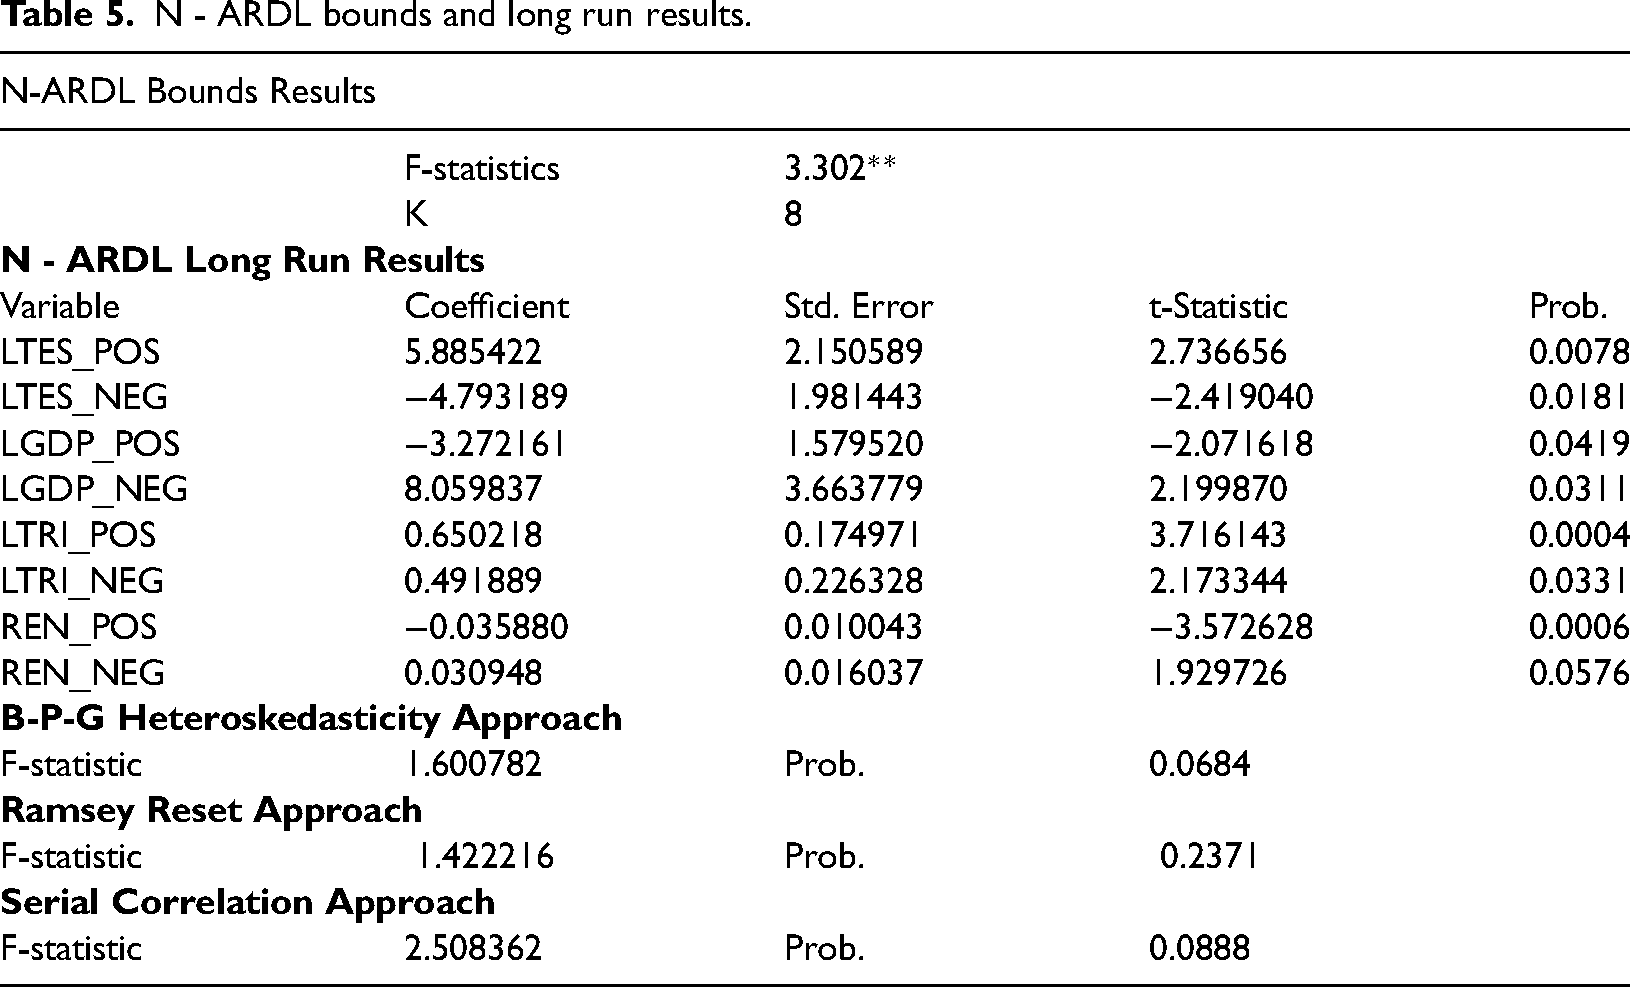
First, it is evident that the NARDL long-run equilibrium estimates (see Table 5) for the case of LTRI, indicate non-linear causal impact on LMAT. Precisely, the coefficient estimates display varied outcomes in different shock periods, which are statistically significant at 1%. The estimates show that a 1% increase in LTRI propels a rise in LMAT by approximately 0.65% during positive shock situations, while a 1% decrease in LTRI causes an unsurprising rise in LMAT by 0.49% during negative-shock periods. The result indicates that the impact responses are non-linear or move in a similar direction. The outcome also validates the hypothesis established for the study (i.e., Transport infrastructure investments cause varied material footprint outcomes in France). The significance of this outcome is that it validates studies of Reigner and Brenac, 24 who found that sustainable mobility was only used in France for urban planning purposes but did not reduce polluting modes of travel since bypass road infrastructure was constructed to reduce negative impacts in inner cities. For years, investments in the rail sector have not gone into high-speed rail systems, which are less polluting than short-speed types. Given that the transport sector consumes large quantities of energy as a direct result of economic growth, its material and carbon emissions footprints are high. To deal with these environmental problems, France's transport development policy should reflect technology adoption, green multimodalities, and decoupling from economic growth.
Second, the NARDL Long-Run Cointegration assessments (Table 5) for LTES indicate a positive and negative non-linear long-term causal impact on LMAT, as coefficients are both positive (i.e., 5.885422% for LTES_POS) and negative (i.e., −4.793189 for LTES_NEG) respectively, and statistically significant at 1% level. These outcomes indicate that any 1% increase in LTES results in a rise in LMAT by approximately 58.85% during positive shock periods. However, during negative shock periods, a 1% decrease in LTES leads to an increase in LMAT by 47.93%. This outcome indicates a validation of the hypothesis established for this assessment (i.e., Total energy supply causes varied material footprint in France). Beginning in 2000, the economic growth of France has resulted in a consistent increase in biomass sourcing (Agreste/SSP; French Customs; INSEE. Treatment: SDES, 2021). It is no wonder that despite the Energy and Climate Law of September 2019, wind resources, exclusive maritime zones, sunshine, forest, and hydropower resources, renewables share of total energy consumption in 2018 was only 16.5%. 72
Third (from table 6), the NARDL long-run equilibrium estimates give an indication that, in the case of LGDP, a positive and negative non-linear causal impact on LMAT exists. This is indicated by the coefficients, which are both positive (i.e., 8.059837% for REN_NEG) and negative (i.e., −3.272161% for REN_POS) and statistically significant at the 1% level. By these outcomes for the case of France, a 1% increase in LGDP leads to a reduction in LMAT. However, at negative shock periods, a 1% fall in LGDP creates a surprise decrease in LMAT as the two variables move in a similar direction (as indicated by the positive response relationships between the independent and the dependent variable). Comparatively, positive shock periods for the case of LGDP lead to a reduction in LMAT for France in direct contrast to what pertains to negative shock periods. This outcome validates the hypothesis established for this study (i.e., Economic growth has varied effects on material footprint in France). This outcome confirms the Green Solow Model, 73 which argues that a fall in material footprints and carbon emissions arise from exogenous technological progress in abatement processes, helping to ensure strict environmental policy on long-run actions on economic growth as in the case of France.
Fourth, the outcomes of the NARDL long-run equilibrium tes (see table 5) indicate that in the case of REN, LMAT in the long-term experiences positive and negative nonlinear changes. This is explained by the coefficient estimates, which are both positive (i.e., 0.030948% for REN_NEG) and negative (i.e., −0.035880% for REN_POS) but statistically significant at a 1% level. These outcomes suggest that a 1% increase in REN at positive shock periods creates a fall in LMAT by approximately 0.035%. However, for negative shock periods in France, a 1% decrease in REN causes a fall in LMAT by 0.0309% as the independent and dependent variables appear to move in similar directions. This finding confirms the hypothesis established following the conceptual framework (i.e., Increased investments in renewable energy supply have a varied effect on the material footprint of France). However, the material footprint was less at negative periods than records in positive shock periods. This implies a dedicated commitment by France to increase the share of renewables and ensure increases in material productivity, with a target of 30% by 2030. This means France must produce with less primary energy and material use to reduce its material footprint. This outcome validates previous findings by Razzaq et al. 54
In empirical studies, researchers have historically considered the stability of the model and residual diagnostic assessments very vital. To reduce material footprints of France, the coefficient estimates in the error-correction model should be stable to warrant policy recommendations on the behavior of independent variables. Consequently, the study determines model stability using the cumulative stability test initially proposed by Brown et al.. 74 The outcomes of both CUSUM and CUSUM of squares tests indicate that the statistical estimates of the models are within acceptable limits (see, Figures 4 and 5). Similarly, to assess if the model is free from heteroskedasticity, the Breusch–Pagan (B-P-G) test (1979) was used, while the Breusch-Godfrey serial correlation LM Test was employed for serial correlation issues. As reported in Table 5, the estimates indicate that the model is free from both heteroskedasticity and serial correlation problems. Finally, the outcome of the Ramsey Reset Approach reveals that the model is devoid of omitted variable bias.

Cusum.
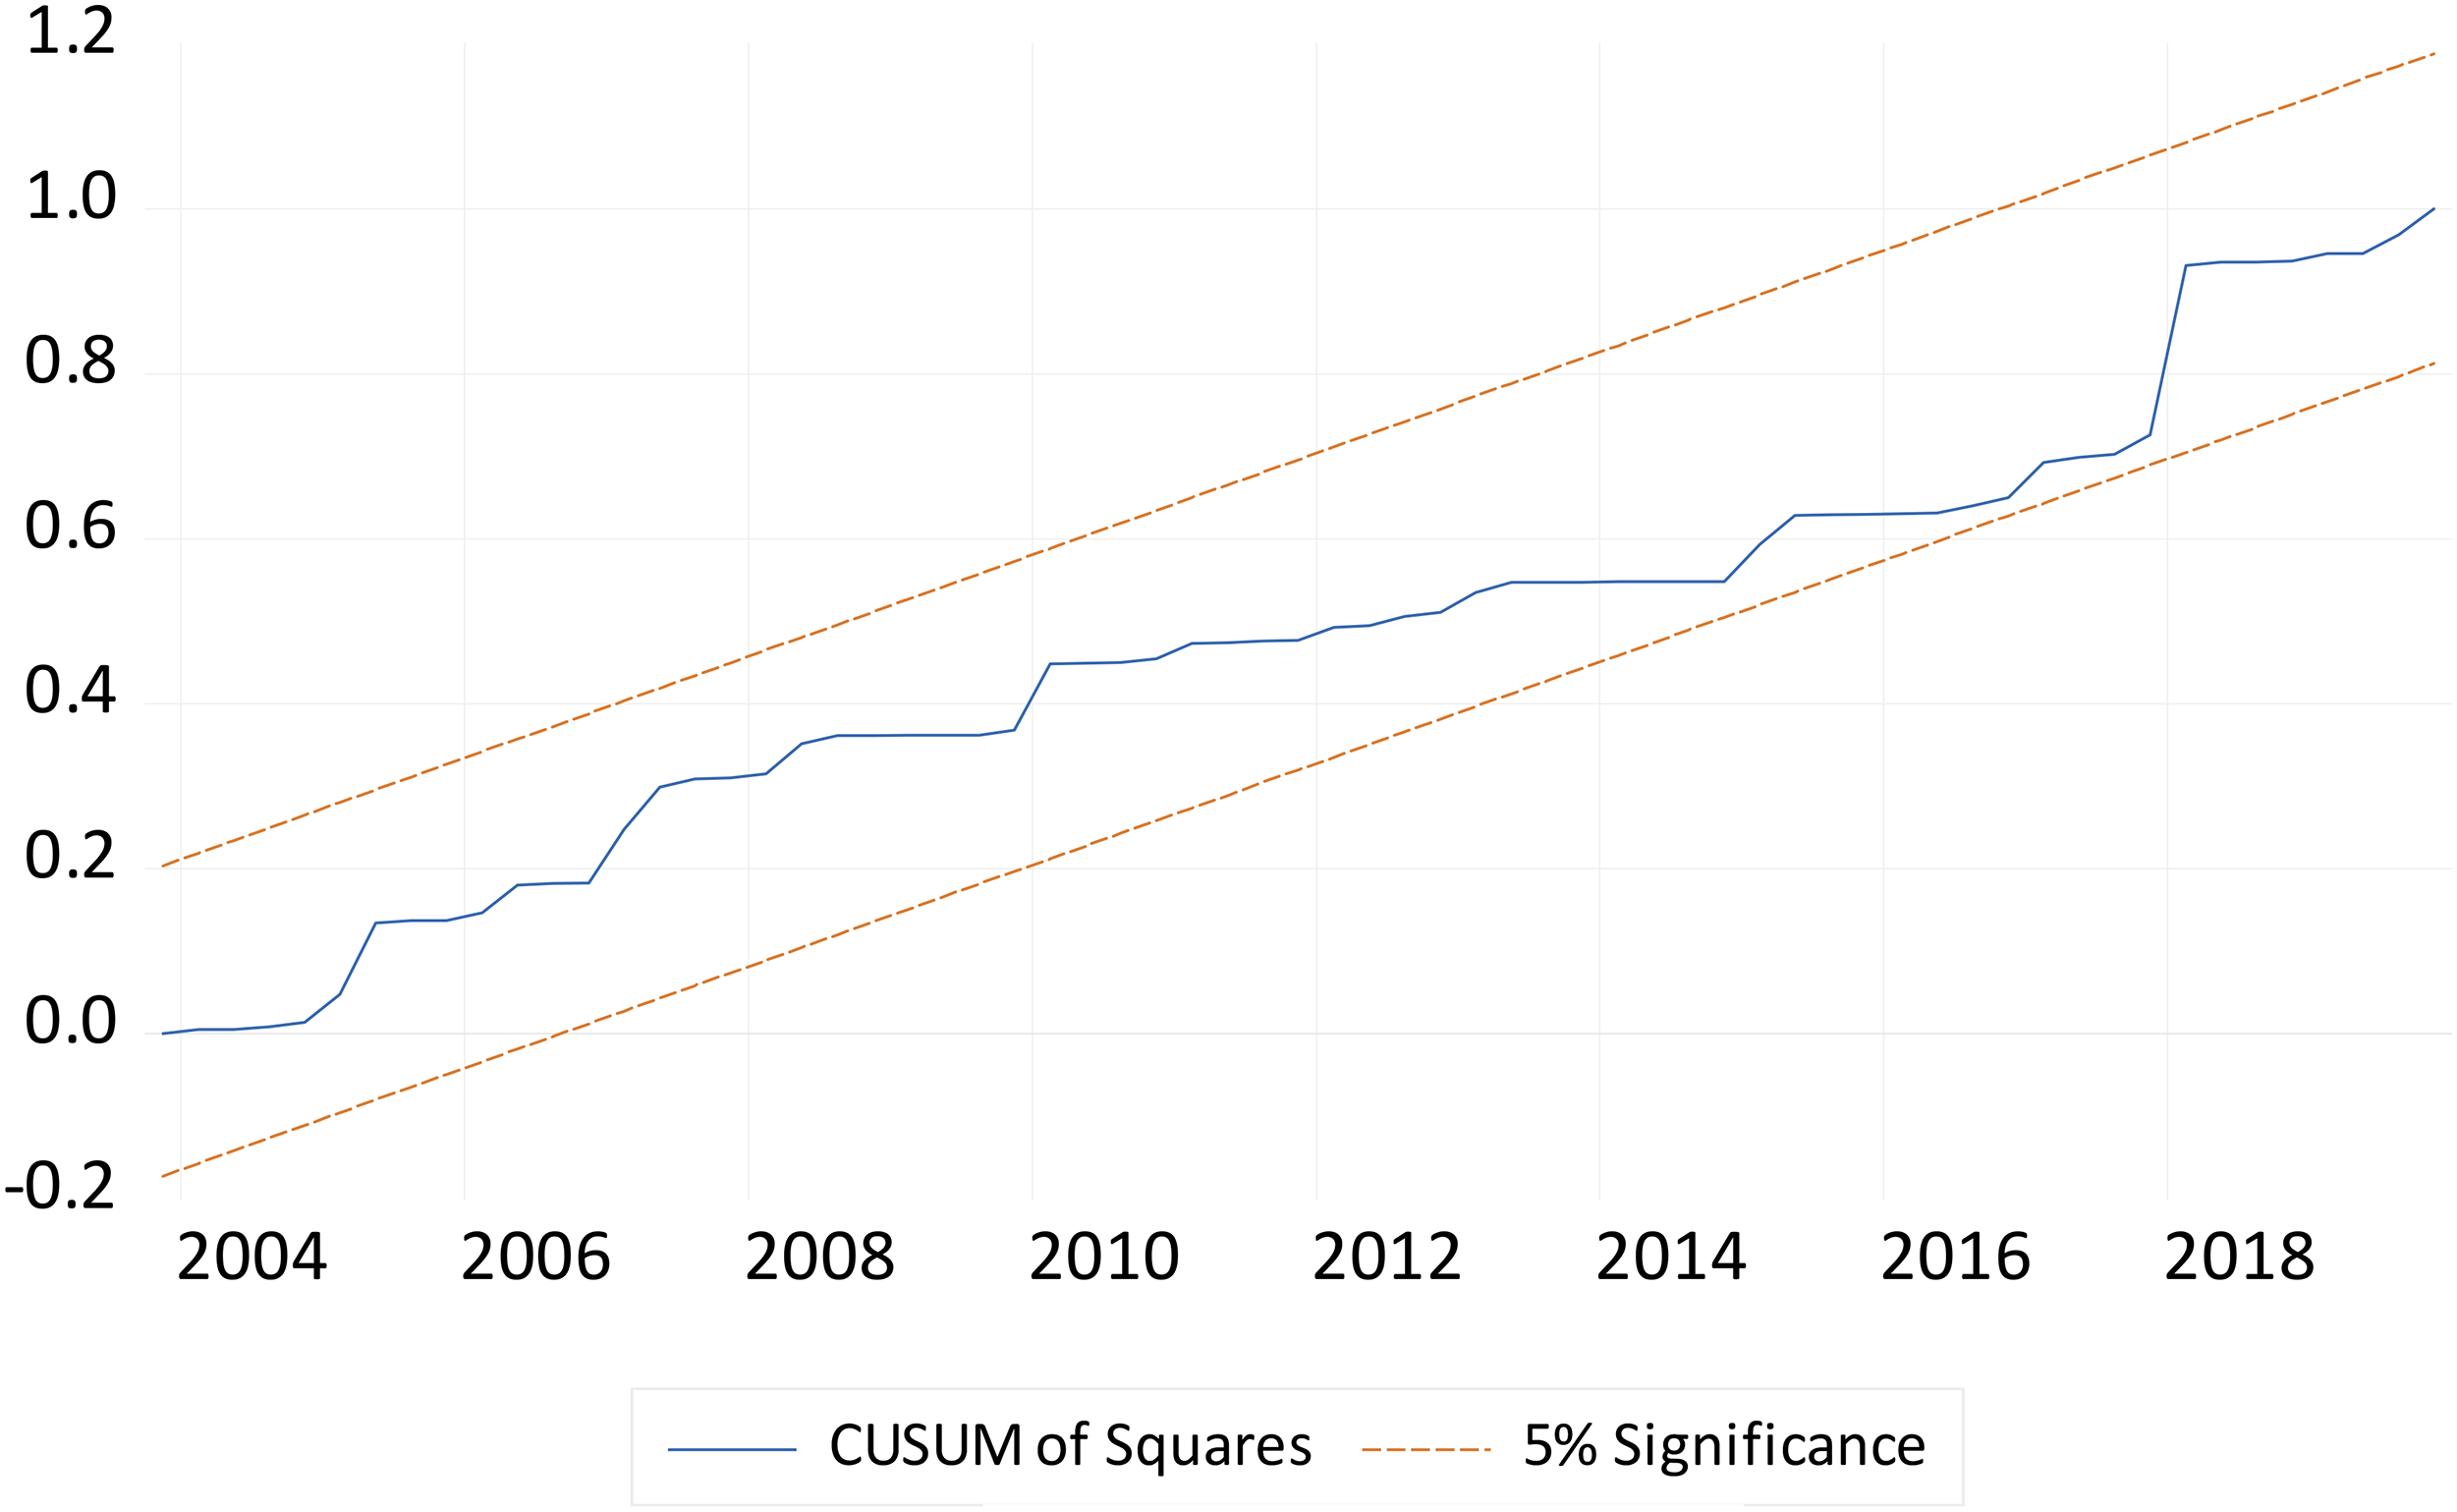
Cusum of squares.
Conclusions and policy recommendations
France has recognized that in recent years, its material footprint record is very high. Intending to increase material productivity by 30% from 2010 to 2030, France seeks to produce more value with fewer primary raw materials. To provide policy insights into the country, this paper seeks to investigate the effect of both transport infrastructure investments and total energy supply on the material footprint of France between 1995Q1 and 2020Q4 using the innovative NARDL estimator. To realize reliable outcomes, both economic growth and renewable energy were considered as controlled variables. The NARDL long-run estimates indicate (i) transport infrastructure investments have both positive and negative non-linear causal impacts on the material footprint of France over the long term. By this, the estimates indicate that during positive shock periods, every 1% increase in transport infrastructure investments generates an increase in material footprint, while during negative shock periods, a fall in transport infrastructure investments causes an unsurprising fall in material footprint as they move in a similar direction (ii) for the case of total energy supply, similar situations apply. Precisely, during positive economic shock periods, an increase in total energy supply exerts an increase in material footprint. However, for negative shock periods, a decrease in total energy supply results in a rise in material footprint as they move in the opposite direction.
Policy recommendations
According to previous records, approximately two-thirds of France's electricity is produced from nuclear sources, making emissions intensity lower compared to several other European countries, such as Germany. However, notwithstanding new decarbonization proposals to phase out fossil fuels, France seems overly focused on deploying new nuclear reactors and stays reluctant to close the gap in existing clean energy sourcing. Accordingly, heavy investments in the renewable energy sector remain crucial to help reduce over-reliance of nuclear sourcing. It must be noted that in September 2023, France unveiled an ecological planning strategy to reduce emissions based on sufficiency, energy efficiency measures, nuclear energy deployment, and renewable energy sourcing that includes a roadmap to end coal power sources by 2027. The government of France could take steps to deliver this ecological planning strategy.
To ensure sustainable resource use, France could increase its commitment to resource efficiency roadmap outlined in the Europe 2020 strategy for green growth. Additionally, given that France cannot satisfy its material needs with domestic resource endowments, policies are needed in offshore material sourcing to detect the driving forces behind domestic material consumption. To guide and ensure progress in these critical areas, the government of France could refresh the national energy research strategy established in 2016. Further, lack of access to portable and clean drinking water and sanitation remains a major cause of death and presents many global challenges. With the international strategy for water and sanitation for 2020–2020, France could ensure increased investment in sustainable and end-to-end management of water resources to also ensure the realization of SGD 6. France could do this by increasing its commitment to improving governance in the water and sanitation sector.
The transport sector contributes 32% of France's total greenhouse gas emissions. Given the low component of renewables in the country's energy mix, France should promote and heavily invest in renewable energy sourcing and provide incentives to support production and adoption of electric mobility in its National Climate and Energy Plan. Heavy budgetary allocations to incentivize the switch from combustion engine to electric car investments are needed. Investors could be urged to develop electric and low-carbon trains to reduce domestic short-haul flights. Additionally, to decarbonize the country's substantial vehicle fleet, France could heavily incentivize developments in low-carbon liquid fuels, biogas, electricity, and hydrogen.
For several years, France committed to implementing resource efficiency plans or strategies contained in the Energy Transition for Green Growth Act promulgated on 17 August 2015, which emphasizes heavily on national circular economy delivery, including natural resources protection. The realization of this strategy could reduce the country's material footprint drastically, providing a better view of the extent of the impact of resource use, including those extracted in-country and those from cross-border economies. In addition, France could implement policies and projects on selected and prioritized material resources that can be considered a priority: fossil fuels, plastic waste, biomass including timber, food waste, construction minerals, and waste, nutrients in organic waste, and strategic metals.
Limitations of the study and prospects for future research
This research explored the role of macroeconomic variables, notably transportation infrastructure investments and energy supply, in determining the state of material footprint in France with a focus on quantitative measurements using second-generation econometrics approaches. Although several determinants of MF abound, this study dwelled only on a few parameters. Given the intricacies and universality required to assess pollution induced by MF and the pursuit of diminution policies globally, many other parameters could be considered for further research. Future studies could also consider exploring the socio-economic determinants of material footprint in the French economy. Given the dynamism of consumer behavior and choices, including taste and fashion, it would be fascinating to conduct a qualitative analysis to investigate how the French society or other EU economies would respond to questions regarding the effects of socio-economic determinants of material footprint. Such could be a project-focused research integrating diverse actors/stakeholders and disciplines. As a result, the diverse effects on various regions and social groups will be recognized, investigated, and addressed properly.
Footnotes
Abbreviation Meaning
Highlights
The present study aims to the effect of transport infrastructure investments and energy supply on material footprint in France The NARDL test is applied in this study. Transport infrastructure investments increase material footprints. Both negative and positive shocks in energy supply increase material footprints.
Declaration of conflicting interests
The authors declared no potential conflicts of interest with respect to the research, authorship, and/or publication of this article.
Funding
The authors received no financial support for the research, authorship, and/or publication of this article.
