



Abstract
While prior research has examined the impact of urban agglomerations (UAs) on particulate matter 2.5 (PM2.5) pollution, few have explored the spatial scope and the mechanism behind the effect. Thus, utilizing data collected from the Yangtze River Economic Belt (YREB) spanning the period from 2002 to 2021, and considering the construction of UAs as a quasi-natural experiment, this research applies a time-varying difference-in-differences (DID) approach to examine the effects of UAs on PM2.5 levels in China, focusing on both spatial scope and mechanism. The outcomes indicate that: (a) UAs could remarkably decrease PM2.5 by about 9%; (b) the most effective spatial scope for this mitigation effect is found to be within 50–100 km (covering Middle reaches of the Yangtze River and Cheng-Yu UAs), while for the Yangtze River Delta UA, the effective reach extends to 100–150 km; (c) mechanism analysis identifies green technology innovation partially mediates the connection between UAs and PM2.5, with industrial agglomerations further enhancing this reduction effect; (d) the effectiveness of the reduction varies according to geographic locations and urbanization levels. These findings offer practical insights for policymakers aiming to refine UA strategies and enact spatially coordinated initiatives for sustainable development.
Introduction
Global warming and rising air pollution are critical challenges worldwide.1,2 The 2021 United Nations Climate Change Conference (COP26) indicates the urgency of global cooperation in solving climate change and air pollution. 3 In China, urbanization has led to substantial economic growth 4 ; however, it has also resulted in increased air pollution, 5 particularly marked by a sharp rise in PM2.5 levels,6,7 which are regarded as particularly detrimental to human health. 8 Meanwhile, urban agglomerations (UAs) have been a remark spatial form during the fast advancement of urbanization in China, which is driving the Chinese economy.9,10 However, compared with other areas, UA areas face more acute energy consumption problems.11 The burning of large amounts of fossil fuels, emissions of industrial exhaust gases, and exhaust gases from traffic congestion have all led to serious air pollution and a sharp rise in PM2.5 concentration.12,13 Especially as the economic epicenter of China and a primary area for the construction of UAs, 14 the Yangtze River Economic Belt (YREB) has a critical effect in various sectors, ranging from trade and commerce to innovation and technology.15,16 Yet, rapid development leads to higher energy consumption and air pollution. Hence, it is critical to investigate the effect of UAs within the YREB on PM2.5 concentrations.
The current literature on UAs and PM2.5 could be classified into three categories. First, some scholars have investigated the spatiotemporal dynamics of PM2.5 along with its subsequent spatial spreading impacts within UAs.17,18 Second, some scholars have delved into the socioeconomic factors of PM2.5 within UAs, like urbanization development level, population concentration, and industrial restructuring.19,20 Third, certain research has studied the UAs’ influence on PM2.5, holding both positive and negative augurs.21–23 Although fruitful studies exist, some issues still have not been fully explored. First, few researchers have measured the effect of UAs from the aspect of spatial scope. Second, the majority of researches concentrate on the overall influence of specific UAs on PM2.5 rather than comparing disparities between UAs. Third, the research mechanisms have been partly studied in the literature, but the boundary conditions of the mechanism, that is, the moderated mediating effect, have seldom been researched.
Therefore, this research investigates how UAs in YREB impact PM2.5 levels, utilizing city-year panel data spanning from 2002 to 2021. Specifically, the construction of UAs is analyzed as a quasi-natural experimental policy to assess its impact and spatial scope on PM2.5 levels, as well as the role of green technology innovation (GTI) as a mediator through a time-varying difference-in-differences (DID) approach. In addition, the heterogeneity analysis of geographical location along with urbanization levels is examined. Several research questions are thus explored:
This research has several contributions. First, the research enriches the study framework on UAs and PM2.5. This article provides a deep perspective for researchers by exploring the mechanism which UAs affect PM2.5. The advantages of considering UAs’ construction as a quasi-natural experiment and utilizing the DID approach include mitigating potential endogeneity and obtaining more robust results, thereby addressing the shortcomings of prior literature. 24 Second, this paper can provide the government with valid insights into the most effective spatial range of the PM2.5 reduction. The government can assess the central city’ s role in the synergistic development of UAs by understanding the optimal spatial scope. The heterogeneity analysis of geographical location shows that UAs in western regions can reduce PM2.5 more significantly than in the eastern areas. This result enables governments to elevate their standards of PM2.5 control and provides a direction for identifying the potential shortcomings of various UAs. Third, this discovery provides a significant incentive for firms to boost research and development (R&D) efforts in GTI. The findings demonstrate that firm GTI can enhance the effect of UAs on reducing PM2.5. Firms can gain the support of customers, strengthen their core competitiveness, and project a positive image of environmental protection in the market environment through improving GTI.
The following organization is outlined: section “Literature review and research hypotheses” provides a concise overview of the existing studies. The third section describes the data and methodological approach utilized in the study. The fourth part delivers the findings and engages in a relevant discussion. The concluding section highlights the research findings and presents their policy implications.
Literature review and research hypotheses
After a brief review of the extant literature, this segment will posit hypotheses concerning the influence of UAs on PM2.5 pollution and the potential mechanisms, as well as the spatial scope.
Literature review
PM2.5 is atmospheric particulate matter with a diameter of 2.5 μm or less, which can pose significant health risks when present in high concentrations. 25 To decrease PM2.5 pollution, numerous empirical researches have investigated the factors influencing haze pollution, such as the natural causes 26 and chemical elements. 27 As technology progressed and research advanced, some scholars found that PM2.5 has a close bearing on human socioeconomic activities, encompassing industrial configurations, 28 population dynamics, 29 economic engagements, 30 vehicular usage, 31 and urbanization. 32 For instance, Zheng and Xu 33 found that the spatial agglomeration of high-pollution factories has worsened PM2.5 pollution. Urbanization is widely acknowledged as a determining factor among the various factors influencing PM2.5. 34 As cornerstone entities in regional urbanization, the construction of UAs, also known as metropolitan areas or megalopolises, has emerged in recent years and received widespread attention. 35 Given that UAs’ constructions represent a high level of urbanization and bear the responsibility for environmental protection, some scholars have begun to research the connection of UAs with PM2.5.
The extant literature on UAs and PM2.5 has generated a wealth of findings, which can be classified into three categories. First, some scholars have researched the temporal and spatial variations of PM2.5, along with their subsequent spatial dispersion effects within UAs. For example, He and Lin 17 revealed the characteristics of spatial autocorrelation related to PM2.5 and the socioeconomic spatial spillover consequences across 27 cities in the YREB. Ouyang and Wei 36 found that urban land use patterns influence PM2.5 emissions. Second, certain academics concentrate on socioeconomic factors that impact PM2.5 within UAs. For example, Wang and Shan 37 examined the correlation between high-speed railway infrastructure expansion and air pollution emissions in cities situated in the Yangtze River Delta. In addition, Kong and Zhang 38 carried out empirical research examining the links between urbanization levels, industrial restructuring, and the ensuing haze pollution found in cities across the Yangtze River Delta. Third, several research efforts have utilized the quasi-natural experiment method to investigate the interactions between UAs and PM2.5. For instance, Jiang and Jiang 39 found the prominence of pollution mitigation impacts associated with national UAs’ construction, particularly in central and western cities, as well as smaller municipalities. Kong and Zhang 38 investigated how the national UAs’ strategy influences both economic growth and environmental pollution within China.
Although previous studies have made considerable progress in examining the connection of UAs with PM2.5, several limitations remain. First, the research into the precise spatial scope of UAs’ effects on PM2.5 emissions is lacking. UAs often have one or more core cities as the core of the regional economy. Yet, the current literature does not study PM2.5 emissions across varying spatial dimensions. Further research focusing on PM2.5 emissions at diverse spatial levels is essential for comprehending the most effective spatial scope of PM2.5 emission reduction. Second, most of the current research on the connection of UAs with PM2.5 is largely confined to a single UA or certain regions, with limited attention given to the YREB’ s UAs as a whole. Existing studies have explored the spatial evolution and determinants of PM2.5 in the Yangtze River Delta, 40 the Cheng-Yu, 41 the Middle Reaches of the Yangtze River UAs. 42 However, there is an absence of comprehensive study in YREB that compares the effectiveness and magnitude of impact across multiple UAs. Third, the mechanism by which UAs affect PM2.5 has received little attention. Most studies explore the impact of UAs on PM2.5, which often relies on a range of proxy indicators, such as population urbanization, 43 land urbanization, 44 as well as economic-level urbanization. 45 Nevertheless, the mechanisms by which UAs affect PM2.5 have not been thoroughly studied. Moreover, limited research explores the boundary conditions of the mediation mechanism, that is, the moderated mediating effect. Hence, this paper will leverage the DID approach to study the connection of UAs with PM2.5. The specific analyses include spatial scope measurement, mediation mechanism analysis, and heterogeneity analysis, aiming to deliver valuable insights and practical recommendations to peer academia, policymakers, and practitioners.
Research hypotheses
Urban agglomerations and PM2.5
This article argues that the construction of UAs will decrease PM2.5. That is because existing research has demonstrated that UAs’ construction can advance regional economic growth, technological innovation expansion, as well as foreign investment improvement.
46
Enhanced economic growth and efficient administration may decrease PM2.5 levels.
33
Furthermore, the construction of UAs enables more effective enhancements to infrastructure, such as the advancement of cleaner public transportation systems and the implementation of urban green landscapes, which may help reduce PM2.5 pollution.
47
Moreover, designating specific zones for industrial activities away from residential areas serves as another strategic advantage. Establishing industrial parks in urban areas may help enforce and oversee tougher emission regulations, causing a more efficient decrease in PM2.5 pollution.
48
Built upon the analysis, the study proposes the basic assumption.
Urban agglomerations, PM2.5, and the spatial scope
The centrality of UA influences UAs’ construction on PM2.5 levels, which will be influenced by spatial distance. UAs are collections of cities of different sizes, with one or more large and medium-sized cities that act as the economic hubs and diffusion centers within these regions. This centrality makes developed cities tend to be at the center of the UAs, while less developed cities tend to be at the edge of the UAs.
49
The spatial distance between cities and the center city varies and may have different impacts on PM2.5 levels. The closer an area is to the city center, the higher the intensity of elements like capital, labor, and information movement, leading to an increase in industrial activity, which may exacerbate air pollution.
50
Built upon the aforementioned analysis, the second assumption is put forward.
Urban agglomerations, PM2.5 and green technology innovation
GTI involves the creation, advancement, and implementation of technological solutions that mitigate environmental damage while fostering sustainable development.
51
Various studies have investigated how GTI enhances resource efficiency and recycling practices, resulting in reduced PM2.5 concentrations. For instance, Kazemzadeh and Koengkan
52
examined the impact of GTI on energy intensity and fossil fuel usage, assessing its role in lowering PM2.5 levels across European nations. Similarly, Chien and Sadiq
53
examined the short- and long-term negative and significant implications of eco-innovation on PM2.5 emissions. UAs typically have a concentration of financial, human, and technological resources, which can accelerate the pace of R&D in GTI.
54
Liu and Zhao
55
claimed that the industrial clusters formed by urban development enhance the effectiveness of green innovation locally. Hu and Xu
10
argued that UAs significantly promote firm green innovation, with green finance serving as a key mediating mechanism. Moreover, as the center of substantial population concentration and a surge in transportation demand, UAs often attract more environmental regulatory attention.
56
Market entities in UAs are expected to encourage the adoption of green technology to adhere to government rules.
57
The higher population density and increased awareness of environmental issues among UAs’ residents also drive the market demand for cleaner, greener products and public services.
58
This, in turn, spurs GTI to meet these demands.
59
Built upon the preceding analysis, the research proposes the third assumption.
Green technology innovation, PM2.5, and industrial agglomeration
Various phases of UAs’ development correspond to varying degrees of industrial agglomeration. This varied level of industrial agglomerations may impact the effectiveness of GTI in mitigating PM2.5 concentrations. Porter's theory suggests that industrial agglomerations have significant technology and knowledge spillover effects, leading to enhanced division of labor and resource sharing across firms within the agglomerations.60,61 Firms can obtain technological innovation knowledge from industrial agglomerations in a targeted manner, which correspondingly reduces the difficulty of searching for original innovations and improves technological innovation efficiency.
62
On the other hand, industrial agglomerations decrease pollution control costs per unit of production value by benefiting from economies of scale and enhancing the marginal impact, leading to a more efficient reduction of pollution.
63
According to the analysis provided, this research puts out the fourth hypothesis.
The heterogeneity of geographical locations and urbanization levels
Because of variations in natural circumstances and development levels in various regions, the efficacy of UAs in mitigating PM2.5 is likely to yield heterogeneous outcomes. First, various areas have distinct economic models, and the level of PM2.5 pollution shows substantial differences across locations.
64
For instance, regions heavily dependent on heavy industry may face more substantial challenges in PM2.5 mitigation than those with a service-based economy.
22
Given that there are three UAs within the YREB, which are geographically dispersed across different regions of China—the east, center, and west regions. Specifically, there is a considerable variation among these three UAs, such as local climate, economic conditions, technological development, and population demographics. As a result, UAs’ effectiveness in reducing PM2.5 is likely to exhibit a certain degree of heterogeneity. Second, areas with higher levels of urbanization are often characterized by more educated populations and more technologically advanced industries, which may have implications for the effectiveness of UAs.
65
In areas with lower levels of urbanization, the government might prioritize economic growth and wealth accumulation over addressing the health effects of PM2.5 pollution. Built upon the analysis above, this research paper posits the fifth hypothesis.
Thus, to test the hypotheses, this article treats UAs’ construction as a quasi-natural experimental policy and utilizes the DID approach to assess whether UAs’ construction has a decreasing effect on PM2.5 and its potential mechanisms as well as heterogeneous contexts.
In summary, the theoretical analysis presented above forms the basis for a research framework, illustrated in Figure 1.

The research framework of the study.
Data and methods
Data sources
This research focuses on cities within the YREB (geographical distribution displayed in Figure 2), spanning the period from 2002 to 2021. This region is notable due to its prominence in the construction of UAs, which include three specific areas: the Yangtze River Delta (YRD-UA), the Middle Reaches of the Yangtze River (MRYR-UA), and the Cheng-Yu (CY-UA) UAs. Additionally, the YREB includes 11 provinces and municipalities, namely Jiangsu, Shanghai, Zhejiang, Anhui, Jiangxi, Hubei, Hunan, Sichuan, Chongqing, Guizhou, and Yunnan. The regions include diverse urbanization degrees, ranging from highly industrialized areas to developing cities. This diversity allows for a thorough examination of how UAs’ impact on PM2.5 varies across different UAs and urbanization levels. The data used in this paper spans from 2002 to 2021 primarily because the statistical yearbooks at various levels in China, which serve as the main data source, have several notable characteristics. First, earlier statistical yearbooks differ from the most recent ones in terms of the statistical indicator system, resulting in missing data for some indicators. Second, the publication times of statistical yearbooks across various levels in China are not uniform and are relatively delayed compared to the research period, leading to incomplete data for certain indicators. Therefore, to ensure the accuracy of the findings, the study’ s time span was set from 2002 to 2021 since most indicators included in this study had complete data available from that year.
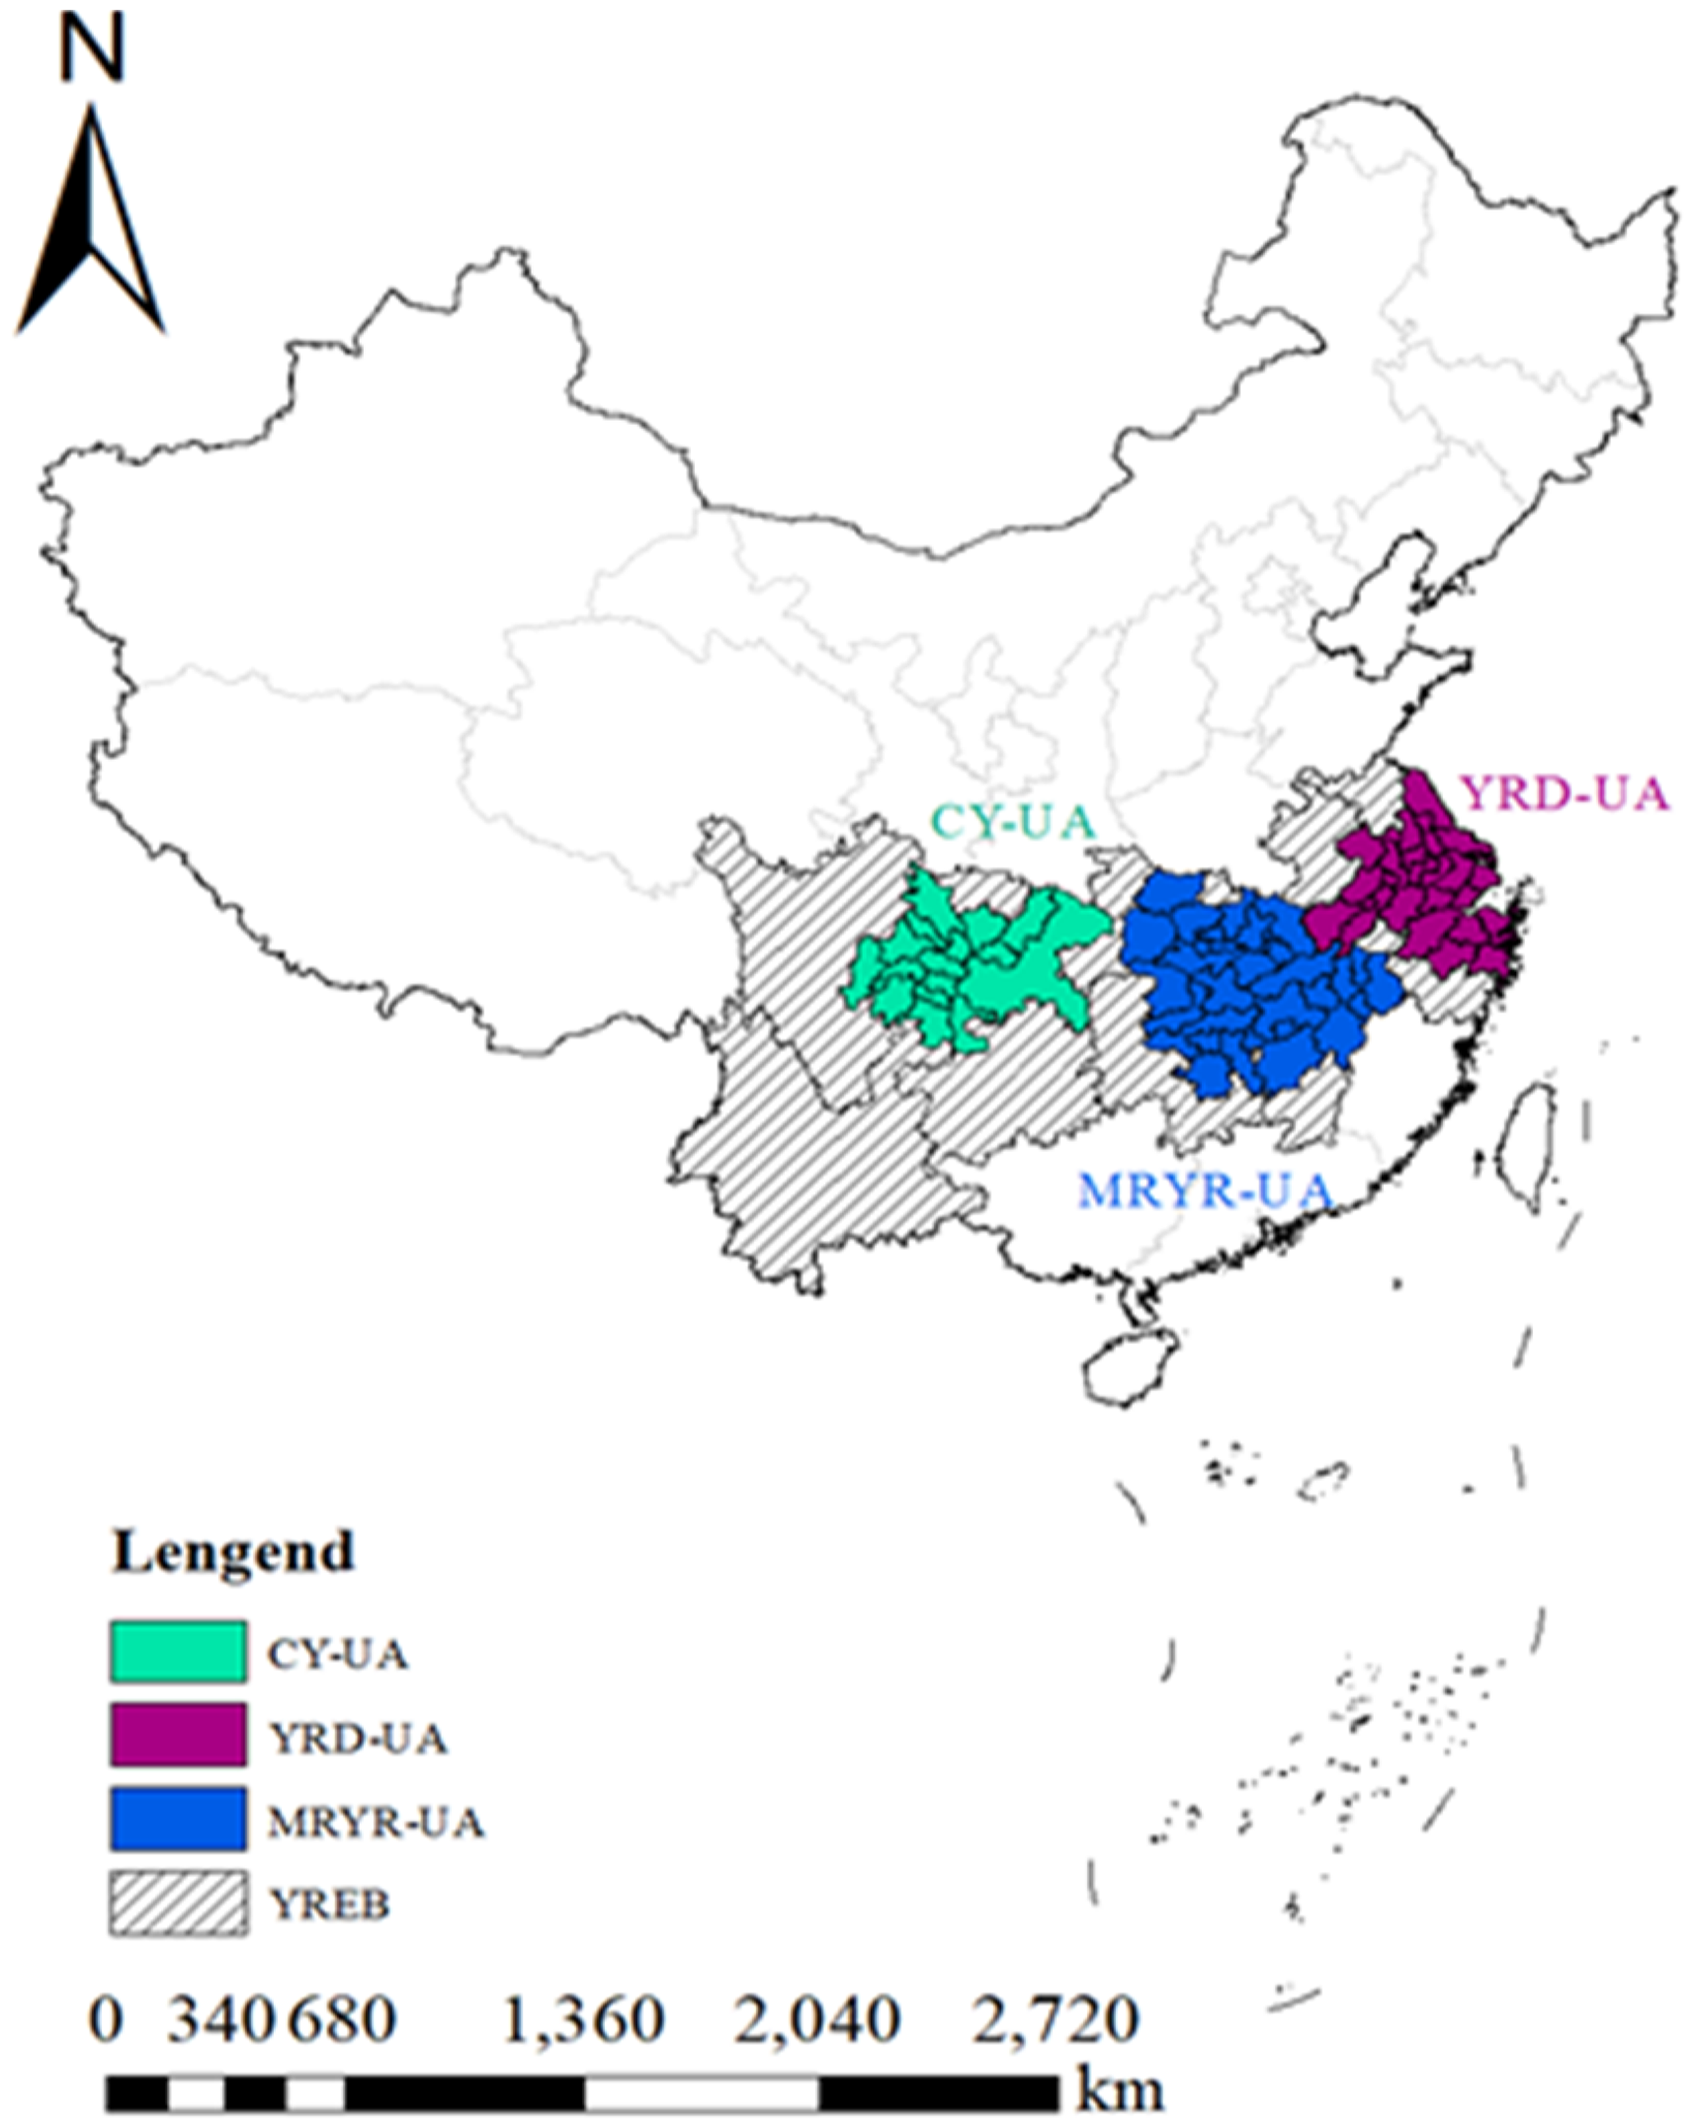
The geographical distribution of the YREB.
The procedures for data collection and processing are outlined as follows. First, we collected annual PM2.5 data from 2000 to 2019, derived from the Socioeconomic Data and Applications Center at Columbia University. a Second, this research employed the China City Statistical Yearbook to obtain city-level metrics like per capita gross domestic product (GDP), levels of foreign direct investment (FDI), and total social consumption, with data available from 2002 to 2021. Third, to tackle the challenge of missing values for certain cities during particular years, we supplemented our dataset through data from the Provincial Statistical Yearbook and Prefecture-level City Statistical Yearbook. Fourth, we ignored all other cities and focused only on those that are part of the YREB. The PM2.5 data and city-level indicators were merged based on city names and years. We utilized the linear interpolation method to address gaps in PM2.5 data from 2019 to 2021, creating a comprehensive city-year panel dataset covering the years 2002 to 2021.
Variable settings
The dependent variable measured in this study is the annual average concentration of PM2.5, expressed in micrograms per cubic meter (μg/m3).
The independent variable, denoted as D, refers to the construction of UAs and assesses the difference in how UAs influence PM2.5 levels between cities identified as UAs and those classified as non-UAs. UAs in China are constructed under government regulation and guidance, with an unclear policy review timeframe. Since firms cannot predict what time, under what circumstances, and to what extent they will be affected by UAs, this scenario can be characterized as a quasi-natural experiment. 39 If a city is designated as part of an UA, a value of 1 is assigned to D during the year the policy takes effect and in the years that follow; if not, D is assigned a value of 0. The dataset is split into two groups: the non-UAs group, consisting of 41 cities and the UAs group, which includes 69 cities.
The mediating variable is represented by the logarithmic of green technology innovation (lnGTI). GTI can significantly elevate energy productivity and decrease PM2.5 emissions at the origin. 66 The measurement of GTI is built upon three dimensions: innovation output (measured through the count of green granted invention patents within cities), human capital investment (expressed by the population of secondary industries), and R&D investment (measured through scientific and technological financial outlays). The principal component analysis (PCA) integrates numerous dimensions to provide a comprehensive assessment system that encompasses various indicators to depict the current state of green technology advancement.67,68
The moderating variable is industrial agglomeration (IND), which may moderate the connection of firm green innovation with PM2.5. IND positively impacts industrial competitiveness, resource allocation, and technological innovation by leveraging scale economy and knowledge spillover. 69 Some scholars have argued that IND may help reduce environmental harm by encouraging the development of eco-friendly technologies. 70 In this study, IND is defined as the location entropy of the number of industrial firms exceeding the industrial scale, relative to the total administrative area of the city.
Another moderating variable, urbanization rate (UR), represents a city’ s advancement in the urbanization process, which is associated with increased PM2.5 emissions. 71 Some scholars have argued that urbanization may help reduce environmental deterioration by encouraging ecological legislation, raising public environmental awareness, and implementing sustainable technology. 23 Heterogeneous effects may occur at varying levels of urbanization. For the purpose of this study, urbanization is quantified as the ratio of the urban population to the total population.
In addition, this article incorporates multiple control variables. (a) Economic development (lnPGDP) has been selected as a control factor since rapid growth development could have led to several pollution problems, 72 which is determined by taking the logarithm of per capita GDP. (b) FDI is quantified by its proportionate share in GDP. Multinational firms often transfer investments in resource-intensive, high polluting operations to nations with less stringent environmental regulations, resulting in environmental degradation in the host nation. 73 (c) Population size (lnPS) is represented as the logarithmic value of the year-end total population. Population expansion results in more demand for energy-intensive goods, housing, and vehicles, thereby causing elevated levels of PM2. 34 (d) Road density (lnRD), represented by the logarithmic transformation of road area per capita, serves as an indicator of road infrastructure prominence. (e) Energy intensity (lnEI) is the logarithmic value of societal electricity consumption that describes the PM2.5 impact of energy intensity. 74 (f) Physical capital (lnK), reflected by the logarithmic value of a fixed asset investment. Physical capital and labor working together may enhance production efficiency and impact economic growth. 75 (g) Fiscal expenditure intensity (FEI). The intensity of input capital within a city describes the rate of public fiscal expending to public general fiscal revenues. (h) Market size (lnM), is indicated by the logarithmic value of total retail sales for consumer goods, showcasing the connection between market growth and economic concentration. 76
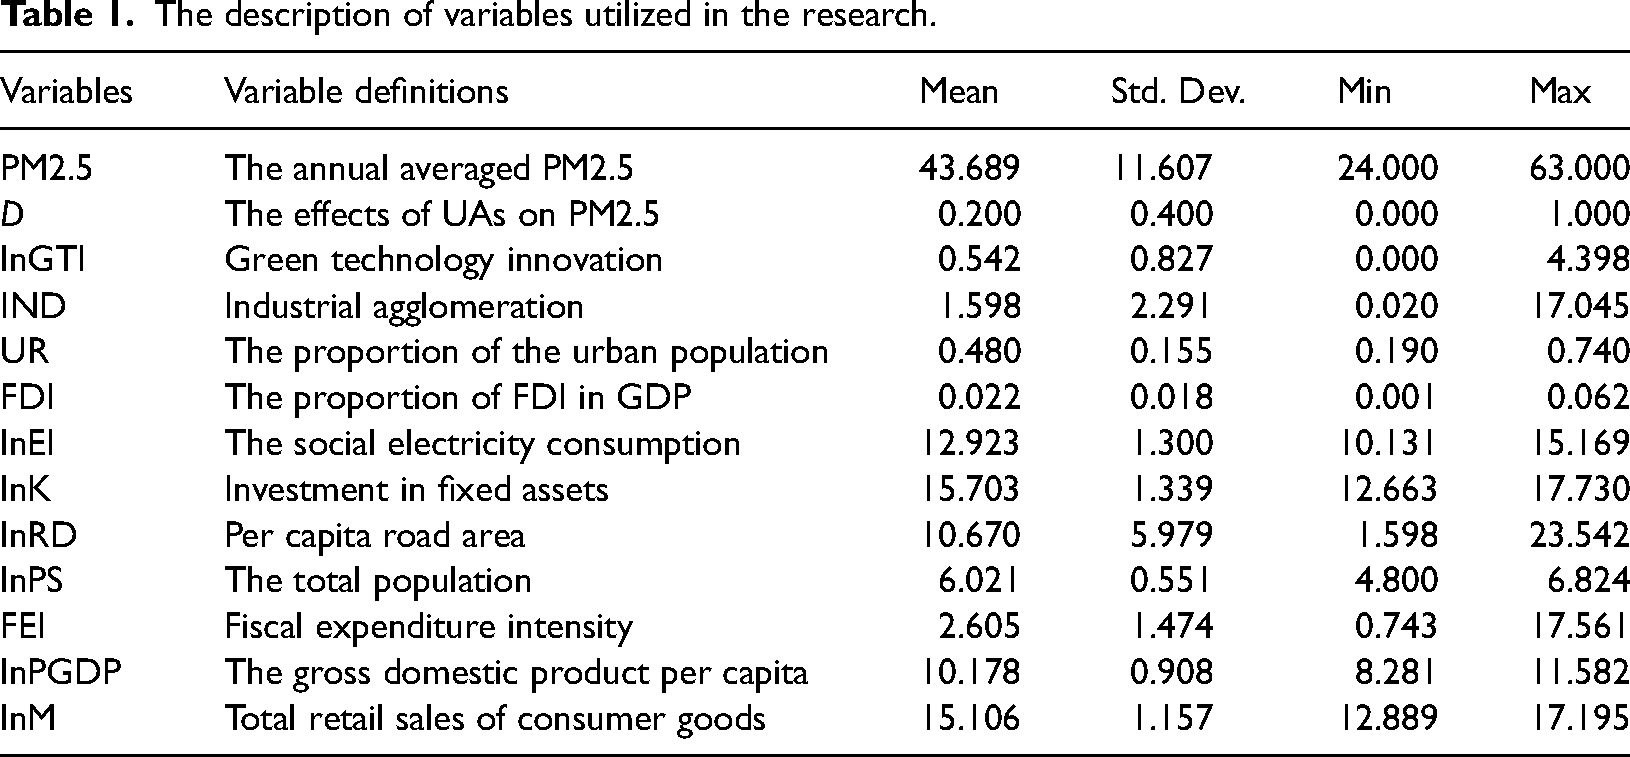
Table 1 provides a comprehensive overview of the variables under consideration. To enhance data stability and address potential heteroscedasticity concerns, a log-transformation procedure was applied to certain variables within this study. 77 In addition, linear interpolation methods are used to correct for missing data.
The description of variables utilized in the research.
Methods
This study conducts an empirical analysis using a time-varying DID method. The DID method is advantageous because it allows for a direct examination of a policy’ s causal inference and linearity effectiveness while also helping to reduce endogeneity to some degree.78,79 The subsequent analysis is based on a baseline model defined as follows:
In addition, the research uses the PCA approach to calculate 

Then, the research calculates the 


This article leverages the method of location entropy to calculate mediating variable IND,
80
as shown in Equation 7.
Subsequently, to test whether the indirect effect depends on IND, this article utilizes a structural equation model for regression analysis, as shown in Equations (8) and (9).

To explore the heterogeneity effects of urbanization levels, this study adds the urbanization rate (UR) and its interaction term with the dependent variable (D) for analysis.
The coefficient
To investigate the spatial extent of the influence exerted by the UAs, this research utilizes a multi-step approach to quantify the distance variable. Initially, the distance separating the non-central city from the central city within the UAs is determined utilizing Equation (11).
Next, based on the Chinese State Council’s delineation, YRD-UA is classified as a single-center, characterized by one dominant core city driving its development. In contrast, other UAs are categorized as multi-center systems featuring multiple interconnected core cities. For polycentric UAs, this study compares the distances from non-central cities to each center utilizing Equation (12) and subsequently determines the minimum as the distance value.
15


Results and discussion
The results of baseline regression analysis
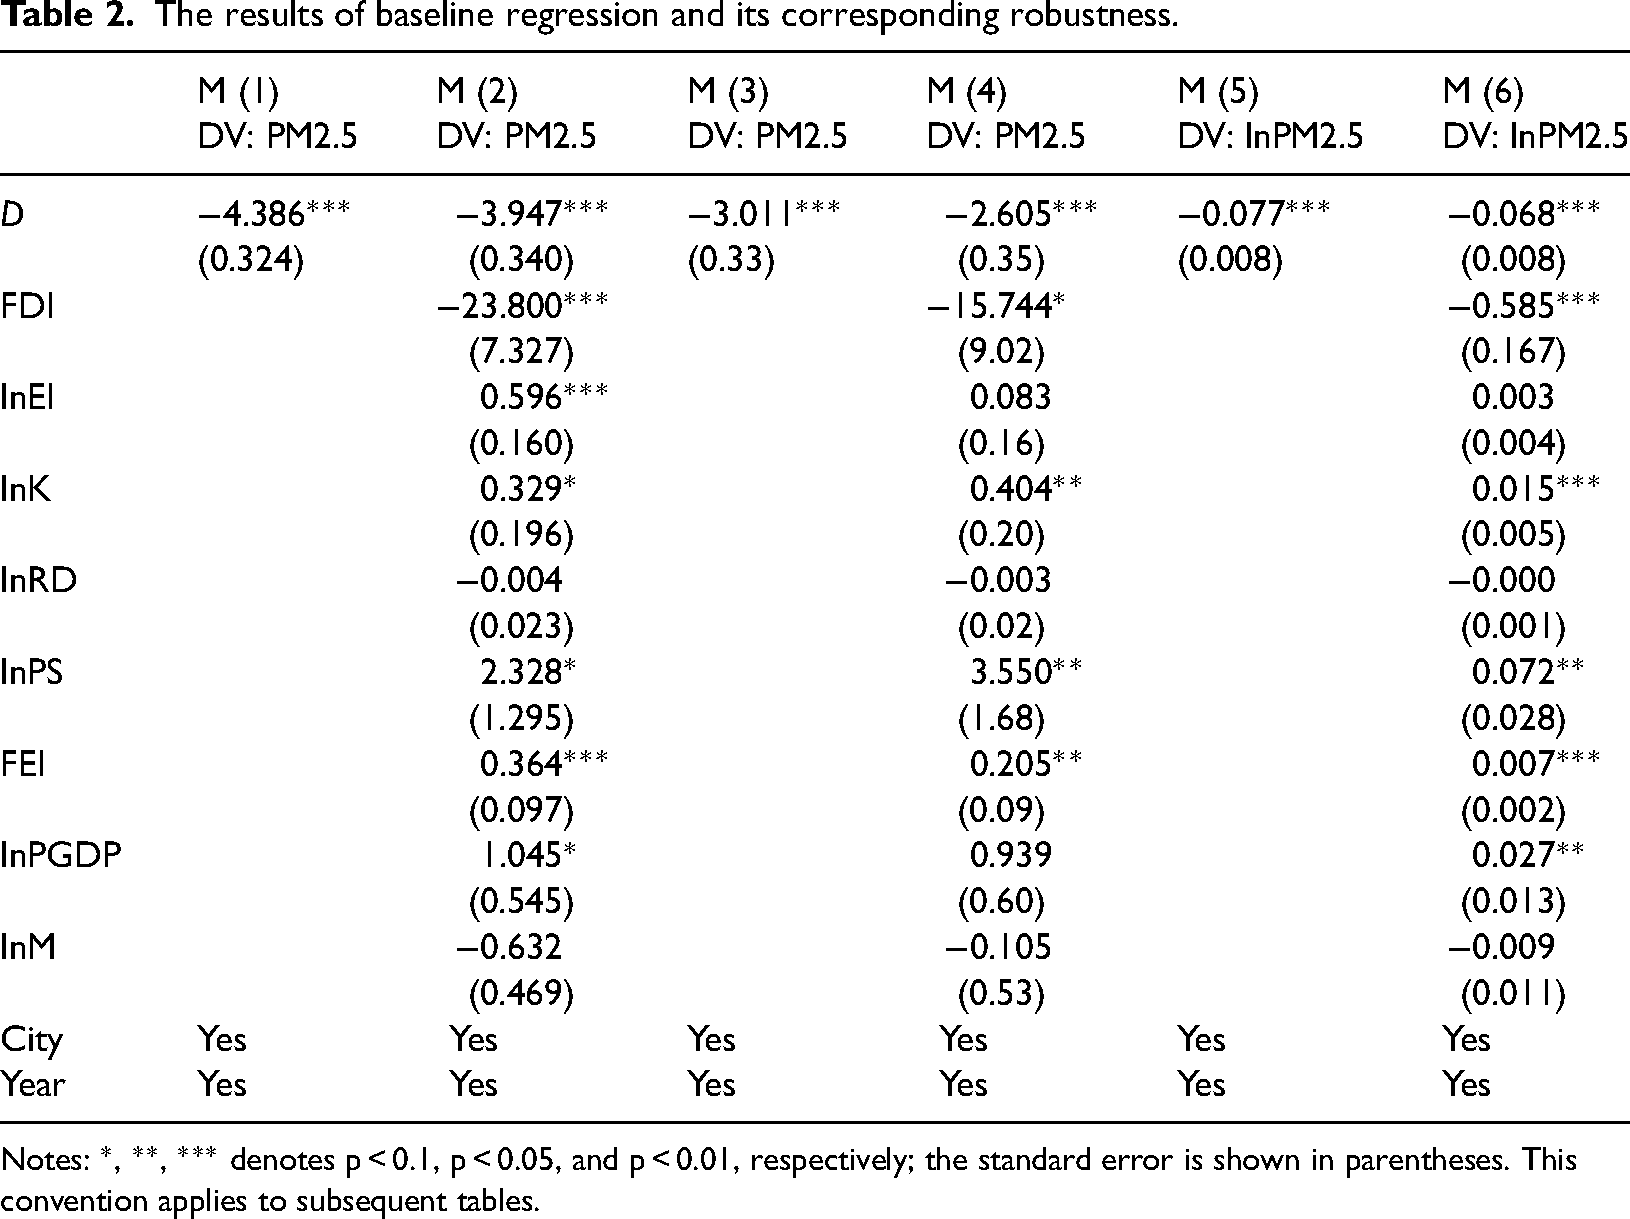
This research examined how UAs in the YREB impact PM2.5 by utilizing the time-varying DID approach. The findings are displayed in Table 2, where M (1) denotes the outcome excluding control variables, as well as M (2) denotes the regression outcome including control variables. In addition, the robustness test of baseline analysis is assessed by changing the regression method or the dependent variable. Considering that cities with high PM2.5 pollution may be more affected by urban population policies, we selected samples of cities with PM2.5 levels below the 75th percentile for the robustness test, as shown in Models (3) and (4). Additionally, Models (5) and (6) are presented with an alternative analysis, wherein the dependent variable is transformed to the natural logarithm of PM2.5 (lnPM2.5).
The results of baseline regression and its corresponding robustness.
Notes: *, **, *** denotes p < 0.1, p < 0.05, and p < 0.01, respectively; the standard error is shown in parentheses. This convention applies to subsequent tables.
As displayed in Table 2, the results indicate the coefficients associated with D maintain consistently significant negative relationships at the 1% significance level across Models (1) and (2). Therefore, Hypothesis 1 was supported, which indicates that UAs can remarkably reduce PM2.5. This contradicts the findings of Wang and Liang. 35 It may be because the Chinese government’ s focus on environmental preservation and air quality improvement has led to the implementation of laws promoting greening and low-carbonization of urban structures, thus resulting in reduced PM2.5 emissions. The analysis of control variables indicates a positive correlation of PM2.5 with energy consumption, physical capital, population size, economic development level, and government spending intensity. This indicates that the increase in the variables mentioned above will result in an increase in PM2.5.81,82 However, the coefficient of FDI is remarkably negative. This could be because FDI can improve environmental quality by adopting new industrial technology and pollution control measures.83,84 In addition, road density and market size have no significant effect on PM2.5.
Furthermore, all coefficients of D in M (3)–M (6) are remarkably negative. This demonstrates that the baseline regression has passed the robustness test through altering variables, thereby validating that UAs can contribute to reducing PM2.5. This discovery supports the theories proposed by Jiang and Jiang 39 and Gong and Li 85 that UAs, as a predominant form of regional development, significantly contribute to maintaining urban environmental standards and the safeguarding of public health.
The analysis of parallel trends and placebo test
The effectiveness of the DID method hinges on the assumption of parallel trends. 64 Thus, this research provides data for three years before and after the construction of UAs, and the base year was chosen as the year before construction (pre_1) by leaving out the dummy variable for that year from the estimation. As illustrated in Figure 3, the values for the timeframe prior to the intervention do not differ substantially from zero, indicating that the treatment group and control group exhibited a common trend in PM2.5 reduction prior to the intervention. In contrast, a significant and notable decrease is observable in the post-intervention period. Consequently, the initial regression satisfactorily fulfills the parallel trends requirements.
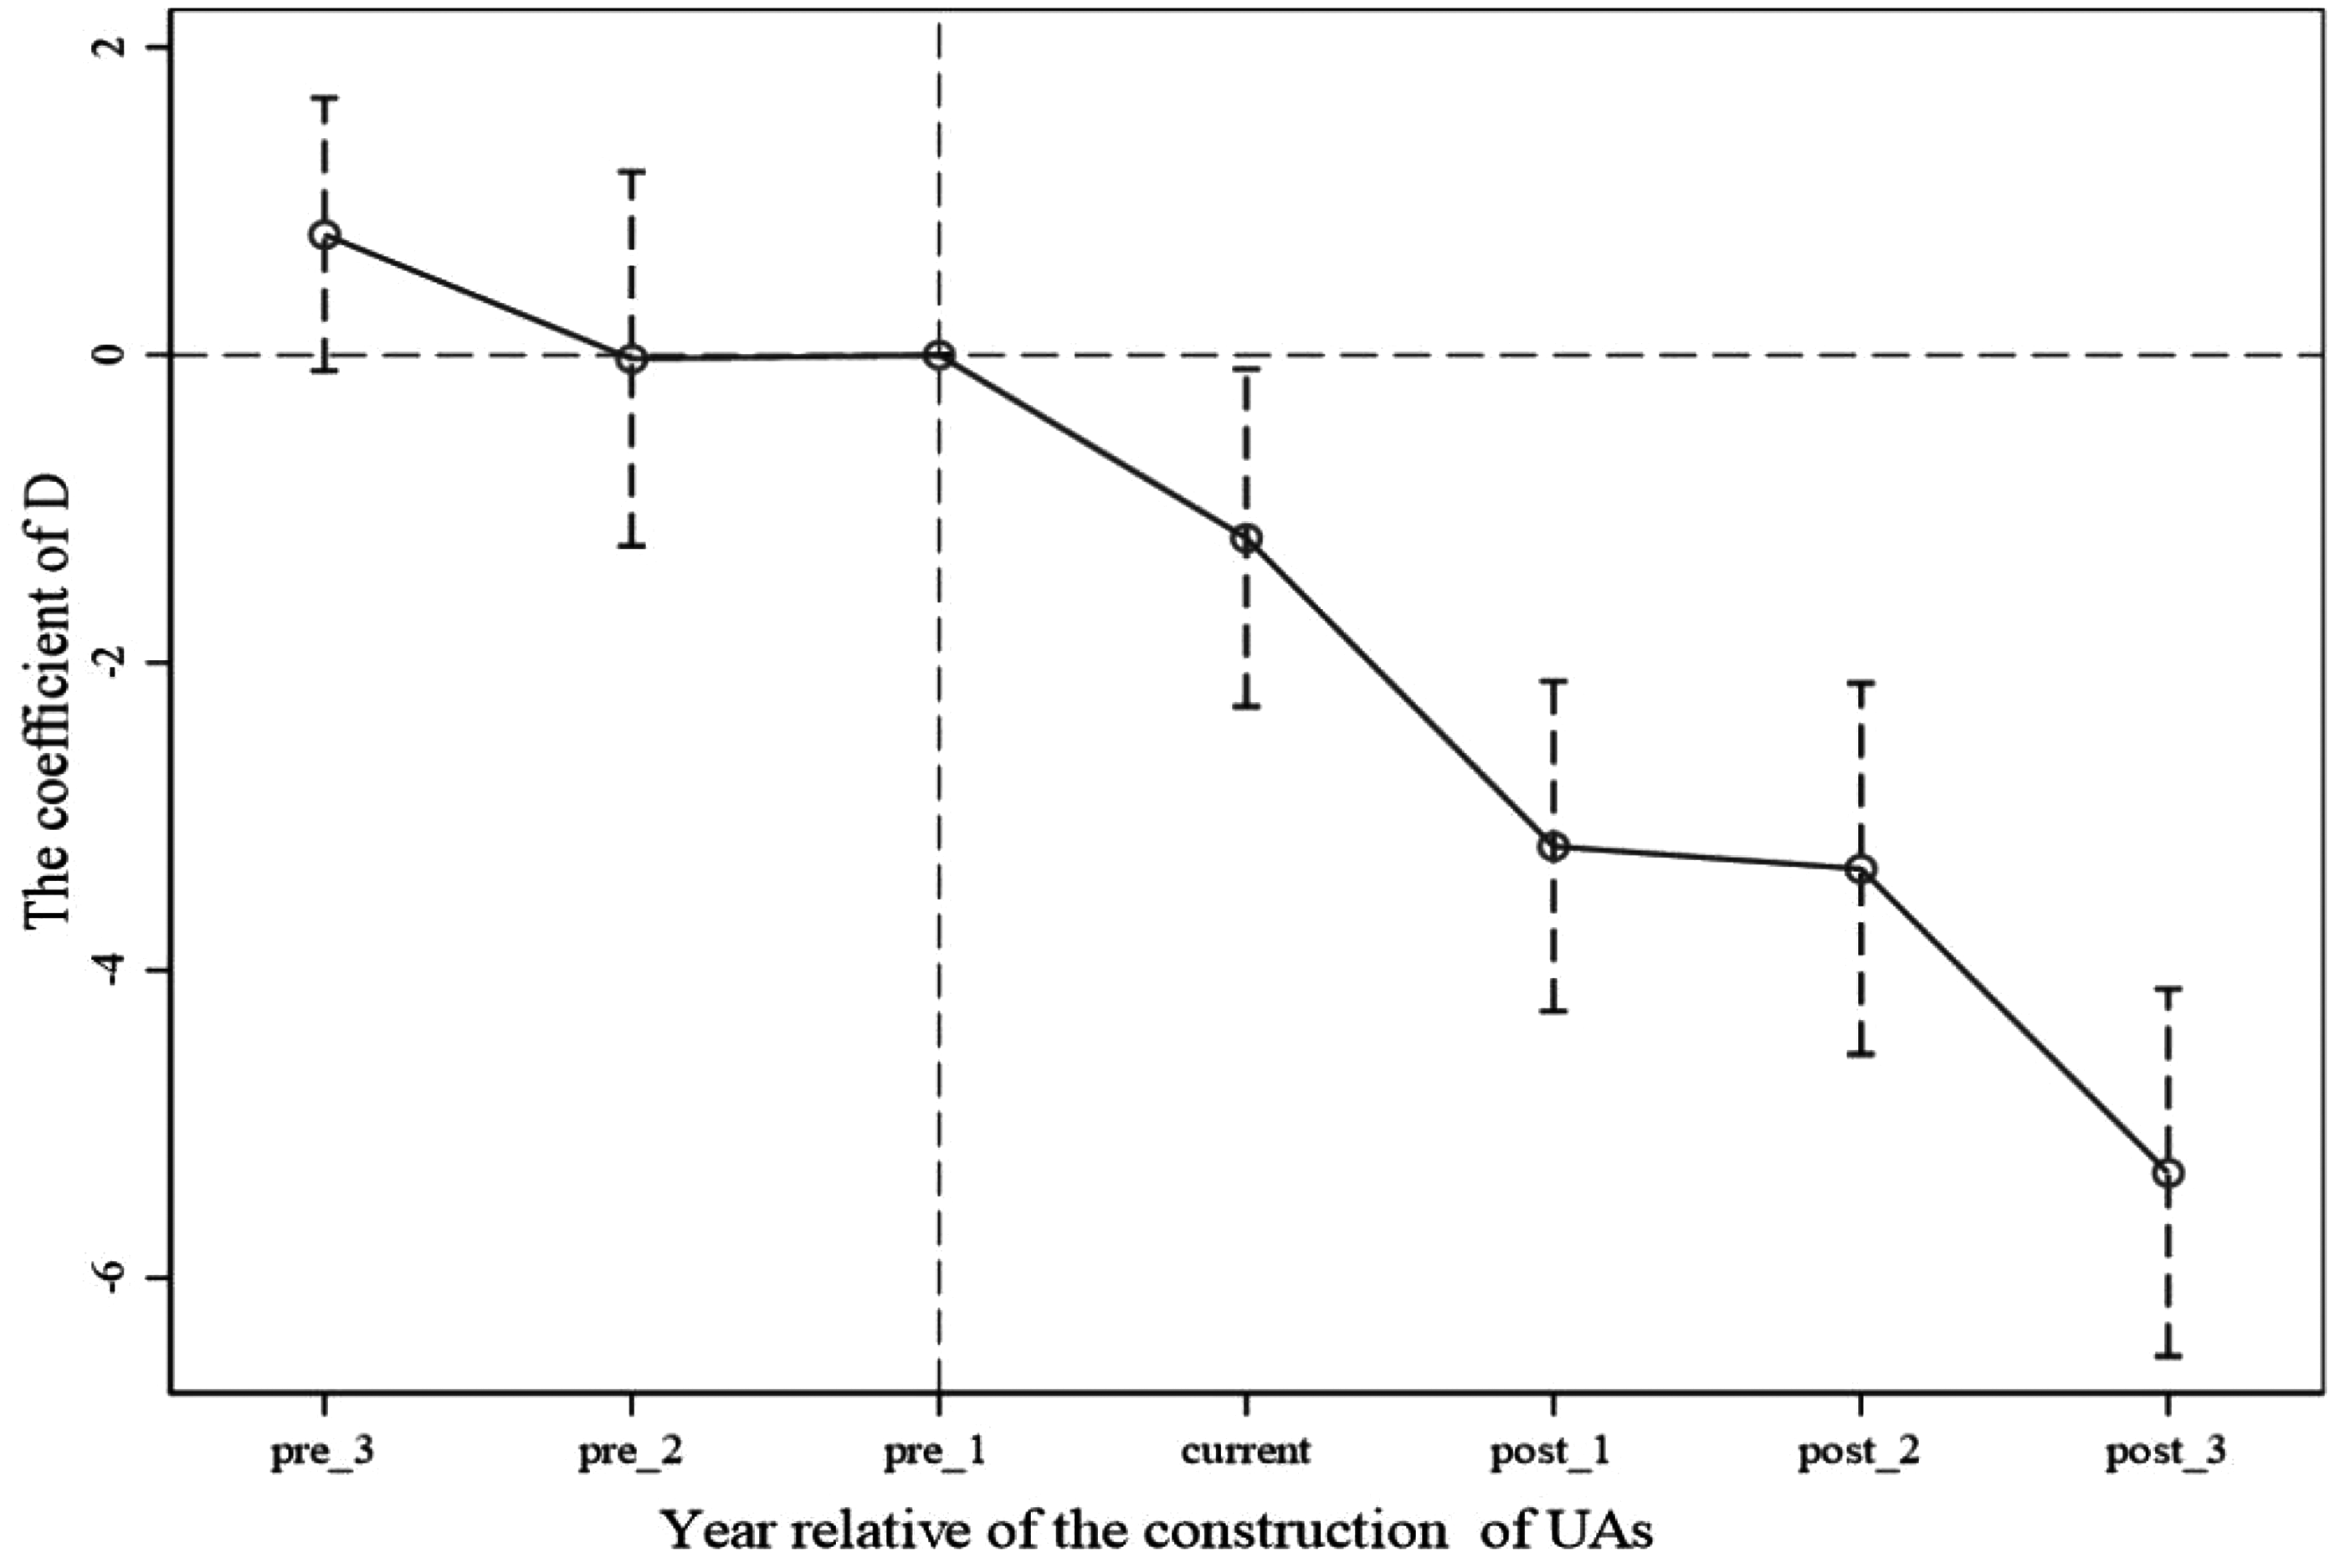
The illustration of parallel trends test.
In addition, this research implements a placebo test, as per the procedure outlined by Hu and Xu, 15 to ensure that the results from the baseline regression are not impacted by other policy interventions or stochastic factors. In the placebo test, we excluded the year of UAs’ constructions and subsequent years. Furthermore, we uniformly advanced the policy implementation year by three years. A non-significantly negative value for D implies that UAs have a role in reducing PM2.5, independent of other policy interventions or random factors. Table 3 displays regression results for the baseline model with the whole sample (M1 and M2), changes in sample size (M3 and M4), and alterations in dependent variables (M5 and M6). Across all models, the D coefficient does not have statistically remarkably negative values even following accounting for policy timing adjustments, suggesting that the placebo test was successful and UAs can decrease PM2.5 levels.
The results of placebo test.

The analysis of spatial scope regarding the effect of PM2.5 reduction
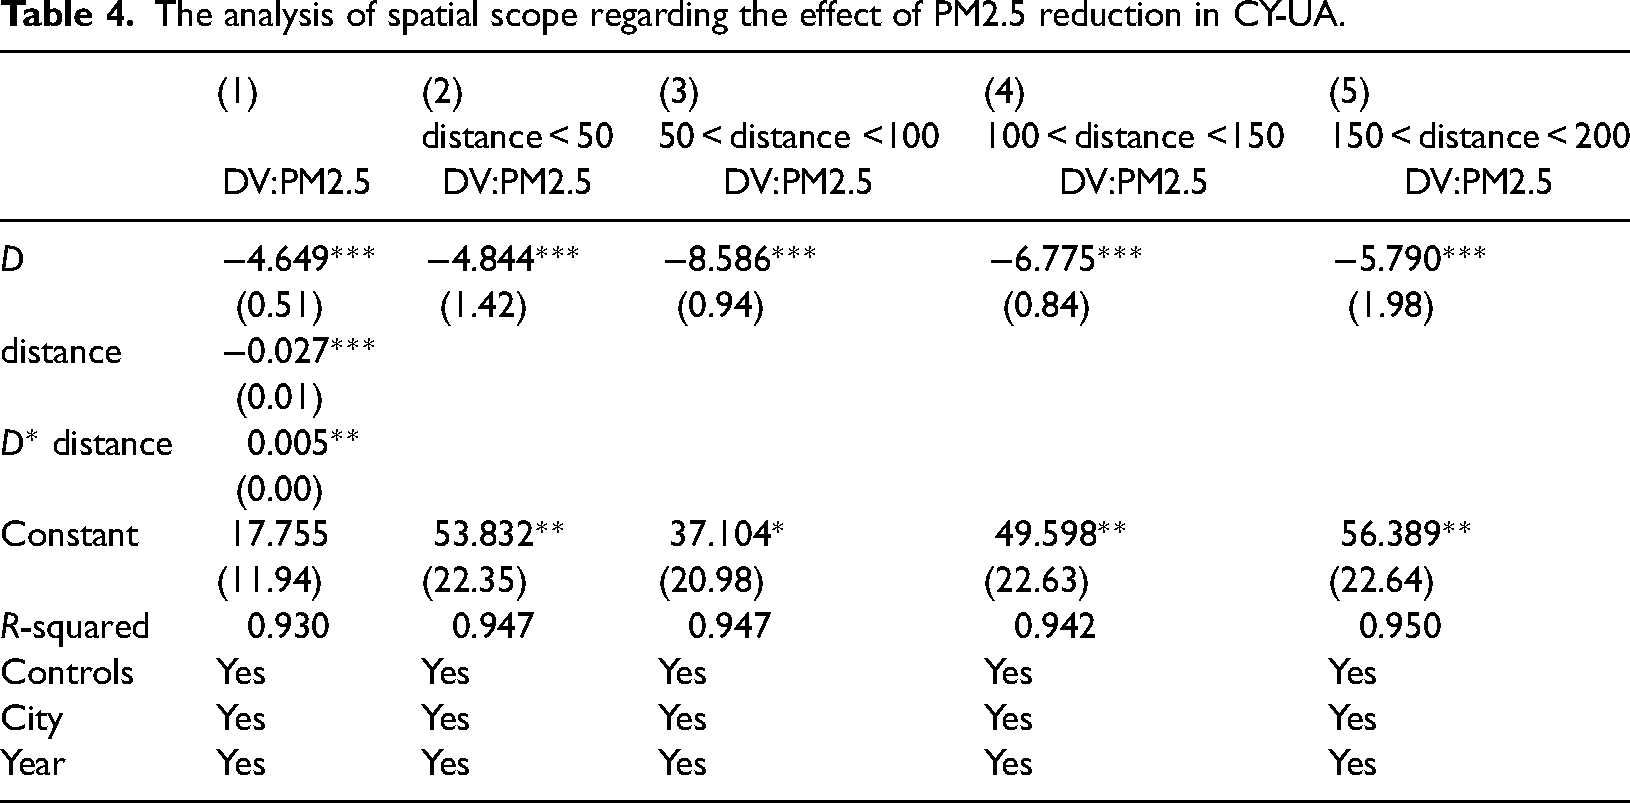
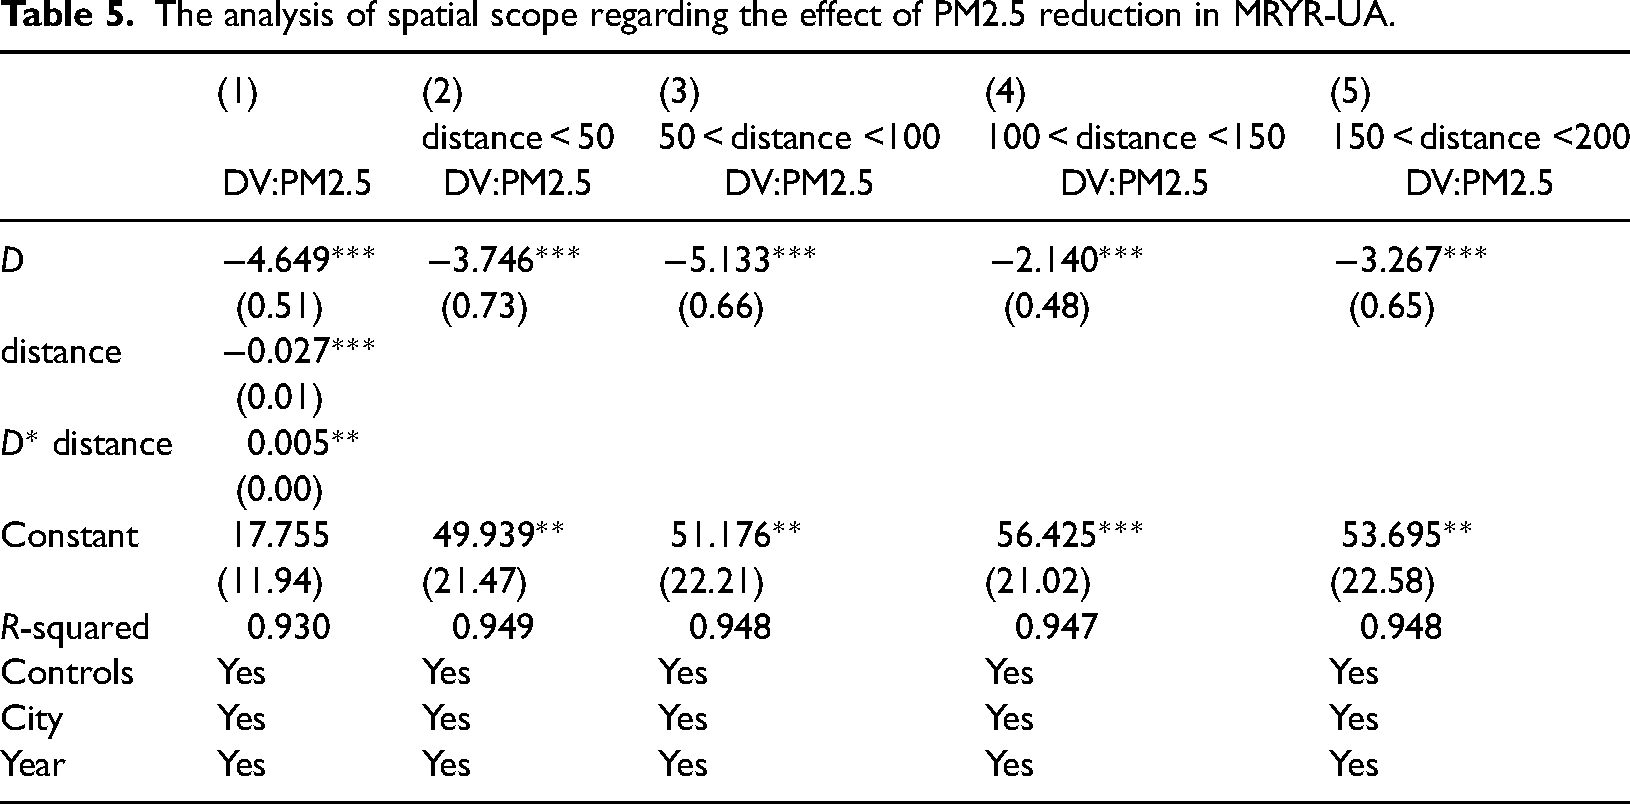
This section investigates how effective UAs are at reducing PM2.5 as the distance increases, with a particular focus on exploring the most effective spatial range for each of the three UAs. Regression analyses for the CY-UA, MRYR-UA, and YRD-UA are detailed in Tables 4, 5, and 6, respectively. Within each table, M (1) presents the full-sample analysis of spatial distance’ s moderating effect on PM2.5 reduction. Subsequent models, M(2) to M(5), show results classified by 50 km intervals, in accordance with the method of Deng and Qi.86
The analysis of spatial scope regarding the effect of PM2.5 reduction in CY-UA.
The analysis of spatial scope regarding the effect of PM2.5 reduction in MRYR-UA.
The analysis of spatial scope regarding the effect of PM2.5 reduction in YRD-UA.
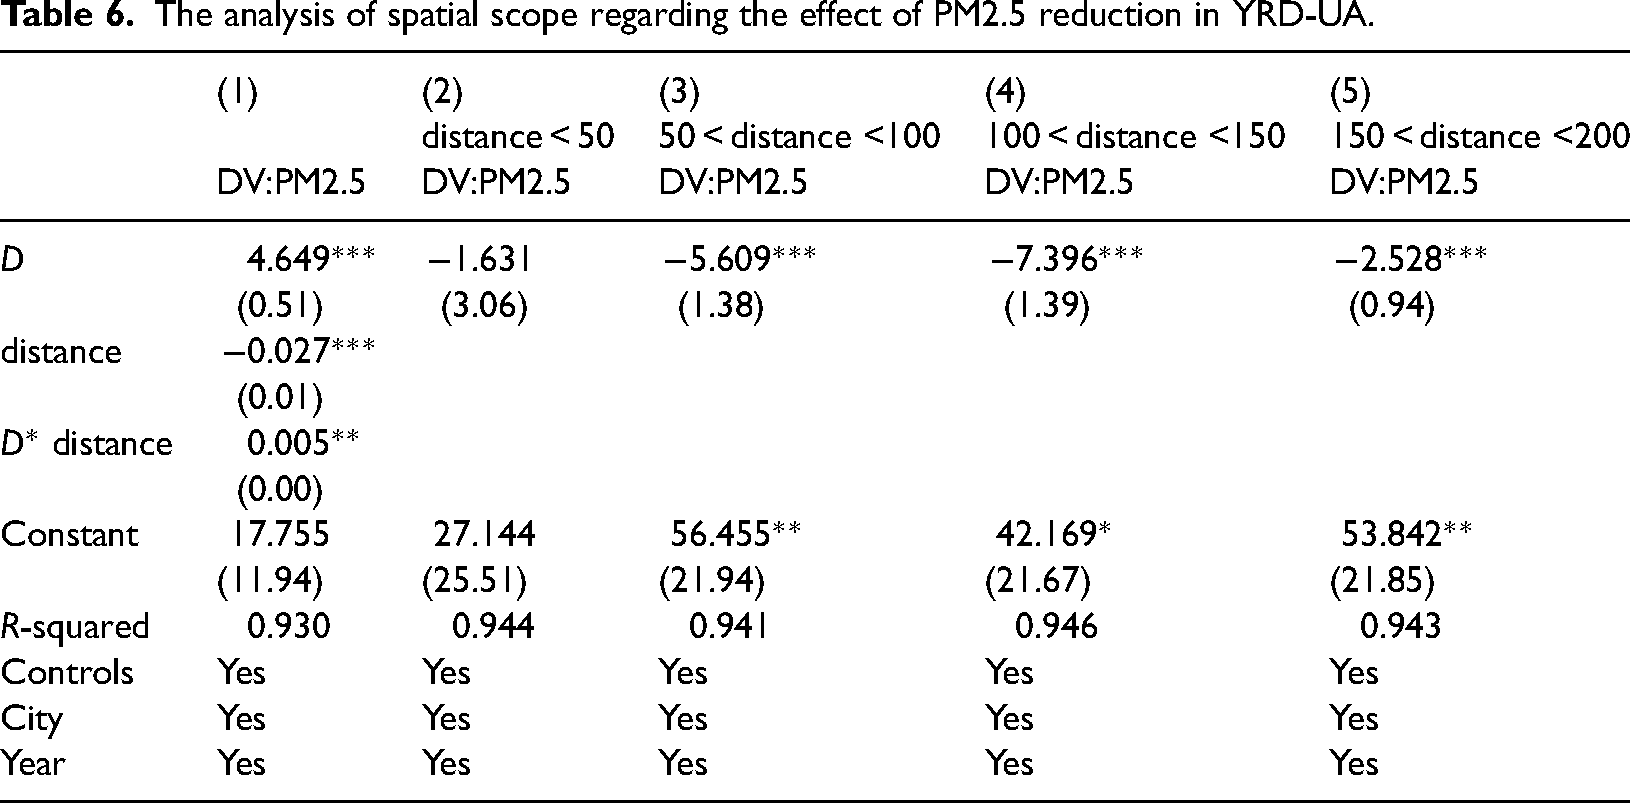
Table 4’ s M (1) indicates a significantly negative coefficient for the interaction term (β= −4.649, p < 0.01). This finding corroborates Hypothesis 2, suggesting the influence of UAs on PM2.5 emissions diminishes as distance increases. A potential explanation involves the economic magnetism of central cities might draw residents from surrounding regions, resulting in population concentration and consequently elevated PM2.5 levels. In contrast, increasing distance from these core zones is typically associated with reduced population density and economic activity, which subsequently mitigates PM2.5 pollution. 28 The coefficients for D in models M (2) through M (5) exhibit a significantly negative value, indicating that the construction of CY-UAs contributes to a reduction in PM2.5 levels. Moreover, in these models, the coefficients for D demonstrate a trend that initially increases before subsequently decreasing. This suggests that UAs have an optimal PM2.5 reduction effect when located between 50 and 100 kilometers from the central city. A possible explanation is that the suburban areas within this distance often have government-established industrial clusters that facilitate centralized pollution management, leading to a more pronounced reduction of PM2.5 within the metropolitan area. 87 As the distance grows, the impact of agglomeration and dispersion from the core city diminishes, leading to a steady drop in the emission reduction benefits of UAs. 88
The values of D in M (2)-M (5) presented in Table 5 show a significant negative correlation and reveal a trend of increase succeeded by a decrease. The optimal range for the impact of MRYR-UA on PM2.5 reduction lies within 50 to 100 km from the central urban area. MRYR-UA and CY-UA display comparable patterns, probably due to their status as rapidly expanding UAs with similar industrial structures and labor divisions. 89
The coefficients of D in M (2) to M (5) concerning YRD-UA, as presented in Table 6, reveals a trend of initially increasing followed by a decrease, which aligns with the patterns observed in CY-UA and MRYR-UA. Nevertheless, the coefficient of D in M (2) shows no significant impact, suggesting that the establishment of YRD-UA within 50 kilometers of the core city does not effectively mitigate PM2.5 emissions. This ineffectiveness may stem from the fact that YRD-UA is likely already in a mature phase of development, with the economic advantages of the central city being significant; this attracts residents from surrounding regions and results in increased PM2.5 levels. 90 The coefficients of D in M (3) to M (5) exhibit significantly negative values, indicating that the most effective range for YRD-UA in reducing PM2.5 emissions lies between 100 and 150 kilometers from the central city. This could be attributed to Shanghai, the central city of YRD-UA and China’ s most economically developed city, striving to develop a Shanghai metropolitan area within a distance of 50 to 80 kilometers, which fosters a more service-oriented industrial development within this circle. 91 It is advisable for heavily polluting firms and industrial clusters to be situated on the peripheries of the metropolitan area, specifically within a distance of 100 to 150 kilometers from the central city. 92
The spatial extent of UAs’ impact on PM2.5 concentrations is illustrated in Figure 4, with examples provided from YRD-UA, MRYD-UA and CY-UA. Notably, the effective range of PM2.5 emission reduction extends beyond the central city’ s boundaries, reaching neighboring cities where the optimal reduction impact is achieved. This phenomenon is likely attributed to the pronounced spillover effects from the central city into these adjacent areas, facilitating enhanced resource allocation through synergistic and driving effects among cities. 93
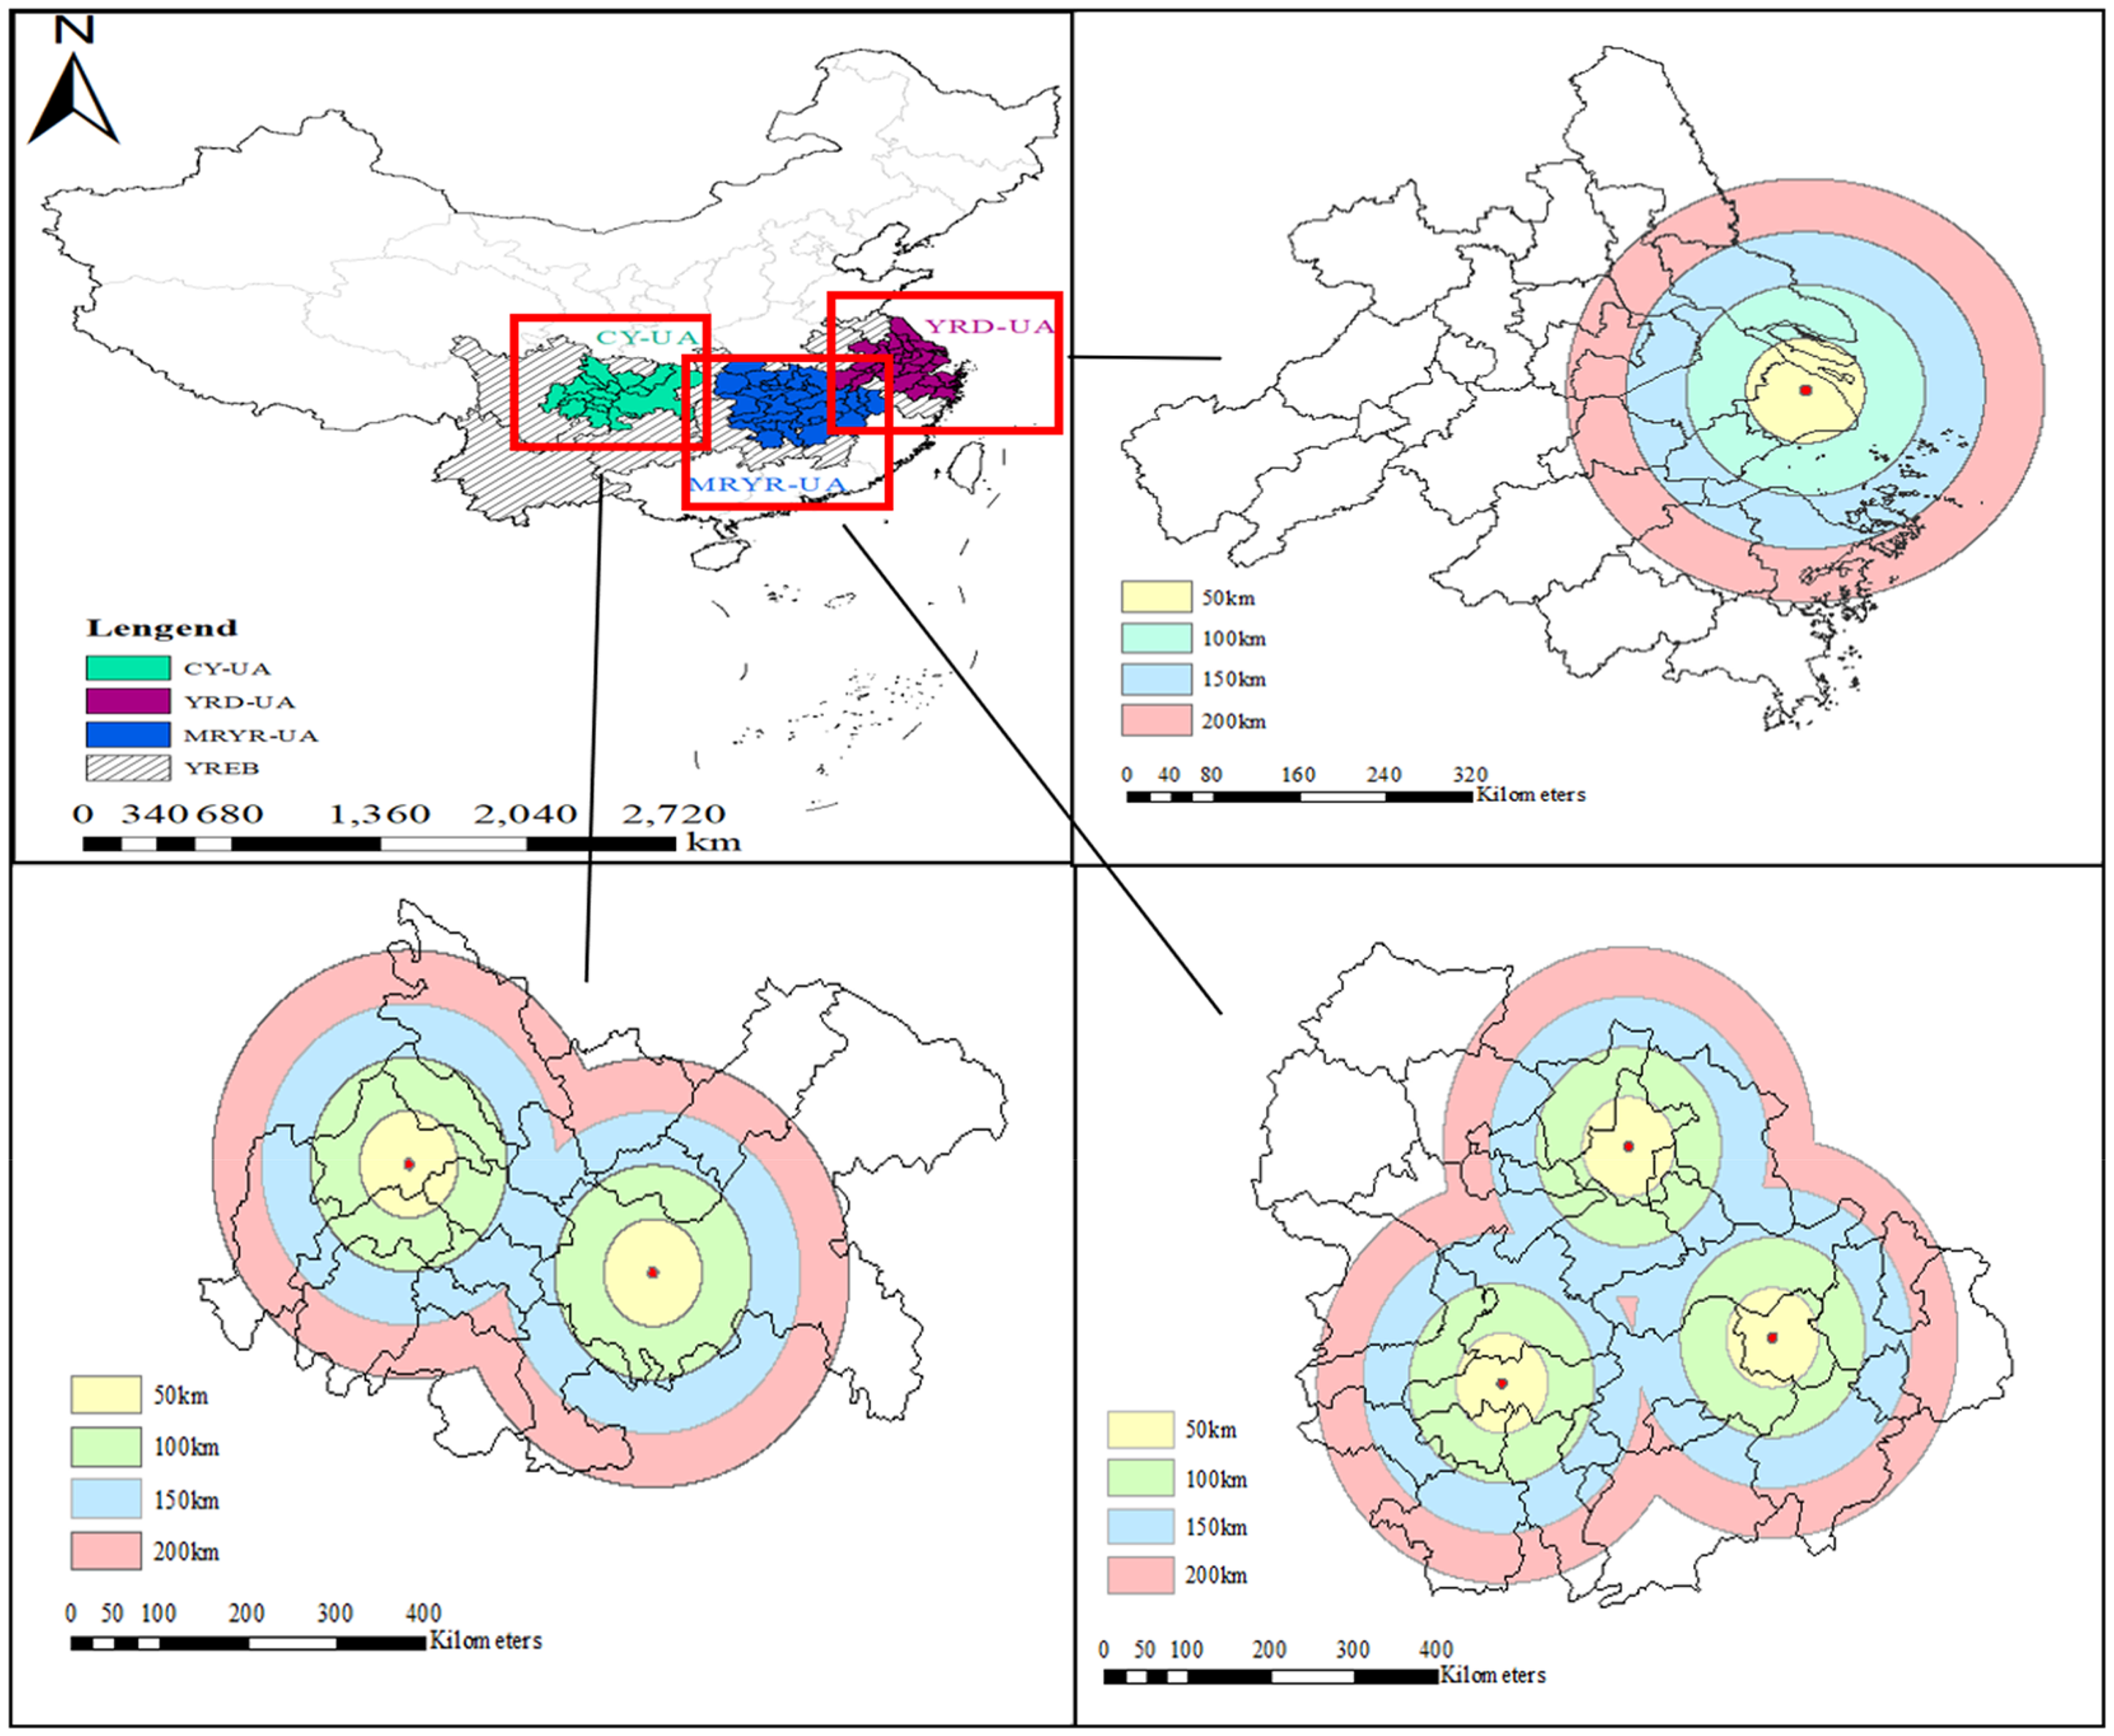
The spatial scope graph of UAs’ impact on PM2.5 levels.
The mediation analysis of green technology innovation
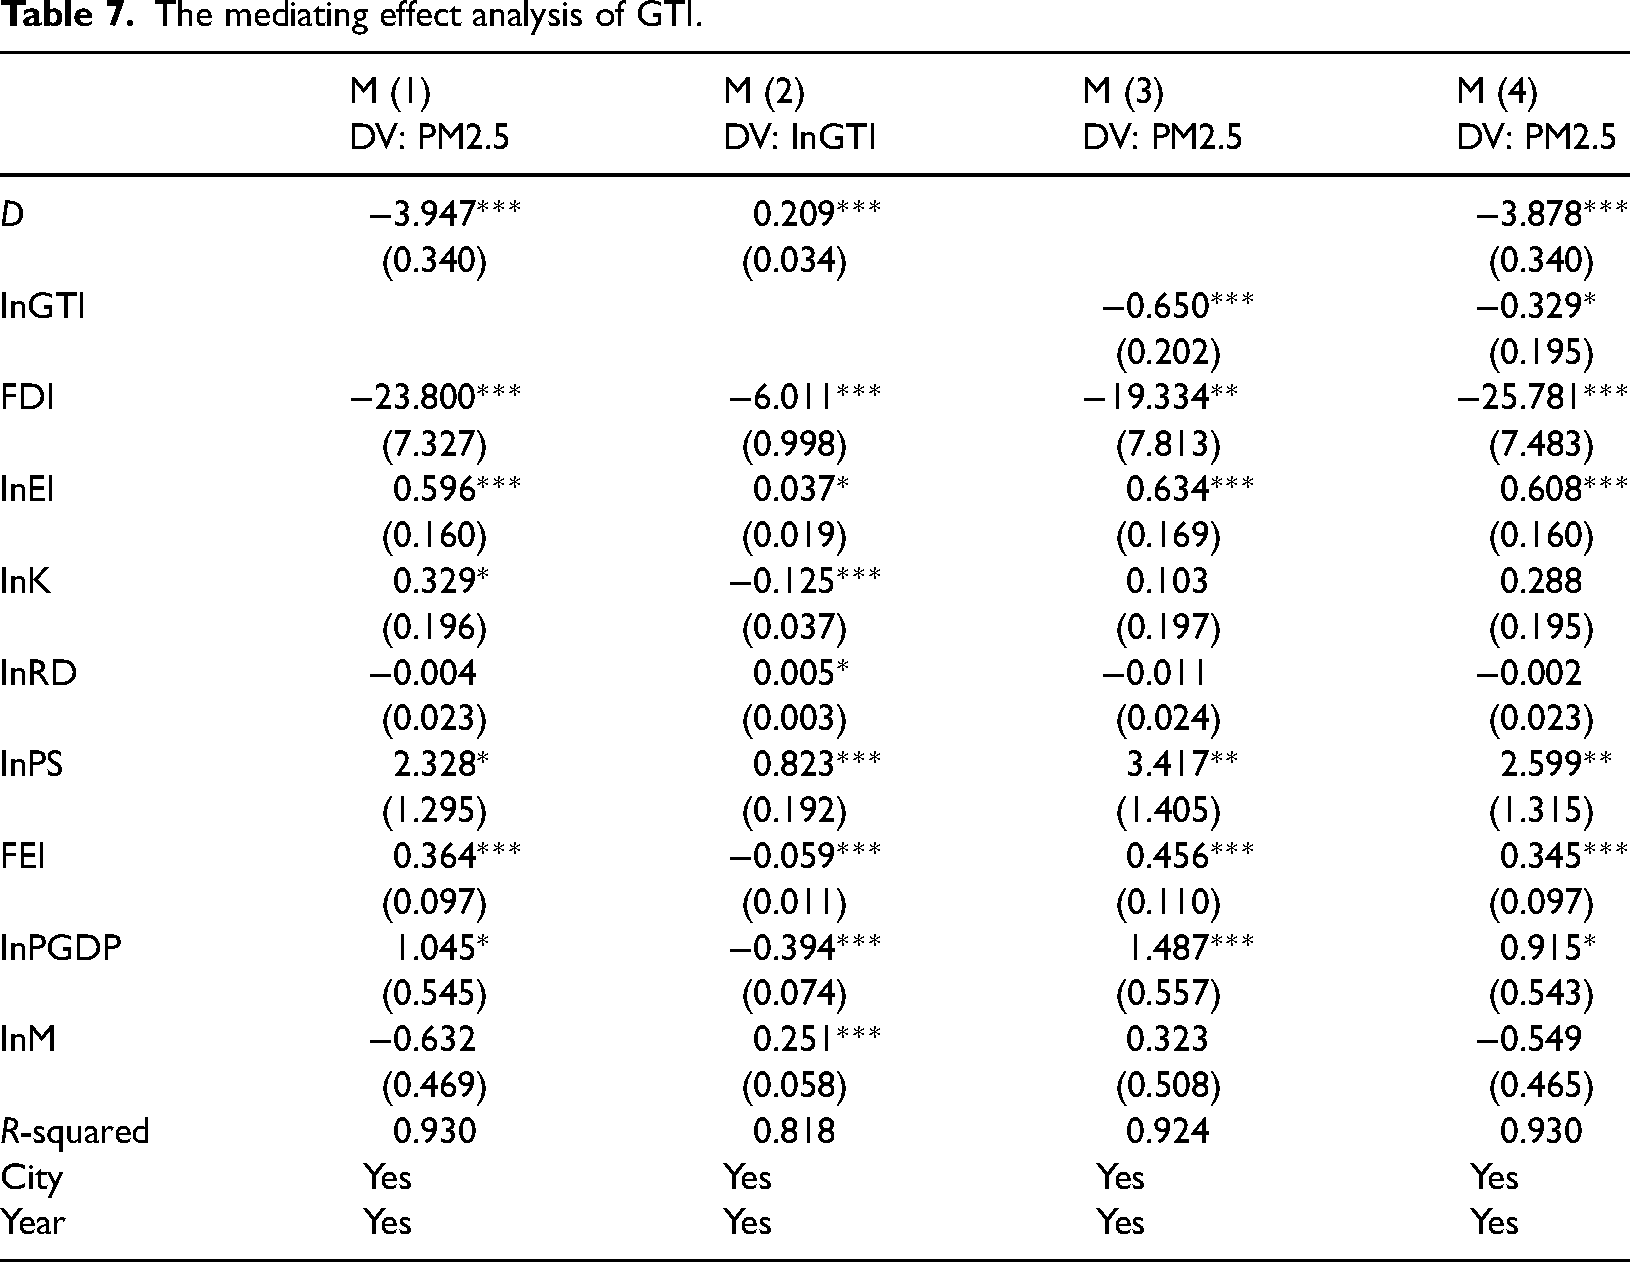
This subsection examines whether GTI serves as a mediator in the relationship between UAs and PM2.5 levels. Table 7 shows that GTI has a partial mediating effect on the connection between UAs and PM2.5. Specifically, the value for D in model M (2) reflects a significant positive value, 0.209, signifying that UAs positively influence GTI. Conversely, in model M (3), the coefficient for GTI is notably negative (β = -0.650), implying that GTI may help reduce PM2.5 concentrations. Additionally, model M (4) illustrates a clear negative effect, with the coefficient of D being −3.878, and its absolute value is smaller than what was observed in model M (1), where it was −3.947. The results outlined above highlight the partial mediating role of GTI, thereby confirming hypothesis 3. This finding aligns with the studies conducted by Wang and Wei, 94 which indicated that GTI plays a significant role in decreasing PM2.5 levels. The reduction effect is attribute to urban areas enhancing the geographical division of labor and fostering industrial awareness regarding environmental protection, subsequently elevating cities’ GTI. 95 GTI plays an essential role in minimizing pollutant emissions by refining production processes, utilizing clean energy, reducing waste and recycling, and fostering the establishment of green supply chains, thus contributing to improved air quality and lowering PM2.5 pollution. 96
The mediating effect analysis of GTI.
The moderated mediating effect analysis of industrial agglomeration
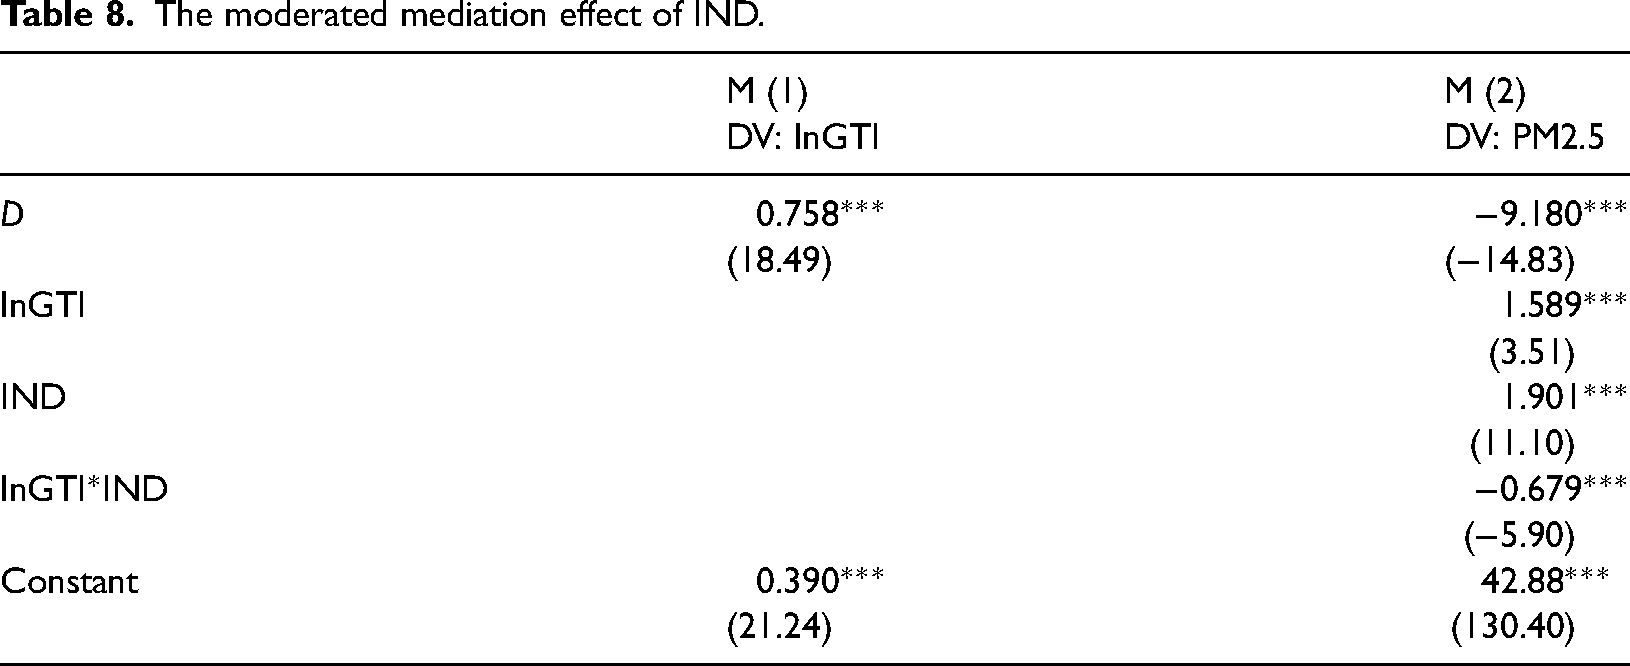
This section provides further insight into how GTI mediates the connection between UAs and PM2.5, taking into account the moderating influence of IND. Table 8 presents the moderated mediating influence of IND. In model M (1), the value for D exhibits significantly positive (β = 0.758), which is at the 1% significance threshold. Furthermore, in model M (2), the coefficient for lnGTI*IND is significantly negative at the 1% significance threshold (β = -0.679, p < 0.01), suggesting that IND influences the mediating pathway through which GTI affects PM2.5.
The moderated mediation effect of IND.
Subsequently, in Table 9, the research further explores the impact of the conditional indirect effect under different values of the moderating variable, IND, using bootstrap testing. Among them, bootstrap_1, bootstrap_2, and bootstrap_3 represent the mean value of IND minus one standard error, the mean value of IND, and the mean value of IND plus one standard error, respectively. This paper finds that the conditional indirect effect decreases and even becomes negative as the value of the IND variable increases, which contradicts Hypothesis 4. This may be due to the concentration of numerous industrial firms in one area, increasing the environmental pollution burden. 63 As IND increases, competition among firms intensifies, leading to overuse of resources and heightened environmental pollution, thereby increasing PM2.5 emissions. 97
Bootstrap testing.

The heterogeneity analysis
The heterogeneity analysis of geographic locations
This study does a grouped regression analysis focusing on the these three UAs (YRD-UA, MRYR-UA and CY-UA and), taking into account the geographic location heterogeneity among these areas. The outcomes for CY-UA, both with and without control variables, are shown in Table 10, denoted as M (1) for the model including control variables and M (2) for the model excluding them. Likewise, the results for MRYR-UA are illustrated in M (3) with control variables and in M (4) without. The findings for YRD-UA are detailed in M (5) with control variables and in M (6) without.
The heterogeneity analysis results of geographic locations.
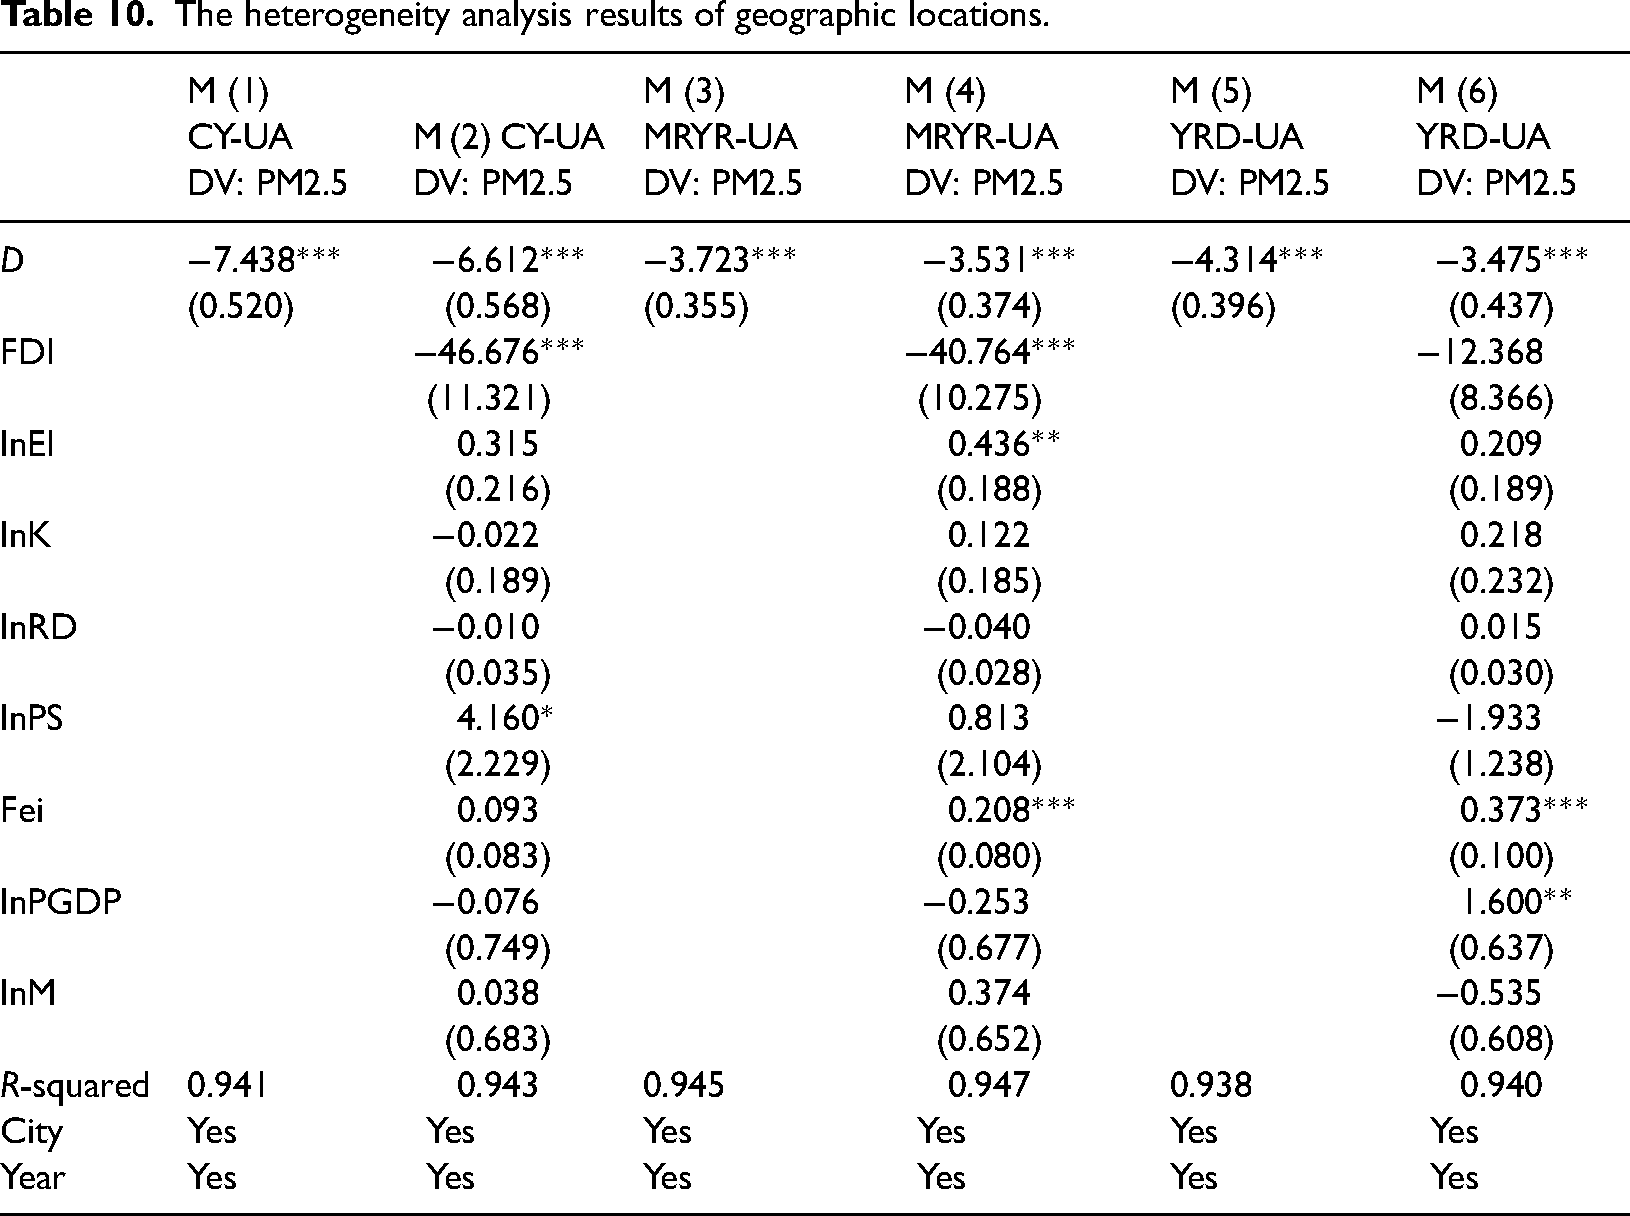
Table 10 illustrates that these three analyzed UAs have the potential to contribute to reductions in PM2.5 concentrations. However, the impact of UAs on PM2.5 reduction shows a certain degree of heterogeneity. Specifically, the coefficients for D in models M (2), M (4), and M (6) are recorded as −6.612, −3.531, and −3.475, respectively, all showing significant negative values. These findings suggest that UAs located in the eastern region (YRD-UA) exhibit a less effective reduction in PM2.5 levels when compared to those in the central region (MRYR-UA), which in turn surpass the performance of UAs in the western region (CY-UA). This observed variation can be linked to the presence of heavy industries in the central and western areas, which are known for high energy demands and considerable pollution production, resulting in elevated levels of air pollution and increased PM2.5 emission. 89 However, the construction of UAs provides opportunities for these regions to transform their industrial structures, promoting technological innovation in energy efficiency and reducing emissions, which ultimately enhances pollution mitigation in the central and western areas. 87
The heterogeneity analysis of urbanization levels
The connection between urbanization and air pollution is broadly recognized. 98 Consequently, a quantile regression analysis concerning the UR was performed to examine how this rate moderates the relationship between UAs and PM2.5 levels. The results of the regression for models M (1) and M (2), which take into account the interaction between the UR and the independent variable D, are presented in Table 11. Additionally, the study carried out regressions on various subsets of the sample, arranged in ascending order according to the degree of urbanization in cities. Specifically, model M (3) focuses on cities ranging from the lowest 25% to the highest 100%, model M (4) examines those from the lowest 50% to the highest 100%, and model M (5) includes cities from the lowest 75% to the highest 100%.
The heterogeneity analysis results of urbanization levels.
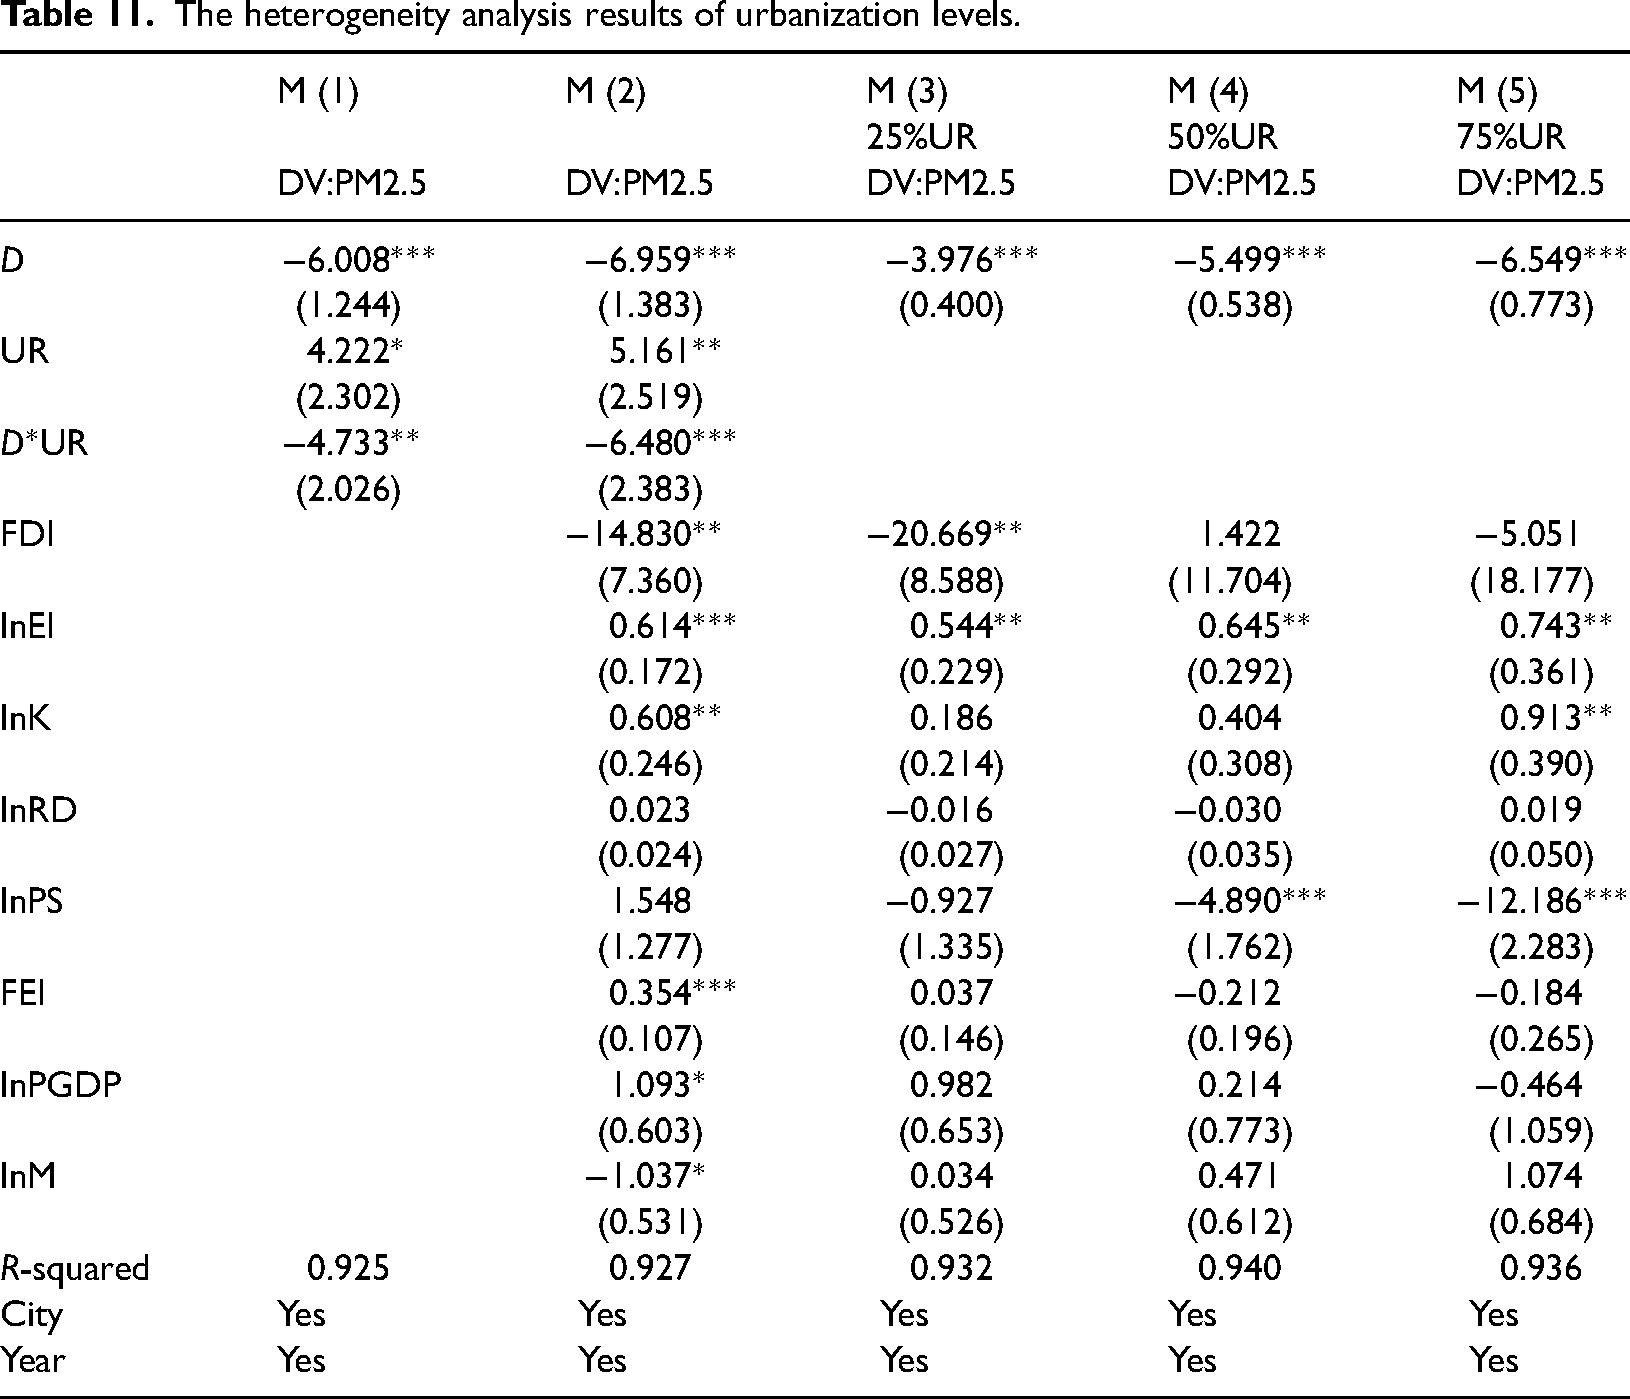
In Table 11, the interaction term’ s coefficient in model M (2) is notably negative (β = -6.959, p < 0.01). This indicates that increasing urbanization enhances the mitigating effect of UAs on PM2.5 levels, thereby supporting hypothesis 5. This result aligns with the study of Kong and Zhao. 99 This could be attributed to cities with elevated urbanization rates accelerating industrial restructuring and using industrial land more effectively, which enhances their capability to reduce PM2.5 levels. The coefficients of D in models M (3) through M(5) indicate that UAs are more effective in lowering PM2.5 levels in regions with higher urbanization levels, contradicting findings presented by Li and Fang. 100 Typically, a heightened urbanization level correlates with a greater concentration of populations, industries, and resources, fostering a more sophisticated urban cluster system. 101 This consolidating effect promotes the sharing of resources, recycling efforts, and the implementation of green technologies alongside clean manufacturing processes, resulting in a notable decrease in PM2.5 emissions.
Conclusions
This research analyzes a panel dataset comprising 110 located cities in China’ s YREB to examine how UAs impact the reduction of PM2.5 pollution through the DID method, which views the construction of UAs as a quasi-natural experiment. Additionally, it delves into the mediating effect of GTI, alongside the moderated mediation effect of industrial agglomeration. Moreover, the study assesses the spatial scope for mitigating PM2.5, along with an analysis of heterogeneity in urbanization levels and geographic location. The primary findings are displayed as follows.
First, the UAs’ construction can significantly decrease PM2.5. Second, the YRD-UA has an optimal spatial range of 100–150 km for diminishing PM2.5 levels; in contrast, the CY-UA and MRYR-UA are most effective within a spatial scope of 50–100 km. Third, UAs can mitigate PM2.5 partly through the mediating influence of GTI, while such innovation can also contribute to lowering PM2.5, influenced by the moderation effect of industrial agglomeration. Fourth, the impact of UAs on PM2.5 reduction is more pronounced in the western regions compared to the eastern areas. Fifth, the reduction in PM2.5 related to the construction of UAs increases with UR.
Built upon the research findings, several policy implications emerge. In terms of policymakers, there is an opportunity to further advance the sustainable development of UAs within the YREB to improve emission reduction effect. In this regard, it is essential for policymakers to recognize the varying levels of economic development and geographical characteristics of various UAs within the YREB, formulate customized strategies for distinct regions, and cultivate regional cooperation. Specifically, the government should promote a transition to a more environmentally friendly economy and enhance regulations regarding PM2.5 in the central and western areas. For example, establishing reasonable PM2.5 targets could serve as performance metrics, and investments should be allocated to the energy conservation and recycling industries. This approach is essential since UAs in these regions lag behind in economic development and the prevalence of green technologies. Moreover, the government should emphasize the movement of resources between UAs and be instrumental in linking central cities with their surrounding cities. The most effective spatial scope for reducing emissions in UAs situated in the central and western regions has been identified as 50–100 km, whereas for those in the eastern region, it ranges from 100 to 150 km. Thus, it is crucial to enhance the clustering of capital, industry, and information in these areas to amplify the impact of UAs on PM2.5 emission reduction. As for firms, they should seize the opportunities of UAs’ construction and strengthen GTI. The development of UAs brings specific benefits, including the concentration of talents, industries, and financial resources within the region. These collective advantages aid firms in striving for advancements in green technology. Faced with the increasing problem of PM2.5 pollution, firms should actively address market demands, boost their investments in green technologies, and foster innovation alongside the utilization of these technologies. Such actions contribute to sustainable development, fulfill residents’ aspirations for a healthy ecological environment, and strengthen the firms’ sense of social responsibility and influence.
Finally, it is critical to recognize the limitations of this study. The current analysis uses prefecture-level cities as its focus. Nevertheless, as the trends in UAs progress, there is potential for county-level regions to increasingly affect PM2.5 levels and green technology advancements. However, county-level data has been challenging due to insufficient data availability. To solve this limitation, we aim to further enhance our investigations in future research endeavors.
Footnotes
Acknowledgments
This work is supported by the National Social Science Fund of China under Grant 22CMZ031, Southeast University Zhishan Young Scholars Talent Program under Grant 2242025RCB0053, the Key Laboratory of Statistical Information Technology and Data Mining of National Bureau of Statistics of China under Grant SDL202302, and the Sichuan Provincial Key Laboratory of Philosophy and Social Sciences Key Laboratory of Liquor Digital Intelligence Management and Ecological Decision Optimization in the upper reaches of the Yangtze River under Grant zdsys24-09.
Author contributions
The study was a collaboration of three people. The contributions are presented as follows. Ruifeng Hu: Conceptualization, Methodology, Resources, Writing- Review & Editing, Supervision, Funding acquisition; Aoni Liu: Formal analysis, Data Curation, Writing- Review & Editing; Teng Cai: Formal analysis, Writing- Original draft preparation; Chuan Xu: Conceptualization, Resources, Supervision, Funding acquisition. All authors have read and agreed to the published version of the manuscript.
Data availability
The datasets generated during and/or analyzed during the current study are available from the corresponding author on reasonable request.
An ethics statement (including the committee approval number) for animal and human studies.
Declaration of conflicting interests
The author(s) declared no potential conflicts of interest with respect to the research, authorship, and/or publication of this article.
Ethical approval
Ethical approval is not applicable for this article.
Funding
The author(s) disclosed receipt of the following financial support for the research, authorship, and/or publication of this article: This work was supported by the National Social Science Fund of China, Sichuan Provincial Key Laboratory of Philosophy and Social Sciences Key Laboratory of Liquor Digital Intelligence Management and Ecological Decision Optimization in the upper reaches of the Yangtze River, Southeast University Zhishan Young Scholars Talent Program, Key Laboratory of Statistical Information Technology and Data Mining of National Bureau of Statistics of China (grant number 22CMZ031, zdsys24-09, 2242025RCB0053, SDL202302).
Statement of human and animal rights
This article does not contain any studies with human or animal subjects.
Statement of informed consent
There are no human subjects in this article and informed consent is not applicable.

Notes
Appendix
List of abbreviations.
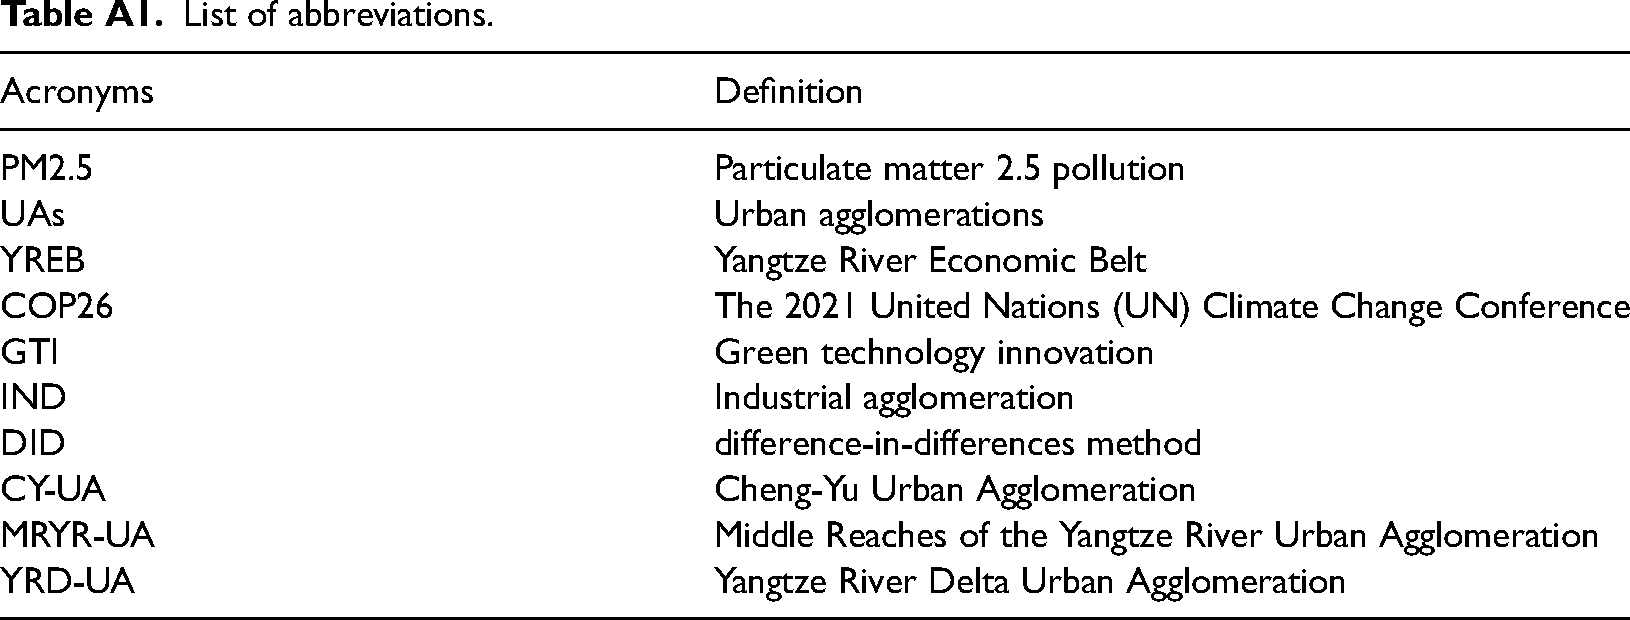
| Acronyms | Definition |
|---|---|
| PM2.5 | Particulate matter 2.5 pollution |
| UAs | Urban agglomerations |
| YREB | Yangtze River Economic Belt |
| COP26 | The 2021 United Nations (UN) Climate Change Conference |
| GTI | Green technology innovation |
| IND | Industrial agglomeration |
| DID | difference-in-differences method |
| CY-UA | Cheng-Yu Urban Agglomeration |
| MRYR-UA | Middle Reaches of the Yangtze River Urban Agglomeration |
| YRD-UA | Yangtze River Delta Urban Agglomeration |