



Abstract
The concept of carbon neutrality holds significant appeal within contemporary society, particularly in light of the pressing concern of climate change, which poses a grave threat to biodiversity. Given this context, it is imperative to investigate the role of industrial performance and industrialization in the pursuit of carbon neutrality, in conjunction with the prominence of green energy production. Thus, this research focuses on understanding the impact of industrial performance, industrialization, and renewable energy production on carbon footprint (CFP) within the framework of 13 Asian developing nations from 1993 to 2021. The findings from panel cross-sectionally augmented autoregressive distributed lag and augmented mean group approaches unfolded that both competitive industrial performance and industrialization drive CFP in Asian developing nations. Meanwhile, renewable energy makes a significant contribution to reducing CFP. In the context of CFP and associated parameters, it is observed that the coefficients derived from long-term analysis exhibit a greater magnitude in comparison to those obtained from short-term analysis. Further, bilateral and unilateral causalities were found between competitive industrial performance, industrialization, and CFP, respectively. Based on these findings, policymakers should develop strategies that prioritize the development of renewable energy infrastructure to mitigate the detrimental environmental effects of industrial performance.
Keywords
Introduction
The imperative to mitigate carbon emissions has increasingly impelled industries to incorporate innovative technologies and methodologies into their operational frameworks, thereby enhancing their competitive industrial performance (CIP). The relentless pursuit of heightened efficiency and production optimization, under the exigencies of global competitiveness, necessitates the integration of environmentally sustainable solutions within these industrial sectors. This evolving paradigm of international competitiveness is inherently dynamic, underscored by a commitment to the principles of innovation. In many cases, innovation offsets will be prevalent as the reduction of pollution often aligns with the enhancement of resource utilization productivity and competitive advantages. 1 Environmental concerns motivate countries to commence initiatives aimed at improving sustainable industries. Subsequently, these issues stimulate technological advancements and investments that strengthen industrial competitiveness and contribute to the overall improvement of environmental quality. 2
As a consequence of these endeavors, specific countries enforce “The Clean Air Acts,” which require industries to consider the adoption of renewable energy (RE). The Clean Air Act, which was enacted in 1955, was the principal piece of legislation addressing air quality concerns. It was subsequently amended in 1970, 1977, and 1990. 3 This necessitates the simultaneous enforcement of RE policies and the maintenance of a complex equilibrium between economic and environmental goals. Furthermore, there is a recognition of the necessity to tackle the intermittency inherent in RE sources, as well as the potential negative environmental impacts associated with the development of RE. 4
Furthermore, the CIP index is a composite measure of a nation's industrial performance that considers the global market impact and production capacity. The CIP index is an invaluable instrument for research as it relies on UNIDO's database. It facilitates cross-country and time-series comparisons. Cross-national comparisons stimulate the identification of relative economic benefits across countries. Elevated scores in the CIP index imply enhanced industrial competition among nations. Elevated ratings indicate enhanced global market opportunities for nations exhibiting excellent performance. 5 CIP has the capacity to stimulate technical advances, resulting in significant progress in environmental sustainability. 6 The common industrial policy, acknowledged and embraced on a broad scale, aligns seamlessly with the tenets of Sustainable Development Goal 9 (SDG 9), which endeavors to foster the establishment of sustainable industries and stimulate innovation. SDG 9, centered on industrialization (IND) as a pivotal catalyst for economic progress leading to heightened standards of living, stands prominently as one of the preeminent and consequential objectives in the sustainable development agenda. 7 Due to the technological advancements implemented in this process, IND, which subsequently expanded worldwide after being initiated by Great Britain, established a highly competitive global setting. 8 IND is widely seen as the accelerator for achieving sustainable development, particularly in underdeveloped nations. 9 Formulation of region-specific paths aimed at fostering low-carbon industrial projects, driven by ecological rules, can enhance sustainable development. 10 The specific path for industries to mitigate pollution is enhancing energy efficiency rather than decreasing industrial output. 11 Similarly, the carbon-emission trading system pilot results in a substantial decrease in contaminated energy sources. 12 While the transfer from county to district facilitates industrial reorganization and contributes to the reduction of carbon emissions. 13
The worldwide increase in industrial operations is a major cause of the environment's declining quality. 14 The conceptual link between IND and the environment can be comprehended through the framework of economic development, as illustrated by the environmental Kuznets curve (EKC) hypothesis,15,16 whereby IND would initially benefit businesses, leading to their expansion and the creation of employment and production resources. 17 The repercussions of unrestricted growth are realized in terms of a surge in carbon footprint (CFP). 18 Over time, companies adopt more environmentally sustainable practices, contributing to the advancement of IND in a greener and more responsible manner. 19 Competition within the industrial sector can stimulate innovation, resulting in the creation of novel technologies and procedures that effectively mitigate environmental concerns. 20 The integration of artificial intelligence and heightened managerial focus significantly mitigate greenhouse gases in industry.21,22
The implementation of RE sources and the reduction of CFP are essential for the preservation of the environment and the attainment of sustainable growth. 23 It is imperative to promote the transition to RE to achieve environmental sustainability. 24 Meanwhile, governments and regulatory authorities can expedite the adoption of RE and encourage environmental development by imposing carbon taxes on fossil fuel consumers. 25 Numerous countries have established objectives to reduce greenhouse gas emissions by up to 55% by 2050, in accordance with global climate neutrality initiatives. 26 Subsequently, a substantial investment will be necessary in the short- to medium-term to construct the essential RE infrastructure and satisfy the growing demand for sustainable energy.27,28
Globalization has the capacity to stimulate economic expansion in economies, but it comes with a substantial environmental drawback. 29 Supporters of globalization contend that it enhances environmental quality by diminishing greenhouse gases. 30 On the other hand, opponents of globalization say that it has negative effects, namely in terms of environmental degradation caused by increasing levels of greenhouse gases. 31 Critics further argue that although globalization facilitates the expansion of the production process, it will compromise environmental quality unless there are sequential changes in both consumption and production practices. Moreover, although globalization serves as a driver for economic progress, particularly in developing countries, it has also accelerated the exhaustion of natural resources and the destruction of the environment in these regions. 32
Within the aspects of environmental sustainability, this research goes further by incorporating new variables such as CIP in relation to CFP within Asian developing countries. This study attempts to seek this gap by analyzing the impact of CIP, IND, and RE on CFP in Asian developing countries. Our research incorporates novel and advanced methodologies, specifically cross-sectionally augmented autoregressive distributed lag (CS-ARDL) and augmented mean group (AMG). The optimal estimates are not achieved by the first-generation panel ARDL due to the presence of cross-sectional dependency (CSD). In order to overcome the difficulty presented by cross-sectional dependence, CS-ARDL has been implemented in this empirical investigation. To ensure the predictability and consistency of the outcomes generated by CS-ARDL, we also used the AMG test for robustness. Using these modern methodologies, our research hopes to offer a more proficient and comprehensive examination of the connections between the variables under investigation.
Literature review
There has been very inadequate and underexplored research available on CIP. Such as Anser et al. 33 investigated the connection between fossil and RE sources, as well as the influence of competitive industrial growth, on greenhouse gases. They found that industrial competition and industrial intensity make pollution worse. Caglar et al. 34 undertook an examination of the interrelationships between RE consumption, competitive industrial performance, urbanization, and load capacity factor within the BRICS nations during the temporal span from 1990 to 2018. The empirical findings provided compelling evidence that heightened levels of industrial competition have a positive impact on the overall state of environmental quality. Similarly, Caglar and Askin 35 investigated the environmental consequences of industrial competition in the top 10 most competitive nations from 1990 to 2018. They incorporated CUP-FM and CUP-BC estimation approaches. They illustrated that industrial competition has detrimental effects on the environment. Recently, Caglar et al. 36 conducted an asymmetric analysis within this particular framework of China's eco quality. They found that the country's rapid advancement and boosted industrial competitiveness effect environment.
The process of IND holds considerable influence in shaping the CFP of countries. Over the course of a study analyzing data from 1990 to 2019, Akif Destek et al. 37 implemented symmetric and asymmetric analytical methods to scrutinize the impact of IND on environment across an array of developed and developing nations. The results underscored the significance of IND in driving the increase in CFP. Similarly, Iqbal et al.'s 38 analysis, which spanned the years 1996–2021, incorporated both Driscoll and Kraay fixed effect and FGLS approaches to examine the correlation between IND and environment in developed and developing countries. The findings suggested that IND is indeed a factor driving the rise in CFP. In accordance with Rasheed et al.'s 39 study, the influence of IND on the CFP of developing Asian countries is evident in both the short and long term. Therefore, it becomes crucial to recognize and account for the multi-dimensional and enduring ramifications of IND on their respective CFP.
The installation of RE sources is the fundamental and most important element of improving the environment. In this context, Xu et al. 40 undertook a study between 1990 and 2017 to reveal the ramifications of RE on the environmental footprint. They found that RE exhibits a substantial and advantageous long-term association with the environmental footprint, thereby mitigating the adverse effects of climate change and global warming in China. Sun et al. 41 carried out research to ascertain the interconnections between RE and environmental footprint within the context of 11 developing nations. They validated the concept of reduction of environmental footprint with the help of RE in the long run and the short run. Wang et al. 42 considered BRICS economies for analyzing the long-run relationship between CFP and RE. Their results suggest that the BRICS nations may fund large-scale environmental remediation projects, such as increasing investment in RE and decreasing reliance on fossil fuels, with the goal of reducing CFP and fostering more sustainable growth.
Dogan et al. 43 took a sample of five Asian developing nations to find the connection between CFP and RE alongside other influencing determinants. The researchers deployed panel quantile regression and system GMM methodologies to analyze the annual panel data from 1990 to 2017. The empirical findings demonstrate an interaction between the utilization of RE sources and CFP, leading to a reduction in ecological footprint significantly and it has been observed to enhance environmental sustainability in South Asian developing countries. Bilgili et al. 44 investigated the capacity for generating renewable electricity and the implementation of environment-related technologies to decrease carbon emissions in 14 EU nations between 1990 and 2019. The study utilizes panel vector autoregressive models to demonstrate that these technologies effectively reduce CO2 levels. Numerous intellectual inquiries suggest that the rising prominence of clean energy sources leads to considerable atmospheric advantages and a reduction in CFP, such as. 45
Within the context of other driving factors, such as economic development and globalization. The impact of economic development, modernizing the industrial framework, and the input of rural energy on CFP is of considerable significance. Additionally, it is worth noting that the CFP is significantly influenced by the living standard and technological level, which exert inhibitory effects, and the rapid pace of economic growth has exacerbated the carbon footprint.46,47 The occurrence of globalization plays a pivotal role in reducing the CFP within developing nations in Asia. 48 On the other hand, globalization exhibits a low coefficient and positive correlation with CFP in the E7 group of countries and the top seven greenhouse gas emitters.49,50
The preceding studies bring out several gaps. There is a noticeable lack of studies about the impact of CIP, IND, RE, economic growth, and globalization on the CFP in the context of Asian developing countries. The selection of these countries is based on their distinct characteristics, as revealed by the Australian Ministry of Foreign Affairs. 51 This study aims to clarify the complex interconnections among industrial competitiveness, IND, and RE integration through an examination of Asian developing economies. Through the concentration on these Asian growing economies, this research endeavor seeks to provide an assessment of the intricate interconnections between industrial competitiveness, IND, RE integration, and the overarching trajectory of CFP in the Asian developing economies context. Consequently, the current study employs cutting-edge estimation techniques, such as CS-ARDL, and other second-generation tests in an effort to fill these research gaps.
Methodology and results
Methodology
Data source and variable description
This section examines the annual data of the 13 Asian developing countries spanning from 1993 to 2021, namely Bangladesh, Cambodia, China, India, Jordan, Kyrgyzstan, Lebanon, Malaysia, Nepal, Pakistan, Philippines, Sri Lanka, and Vietnam. The study explicates the consequences of industrial performance, RE, and IND on CFP to evaluate environmental sustainability in Asian developing economies. The most recent compilation of developing countries was acquired from the Australian Ministry of Foreign Affairs. The official website of the Australian Ministry of Foreign Affairs released the list of developing countries in March 2022. The selection and duration of the study on developing countries are determined based on the availability and accessibility of data. This study adapted the CFP as an explained variable, serving as an indicator of ecological sustainability. The study implemented the CIP index, RE production, and IND as explanatory variables. We employed a standard conversion factor to convert RE production data from Quad Btu to kilowatt-hours (kWh). One Quad Btu is equivalent to 293,071,070,172.22 kWh. Consequently, we divided the total kWh by the population count to determine the RE production per person.
In addition, the analysis also comprises intermediary factors such as gross domestic product (GDP) and globalization (GLB). Further, Table 1 details the inclusion parameters of this study. Figures 1 to 4 illustrate the visual representation of CFP, CIP, RE, and IND. Figure 1 depicts the CFP of 13 Asian countries, with China and India exhibiting a substantial increase in environmental degradation compared to other developing nations. Figure 2 illustrates the growth trends in CIP, with China, Malaysia, and Vietnam emerging as the most competitive nations. Figure 3 emphasizes the consistent increase in RE production, which has established China and India as global leaders. Finally, Figure 4 illustrates the IND levels of these countries, with China and India demonstrating the highest levels of IND in comparison to other developing nations.

Trends in the carbon footprint (CFP).

Fluctuations in the competitive industrial performance (CIP).

Trends in the renewable energy (RE).

Evolution of the industrialization (IND).
Variables description.

Abbreviations: CFP, carbon footprint; CIP, competitive industrial performance; RE, renewable energy; IND, industrialization; GDP, gross domestic product; GLB, globalization.
Econometric model
The framework depicted below evaluates the ramifications of CIP and RE on carbon emissions, as well as the IND of the Asian developing countries. The following equation (1) is implemented based on the latest previous research findings
57
:

Preliminary tests
The study incorporated cross-sectional dependence by utilizing two distinct tests, Pesaran 58 and Pesaran LM. Moreover, the slope heterogeneity tests of Blomquist and Westerlund 59 and Hashem Pesaran and Yamagata 60 are popular approaches in the long-term for revealing whether or not there is any heterogeneity. We performed Im–Pesaran–Shin (CIPS) and cross-sectionally augmented ADF (CADF) checks for unit roots. After that, Westerlund 61 cointegration is applied. It is known as an error-correction-based cointegration test. It examines cointegration by analyzing the error correction mechanism in a dynamic panel regression model. The test is specifically developed to address the common challenges found in panel data analysis, including cross-sectional dependence, heterogeneity, and serial correlation. Using the results of the statistical diagnostic tests, this study proceeds to estimate using the CS-ARDL method. This approach proficiently handles several econometric difficulties, such as non-stationarity, endogeneity, cross-sectional interdependence, unobserved common factors, and fluctuations in slope coefficients. 62
Long-term estimation
The research endeavor has chosen to adopt the CS-ARDL approach to measure the enduring connections and immediate impacts of CFP, CIP, RE, IND, and driving factors. It is a robust and efficient technique. 63 This analytical approach is proficient for performing better due to its handling of CSD, endogeneity, and heterogeneity. 64 The challenges of potential endogeneity, serial correlation, and common correlation bias can be mitigated through the application of the CS-ARDL methodology.65,66 The CS-ARDL model functions as an error-correction model, integrating an error-correction term to capture the long-term relationship between the variables. This model demonstrates exceptional proficiency in capturing both short-run and long-term equilibrium connections within the framework of a cross-sectional analysis. Significantly, by incorporating the error-correction term, the model is capable of compensating for any fluctuations that may occur away from the long-term equilibrium. This feature offers valuable insights regarding the rate of adjustment as well as the intensity of the cointegrating relationship. CS-ARDL is a highly valuable tool for revealing the complex interrelationships among variables in various cross-sectional units, providing an accurate understanding of their dynamic interactions. Furthermore, the dynamic nature of the CS-ARDL model is indicated by the fact that it takes lagged values of the dependent and independent variables into account. The above-mentioned preliminary tests ensure that the necessary conditions for CS-ARDL panel modeling have been satisfied before its implementation. The panel cointegration test 61 is incorporated to determine the existence of cointegration within the panel.
This is how the CS-ARDL model can be shown in the following equation:
Robustness
The AMG method is applied to evaluate how reliable the long-term estimates that derived through CS-ARDL. In 2010, Eberhardt 67 and Teal developed the AMG test, a method specifically designed for panel data. This technique addresses slope heterogeneity, which occurs when the interconnection between variables varies across different units or over time, allowing for more robust and reliable analysis in such cases. AMG enables the establishment of distinct long-term associations between the variables for various groups. AMG does not place restrictions depending on the unit root characteristics of the parameters. The AMG estimator offers consistent outcomes even without integration. 68 AMG can estimate panel data sets for more than one thing by using either the same or different dynamics for each group, since it has fixed intercepts and slope parameters based on the clusters found in the panel data analysis. 69 AMG excels at tackling significant challenges commonly encountered in panel data analysis, including cross-sectional dependence, slope heterogeneity, and endogeneity. 70 This estimator integrates the benefits of the mean group (MG) estimator and the dynamic fixed effects (DFE) estimator. The MG estimator presumes uniformity of slope across entities, whereas the DFE estimator permits entity-specific slope coefficients but neglects CSD. 71 AMG delivers accurate projections despite the connection between predictors and the error term. 72 It makes sense for AMG to support estimating results because this method uses a higher degree of freedom, can handle different slope parameters, and reduces collinearity, which eliminates endogeneity and produces strong results. 73
Panel causality
Along with the long-run estimation mechanism, this study also uses the Dumitrescu and Hurlin, 74 panel causality methodology. It shows that the existence of causation can be unidirectional, feedback-driven, or neutral. These are three different ways to define a causal relationship. A bidirectional causal relationship occurs when there is a mutual connection between two variables, with each variable influencing the other. Unidirectional links refer to a one-way connection from one variable to another, whereas the last one is identified as a neutral interaction. This test examines precise findings in the presence of CSD and heterogeneity.
Equation (4) outlines the operational mechanism of this test, which can be described as follows:
Results
The result of preliminary tests
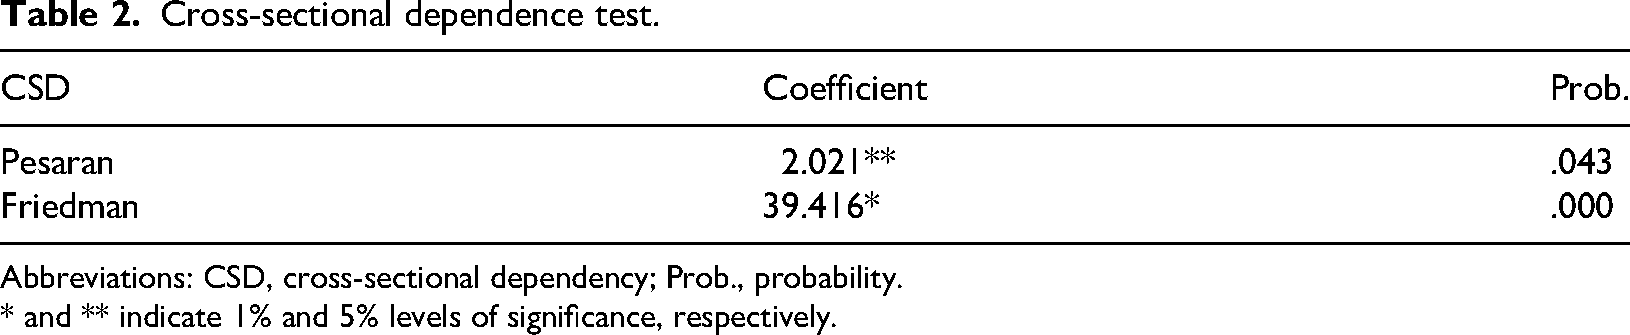
Table 2 demonstrates the outcomes of CSD analysis. The outcomes of the study not only refute the null hypothesis but also support the alternative hypothesis and provide evidence in consideration of cross-sectional dependence. The findings illustrate how globalization establishment of transnational connections or linkages in the vast majority of Asian economies that are still in their early stages of development. According to the findings of Pesaran and Friedman, there is sufficient evidence to back up the concept of international interdependence at a 1% and 5% level of significance.
Cross-sectional dependence test.
Abbreviations: CSD, cross-sectional dependency; Prob., probability.
* and ** indicate 1% and 5% levels of significance, respectively.
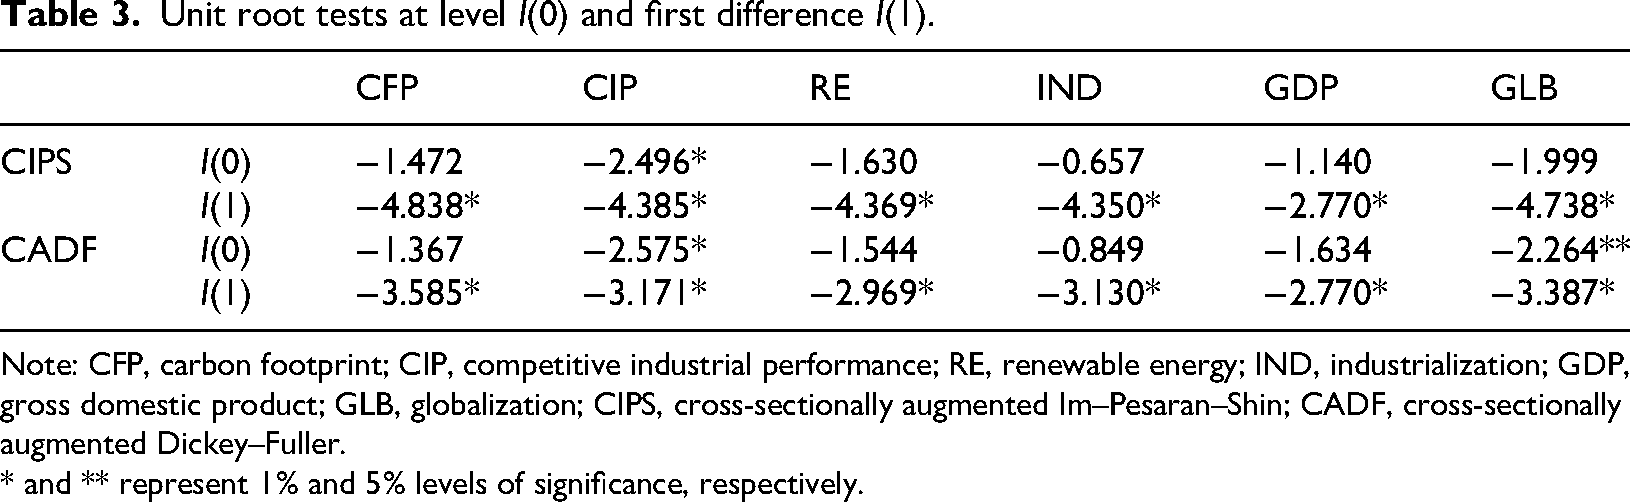
According to the findings that are presented in Table 3, which are discussed further down in this article, the order of integration in the variables that are the subject of this research is not uniform across the full sample of Asian emerging nations. The unit root estimations are also found to be robust when second-generation estimating methods are employed. Both the CIPS and the CADF 75 affirm a non-uniform pattern of varying integration. The variables considered in this study seem to be integrated at their respective levels and exhibit varied levels of significance at 1% when analyzed using first differences. It is feasible to perform the panel cointegration tests and CS-ARDL analysis subsequently.
Unit root tests at level I(0) and first difference I(1).
Note: CFP, carbon footprint; CIP, competitive industrial performance; RE, renewable energy; IND, industrialization; GDP, gross domestic product; GLB, globalization; CIPS, cross-sectionally augmented Im–Pesaran–Shin; CADF, cross-sectionally augmented Dickey–Fuller.
* and ** represent 1% and 5% levels of significance, respectively.
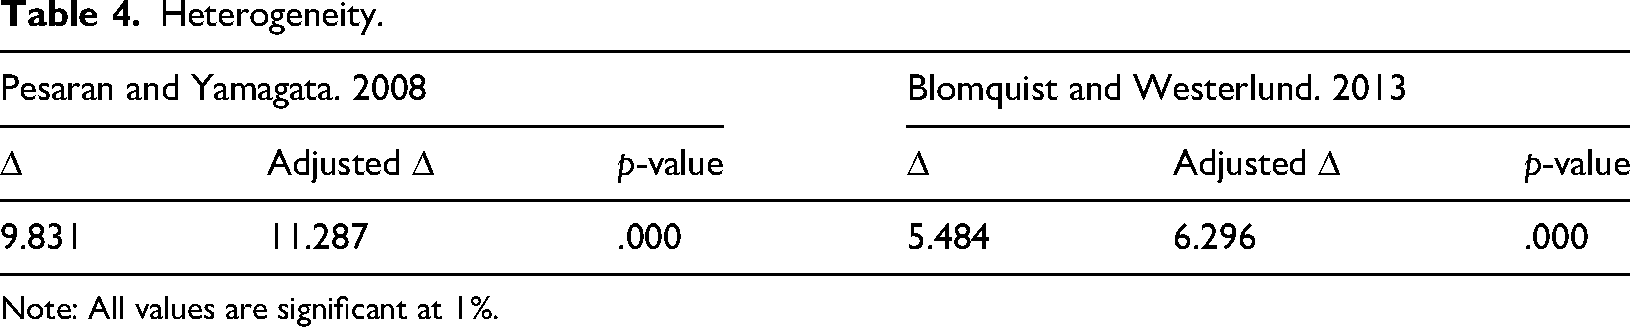
Table 4 determines the different slope coefficients across the cross-section. The probability values of each test statistic are below the 1% level of significance. This indicates that there is a significant and heterogeneous relationship between CFP and factors such as CIP, RE, IND, GDP, and GLB.
Heterogeneity.
Note: All values are significant at 1%.
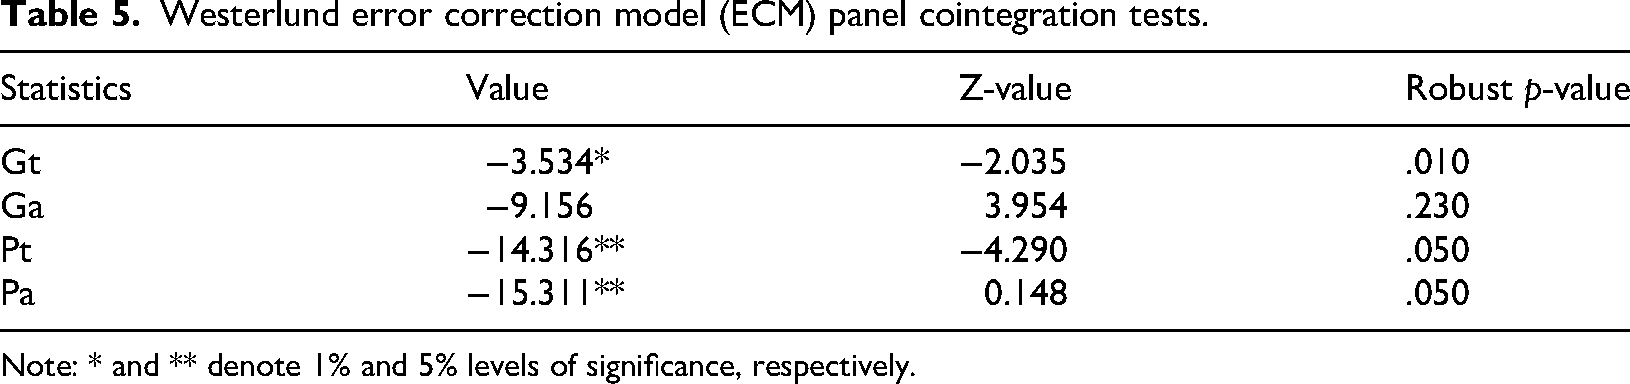
In the present inquiry, the cointegration test is executed in Table 5 to ascertain whether a sustained relationship exists between the response and the variables being explained. The panel cointegration tests are employed to examine the long-term association. As estimated by the cointegration test, 61 all of the variables mentioned above exhibit long-term cointegration at a 1% and 5% level of significance. This study provides conclusive evidence to support the notion that all factors demonstrate long-term cointegration.
Westerlund error correction model (ECM) panel cointegration tests.
Note: * and ** denote 1% and 5% levels of significance, respectively.
The result of the CS-ARDL analysis
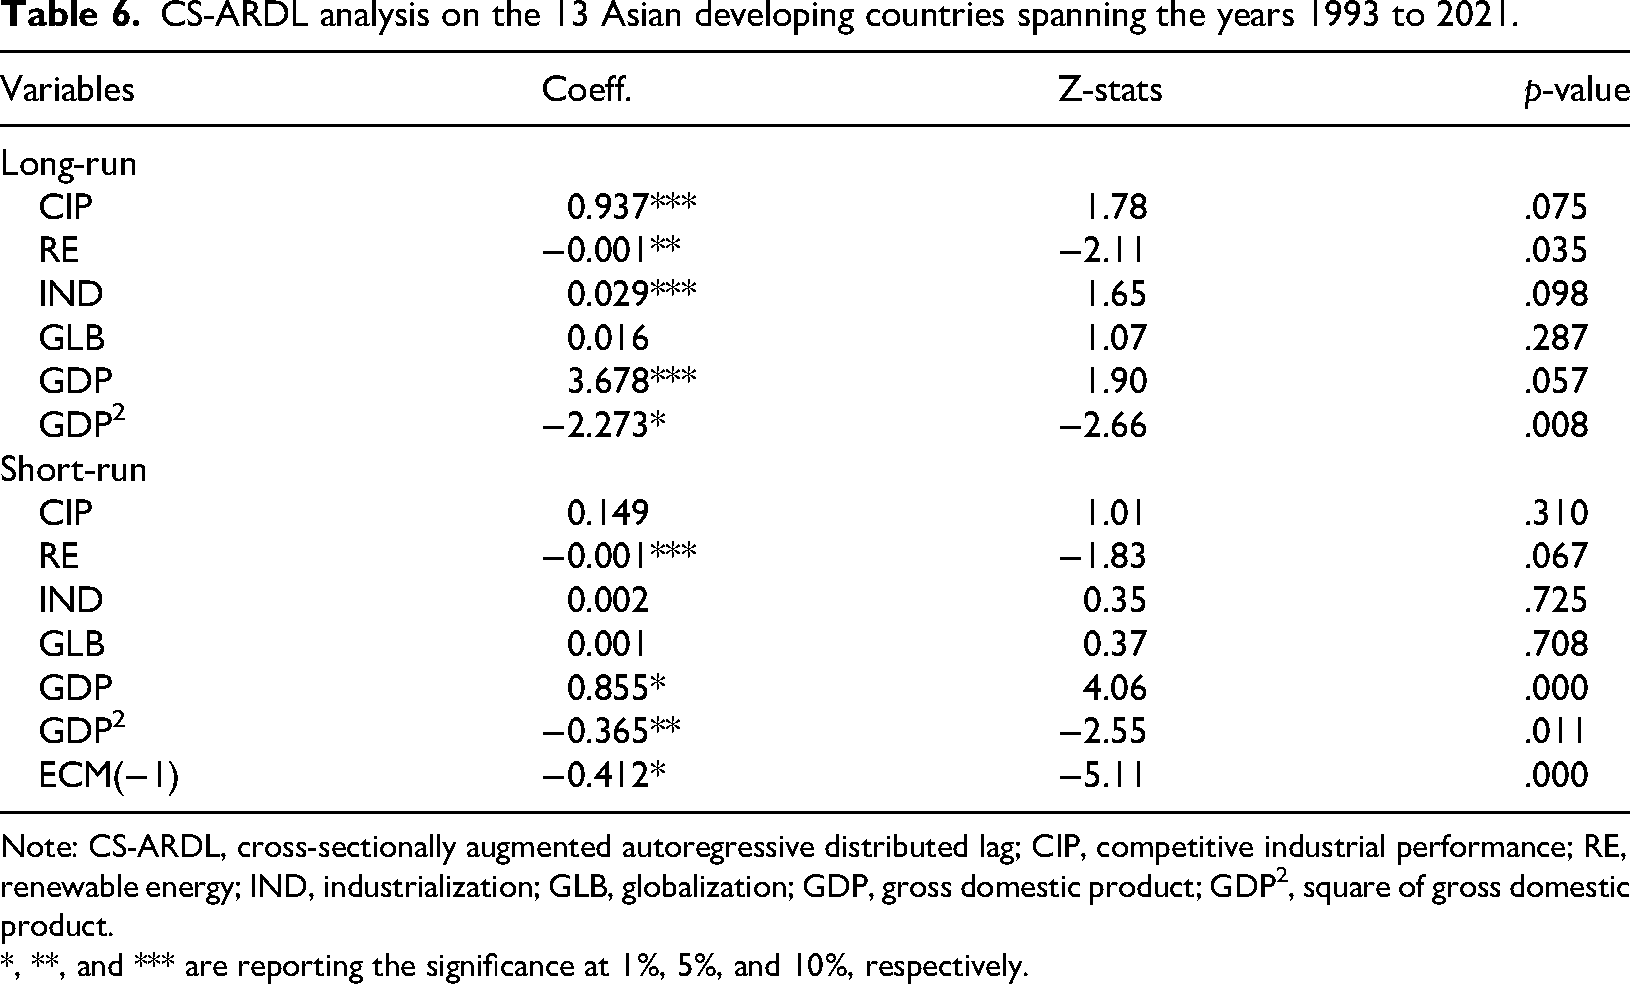
We started by relying on the novel CS-ARDL model to assess the outcomes in both the short-term and long-term on the given panel dataset of Asian developing countries. The outcomes of the model are outlined in Table 6. Within the context of CIP, a 1% rise in CIP contributes 0.937% in CFP in the long run, while a 1% increase in CIP leads to deterioration of the environmental footprint by 0.149% in the short run. This identification indicates that CIP substantially accelerates the CFP in Asian developing countries. The following are legitimate explanations for the rising CFP in these developing nations: Asia, with fast-rising economies like China, India, and Vietnam, contributes significantly to the CFP and CIP. These nations export carbon-intensive goods to compete worldwide with weaker environmental restrictions. For example, China and India, the world's largest greenhouse gas polluters, greatly impact CFP. Export-driven growth boosts CIP and greenhouse gas emissions in developing nations. Roads, factories, and other infrastructure need to increase industrial competition, which leads to an increased CFP. Competitiveness, typically connected to weaker environmental regulations and bigger CFP, is assessed by the UN, which emphasizes industrial performance and carbon emissions in populated, fast-developing regions. The outcomes of this research endeavor align with prior investigations. 35 They noticed that CIP is a strong tool for stimulating the environmental footprint. In the pursuit of sustainable and competitive industrial development, the mitigation of CFP may prove to be a strategic component. 76
CS-ARDL analysis on the 13 Asian developing countries spanning the years 1993 to 2021.
Note: CS-ARDL, cross-sectionally augmented autoregressive distributed lag; CIP, competitive industrial performance; RE, renewable energy; IND, industrialization; GLB, globalization; GDP, gross domestic product; GDP2, square of gross domestic product.
*, **, and *** are reporting the significance at 1%, 5%, and 10%, respectively.
The coefficient of the RE seems advantageous in relation to CFP in the long-run and short-run by −0.001%, with a 1% adoption rate of RE. These findings indicate that RE has the potential to mitigate the growing environmental impact significantly caused by IND, industrial competition, and rapid economic growth. Fossil fuel consumption reached its peak in 2015, but since then, countries worldwide have embarked on initiatives to foster the production of RE. As a result, there has been a consistent rise in investments in RE, while global investment in fossil fuels has been decreasing. So far, global investment in clean energy projects has reached an impressive $1.8 trillion. Asian developing countries have also embraced RE initiatives in recent years, making substantial investments, reflecting a global trend. 77 As an illustration, China, as a notable example from Asia, has taken the forefront in this movement by investing a staggering $184 billion, followed by India with $19 billion in investments within the context of Asia. 78 Figures 5 and 6 offer a comprehensive visual representation of the relationship between CFP reduction and the increase in investments in RE. They provide a detailed overview of this dynamic. This result is in line with our prior scholars,79,80 who proposed that the adoption of RE in Asian developing countries has the potential to significantly decrease CFP by substituting non-RE sources, such as fossil fuels, with green and more sustainable alternatives.

Trends in investments in clean energy and fossil fuels from 2016 to 2022. 2

Countries at the forefront of clean energy investments. 78
The IND is declining in environmental quality drastically over the long-run and short-run. Since the IND coefficient appears to have a positive sign, we may deduce that a one percentage point increase in IND will lead to a 0.029% increase in CFP over the long-run and a 0.002% increase over the short-run. The impact of IND on CFP is larger in the long term than in the short run due to the high magnitude of the coefficient. Historically, Asian developing countries have faced various challenges in their IND efforts. Investors use industrial machinery from industrialized countries to upgrade to energy-efficient and environmentally friendly equipment due to capital constraints. When installed in poorer countries, these secondhand devices require too much energy. These countries rely on fossil fuels and carbon-intensive energy sources to supply their industrial needs, and their manufacturing processes are energy-intensive and emit large amounts of carbon. Cheap labor encourages investors to cut costs and increase profits, but a lack of education and expertise among investors and workers compared to advanced countries makes it difficult to understand and operate the latest machinery, which often requires specialized experts. These countries place a greater priority on economic growth than on environmental concerns to address employment and population growth, and income disparity may result in policies that raise energy-intensive industry expenses, disproportionately harming low-income households. Long-lived infrastructure and assets like coal-fired power plants and cement manufacturers get embedded in the economy, making the low-carbon transition difficult. The observations of the study are compatible with previous research conducted in the context of developing nations and Asian developing countries that IND is a key factor that holds significant potential for contributing to environmental degradation.28,81
The observations concerning the control variables are similarly noteworthy. The coefficient of GDP seems positive and significant in both cases in the long run and the short run. A 1% increase in GDP contributes 3.678% and 0.855% in CFP in the long run and short run, respectively. The results show similarities to previous research endeavors that observed the interconnection between CFP and GDP in Asian developing countries.82,83 Throughout the last three decades, spanning from 1993 to 2022, Asian developing economies have showcased impressive growth, demonstrating an average real GDP growth rate of 5.25%, excluding the year affected by the COVID-19 pandemic. This exceeds the worldwide average real growth rate of 3.6% during the same period. 84 In order to achieve such impressive progress, these countries carry the burden of a higher CFP, as they rely heavily on fossil fuels to fulfill their energy requirements for industry and transportation systems. The square of GDP (GDP2) demonstrated the presence of an EKC relationship between GDP and CFP in the selected Asian developing nations. Because the coefficient of GDP2 appears negative and statistically significant in both short-run and long-run estimations. Once economic growth reaches a certain threshold, GDP has the potential to cause a fall in CFP. The presence of an EKC in this study aligns with prior investigations.85,86 Suggesting that the negative effects on the environment may decrease as economies progress and achieve higher levels of prosperity.
In our model, the coefficient for the error-correction term (ECT-1) appears to be negative and statistically significant. This finding affirms the presence of a long-term relationship in the selected models. The ECT demonstrates the rate at which short-term fluctuations or deviations are adjusted back towards a long-term equilibrium at a rate of −0.412%. In conclusion, the CS-ARDL model contains practical value in economic decision-making as well as statistical soundness. To summarize the findings, the research endeavor offers a condensed overview of the research discoveries in Figure 7, capturing the essence of the United Nations SDGs.

Research discoveries are closely intertwined with the Sustainable Development Goals (SDGs), offering valuable knowledge and perspectives.
Robustness analysis for long-run analysis
The study performed a robustness investigation to verify the reliability and validity of our estimation, in which we incorporated the AMG estimation methodology with CS-ARDL. The result of the AMG model is reported in Table 7. This framework verifies the long-run estimation of CS-ARDL by checking the direction and statistical significance of each explanatory and control variable in relation to the dependent variable. AMG clarifies the negative effects of CIP and IND on CFP, while emphasizing the positive influence of RE and GDP2 for mitigating CFP in the study conducted in Asian developing countries.
AMG analysis on the 13 Asian developing countries spanning the years 1993 to 2021.

Note: AMG, augmented mean group; CIP, competitive industrial performance; RE, renewable energy; IND, industrialization; GLB, globalization; GDP, gross domestic product; GDP2, square of gross domestic product.
*, **, and *** denote 1%, 5%, and 10% significance, correspondingly.
Results of pairwise D-H panel causality
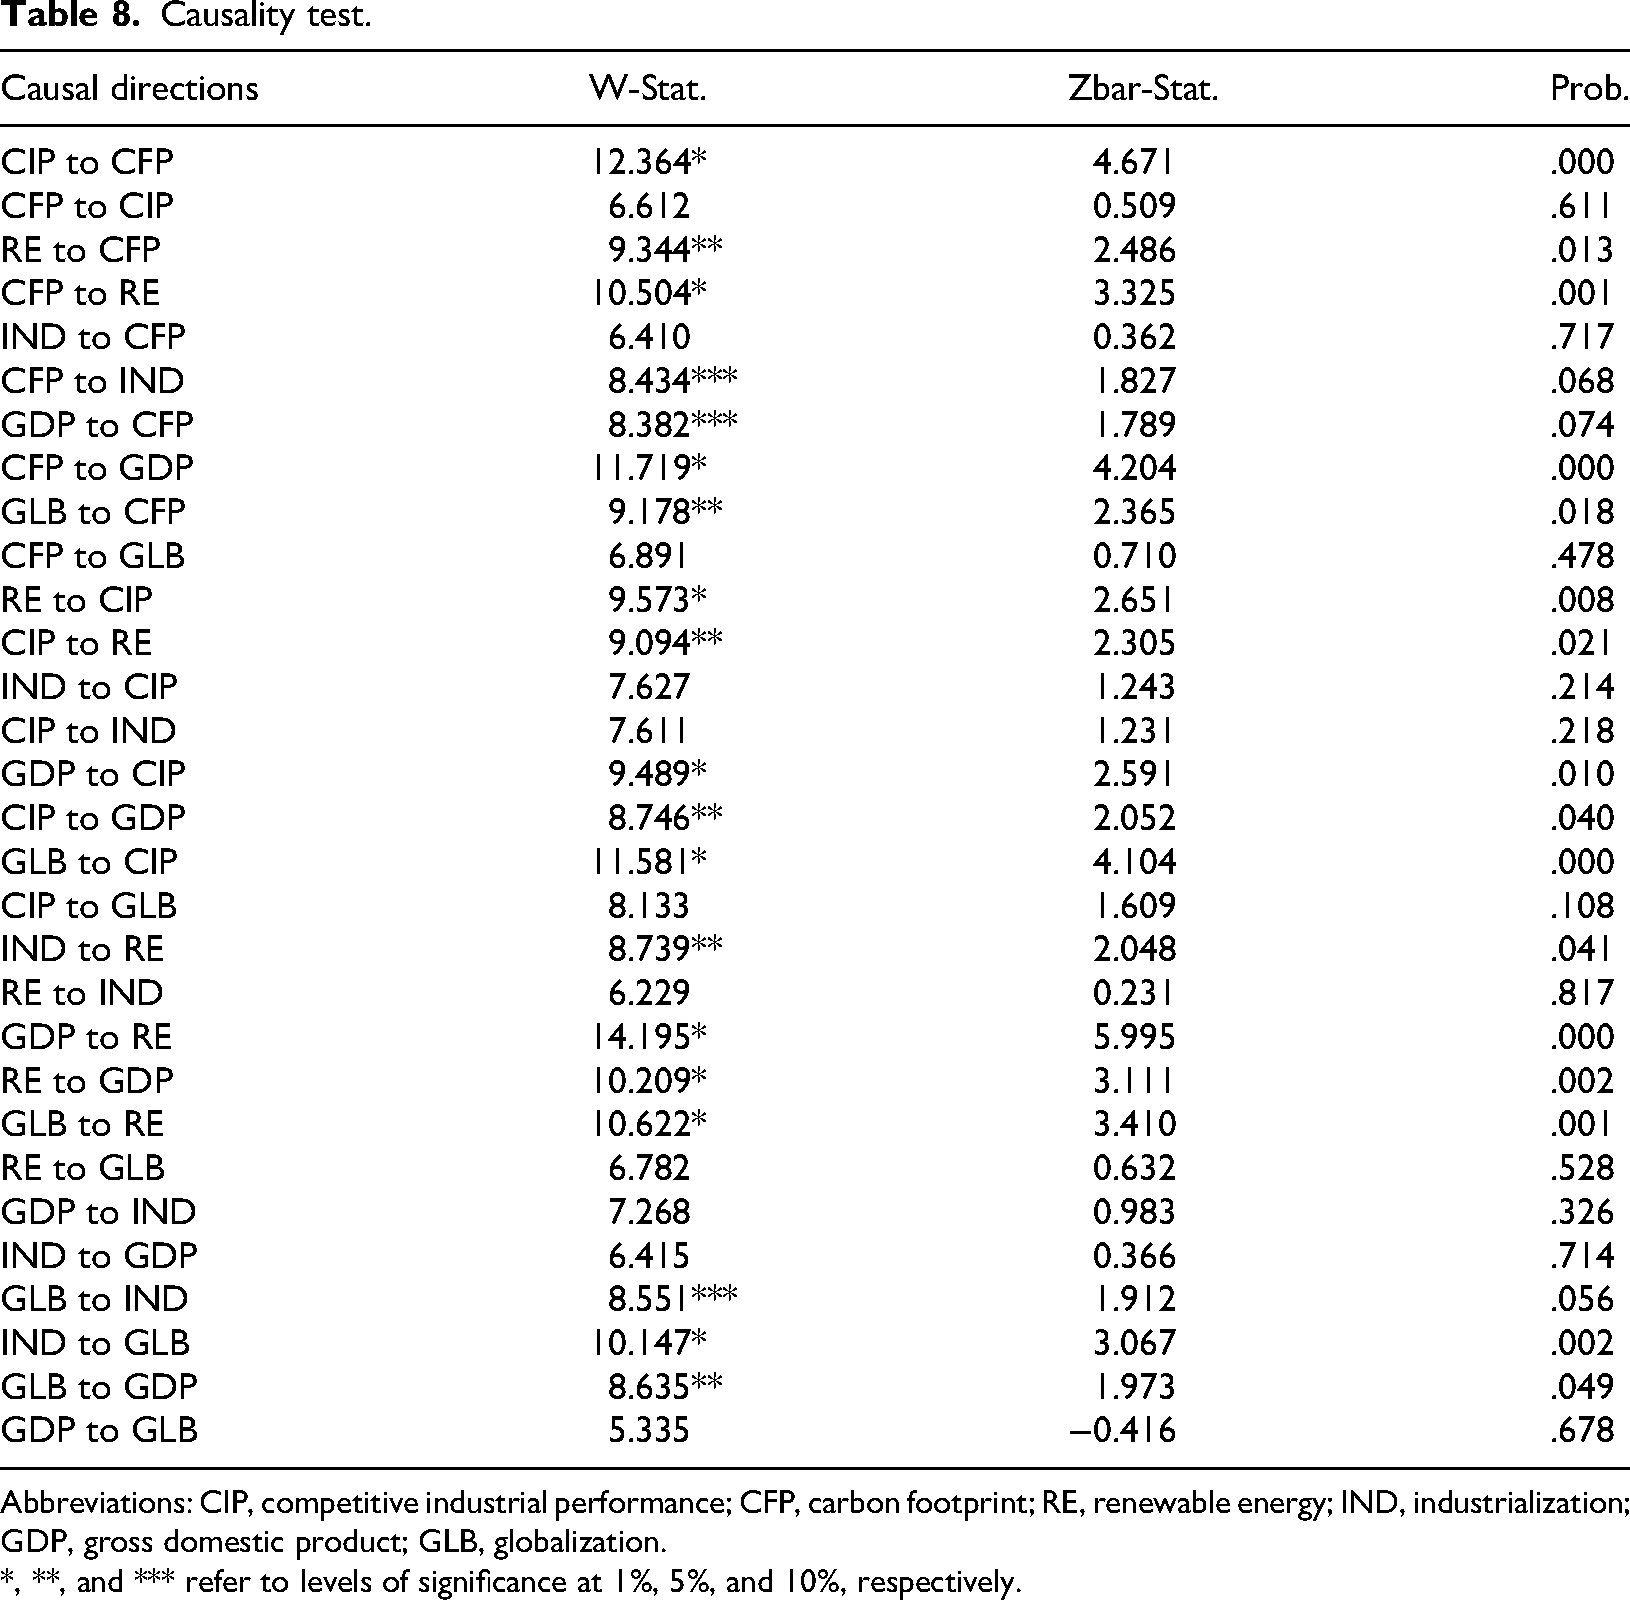
The panel heterogeneous non-causality test created by Dumitrescu and Hurlin 74 is used in this study to look at the main cause-and-effect connection between CFP, CIP, RE, IND, and control variables. This approach incorporates both W-statistics and Z-bar statistics. The findings of the D-H causality test are detailed in Table 8. These investigations demonstrate that CIP and RE have a significant Granger causal effect on CFP within the unilateral and bilateral perspectives, respectively. As it stands, the significant one-way and bidirectional causal link found between CIP and RE to CFP, because changes in these influencing factors can affect CFP significantly. This finding is consistent with extensive evaluations conducted using CS-ARDL and AMG econometric techniques. When considering the control variables, GLB and GDP have unidirectional and two-way associations with CFP.
Causality test.
Abbreviations: CIP, competitive industrial performance; CFP, carbon footprint; RE, renewable energy; IND, industrialization; GDP, gross domestic product; GLB, globalization.
*, **, and *** refer to levels of significance at 1%, 5%, and 10%, respectively.
Conclusion
This research assessed the impact of CIP, IND, and RE on CFP in 13 developing Asian countries. The statistics obtained from the analysis ratify the existence of CSD, heterogeneity, stationarity, and panel cointegration within the selected study factors from 1993 to 2021. The long-term and short-term influence of CIP and IND on CFP and the contribution of RE to CFP mitigation have been identified with greater precision by employing the CS-ARDL and AMG approaches.
The long-term and short-term results affirm that CIP and IND are strongly linked to increasing CFP. Conversely, RE is significantly, profoundly, and beneficially associated with reducing CFP. The long-run results illustrate a notably significant and greater value compared to the short-run outcomes pertinent to the repercussions of CIP, IND, and RE on CFP. It's additionally essential to recognize that economic progress and GLB both contribute to the CFP in these countries. The results suggest that these indicators have a substantial cause on the accumulation of CFP. Beyond a certain threshold of economic growth, GDP has an inverse relationship with CFP, leading to a decrease in CFP as GDP continues to grow. Globalization has led to an increase in economic interaction and investment. However, as sectors move towards more carbon-intensive activities, there is a risk of increasing the CFP due to the dependence on global value chains. Inconclusive remarks, the notions of CIP and IND are significant indicators for evaluating the rate at which CFP are expanding in the designated economies. Such development undermines sustainable progress and poses a critical global challenge in the fight against climate change.
Policy implications and future directions
By drawing upon the empirical evidence, we hereby delineate an extensive array of practical implications concerning the subjects under investigation.
It is recommended to establish green industrial zones that promote green industrial comparative advantages. Industries within these zones that actively work towards reducing their CFP and improving environmental quality should be granted tax relaxations. Conversely, industries that choose not to operate within green industrial zones or fail to introduce green transitions in their operations should face higher taxes and penalties. The revenue generated from these financial penalties can be further invested in promoting green CIP.
Offer an industrial mechanism that encourages industries to adopt circular economy practices, such as reducing waste, reusing materials, and recycling products. This approach fosters responsible production and consumption patterns, leading to reduced production processes, energy consumption, material consumption, cost reduction, and enhanced environmentally friendly CIP.
Introduce a green logo and labeling system for products manufactured using environmentally friendly initiatives. This will enhance the sales of these products, encouraging green CIP and motivating other industries to follow the same path. As more customers shift towards environment-friendly products, industries will be incentivized to adopt sustainable practices to remain competitive and maintain market share.
Introducing green competitive industrial units will help industrialists purchase energy-efficient and eco-friendly plants and machinery. Training the labor force to operate this new equipment will contribute to a gradual green industrial revolution. To further encourage this transition, it is essential to set deadlines for energy-intensive, outdated, and highly polluting industries to switch to updated, energy-efficient plants and technologies.
Establish a uniform green transportation system for industries to shift raw materials and finished products from one area to another. This will help reduce the use of fossil fuels and mitigate the industrial transport and supply chain CFP.
Based on RE results, it is recommended to divide industrial units according to their energy intensity. Energy-intensive and consistent energy-user industries should be located in the hydropower energy zone, while less energy-intensive industries should be in solar or wind energy zones to maximize output and reduce the industrial CFP. This mechanism would contribute to reducing maintenance costs for grid stations, power plants, and transmission lines while also helping to minimize energy fluctuations.
Encourage the use of environmentally friendly technology, such as carbon capture and storage (CCS) in industrial plants and industrial zones to prevent the spread of greenhouse gases into the atmosphere. CCS technology is designed to absorb carbon dioxide emissions from industrial operations and subsequently store them underground. This can aid in mitigating greenhouse gases in the atmosphere.
Future research endeavors should explore the possibility of conducting tests that involve a longer time frame and incorporate additional influential and control factors. These factors could include environmental technologies, environmental inequalities, digitalization, technological development, and environmental regulations. Panel quantile autoregressive distributed lag model and asymmetric estimation can be performed for future work.
Study limitations
This study mainly examined the developing countries in Asia, specifically reviewing data from 1993 to 2021. The precision of our estimation depended on a specific collection of factors and countries. Therefore, if any of these countries and parameters were included or excluded, it could have resulted in different outcomes. This research is conducted utilizing innovative estimation methodologies such as CS-ARDL and AMG, which means that the results may vary if a different estimate technique is employed in the study.
Footnotes

Funding
The authors received no financial support for the research, authorship, and/or publication of this article.
Declaration of conflicting interests
The authors declared no potential conflicts of interest with respect to the research, authorship, and/or publication of this article.