



Abstract
Our research addresses the increasing concern of interdependency in the global financial markets, especially the stock market of G20 nations (Australia, Argentina, China, France, Japan, and the USA) and the WTI (West Texas Intermediate) oil market between January 2017 and September 2025. The dynamic connectedness approach and quantile VAR are a strong check as we use them to determine the spillover effect in various market conditions. We find that the spillover effect in bullish and bearish market conditions is strong with the Total Connectedness Index (TCI) of 71.98% and 70.25%, respectively. In the normal case, the highest connectedness effect is achieved at tau=0.5, and this result is consistent with the dynamic TCI of 39.12%. Based on the varying market conditions, USA, Australia, and France are strong net transmitters, but WTI is a net receiver in a bullish and bearish market situation, then Argentina, China and Japan, respectively depending on the return spillover effects. The USA, France, and Australia can strengthen their leading position as a net transmitter in the volatility spillover. Japan is a net transmitter in bearish market conditions only in the volatility series, and it is a net transmitter in bullish market conditions only in the return series. This became particularly clear during the global epidemic, the war between Russia and Ukraine, and the ongoing tariff war. In general, our study points to the increased role of the USA stock market in world markets concerning WTI. These findings can be used by investors and policymakers to maximize returns and ensure market stability.
Introduction
The oil market has been much more financialized and integrated into the global financial market, which is driven by the rapid development of futures, options, and other derivatives.1,2 The share of investments made by institutional investors in commodities, including oil futures, has increased.3,4 This implies that variation in the price of oil cannot be attributed to only exogenous shocks to the macroeconomic variables but can also be subject to systemic financial risk by other financial markets. 5 In particular, the oil and financial markets have become more closely correlated due to speculative activity and the flow of global funds. 6 The 2008 global economic downturn provides data indicating that the oil and stock markets have been subjected to extreme turbulence almost simultaneously as a result of the worldwide economic recession. 7 Connection between fuel price variations and stock markets is therefore becoming subject to increased research and business stakeholder interests. 8 This augmented focus can be valuable for providing substantial information on predicting effective portfolio plans and reducing risk.
The volume of crude oil in global trade is more than any other commodity since the year 2000 and therefore its impact is important not only on the economic environment of the world economic system but also on the economy of the individual countries. This spillover effect is not limited to national economies but extends to the financial markets and share prices listed on the markets. The role that oil market dynamics can play in the instruments used in financial markets is very important. The present paper specifically examines the relationship between the oil market and the financial market in the scenario of the G20 economies. Generally, the interconnection between the stock markets and the oil markets, particularly in regard to returns and the volatility spillover effect, has been of significant interest to both researchers and investors as well as policymakers.
There is also a considerable volume of research focused on the study of the real relationships between different asset markets with the intention to identify the possible factors that may lead to the connectedness of different markets.9–13 As an example, the share price was correlated with numerous economic variables, such as the energy prices and the inflation rate.14,15 Moreover, certain questions underline the hedging strategy application through exploiting the interrelatedness of gold and other resources. The current interest of gold is not only related to its ability to diversify, but it is also the recognized status of gold as a store of value, which can be regarded as a safe haven. 16
The current literature on spillover effects is characterized by a lack of in-depth empirical studies that provide insights into it on a global level. The existing literature is mainly focused on the way the effects are transmitted between a limited number of stock markets, which are usually classified according to their level of development (i.e., developing or developed). Alternatively, other studies also study a single stock market together with various other assets.17–19 The G20 stock markets could be considered an appropriate source for investigating volatility spillover effects, as it provides a complete dataset. During that, the markets constitute a substantial part of the Gross World Product since more than 85 percent of it is represented by these markets, and it also generates more than 80 percent of global trade. This block is able to capture the major changes in the global economy.18,19
The GARCH-BEKK model can capture spillover effects, which provides an advantage over other available spillover models, including stochastic volatility and the spillover index released by Diebold and Yilmaz.20,21 This is done by computing the variance-covariance matrix and extracting volatility directly out of it but does not impose any constraints on the conditional correlation structure. However, in examining the interconnectedness of most series e.g., those within the G20 framework; the GARCH-BEKK model fails to appropriately deal with the large multidimensional effects of spillovers within the system as a whole. Therefore, some research studies have integrated complex network theory in their econometric models to create a financial market network.18,19,22 The main advantage of the use of the integrated methodology is that it overcomes the problems of the GARCH-BEKK methodology in multidimensionality, in addition to providing a clear profile of the intricate financial system. The research by 23 involved the application of the GARCH-BEKK model and complex network theory to the process of transmission of volatility spillover between the G20 countries’ stock markets based on the existing literature. The researchers noted that volatility generated in one specific market spreads fast in the network with the main recipients and sources of volatility being South Korea and Brazil. Zhang et al. 19 further extended the study to divide the G20 financial markets into the four different blocks of spillover. They focus on how the US government has increased tariffs (significantly in mid-2018), which will affect other G20 markets with an economic effect. Although the two studies make no reference to data happening during the COVID-19 time period, it does note that the period when market interconnection was the most intense happened in 2008 in the course of the global financial crisis.
The motivation of the study lies in understanding the complex nexus between the WTI crude oil market and stock markets of G20 countries. The research intends to identify the dynamic interconnection and transmission of shocks across different markets by examining the spillover effects of returns and volatility. This research is critical for understanding how oil price swings affect stock market performance and identifying potential possibilities and concerns for investors and governments. The study's advanced econometric tools and network analysis provide significant insights into the complex interactions that shape global financial markets.
The selected countries (which were already mentioned) offer a strategically balanced fraction of the G20, such major world economies (USA, Japan, France, Australia), developed economies and emerging economies (Argentina, China). This sample will allow the research to identify different financial systems, geography, and response to oil price volatility. These nations are either large producers or consumers of oil in the world market, thus very relevant in the determination of how oil shocks are transmitted to financial markets. The inclusion of all G20 stock market prices extends dimensionality and complexity of the data; this will render the data more difficult to understand, particularly when applying the quantile connectivity approach. Moreover, the availability and quality of data from these markets permit intensive empirical modelling. The inclusion of WTI oil is essential, because it is a universally recognized global standard of crude prices and a very critical factor in defining macroeconomic and financial statuses of the selected nations.
Despite the extensive literature on the G20, the study fills a gap by assessing the scarcity of research on connectedness in the age of the COVID-19 pandemic and recent geopolitical unrest worldwide. The Diebold-Yilmaz framework assumes symmetric shock transmission between markets, however the GARCH-BEKK model is inadequate in managing the extensive multidimensional spillover effects inherent in the entire system. In contrast, our analysis employs a quantile connectedness method, allowing us to capture tail risk and asymmetric spillover dynamics across G20 markets such as China, Japan, France, Australia, Argentina, and the United States. The quantile connectedness approach allows us to address the spillover impact between bullish and bearish market conditions, as the conventional GARCH-BEKK and Diebold-Yilmaz models fail to do. Additionally, considering the quantile connectedness approach with the time-varying dynamic connectedness approach, we gain complete information on how these markets are interconnected during the normal circumstances. This dual method expands on prior research by providing distribution-sensitive and time-varying insights on G20 integration. Therefore, this study has two separate goals, which are described below: 1) Assessing the correlation of returns between WTI oil and financial markets within G20 countries under different market conditions. 2) Evaluating the nexus between the volatility of WTI and the stock markets in the G20 countries under various market conditions. In addition, we apply quantile VAR, which is recommended by Bahera and Rath 24 in their study. We consider different markets, such as bullish and bearish situations, with tau equal to 0.9 and 0.1, respectively. However, for normal market conditions, we consider tau equal to 0.5 and compare its results with the Time-Varying Parameter Vector Autoregression (TVP-VAR) methodology. This method was first presented by Antonakakis et al., 25 who used the Kalman filter to compute the dynamic connectedness between the set of variables. Compared to previous econometric methodologies, this particular methodology possesses certain characteristics. 1) Setting the interval for the rolling algorithm arbitrarily is not necessary. 2) In the presence of a huge dataset, this approach yields reliable results. 3) This method does not exhibit sensitivity to outliers. 26 This study employs computed connectedness metrics to inspect the connection between the oil and financial markets (G20) during the period from January 24, 2017, to September 22, 2025.
The remaining sections are laid out in the following way. Sections 2 and 3 of the paper discuss literature review, data, and advanced statistical models, respectively. Section 4 presents the graphical depiction and empirical results. Section 5 contains the conclusion and policy implications.
Literature review
Numerous prior studies have examined the nexus between diverse economic and financial variables. Umar and Suleman 27 assessed the nexus between stock prices and a list of economic and financial variables. Similar studies on this topic have also been conducted by Riaz et al. 28 and Stereńczak et al. 14 Contrary, researchers looked into the nexus between gold prices and other asset values.10,29 Some studies examine how the energy market relates to other material markets, including those for agricultural products. 30 Although the market for crude oil is considerably more significant than that of gold, Cai et al. 30 claimed that soaring crude oil prices may tend to surge in agricultural product prices.
The price of crude oil is a critical and essential raw resource for industrial production, and any fluctuations in its value can have a direct effect on the output. The impact of changes in oil prices on macroeconomic variables is mediated through six transmission channels, as theoretically established by Brown and Yücel 31 There are several routes that affect marginal production costs, output, money demand, domestic inflation, monetary policy, and industrial structure adjustment.32,33 The marginal cost of production in numerous industries can be raised by oil price disruptions, as illustrated in Figure 1, leading to a decline in production. This occurrence is widely recognized as the supply-side shock effect. However, tight monetary policy can result in lower long- horizon production through higher interest rates and lower investment when the apparent inflation is the result of cost shocks, such as rising oil prices. The federal fund rate increases in response to a favorable change in oil prices, as shown by Bernanke et al. 34 The implementation of a more restrictive monetary policy was the main factor contributing to around 66% to 75% of the decline in U.S. economic production following an oil shock. Tang et al. 32 employed a structural VAR model to discover the relationship between oil prices and several economic indicators. Their results reveal that higher oil prices have a detrimental effect on investment and output but a beneficial effect on China's inflation rate and interest rate.
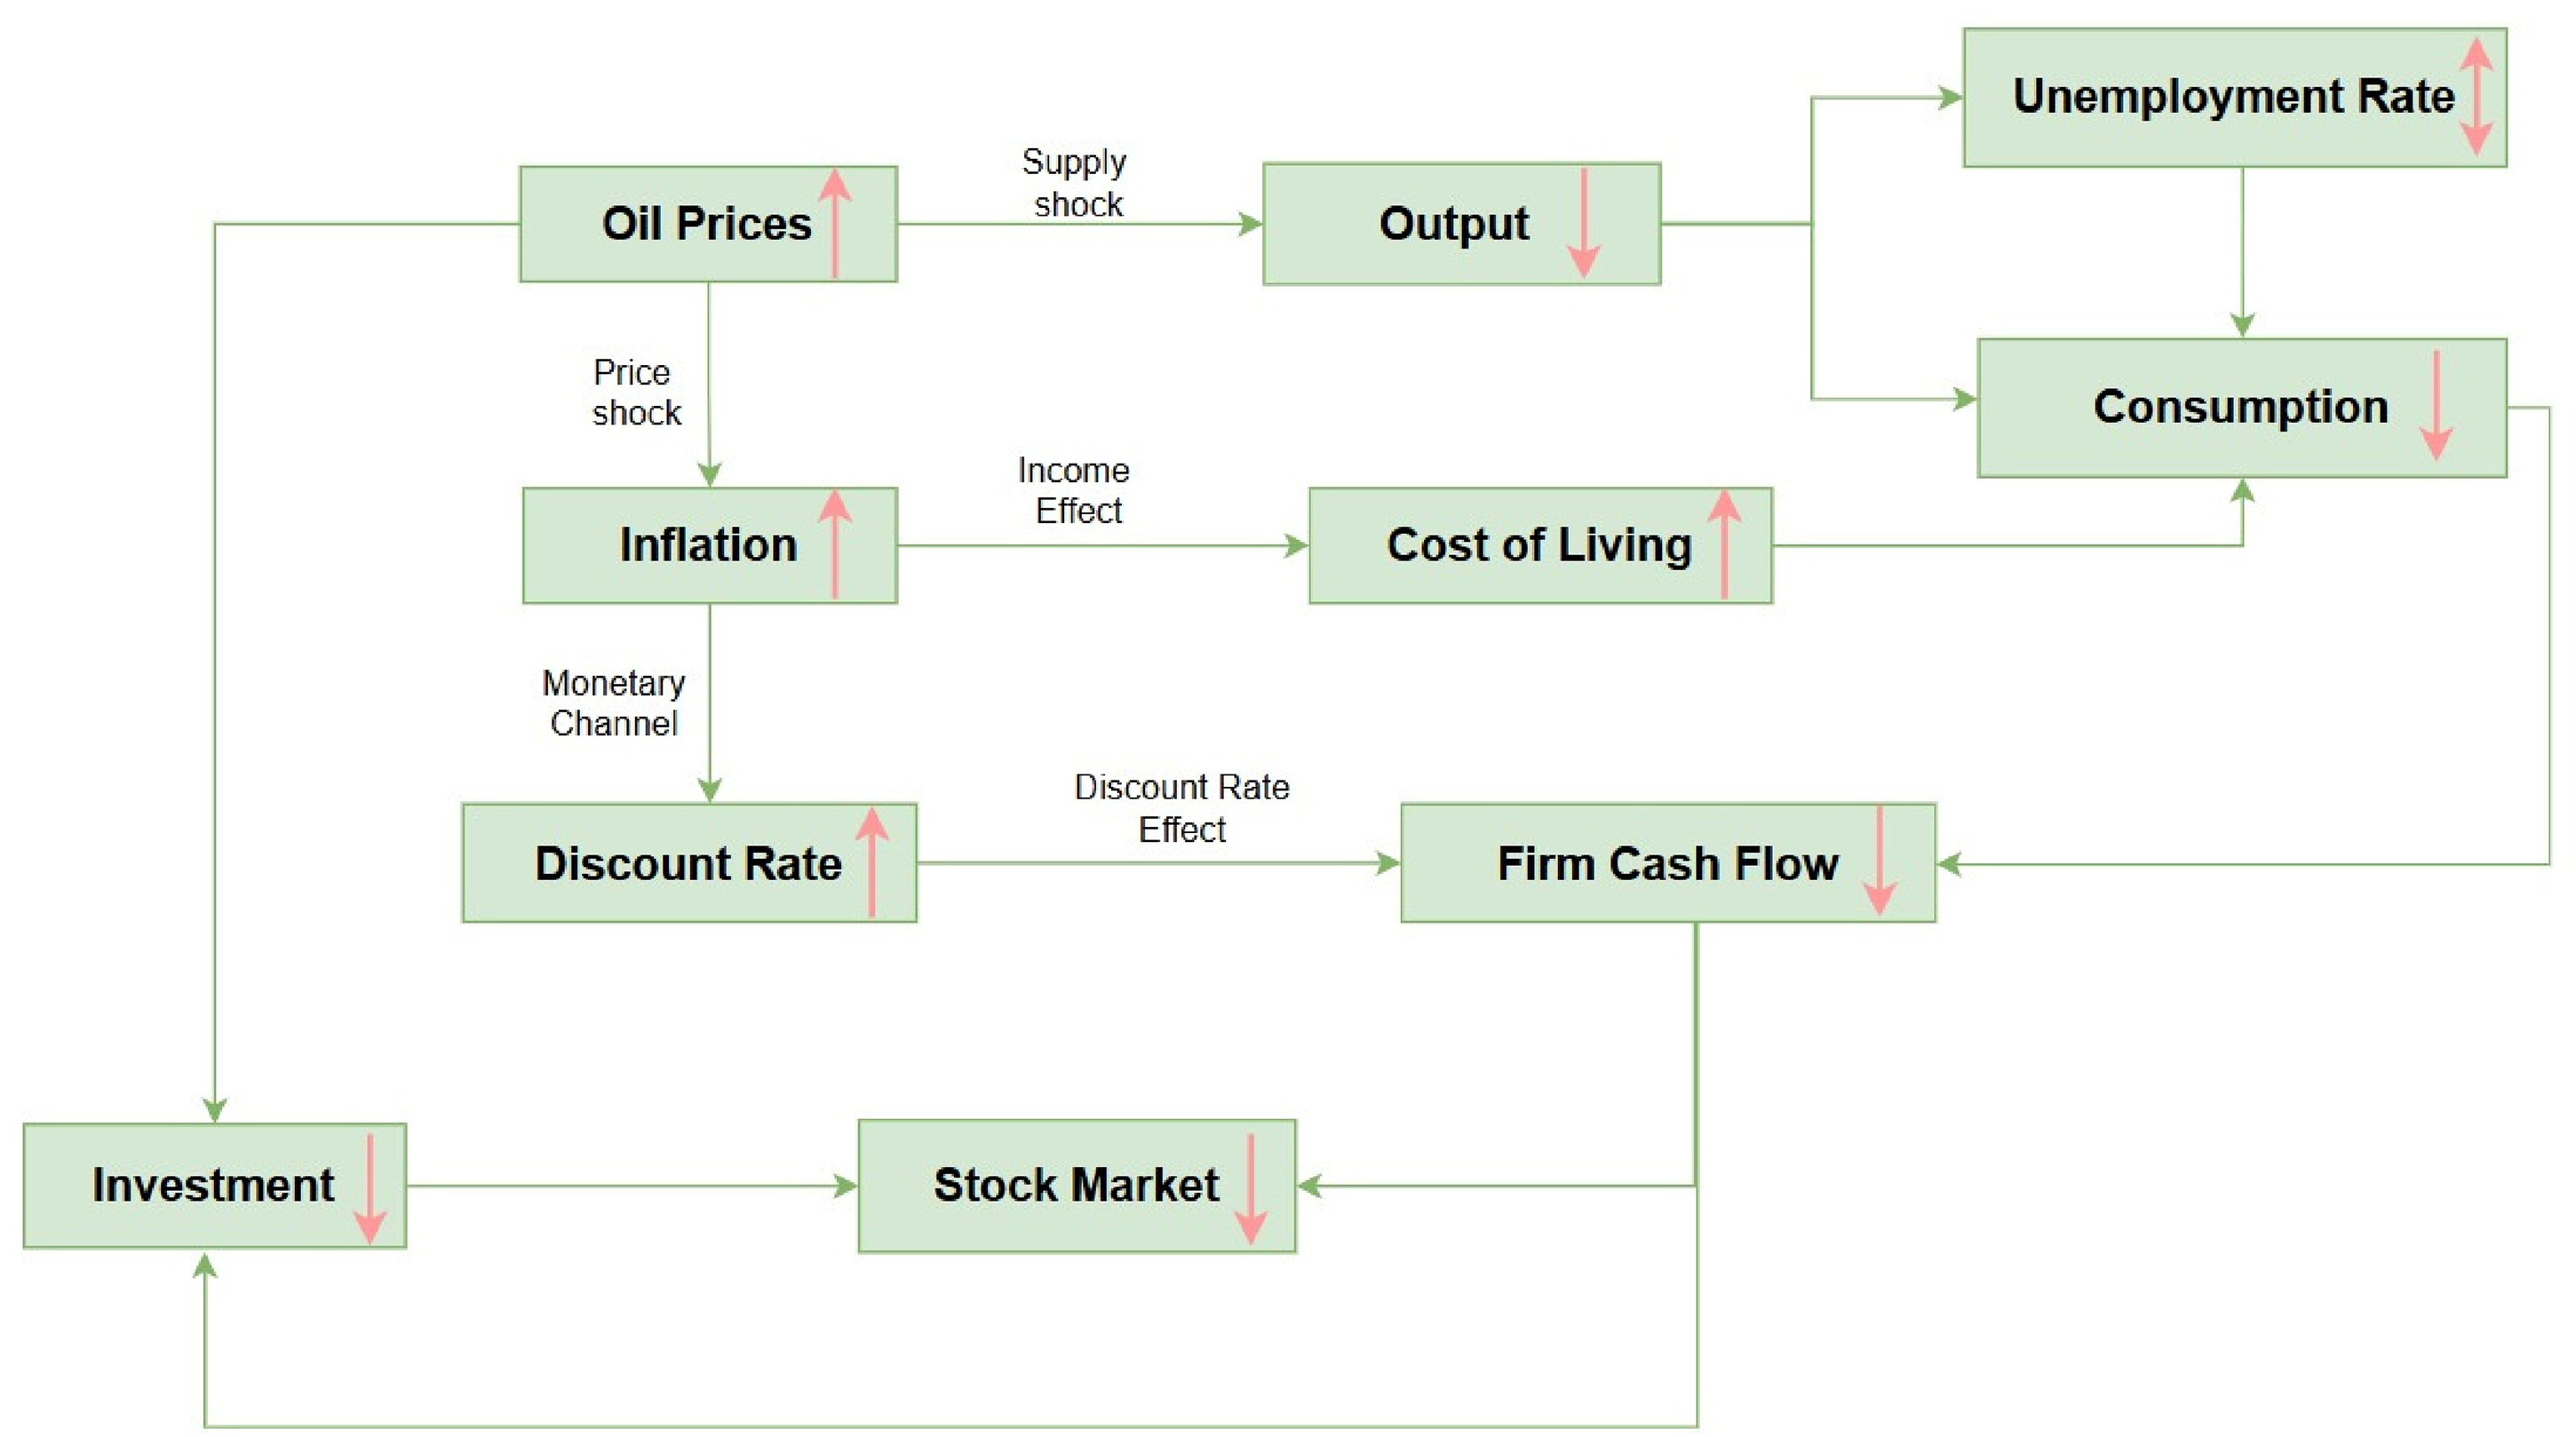
Transmission channel of oil prices to stock market. Source Tang et al. (2010).
Hamilton 35 underscored the adverse effects of positive oil price shocks on the growth of the United States economy. Subsequently, other studies have provided ample evidence to establish the presence of a non-linear nexus between oil prices and economic factors.14,27,28,36 Hence, the association between economic factors and the oil market exhibits a distinct dependency.
According to these findings, stock market prices, as crucial macroeconomic indicators, are not only primary measures but are also sensitive to oil price fluctuations. 37 The cross-market connection may be influenced by variations in stock market systems between nations. There are differences between the stock markets in the United States, Japan, and Australia in terms of market depth, investor mix, regulatory frameworks, and liquidity circumstances. Particularly under both bullish and bearish market conditions, these structural traits may result in diverse reactions to changes in the price of oil. These structural characteristics can lead to varied responses to price variations in oil, especially when there are bullish and bearish market conditions. The U.S. stock market, including the S&P 500, is mature, dominated by institutional investors, with significant market liquidity and open capital markets. Compared to the U.S. market, China's developing market status causes it to be less sensitive and responsive to shocks. However, the studies show that Chinese stocks are more affected by shocks in the U.S. market than the other way around. This is partly because China's financial integration has not been complete in the past. Asymmetries in the transmission of volatility arise due to these structural differences.38,39 Abbas et al. 40 examined the G-7 countries’ stock markets and macroeconomic factors, with a particular emphasis on returns and volatility. They used a monthly dataset and found that macroeconomic variables are significantly correlated with the first two moments of the G7 stock markets. Zhu et al. 41 employed the CQ approach to evaluate the connection between stock returns and volatility in oil in case of BRICS markets. They discovered that the high quantiles of oil volatility, both high and low, exhibit a greater ability to predict the direction of returns for BRICS countries. Ji et al. 42 conducted a study on BRICS nations to investigate the transmission mechanism between the stock and oil markets. The results of their study demonstrated that a relationship exists, which fluctuates over time, between the interconnectedness of stock and oil markets. In contrast, a substantial transmission of volatility contagion from oil-specific demand shocks to stock returns has been observed. Guesmi and Fattoum 43 asserted that the dynamic relationship between nations importing and exporting oil is indistinguishable. Additionally, their findings indicate a positive increase in cross-market movements during substantial shocks in both aggregate demand and oil prices. This increase can be attributed to fluctuations or disturbances in the global business cycle, as measured by conditional correlation coefficients. Wei et al. 44 have recently discovered that the epidemic has caused the propagation of oil shocks in U.S. stock markets. Rahman 45 observed that there is an uneven feedback of stock returns to both adverse and positive oil price shocks. Hashmi et al. 46 presented empirical support for the notion that the influence of oil price shocks on stock prices varies according to the status of the stock market. During the COVID-19 era, Guru et al. 47 discovered significant mutual linkage between the oil and stock markets.
Gomez-Gonzalez et al. 48 examined the linkage between Brent oil prices and seventeen stock market indices of significant economies heavily reliant on oil. The study focused on the connectedness between these markets and the specific characteristics of how information and effects are transmitted and received. Their findings suggest a transfer of influence from the stock market to oil prices, and this relationship fluctuates significantly over time. The study conducted by Antonakakis et al. 49 investigated the dynamic relationship that exists between oil price disruptions and stock market returns in nations that import and export oil. The results show that during economic turmoil, aggregate demand shocks are the major channel through which shocks are transmitted to stock markets. Conversely, supply-side and oil-specific demand shocks are the major factors that cause geopolitical instability. Jiang et al. 50 performed a thorough study of the relationship between the returns of the stock markets of the Group of Seven countries and the price of crude oil. The authors conducted a study of the time-varying interdependencies on the stock market and oil prices through SVAR model. They evaluated the dangers of two cases where there is predominance of oil prices or the stock market. Moreover, the study examines the dynamic links that prevail between the oil prices and decomposing stock returns. The relationship between oil price fluctuations and the stock market was analyzed using quantile-quantile and connectedness techniques and focusing on how the tails depended asymmetrically. Le and Luong 51 used TVP-VAR and demonstrated that there is a time-varying relationship between oil prices and stock returns as well as a weak dependence of the variables examined.
The interdependence of market volatility has significant consequences for policy and investment decisions, particularly during financial instability like the Global Financial Crisis or the COVID-19 crisis. The influence on emerging markets is greater than that on developed markets. Ji 52 observed that the concurrent linkages in oil prices and stock markets had become even greater after the subprime crisis. Gold prices exert a direct influence on the stock market prices of the BRICS countries, according to Raza et al., 53 whereas all emerging stock markets are adversely influenced by oil prices. Shi 54 employed the continuously varying spillover index as a tool for investigating the interconnections among the selected nations. It has been demonstrated through evidence that the interconnectedness of the stock markets can be observed in both returns and volatility, particularly during the outbreak of systemic crises. The following studies had similar findings.30,55–59 In the context of econometrics, a significant body of existing literature mostly employs the connectedness measures developed by Diebold and Yilmaz,20,21,60) to examine the interconnections between various markets. These measures are mostly estimated within the VAR paradigm. The estimation of connectedness measures is based mostly on two factors in conjunction with other developments in the economics analysis. Barunik and Krhlevik 61 developed a new system of assessing the interdependence of financial variables, which arise when responding to shocks with different frequencies. The spectrum representation of the variance decompositions is suggested as one of the ways to examine how interconnected different short, medium, and long-horizon financial cycles are. Antonakakis et al. 25 applied the TVP-VAR model, originally described by Diebold and Yilmaz21,60 to calculate dynamic connectivity indicators. The approach enhances the analysis because it provides a strong framework, which can be used to present potential shift in the data states over time. This approach avoids arbitrariness in choosing the rolling algorithm interval and does not introduce any missing data in the calculation of dynamic measures of connectedness. Moreover, the algorithm is not sensitive to outliers because the Kalman filter algorithm is used. 26 According to studies above, there is seemingly an apparent relationship between the stock market and the oil markets in terms of returns and volatility. Considering the existence of different uncertainties due to the external factors, the question arises whether any patterns in the degree of interconnections are shown in the context of returns and volatility.
Adebayo et al. 62 employed a time-quantile connectedness model, which factors in tail-dependence under different market conditions to investigate the response of energy and significant financial assets to global financial risks. Their results show that risk transmission between the energy and financial markets is asymmetric, whereby the transmission is more pronounced in times of extreme volatility. This paper highlighted the role of energy assets in transmitting risks in turbulent periods, which is valuable to policy stability and portfolio diversification. Adebayo 63 studied the impacts of climate policy uncertainty (CPU) on the energy and precious metal markets under varying market conditions and time horizons based on a multi-frequency analysis of the quantile. It is found in the time-frequency dimension that short term shocks are not of the same magnitude and direction as long term effects, and the markets respond more and asymmetrically on higher quantiles of CPU. Based on the wavelet cross-quantile regression and a new ESG-based sustainability uncertainty index (ESGUI), Olanrewaju et al. 64 examined the impacts of sustainability risk associated with ESG on the prices of oil, heating oil, and natural gas. They find that ESG uncertainty temporarily reduces fuel prices, especially in bearish or moderately active markets, but increases them in the long run, most arguably because of supply problems, regulatory risk, and hedging behavior. 65 used a multi-frequency quantile regression to investigate the sectoral response of Co2, open climate policy. With a multi-frequency quantile framework, Adebayo 65 examined how sectoral CO2 emissions respond to uncertainties in economic and climate policy. The study shows that moderate uncertainty leads to an increase in emissions whereas extreme uncertainty leads to a decrease in emissions, which are asymmetric, industry-specific reactions. In any case, it points out the distortive effects of inconsistent signals on policy towards emission trends.
Data and econometric model
Data
Our stock market index price history data includes the G20 (including USA, Japan, China, France, Argentina, Australia, and WTI oil). The considered time frame is from January 24, 2017, to September 22, 2025. The empirical analysis based on daily return series. The magnitudes of the returns were taken as the stationary variables to determine the market volatility.
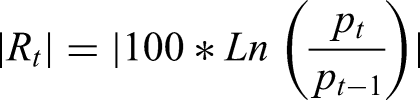
Table 1 shows the data description of the return series, whereas Table 2 shows the unconditional correlation. The descriptive statistics reveal interesting findings for investors. Table 1 illustrates that most return series are left skewed and have kurtosis values exceeding 3, signifying the presence of heavy-tailed distributions. The results of the Shapiro test, skewness, and kurtosis tests further supported the distributions’ non-normality, as this test is frequently used for testing normality. 66 The Shapiro test output provides additional support for the assertion that the series under consideration is non-normal. The ADF test provides evidence that all the series under consideration do not exhibit a random walk. On the other hand, the Ljung-Box test indicates that only the China series exhibit an absence of significant autocorrelation at lag 20 (Q_20). Table 2 shows the correlation between the return series. Before doing econometric modelling, we evaluate the unconditional correlations among the seven covariates of the return series. The highest and most significant correlation was observed in Argentina's return series with WTI equal to 0.136, followed by France and the USA with correlations equal to 0.126 and 0.118.
Summary statistics at return.

*Indicates level of significance: *10%, **5%, and ***1%.
Correlation matrix at return.
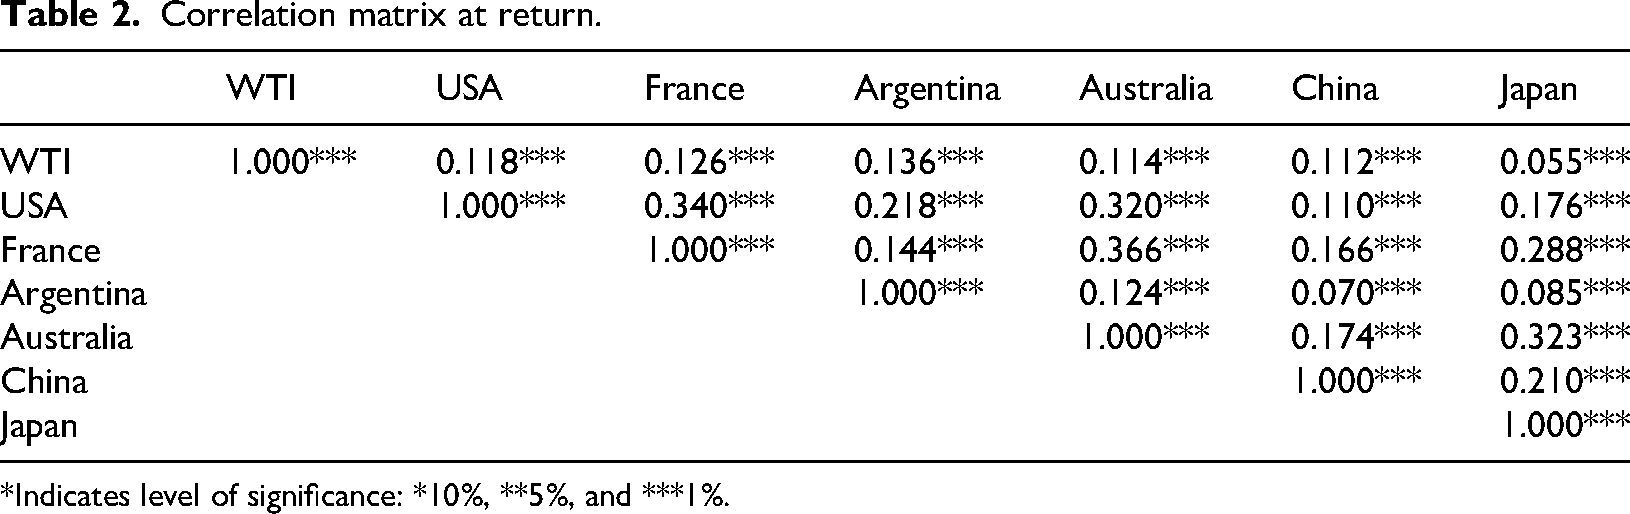
*Indicates level of significance: *10%, **5%, and ***1%.
Quantile VAR
The link between

Consequently, the pth order n-variable quantile VAR process looks like this:


Whereas,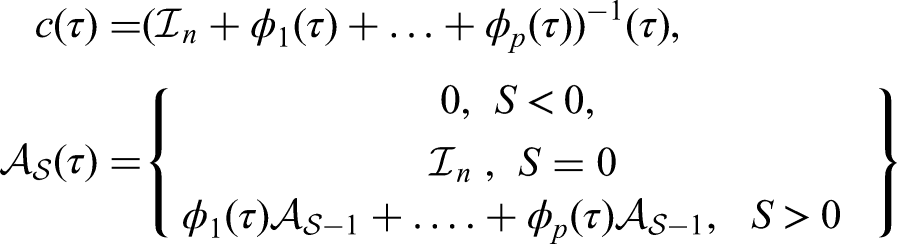
At each quantile τ, we calculated multiple return connectivity measures using the methodology developed by Ando et al., 68 which developed upon the mean-based measurements introduced by Diebold and Yilmaz. 21 The following connectedness metrics, as described by Jena et al. 69 as an infinite order vector moving average (MA) process, are found at each quantile: Chatziantoniou et al. 70 demonstrated the effect of a change in one variable (i) on another variable (j) using the H-step ahead generalized forecast error variance decomposition (GFEVD). The equations (11) to (16) below define the total connectedness index, FROM, TO, Net, and Net pairwise connectedness indexes, which are identical for both methodologies considered in this study (quantile VAR and dynamic connectedness index).
Dynamic connectedness approach
Diebold and Yılmaz
60
presented a connectivity approach that comprehensively encompassed the concepts of GFEVD and generalized impulse response functions (GIRF), which were originally proposed by Koop et al.
71
and Pesaran and Shin.
72
The most advanced methodology in the connectivity approach for spillover effects is the dynamic connectedness approach presented by Antonakakis et al.
25
The process commenced with the estimation of the parameters of the TVP-VAR model through the application of the Kalman filter technique. Subsequently, the output from the GFEVD is employed to build several dynamic connectedness indices, allowing for the analysis of the extent and direction of transmission effects among a set of variables. The lag order remains at 1 during the coefficient estimation procedure, and the dynamic parameter of the TVP-VAR(1) model is computed as given.

Next, we utilize the Kalman filter approach to fit the TVP Ct and variance-covariance matrix Σt. For a comprehensive understanding of the Kalman filter process, refer to the study carried out by Antonakakis et al.
25
Similarly, we may express Equation (1) in the following TVP VMA manner.
Additionally, proceed with the GFEVD procedure. Let 
Using the standardized equation (4), we get the dynamic connectivity index from variable j to variable i.
Similarly,
The dynamic net directional connectedness index and the dynamic total connectedness index can be obtained by using Equation (5). The following procedure yields the connection index, dynamic connectedness index, and dynamic net pairwise directional connectedness index:
Total connectedness Index: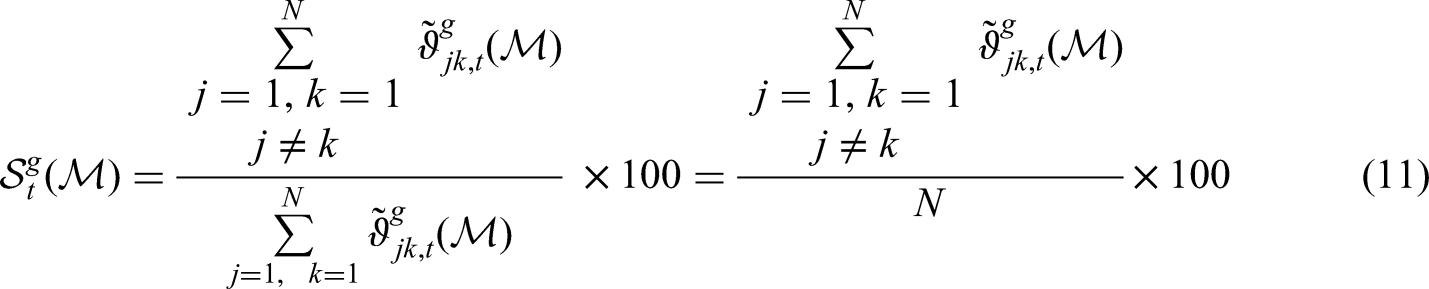
To determine the entire inducing magnitude FROM variable ‘i’ transfer to entire other variables j, a metric known as the directional connectivity TO others is utilized. In contrast, this approach additionally considers another metric called total directional connectedness FROM others to quantify the overall impact of the entire other variables j on variable I. The computations for both measurements are provided below:
FROM connectedness index: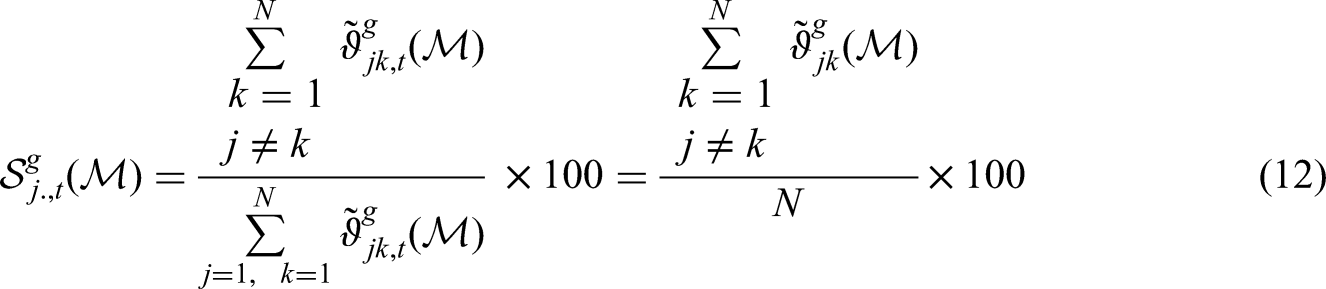
TO connectedness index: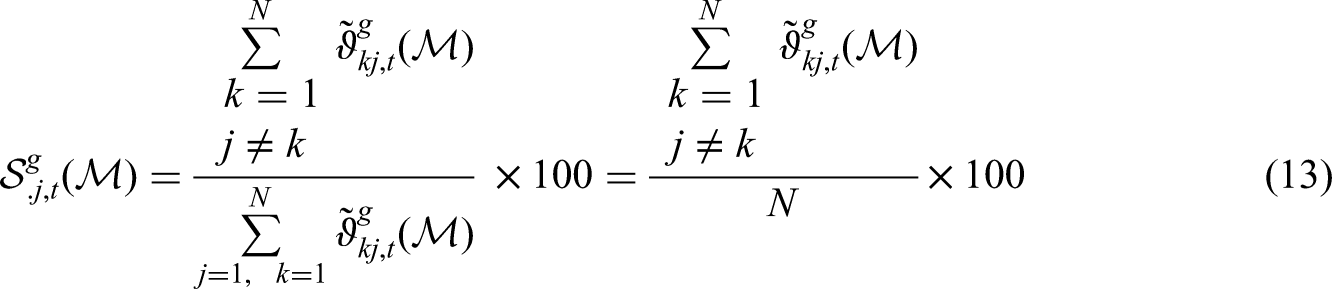
In addition to subtracting the “FROM” value from the “TO” value, another measure called “NET” is derived. This metric helps determine the primary affecting direction of the variable of concern. A positive value shows that shocks in variable ‘i’ have a noticeable influence on the whole network, whereas a negative value suggests that the influence mostly comes from the system itself rather than variable i. The computation methodology is illustrated as follows:
Net directional connectedness index:
Finally, the NET can be further disaggregated with the help of the bidirectional relationship through the computation of net pairwise connectedness (NPT). If the value of NPT turns out to be positive, it signifies that the variable i affects the variable j. Conversely, if it turns out to be NPT is negative, then it reveals that the variable j influences the variable i. The computation is presented in the following manner:
Net pairwise directional connectedness index:

Empirical analysis and discussions
This section investigates the return and volatility connectedness between the WTI market and the G20 financial markets. We divide the analytical part into two distinct sections. In the first half of the empirical section, we apply the dynamic connectedness model and quantile VAR with a tau equal to 0.1, which reflects the bearish market; 0.5, under normal market conditions; and 0.9, which reflects the bullish market condition, for both the return series and volatility. Meanwhile, the second part of this study focused on dynamic connectedness to examine volatility spillover effects using a quantile VAR. Section 4.1 analyses the impact of return with quantile VAR and dynamic connectivity approach. In Section 4.2, we analyze the volatility spillover effect by utilizing dynamic volatility connectedness indices and quantile VAR with different market circumstances.
Return spillover effect
In this section, we apply the quantile VAR approach to analyze the interactions between oil prices (WTI) and the stock prices of G20 countries under three distinct market conditions. To be more precise, we measure a bullish market condition with 0.9 quantile, a bearish market condition with 0.1 quantile, and a normal market condition. To cross-verify, the dynamic connectivity method suggested by Antonakakis et al. 25 is also used. Through this model, we can also investigate the time-varying spillover impacts of oil prices on stock prices in the normal market situation, which provides us with more information on the interrelationships between these two variables. The quantile VAR model and the dynamic connectedness model, when combined, will serve to provide an efficient and effective analysis of the relationships between oil and stock markets at varying market environments.
Quantile VAR
We apply quantile VAR to analyze the connectedness among different quantiles (τ equal 0.1 bearish, τ equal 0.5 normal and τ equal 0.9 bullish markets) that shows the observed significant dynamics between the prices of WTI (West Texas Intermediate) crude oil and the stock markets of Australia, Argentina, France, Japan, China, and the United States. Table 3 shows that there is significant information spillovers between the markets, in terms of both the information spilled and the information received on other markets, though the extent of the contribution of any market and the contribution to any market are quite different under different market conditions. Within the normal market conditions (50th quantile), contributions to and by other markets are between 14.44% (10.12%) and 53.39% (67.46%). Conversely, in bearish market (10th quantile), these contributions are between 64.15% (50.22%)-76.26% (87.93%). Contributions in bullish markets (90th quantile) range between 60.68% (44.21%) and 73.86% (82.87%).
Quantile-VAR return spillover connectedness.
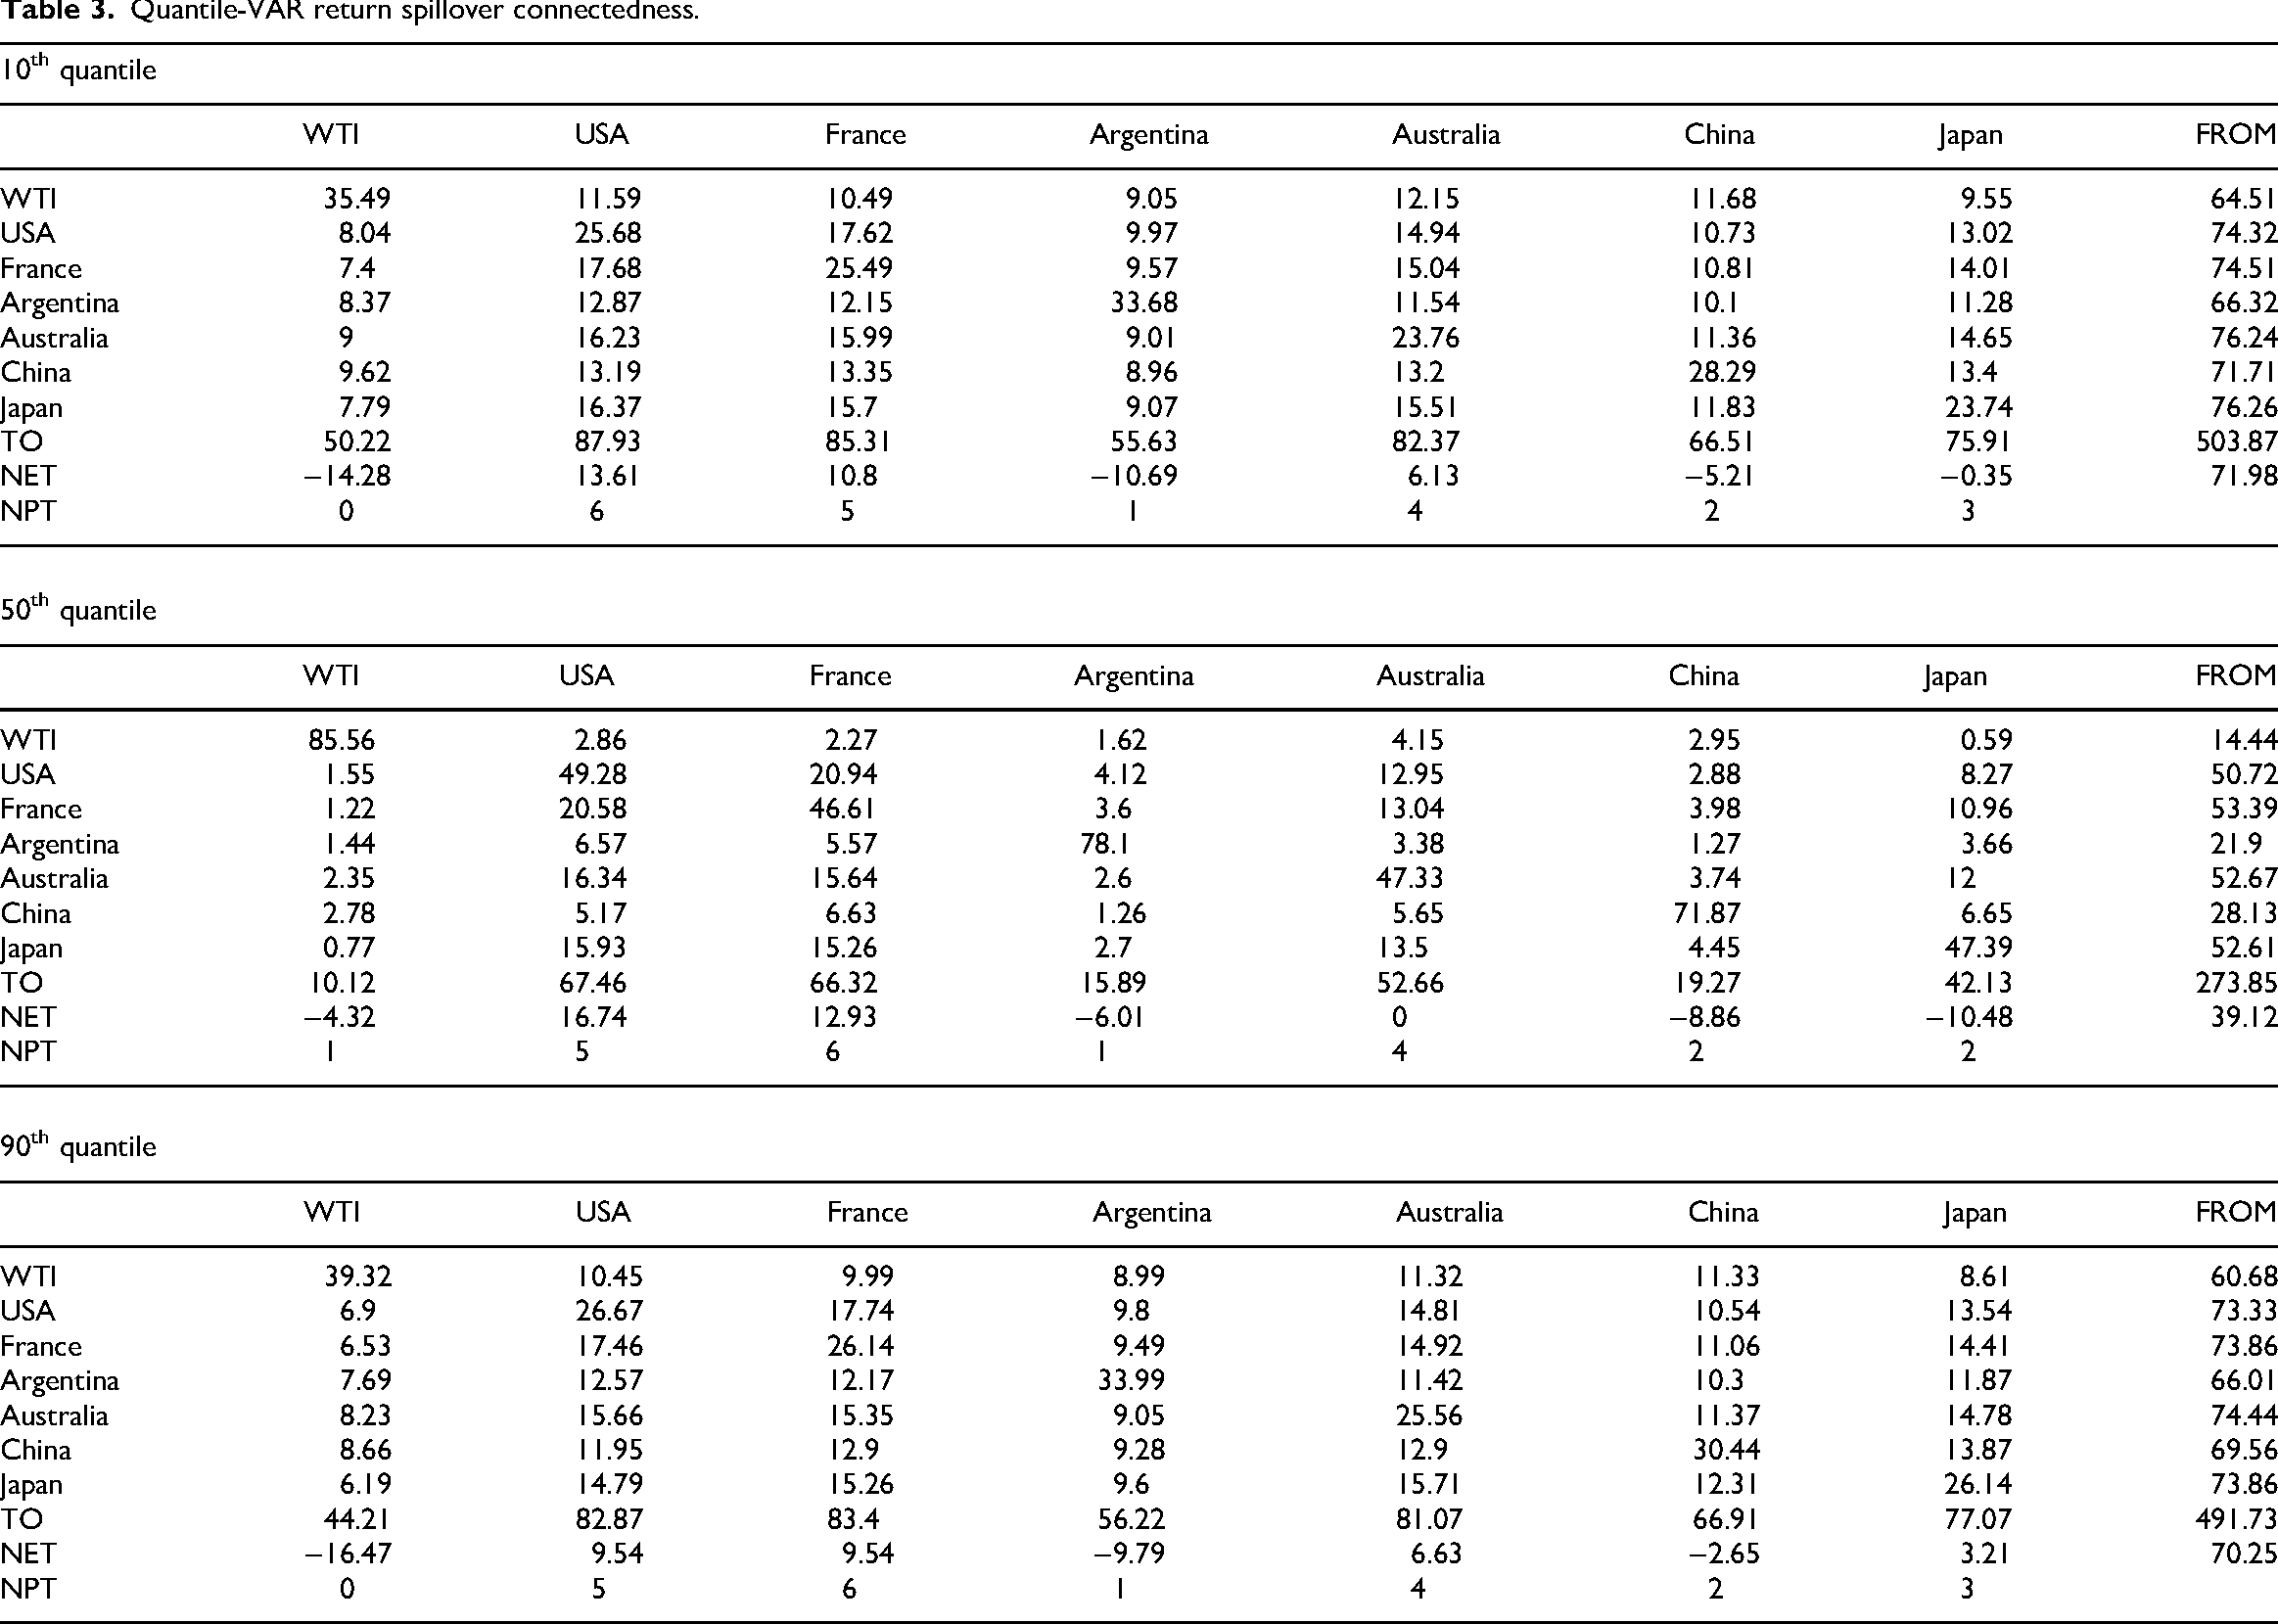
The United States, Australia, and France are always net transmitters at the regarded quantiles, which reflects their superior economic and financial positions. The United States, by its influence globally, and France, by its influential role within the Eurozone, play significant roles in passing shocks to world markets. On the downside, countries like Argentina, China and Japan (not including bullish markets) are mostly net receivers and are more prone to external shocks due to their smaller emerging-market economies. Japan becomes a net transmitter in bullish markets (τ = 0.9), because the sensitivity of the export-based economy to global demand makes Japan sensitive to bullish markets.
As a globally traded commodity, WTI shows a net reception of all quantiles indicating sensitivity of the commodity to global economic conditions. This implies that WTI prices are more sensitive to the trend in the sentiment of the world economy, particularly in major global economies like the United States. The global supply-demand relations, geopolitical events, and the overall market sentiment of the key economic players determine the spillovers related to WTI making it especially sensitive to external shocks and fluctuations of key markets. This finding is in line with the evidence that reported spillovers in both the bullish and the bearish states are stronger in all markets, with the COVID-19 crisis and economic environment affecting the spread of market shocks to a greater extent. 73
Return dynamic connectedness indices
Table 4 shows the dynamic connectedness of return of the WTI and the considered stock prices of G20 countries. Table 4 will be divided into three parts: the results of the whole sample are in the first part, analysis of the pre-Covid era is in the second part and results of the post-Covid era are in the third part. The findings reported in each part provide useful information on long-term patterns and changes. The results of different time periods compared as it provide a comprehensive understanding of the pandemic's broader impact on spillover connectivity. The overall extent of the TCI is 39.79%, showing that certain but weak linkages between these marketplaces exist over the entire timeframe. Meanwhile, the TCI of the pre-Covid era is 38.27%, and the post-Covid era is 40.73%. The NET is used to further investigate the interconnectedness of these markets in the form of transmitter and receiver, and the result is presented in Table 4. Across the time frame, the USA and France remain the net transmitters; the findings are aligned with quantile VAR result.
Dynamic connectedness of return.
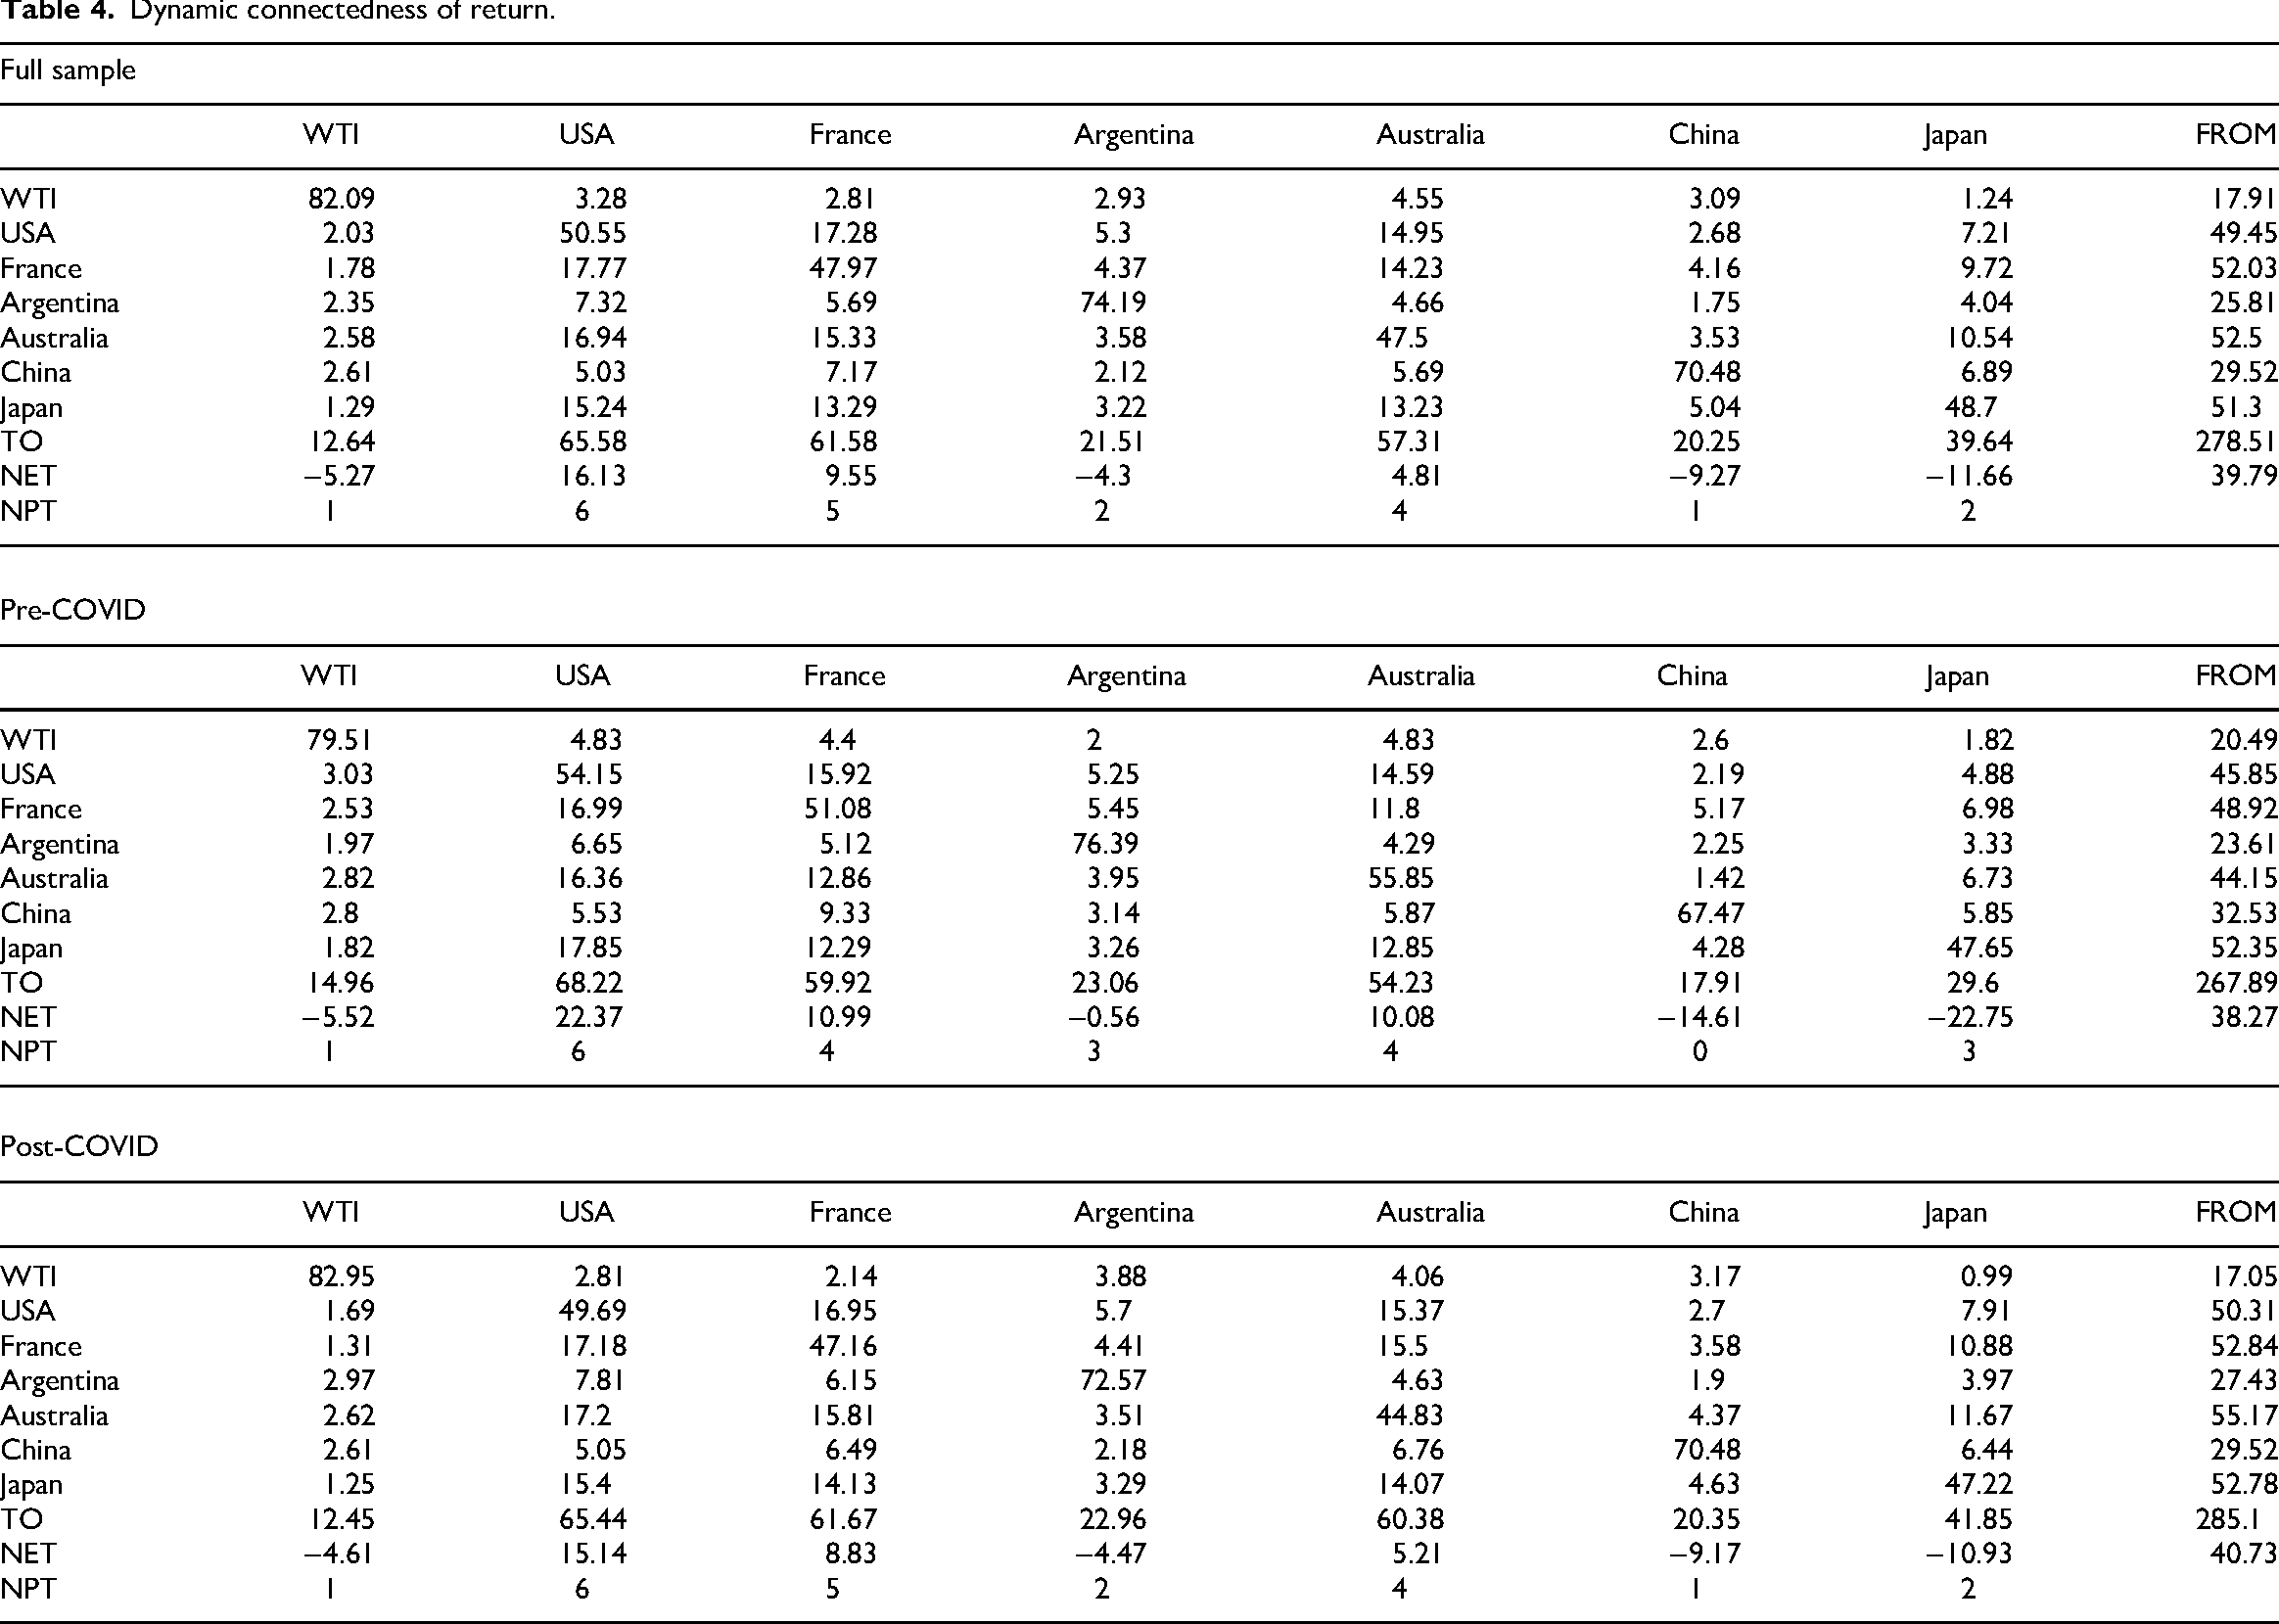
According to the findings, WTI, Argentina, and Japan show negative spillover values, but the USA and France show positive values. The WTI, Argentina, and Japan have negative spillover values of −5.27, −4.3, −9.27, and −11.66, respectively, whereas the USA, Australia, and France have positive spillover values of 16.13, 4.81 and 9.55, respectively. This implies that the markets of the net-receiving nations (Argentina, China, and Japan) with the WTI are influenced by the net-transmitting nations (Australia, France, and the United States). As a result of the exogenous shocks from the transmitting countries, the latter encounter unforeseen changes in returns, either positive or negative. To put it another way, the receiver nations may see enormous fluctuations in their returns because of both positive and negative external disruptions from the net-transmitters.
The Total Connectedness Index (TCI) Figure 2 illustrates how the stock market and WTI are influenced by world events such as pandemics and geopolitical crises. The TCI stayed stable from 2018 and 2020, although the COVID-19 epidemic caused a dramatic surge in the first part of that year. As the world economy recovered, the TCI fell but stayed high. Increased interconnection may be the result of trade disputes and tariff conflicts between major nations, as seen by the most recent rise in 2024.
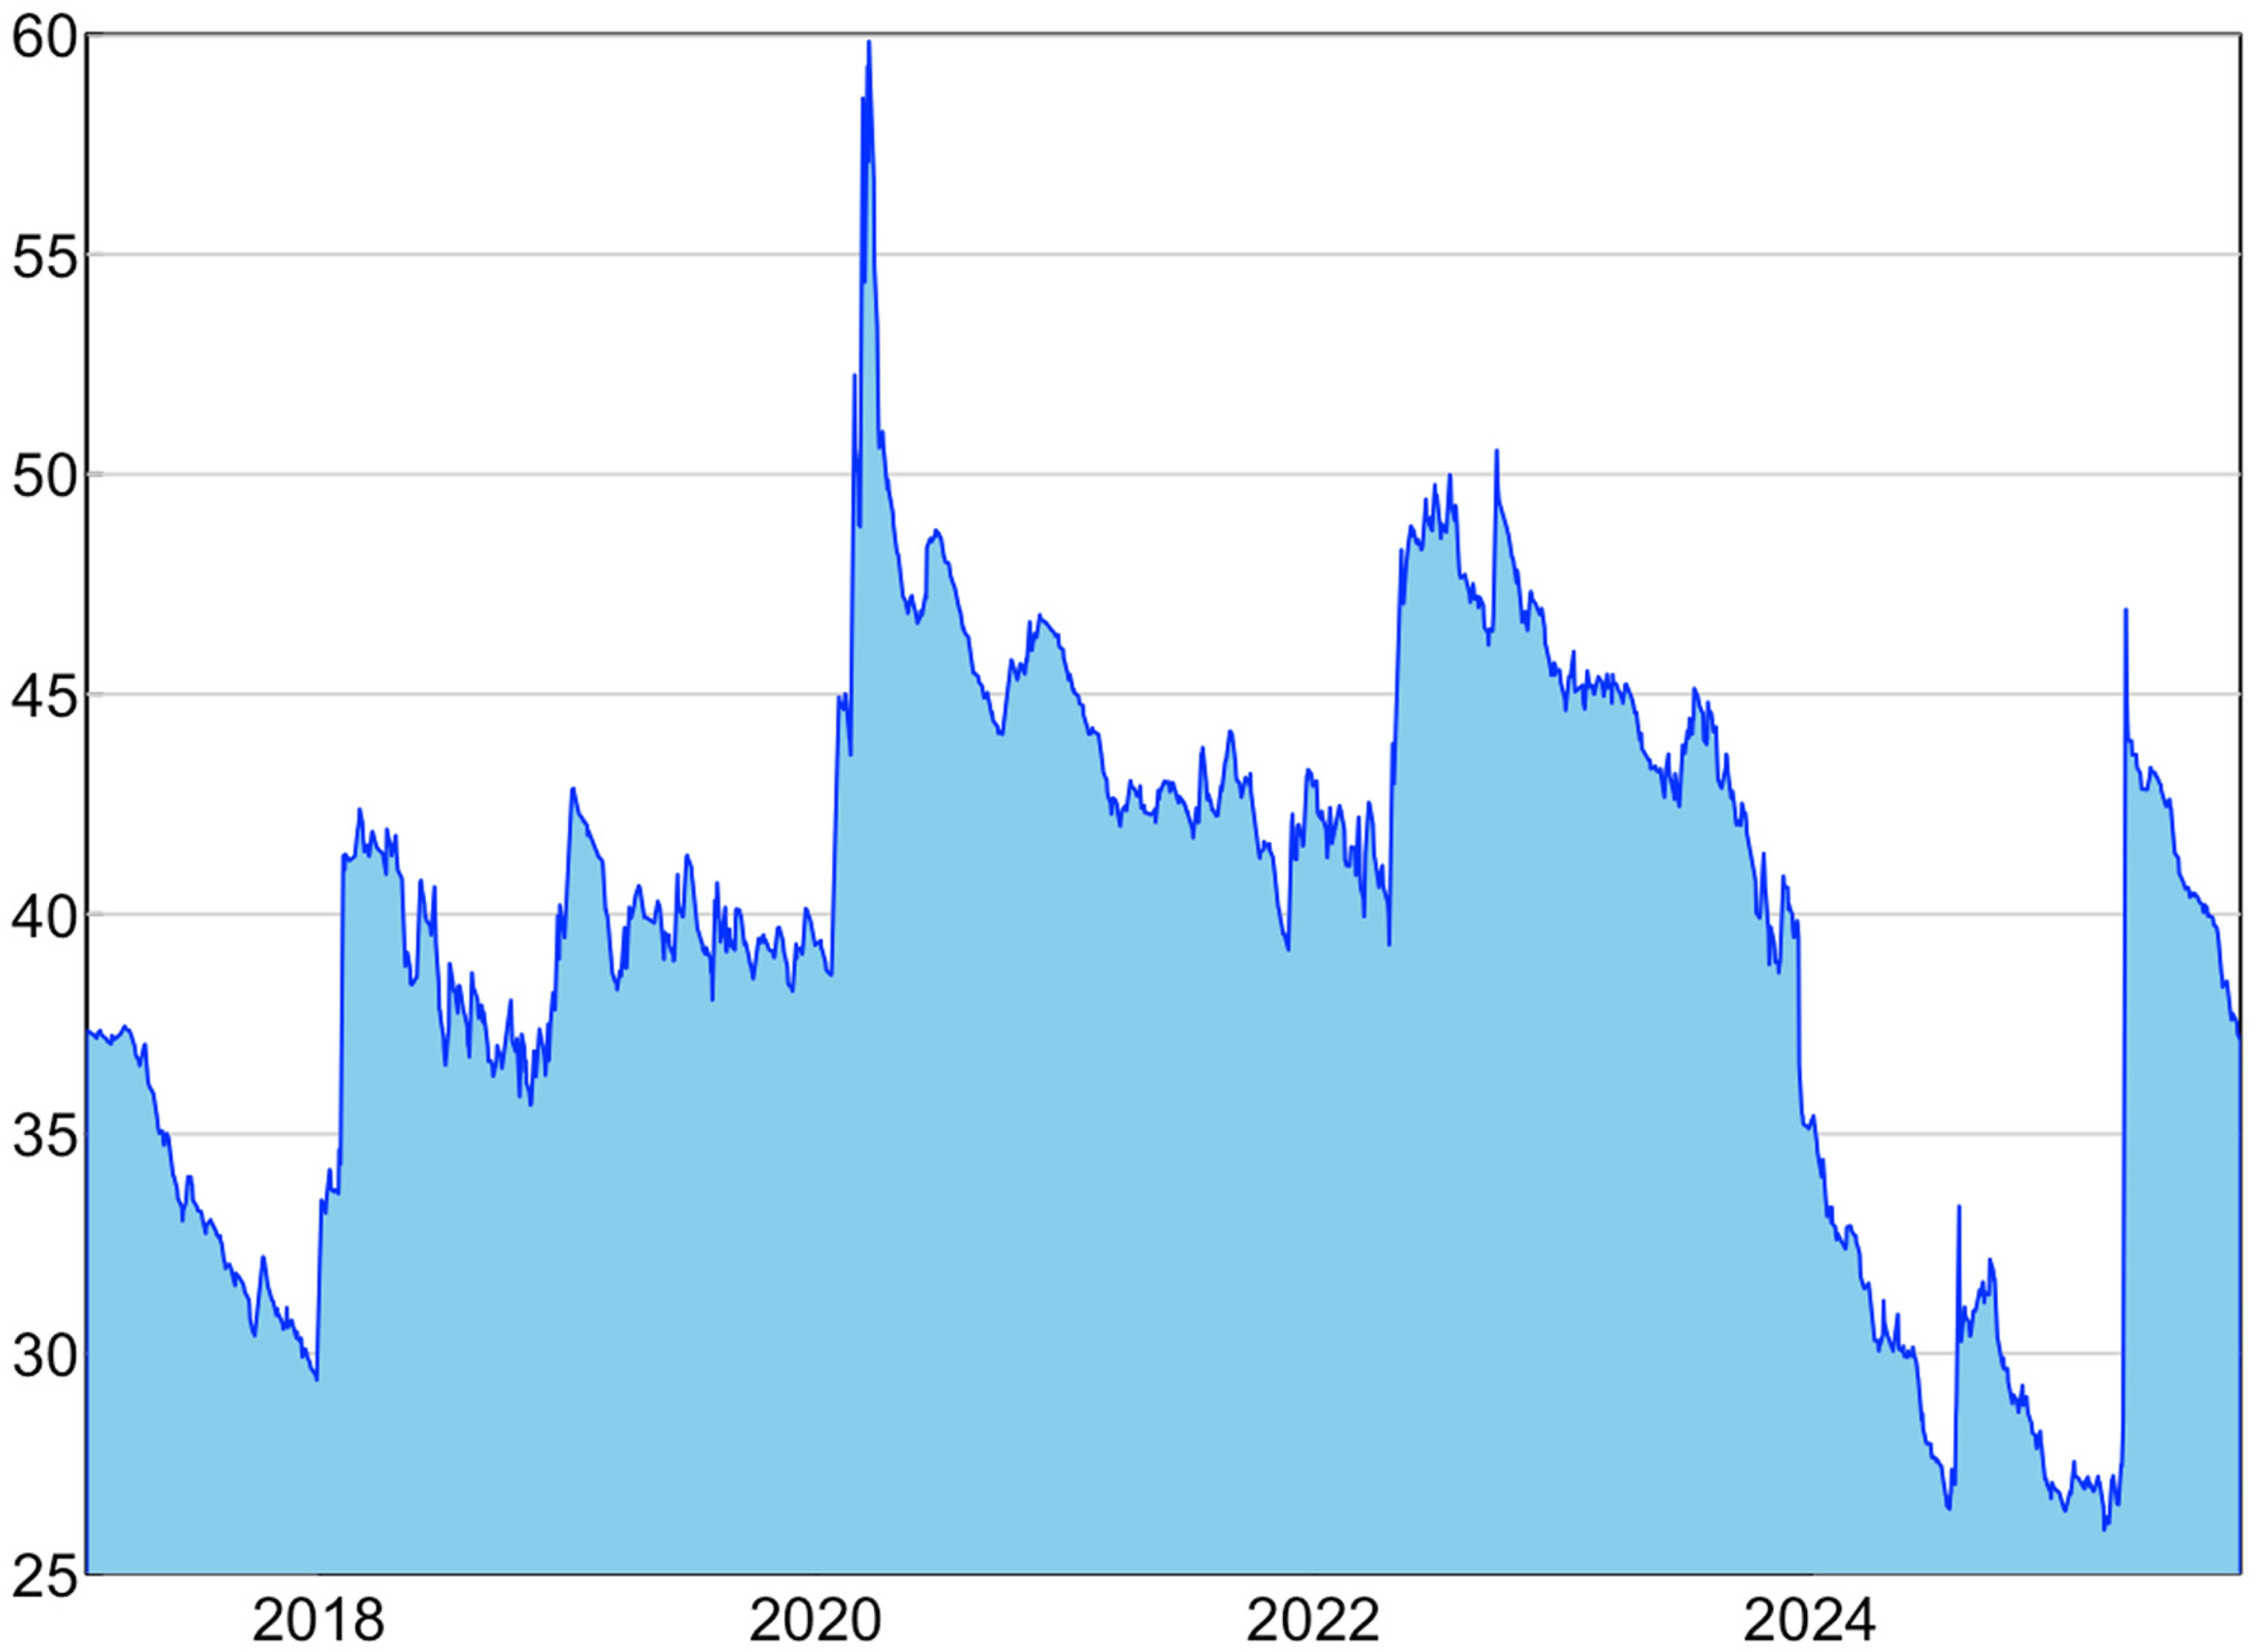
Return dynamic total connectedness (Authors own).
Figures 2 to 5 show the TCI, TO, FROM and NET values in the complete analysis period and the focus on the structural interconnections of different markets throughout this period. Figure 2 shows how the TCI has been varying across the markets over a period. As the COVID-19 pandemic, the growing tension between Ukraine and Russia, and the ongoing tariff war, demonstrate the presence of strong interconnections between these markets. The interconnectedness is a lot higher in the case of the COVID-19 crisis as compared to the Russian-Ukraine conflict. The fluctuations of TCI values are between 60 and 28 percent. The highest point is 60 percent when the COVID-19 outbreak was at full swing, and the minimum fluctuation is expected to be at the onset of 2025 with a high of about 28 percent. Figures 3 and 4 show the indexes of the return connectedness of WTI, including the TO and FROM measures. The figures demonstrate the effect of the COVID-19 pandemic, a major health crisis of the world, alongside the existence of the tariff war that have strengthened the effects of return spillovers, as reflected in the TO and FROM connectedness indexes. Figure 5 shows the time-dependent dynamic net directional return effect across these markets, with most of them indicating negative effects in Japan, Argentina, China, and WTI and positive values in the USA and France. The network graph of the pairwise connectedness index in Figure 6 shows that the thickness of the arrows indicates the degree and level of return spillovers. Net pair-wise volatility spillover is more pronounced, as also shown by the denser arrows between Australia, France, Japan, and the USA. The relations between these markets during the analyzed period indicate the dynamic nature of the relations that evolves in time.
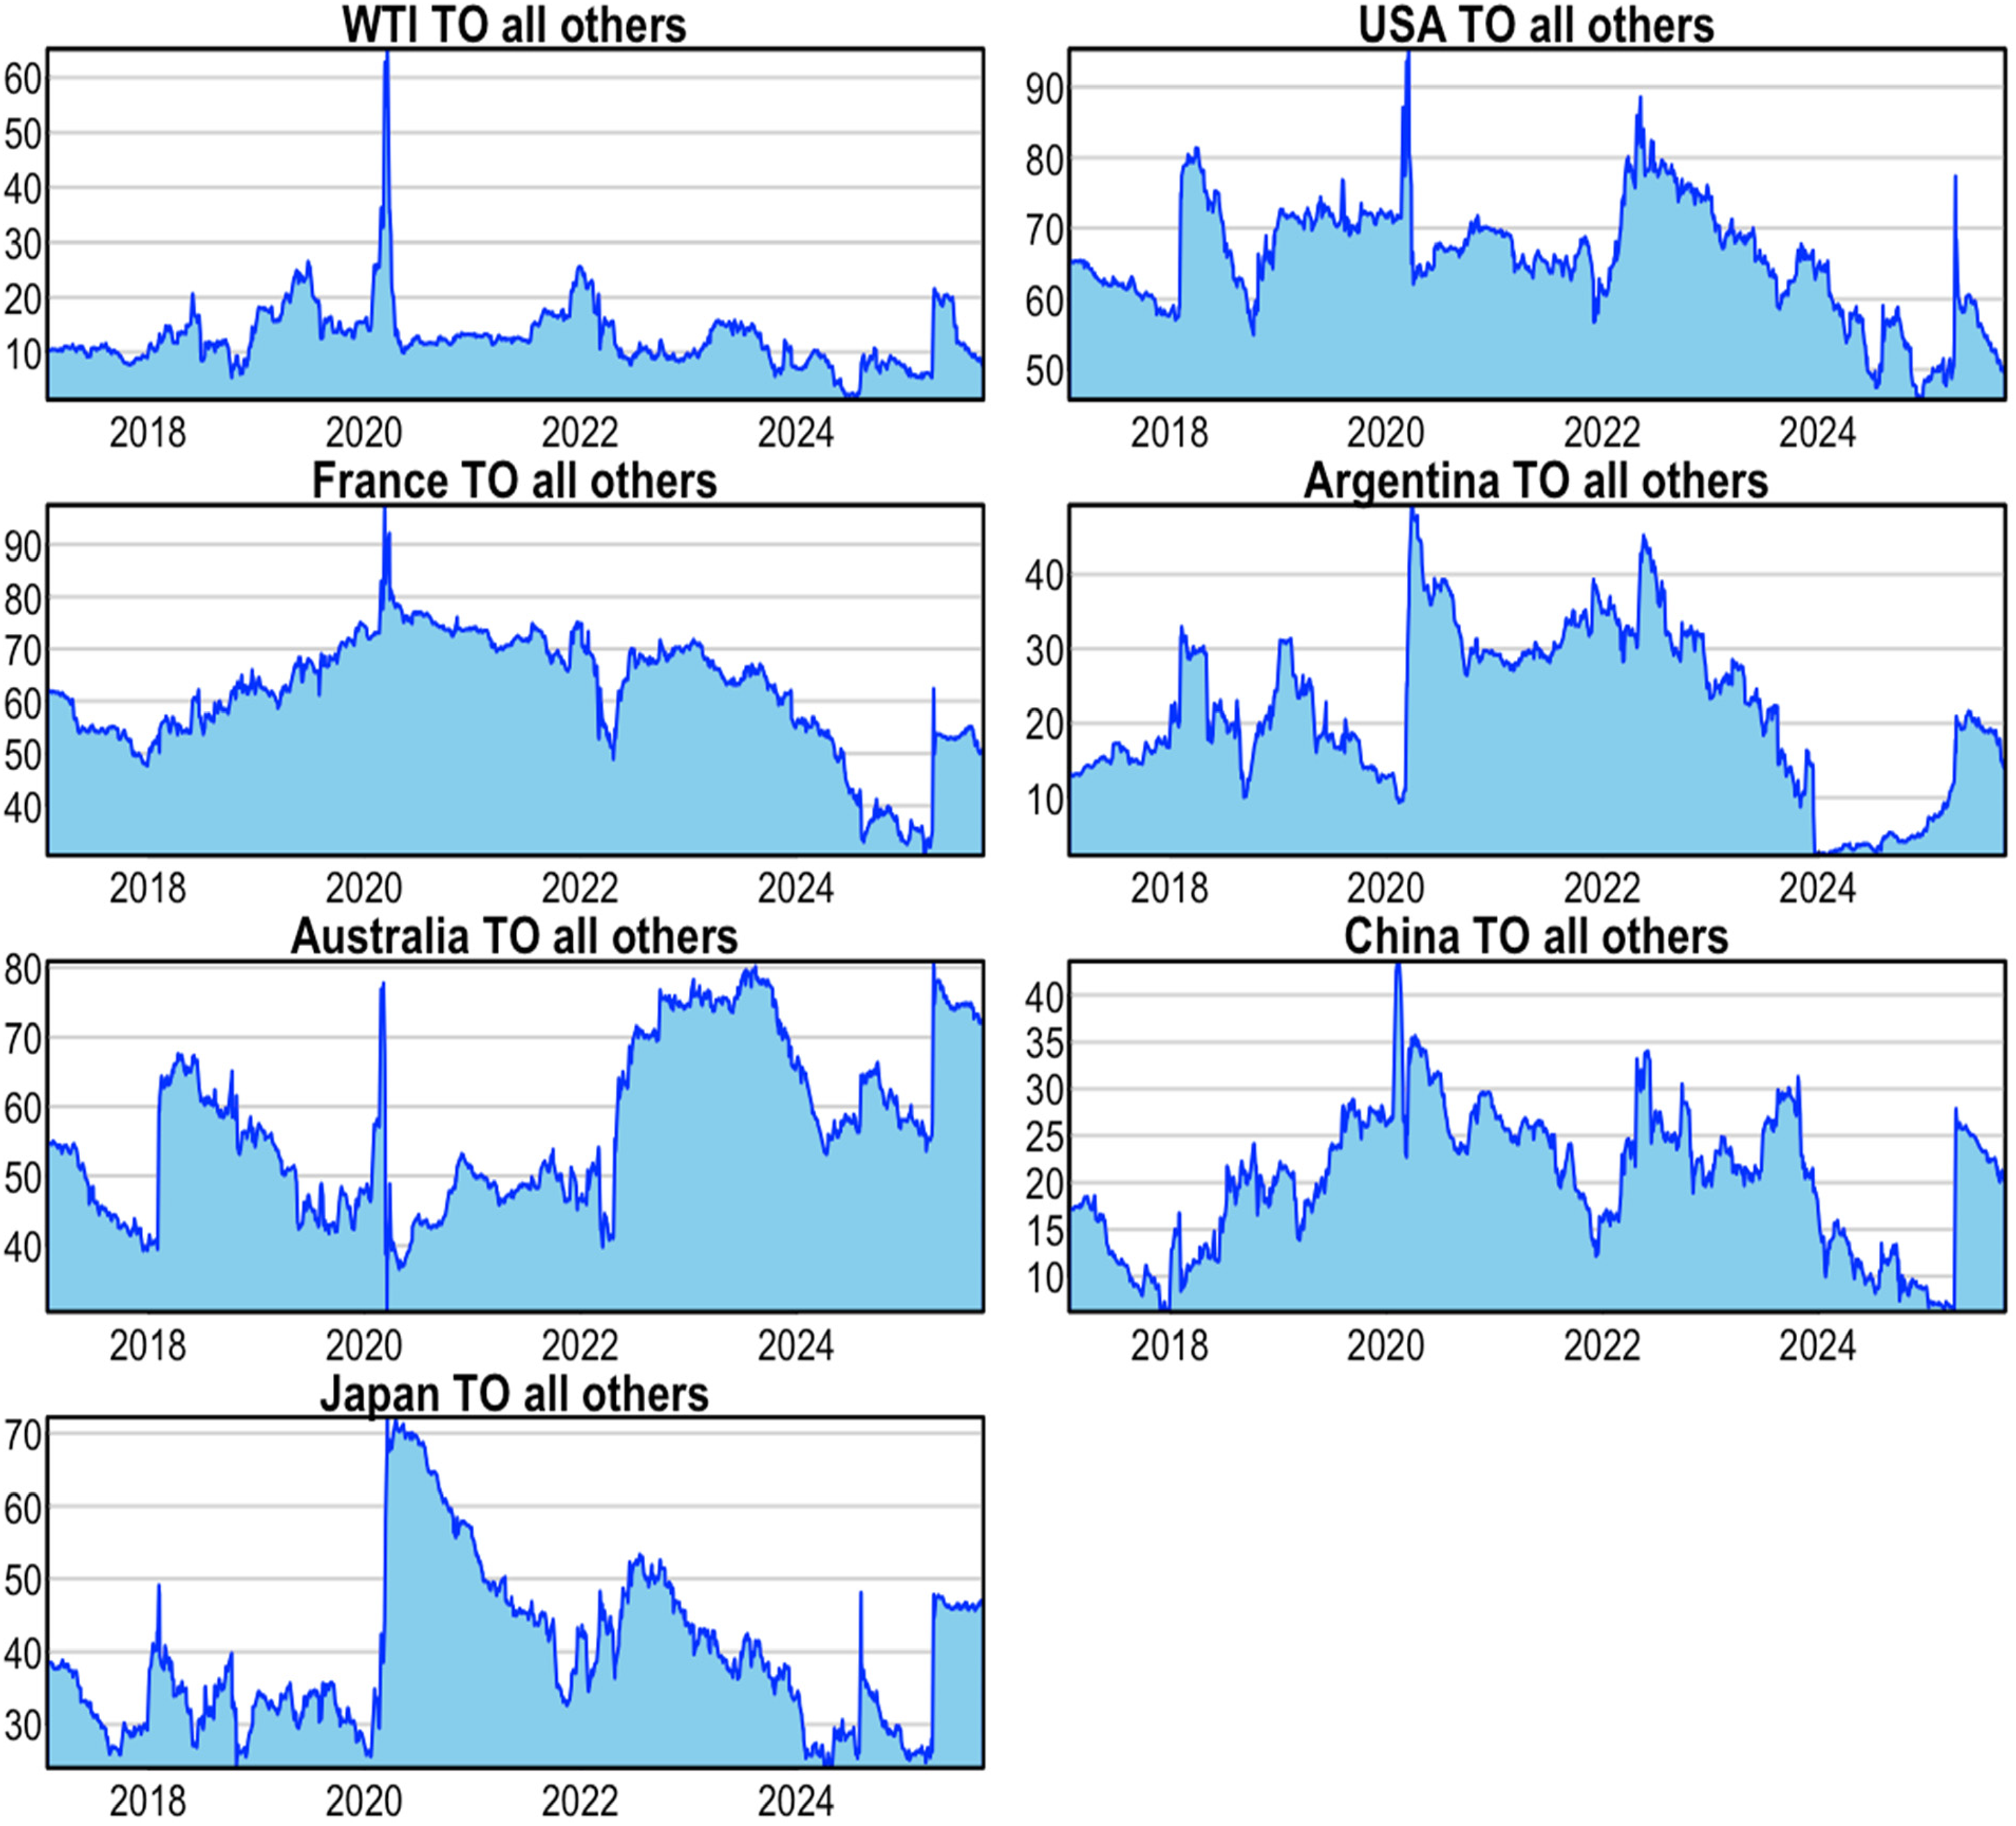
Dynamic TO return connectedness index of WTI (Authors own).
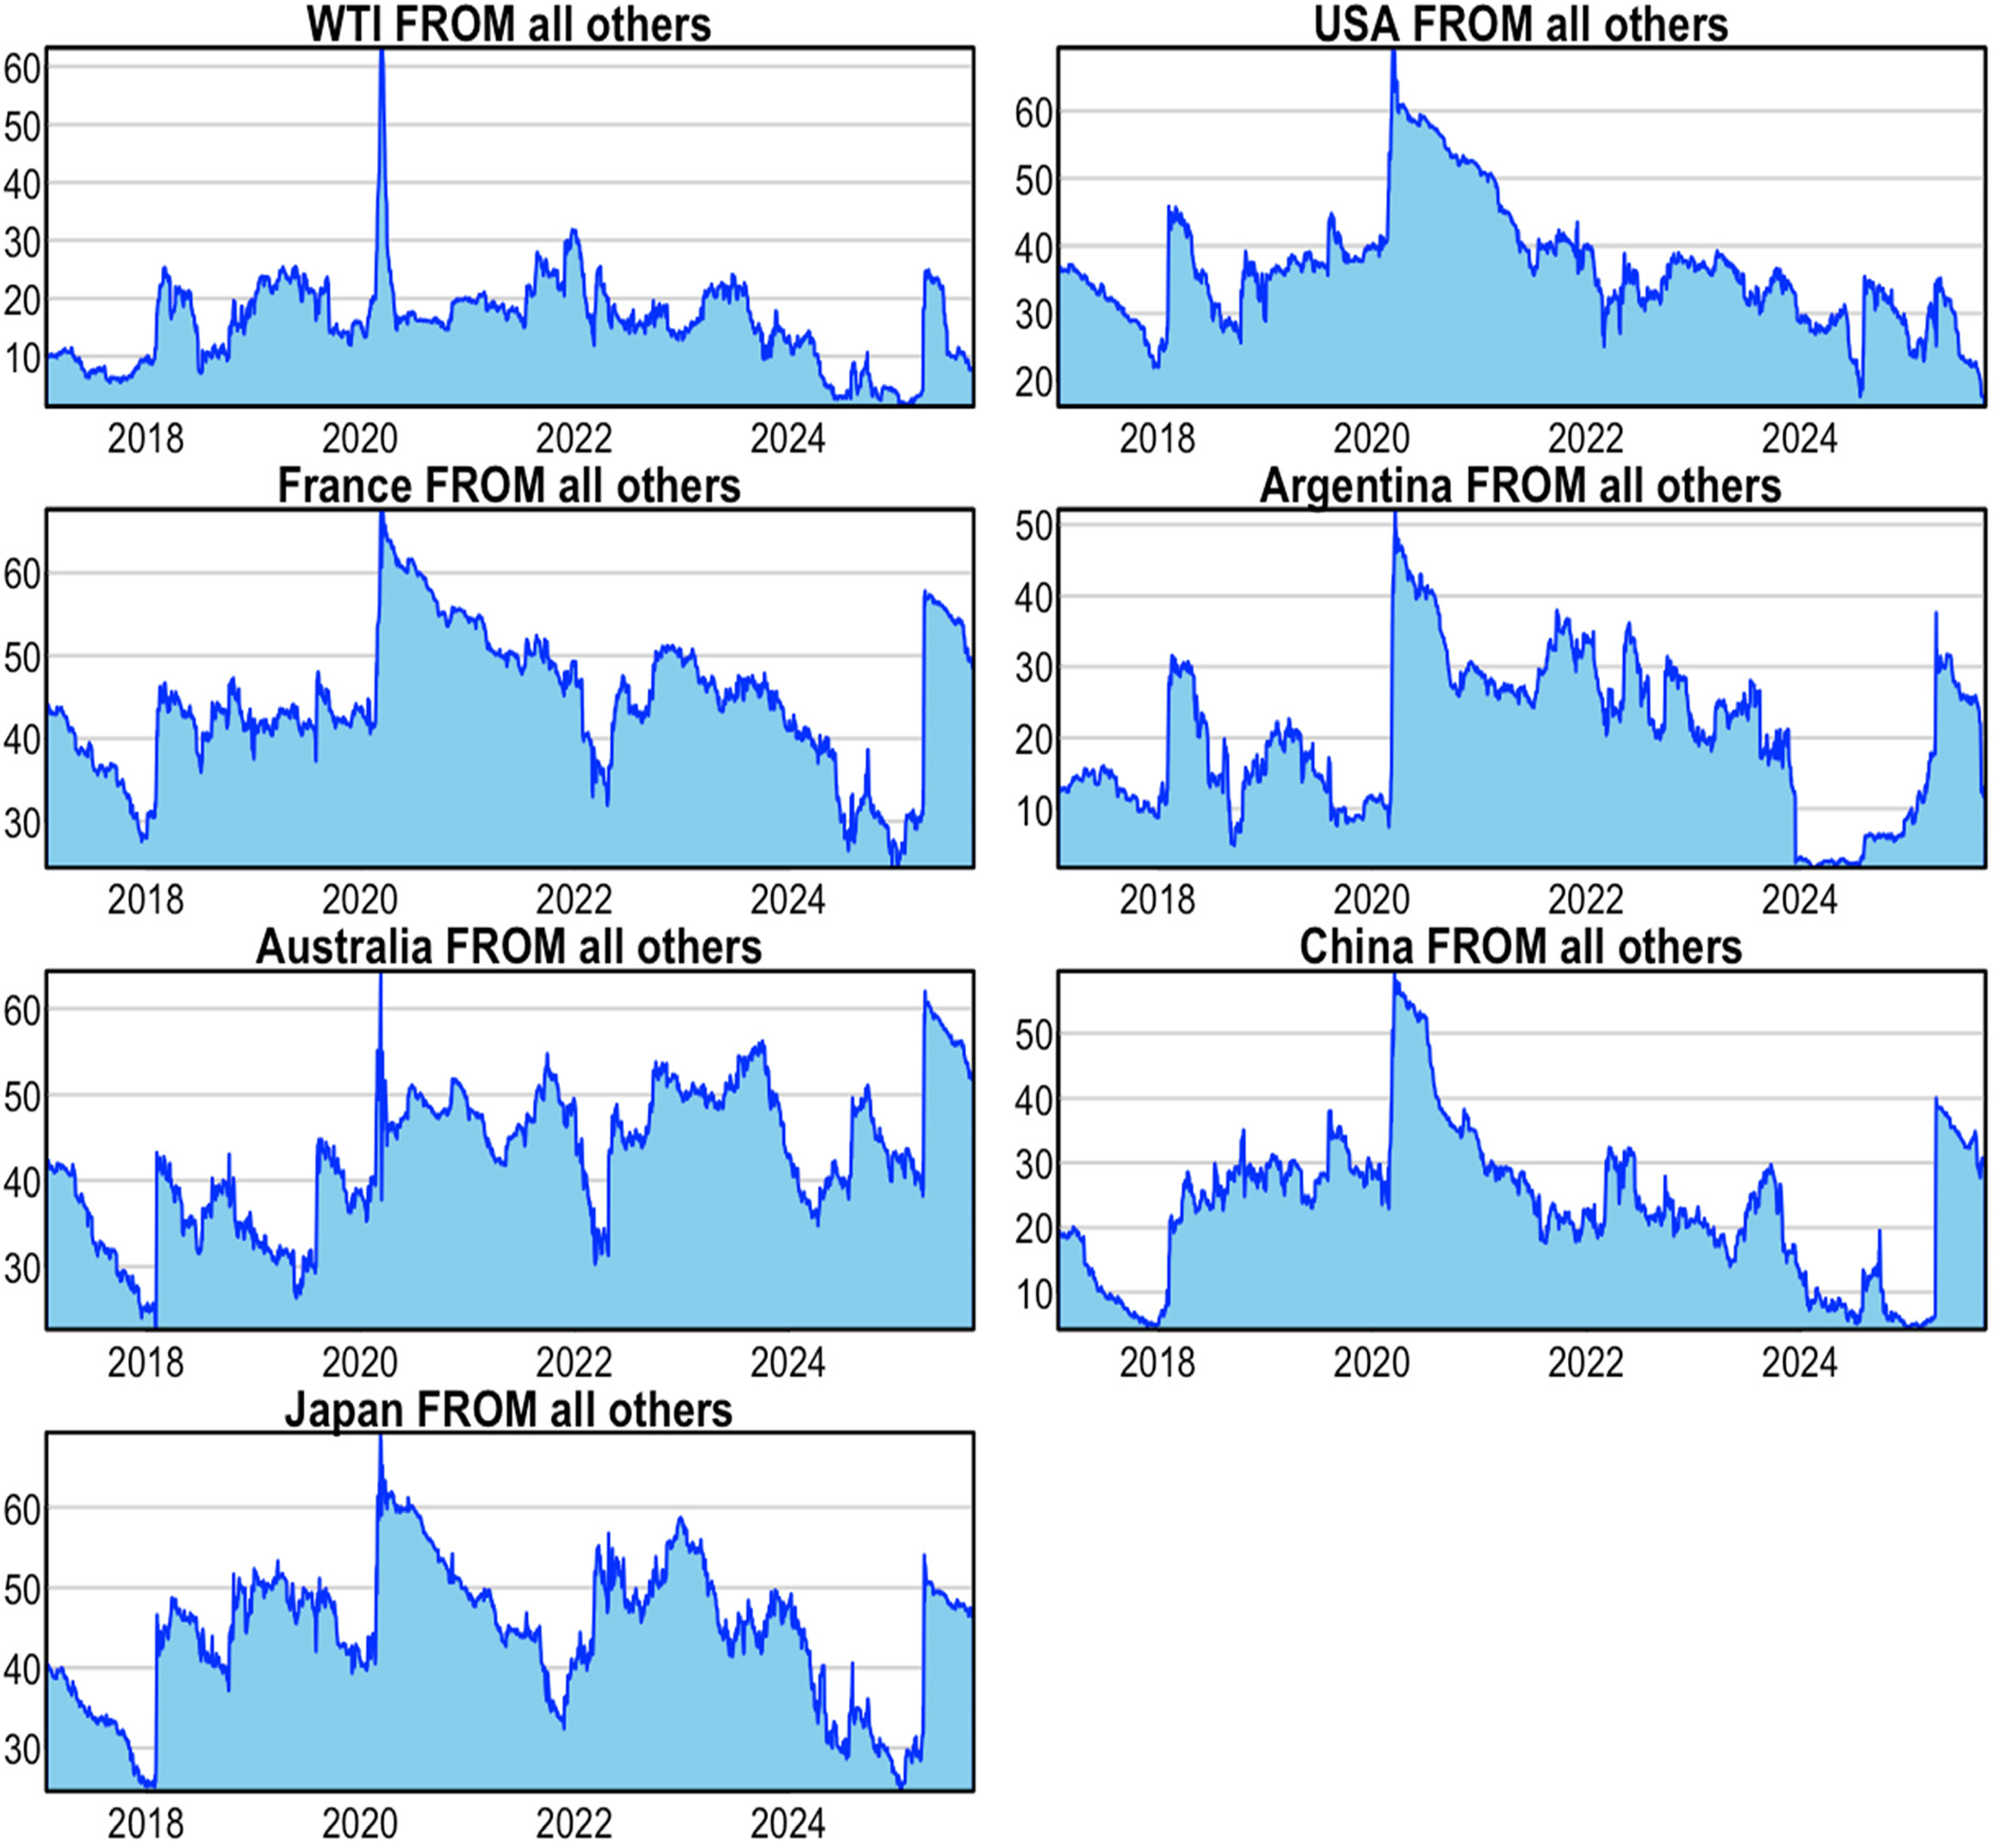
Dynamic FROM return connectedness index of WTI (Authors own).
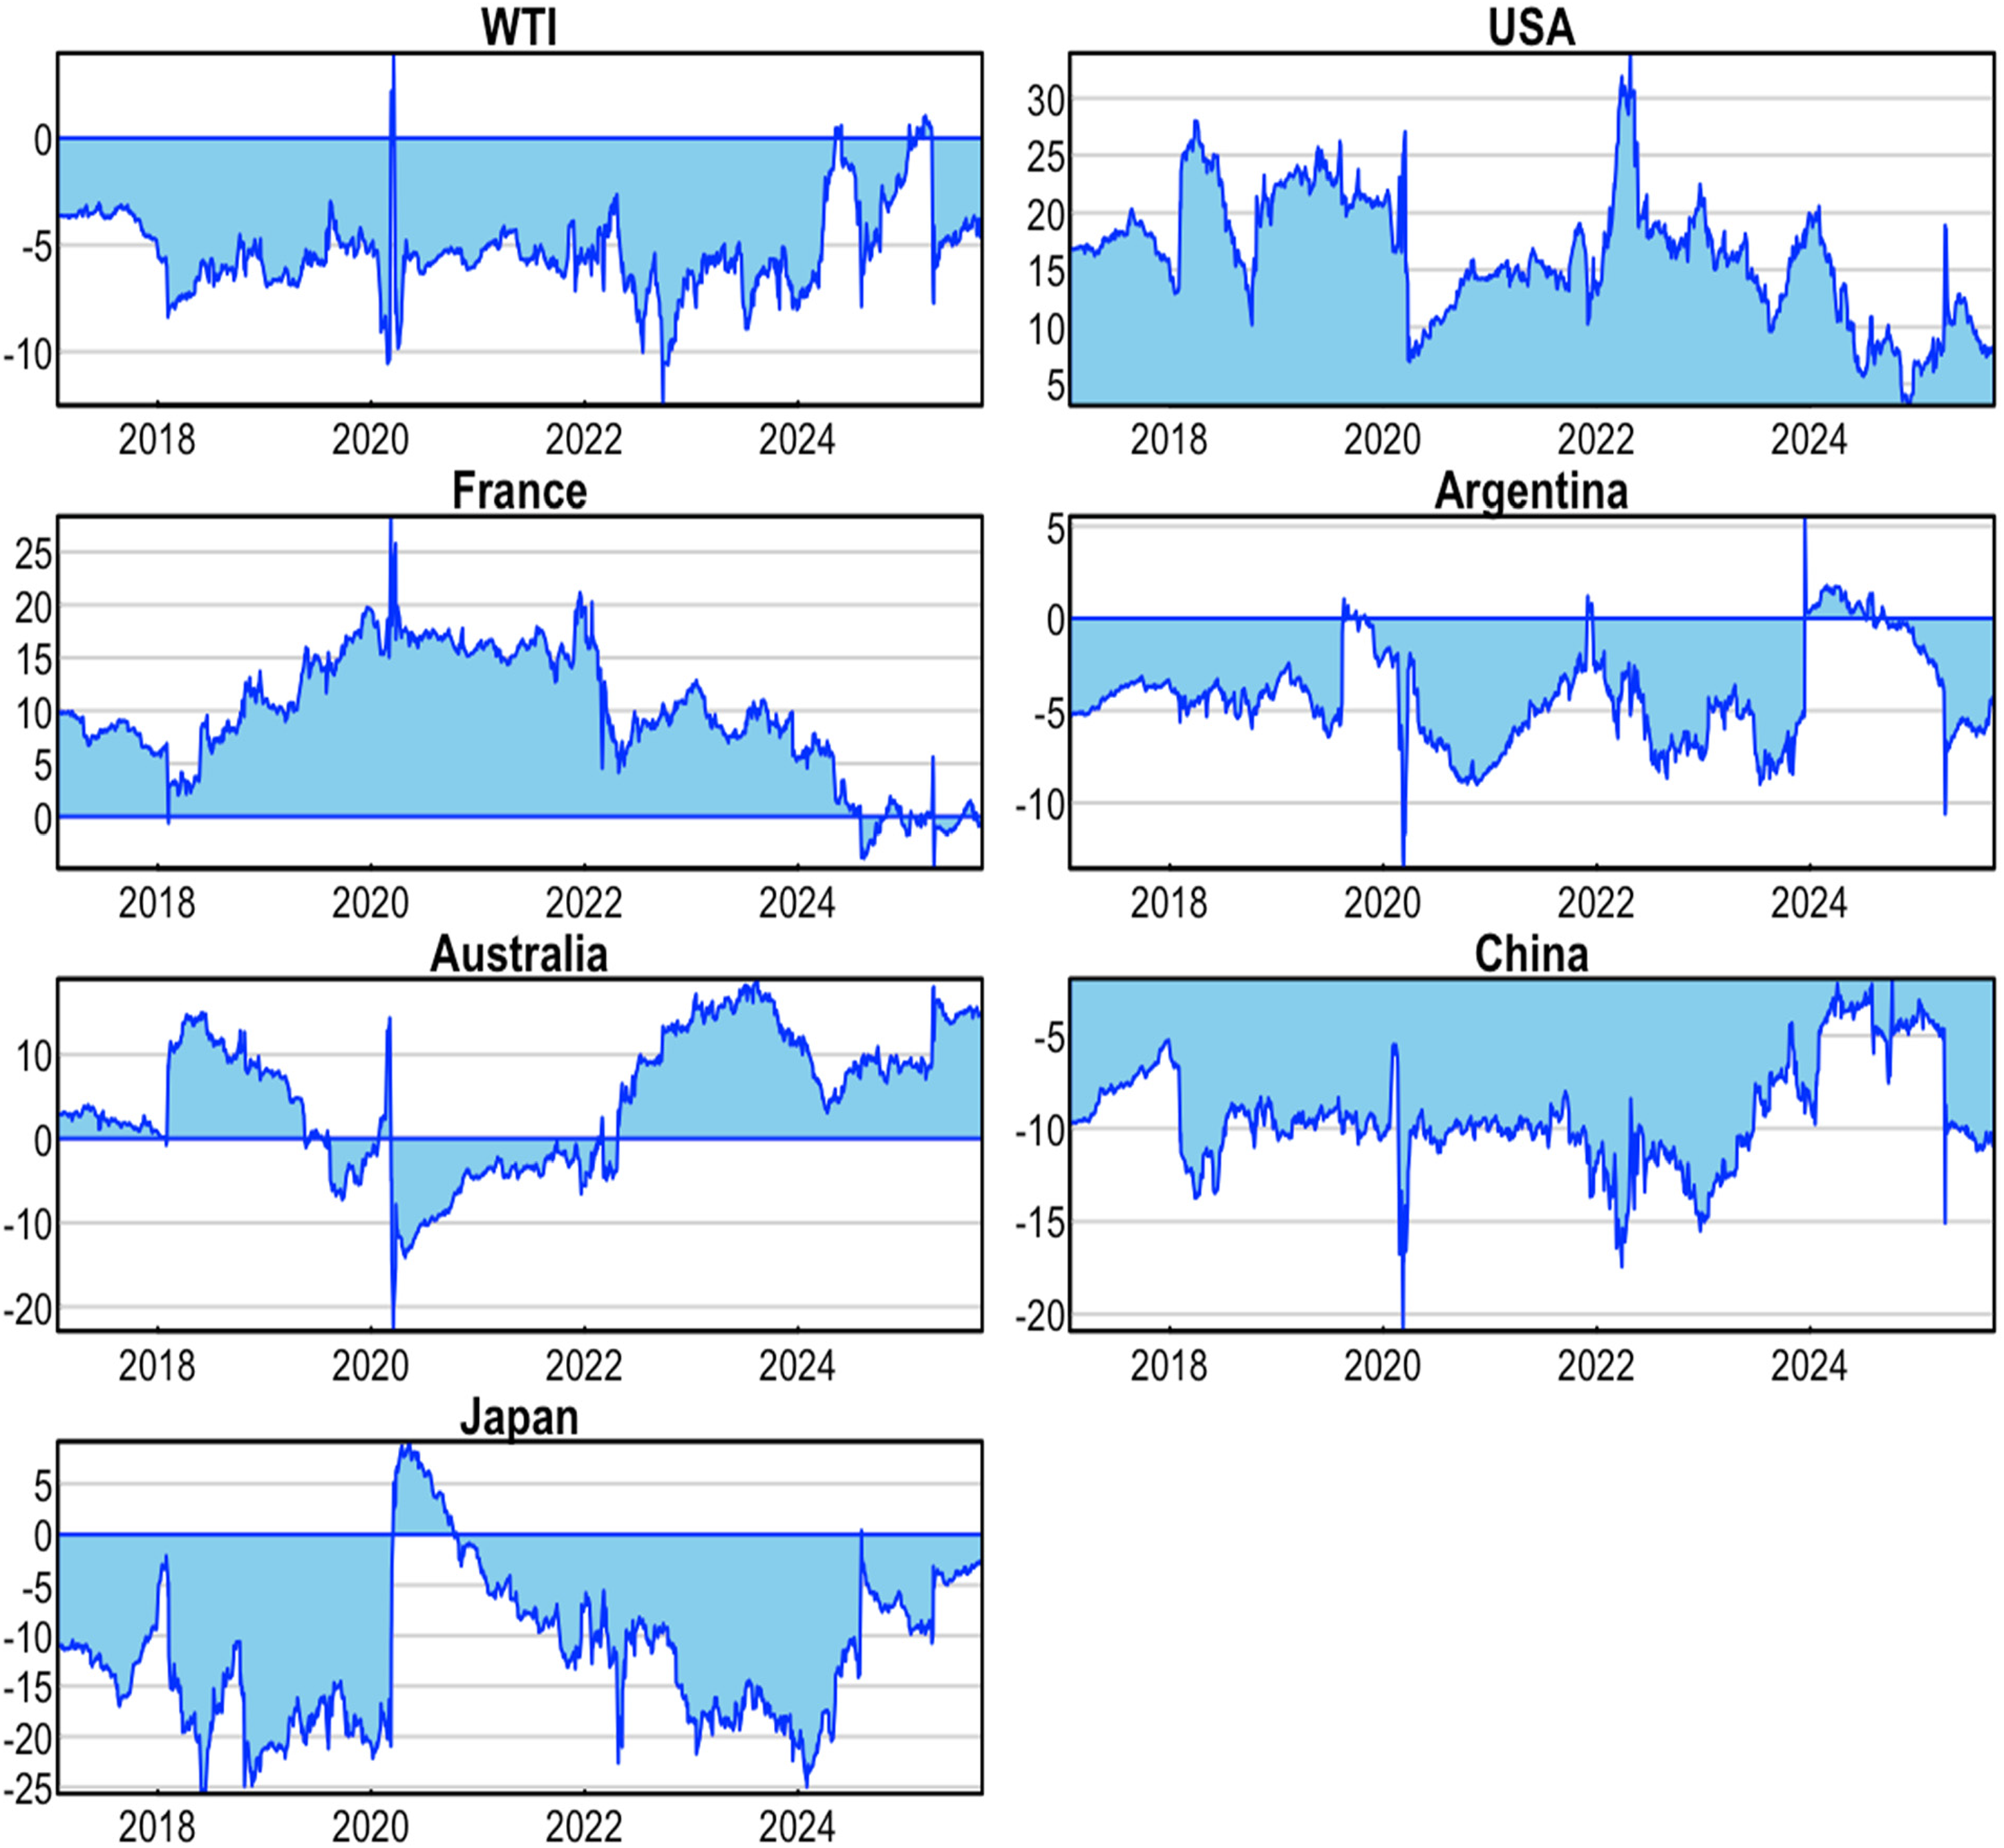
Dynamic net directional return connectedness indices (Authors own).
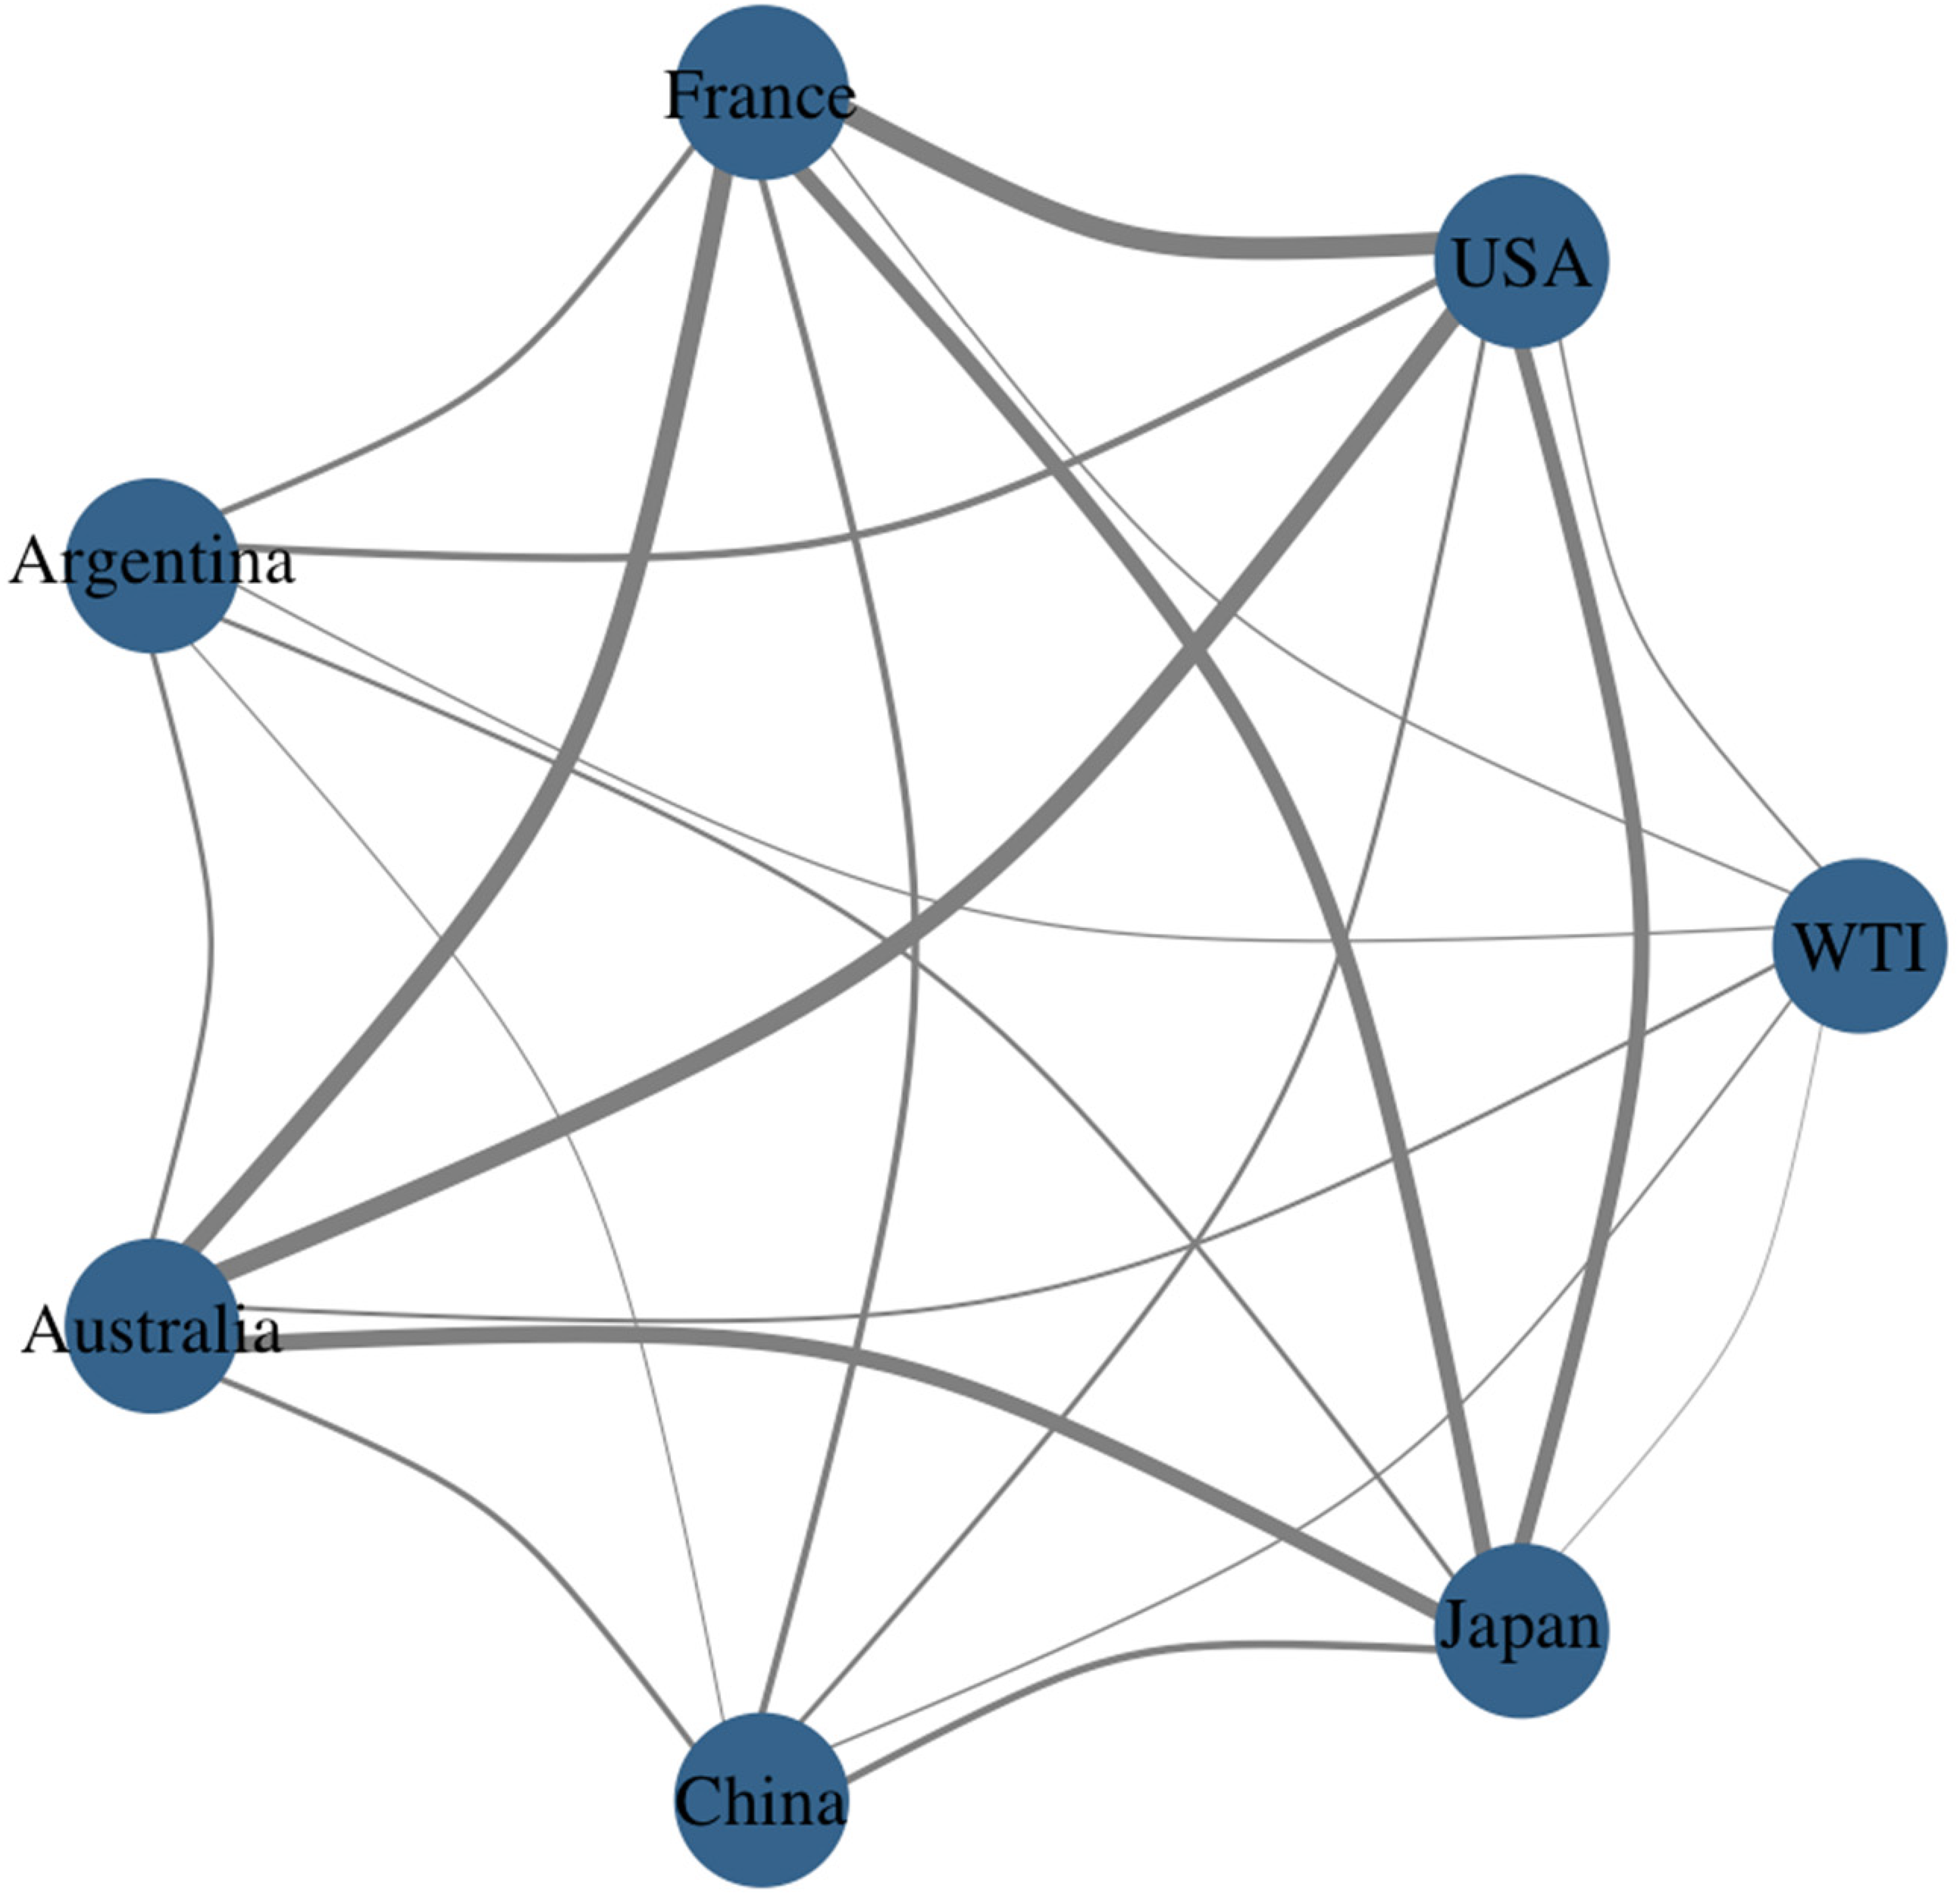
Dynamic net pairwise directional return connectedness indices (Authors own).
The study demonstrates return spillover connectedness using quantile VAR and a dynamic connectedness approach. It shows higher spillover observed under bullish and bearish conditions, while the lowest connection under normal conditions with TCI 39.12%. The study also reveals that periods of market instability are associated with higher linkages between G20 stock markets, rather than the WTI spillover with stock price. The USA, Australia, and France remain robust net transmitters, while Australia, Argentina, China, and Japan receive net inflows under dynamic return spillover.
Volatility dynamic connectedness indices
Table 5 describes the output of market volatility's dynamic connectedness under different timeframes pre-COVID and post-COVID. The TCI for volatility is equal to 36.07% for full sample analysis. For the pre-COVID era, the TCI equals 32.15%, while for the post-COVID period, it equals 36.72%. These indicate a substantial degree of volatility and interconnectedness across various markets under different time frames. There is no significant impact between the full sample TCI and the pre/post-COVID era. The results demonstrate a positive NET spillover, with values of 8.17 for the USA, 8.93 for France, and 6.95 for Australia, based on a full sample analysis. On the other hand, the Argentina, China, WTI, and Japan indices have negative NET spillover. As a result, Argentina, China, WTI, and Japan are known as being net recipients of risk and the other markets are net transmitters of risk.
Dynamic connectedness of volatility.
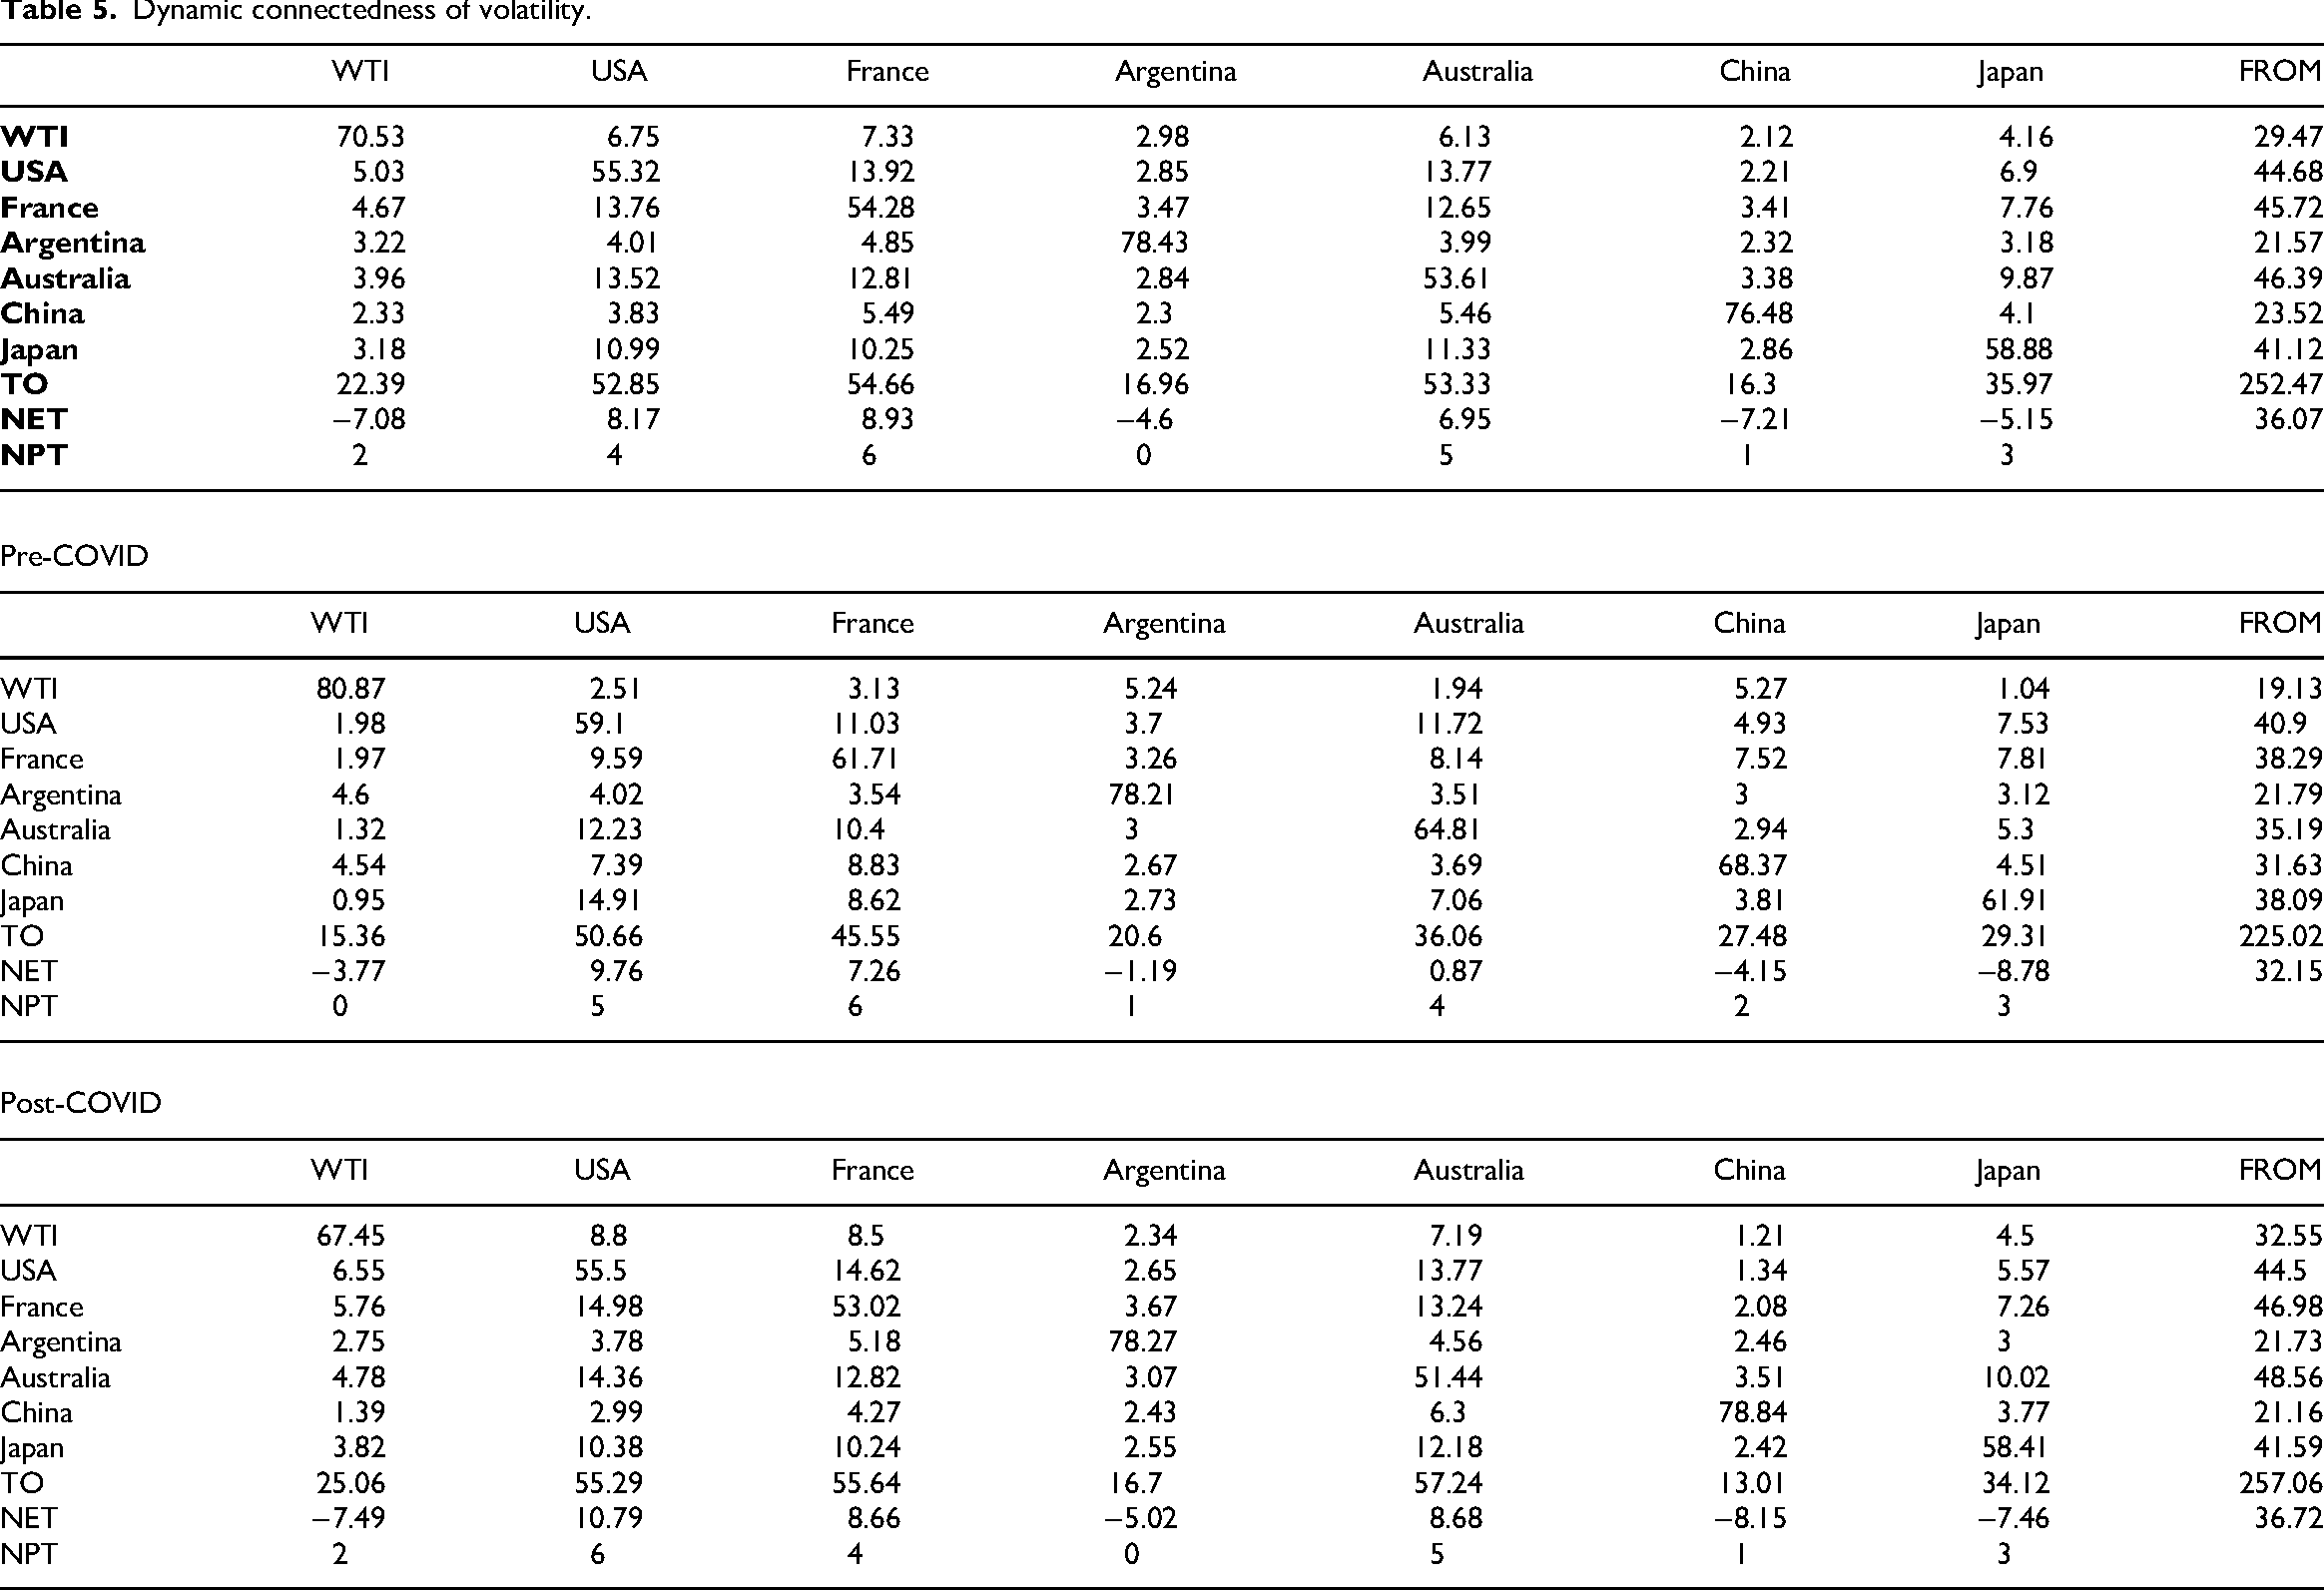
TO is the percentage of market influence in other markets; France has the most influence (54.66%). We represent the impact of other markets as FROM; Japan receives the highest influence of 41.12% and Argentina is the least influential with 21.57%. Various marketplaces observe both influencing patterns, albeit with varying magnitudes. Our analysis indicates that the USA, France, and Australia remain net risk transmitters across the time frame, with the full sample, pre-COVID, and post-COVID eras.
Figures 7 to 10 illustrate the TCI TO, FROM, and NET, respectively. As seen in Figure 7, the interconnectedness of the risks exhibits time variability. We observe stronger connections when the financial markets undergo a series of disruptive events. There was a noticeable upward trajectory during the latter part of 2020, followed by a subsequent downward trend. The risk of connectivity increases in the middle of 2022, which is mainly due to the Russia-Ukraine escalation. The current tariff war significantly impacts the financial markets, which are undergoing with a decline. Figures 8 and 9 display the volatility connectedness indices for the WTI, which correspond to the TO and FROM measures, respectively. Figures 8 and 9 demonstrate that the COVID-19 outbreak, the Russia-Ukraine war, tariff war have led to an increase in the impact of WTI volatility spillover on all evaluated stock markets (measured by the TO connectedness index) and the effect of stock market volatility spillover on the WTI (measured by the FROM connectedness index).
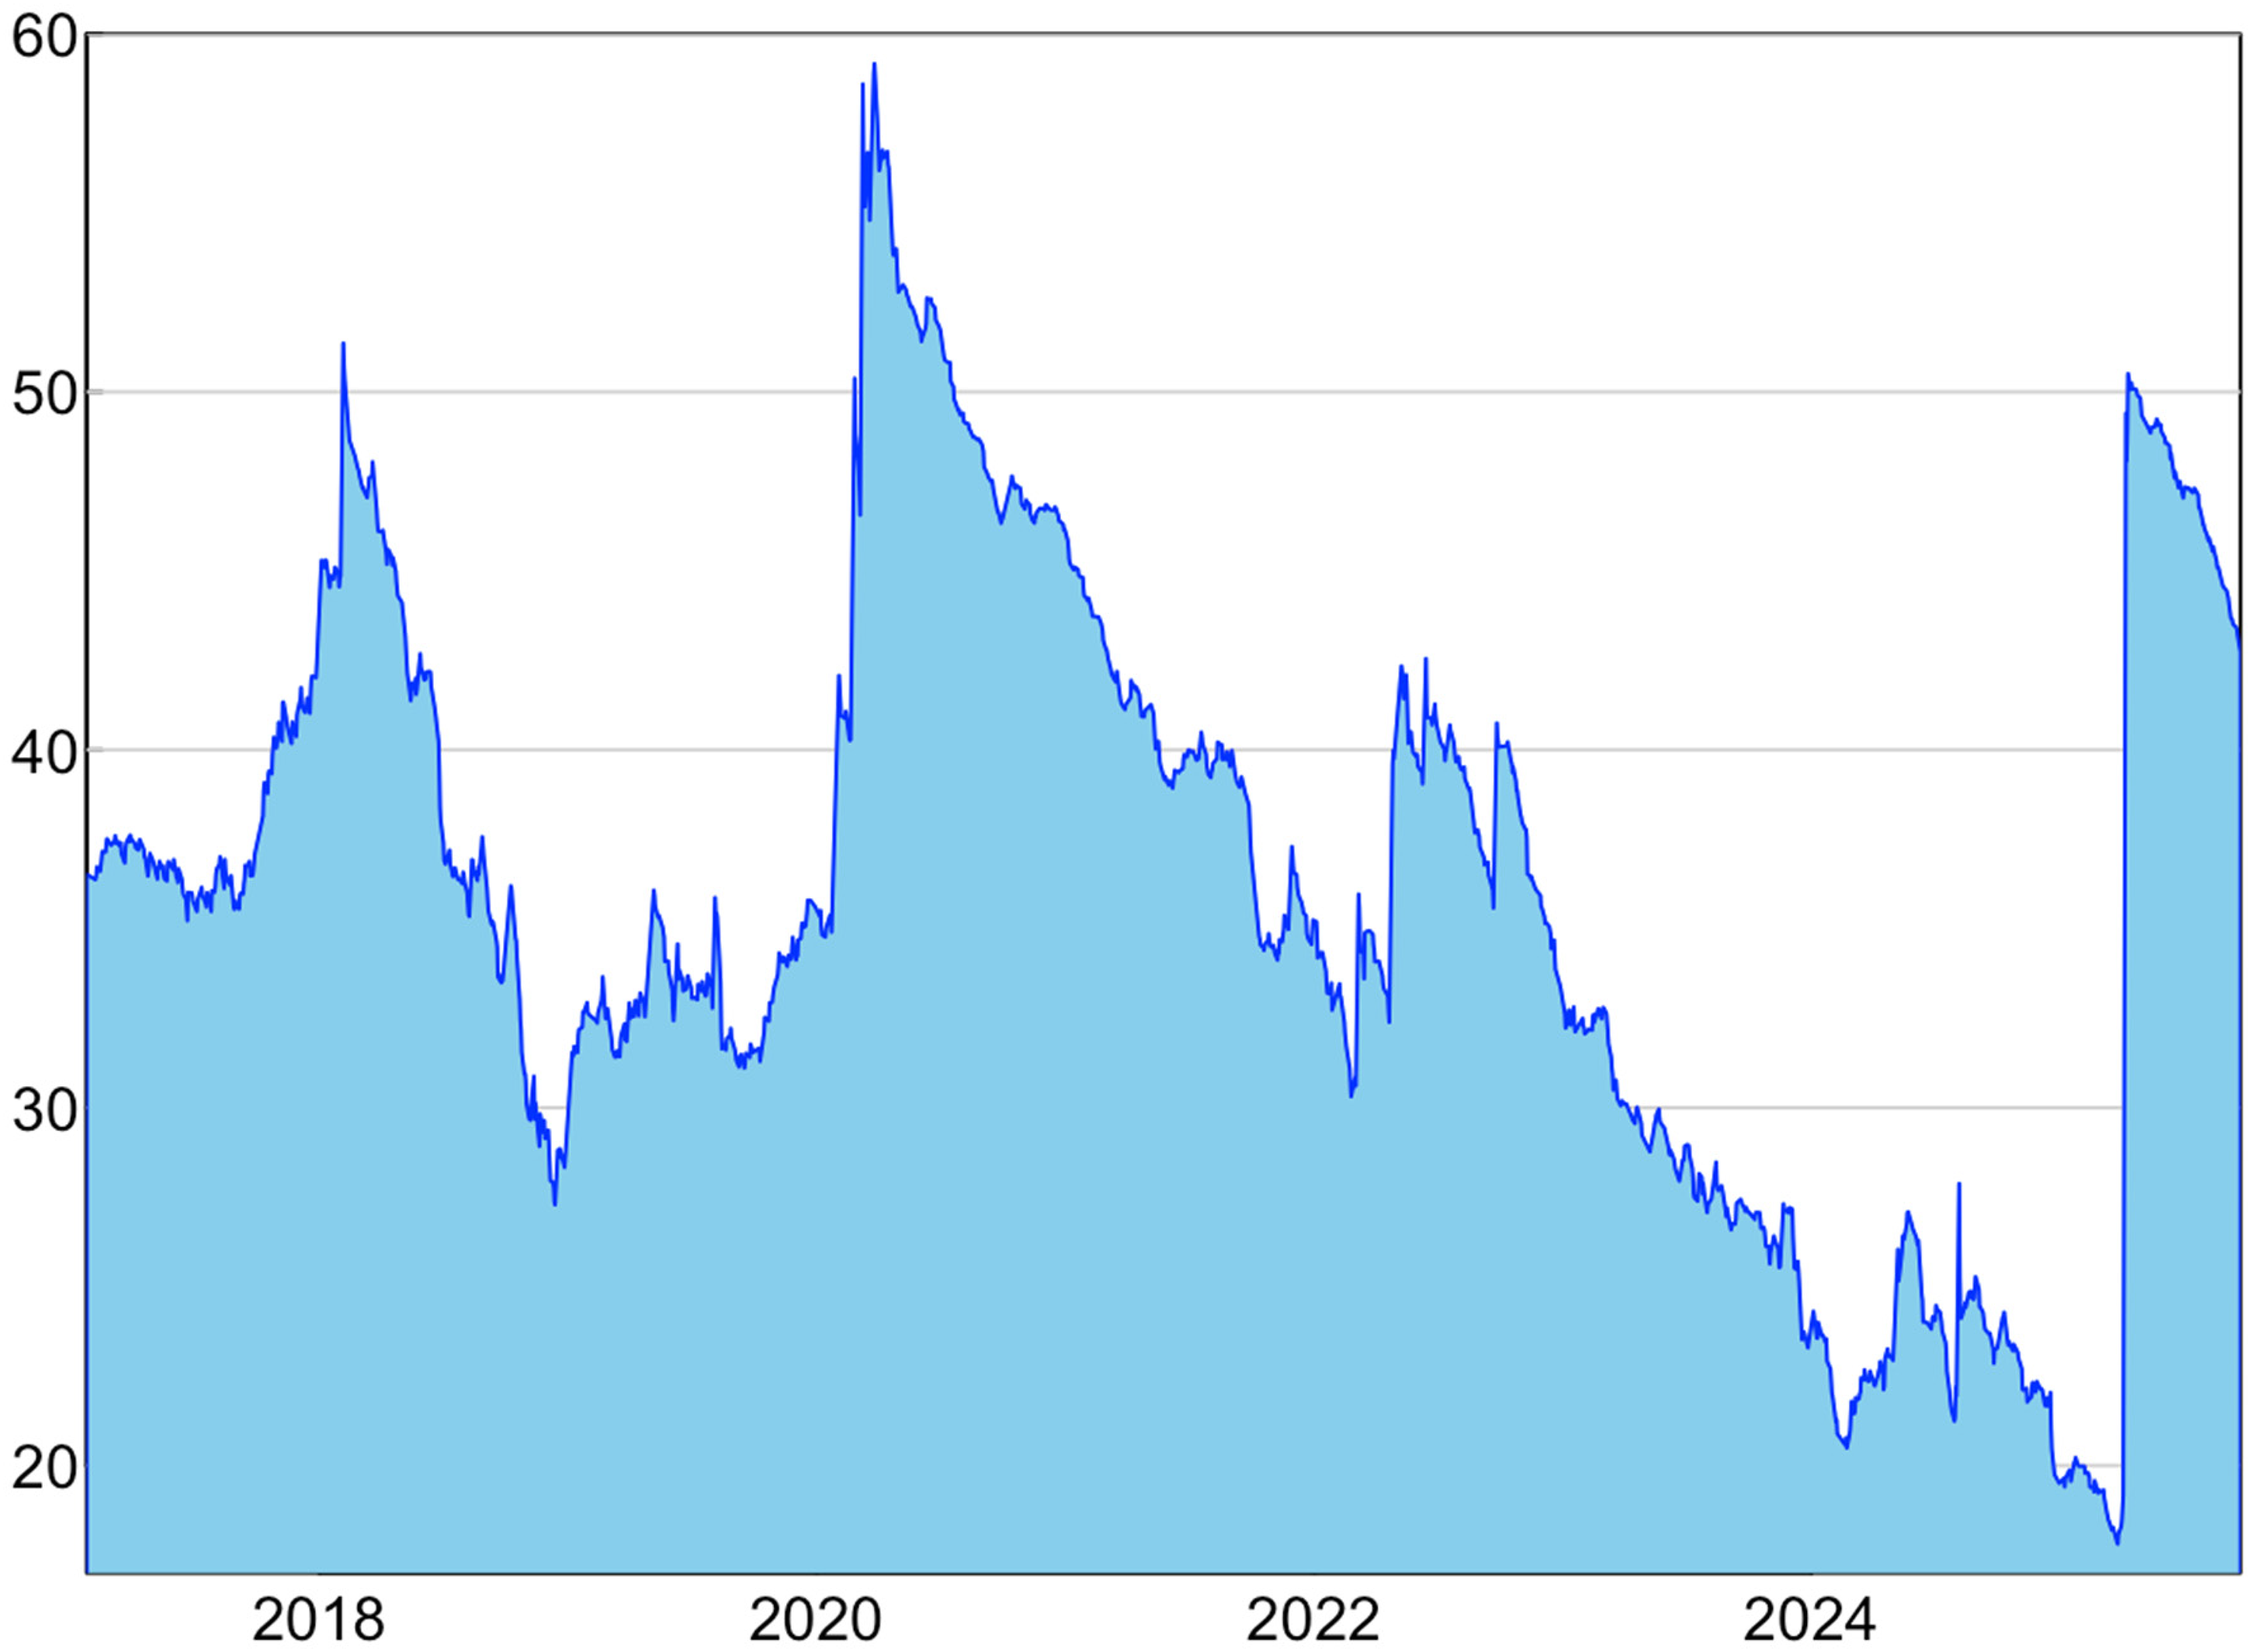
Volatility dynamic total connectedness (Authors own).
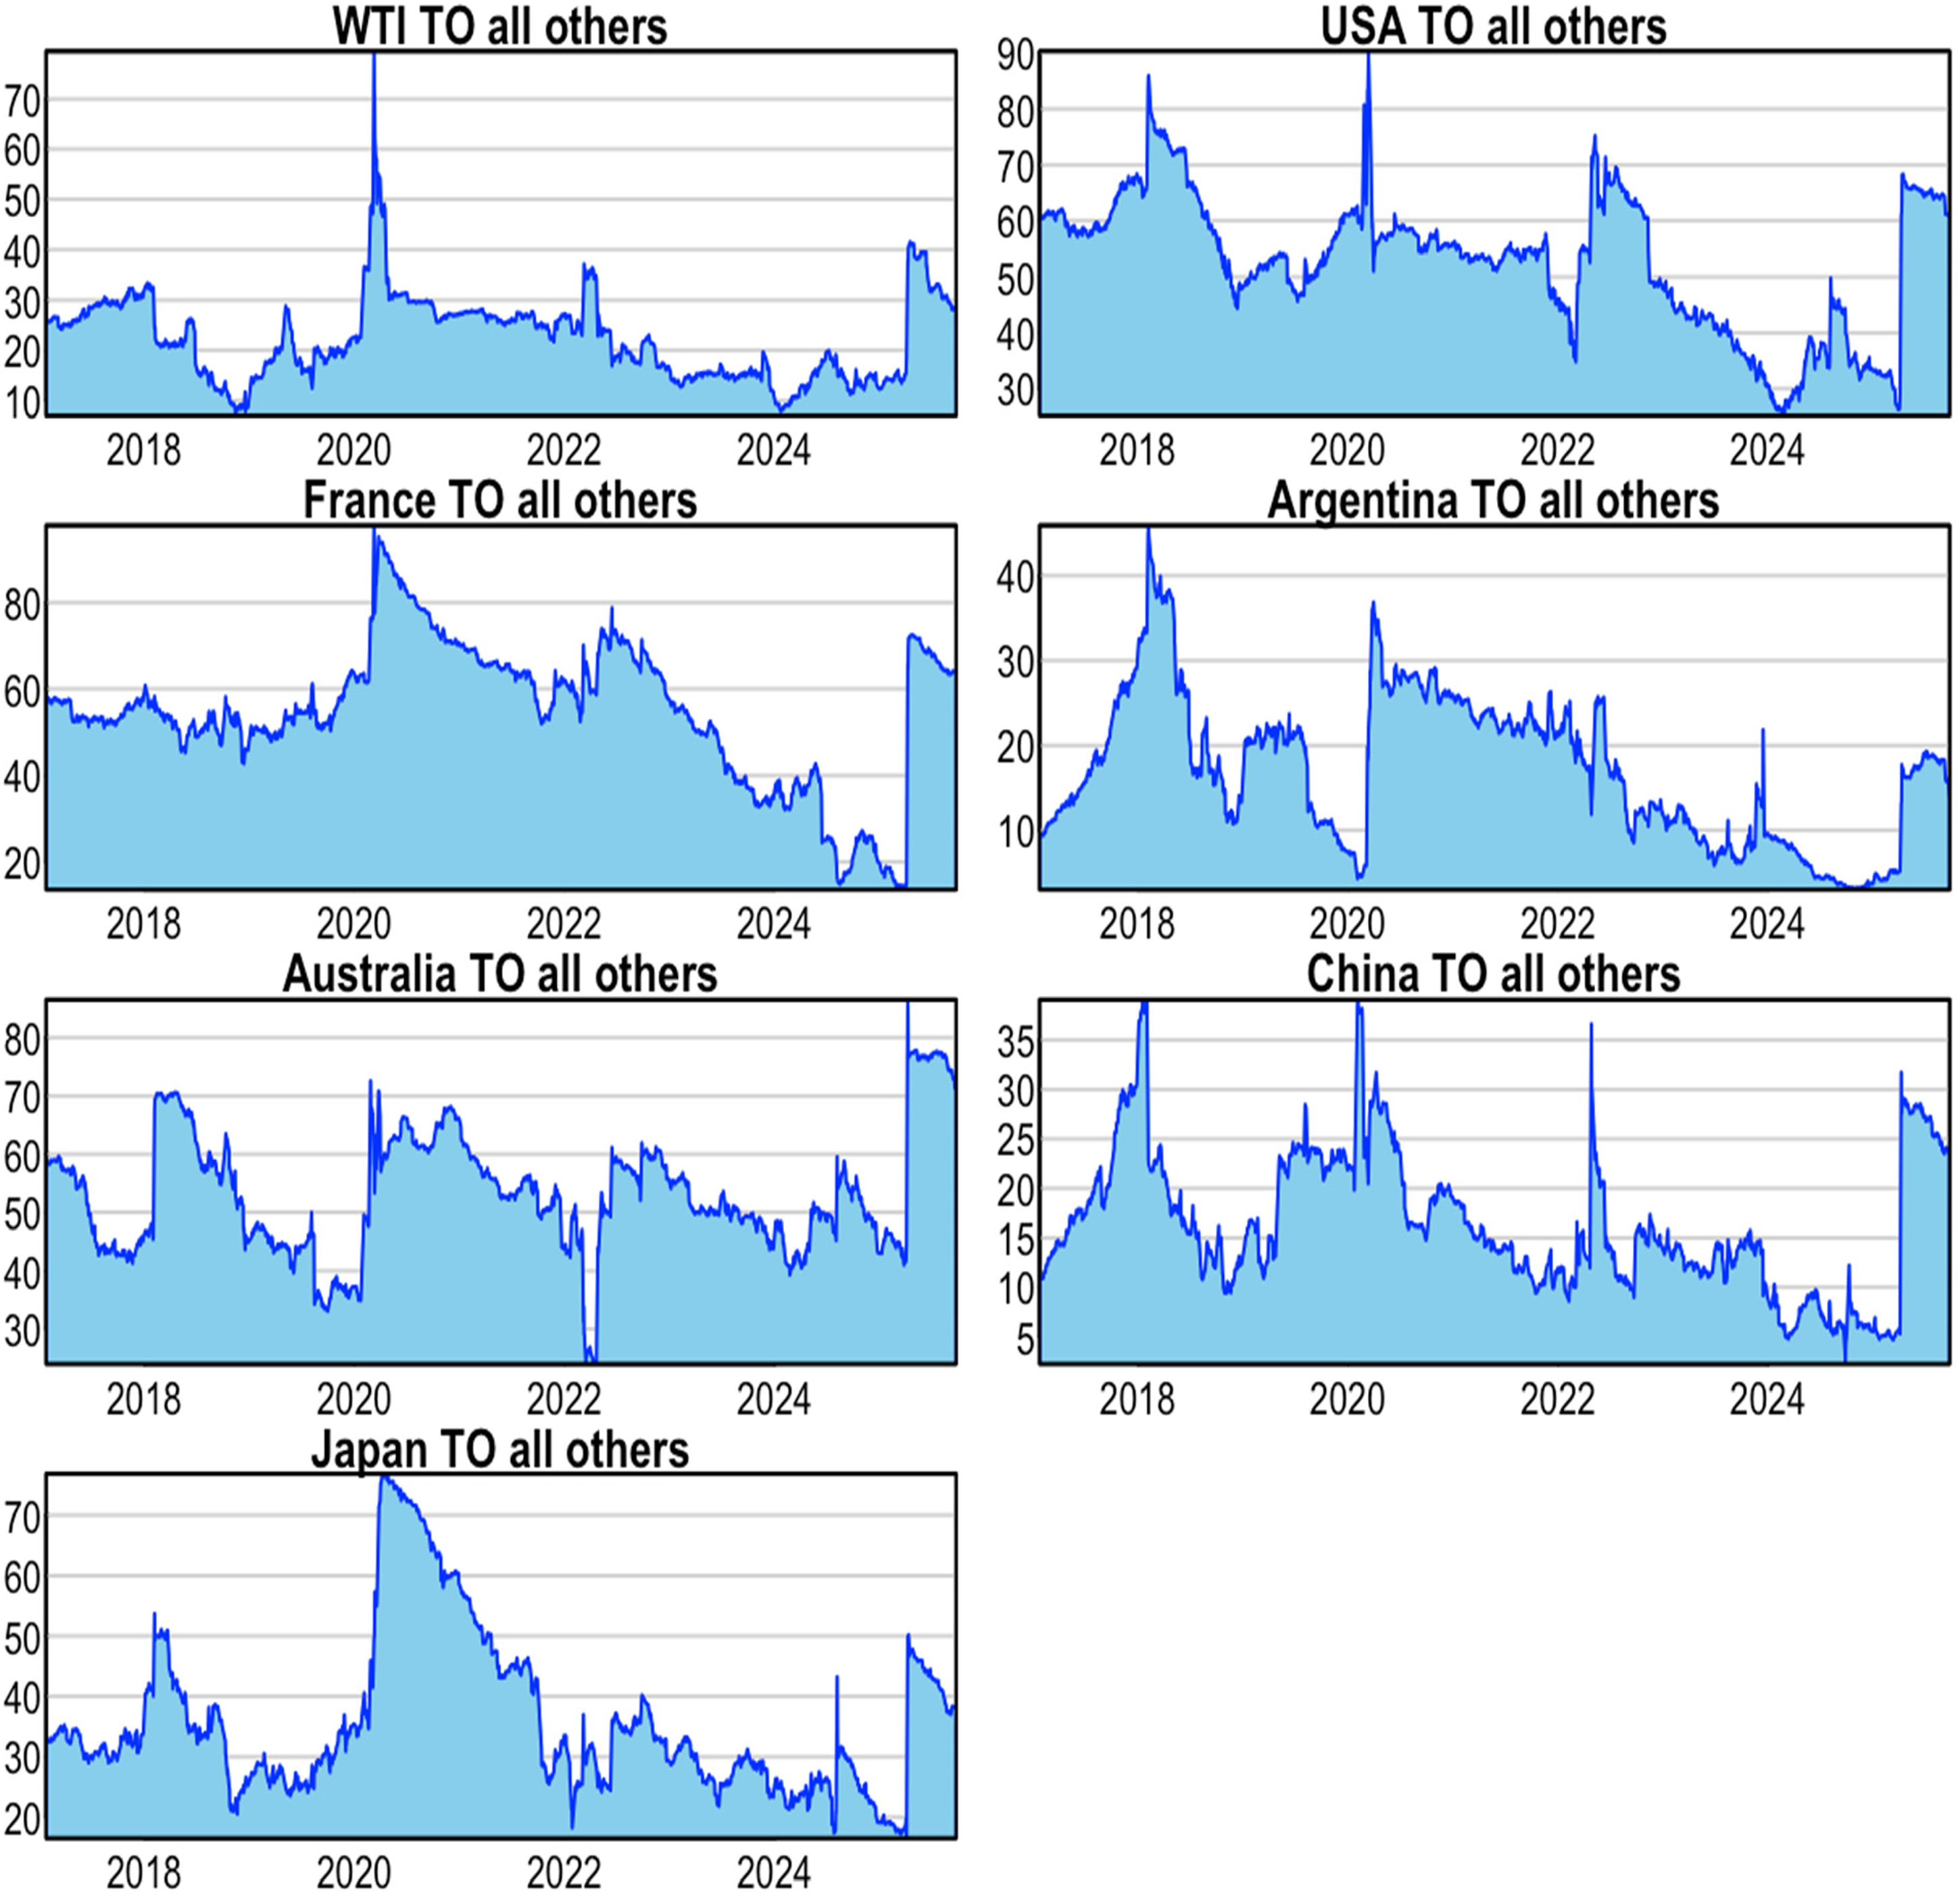
To volatility dynamic connectedness index of crude oil (Authors own).
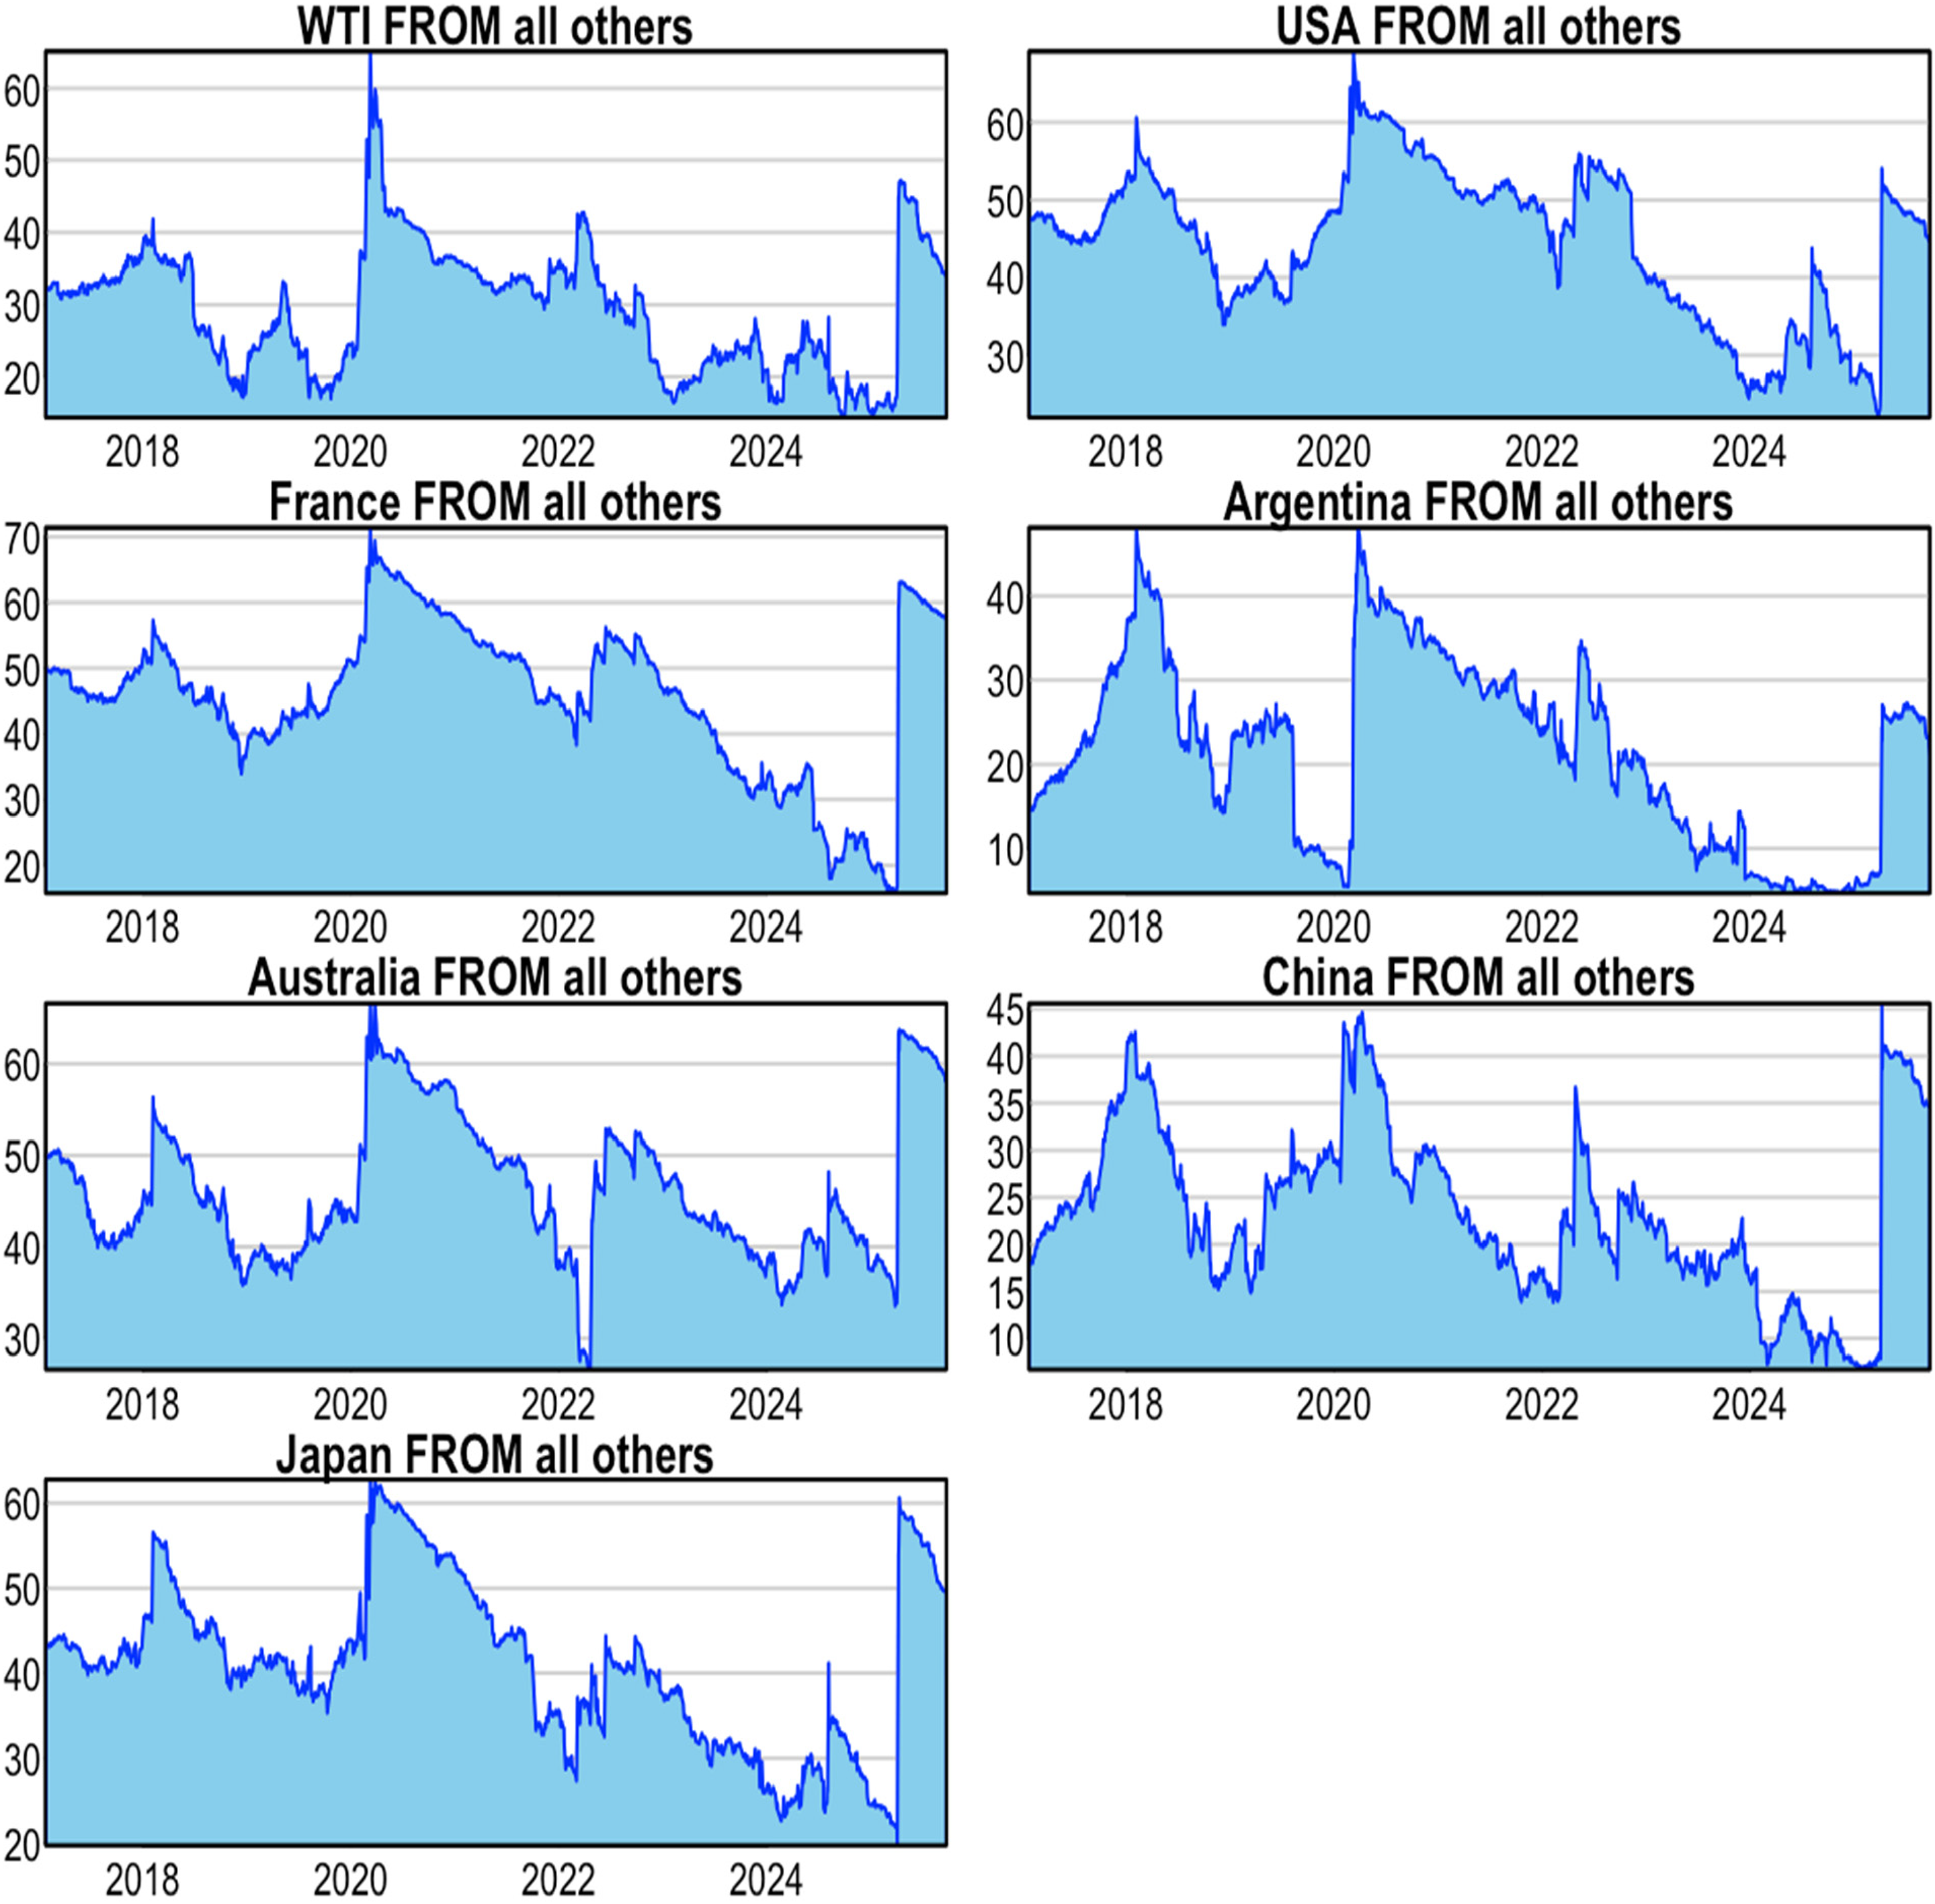
FROM volatility dynamic connectedness index of crude oil (Authors own).
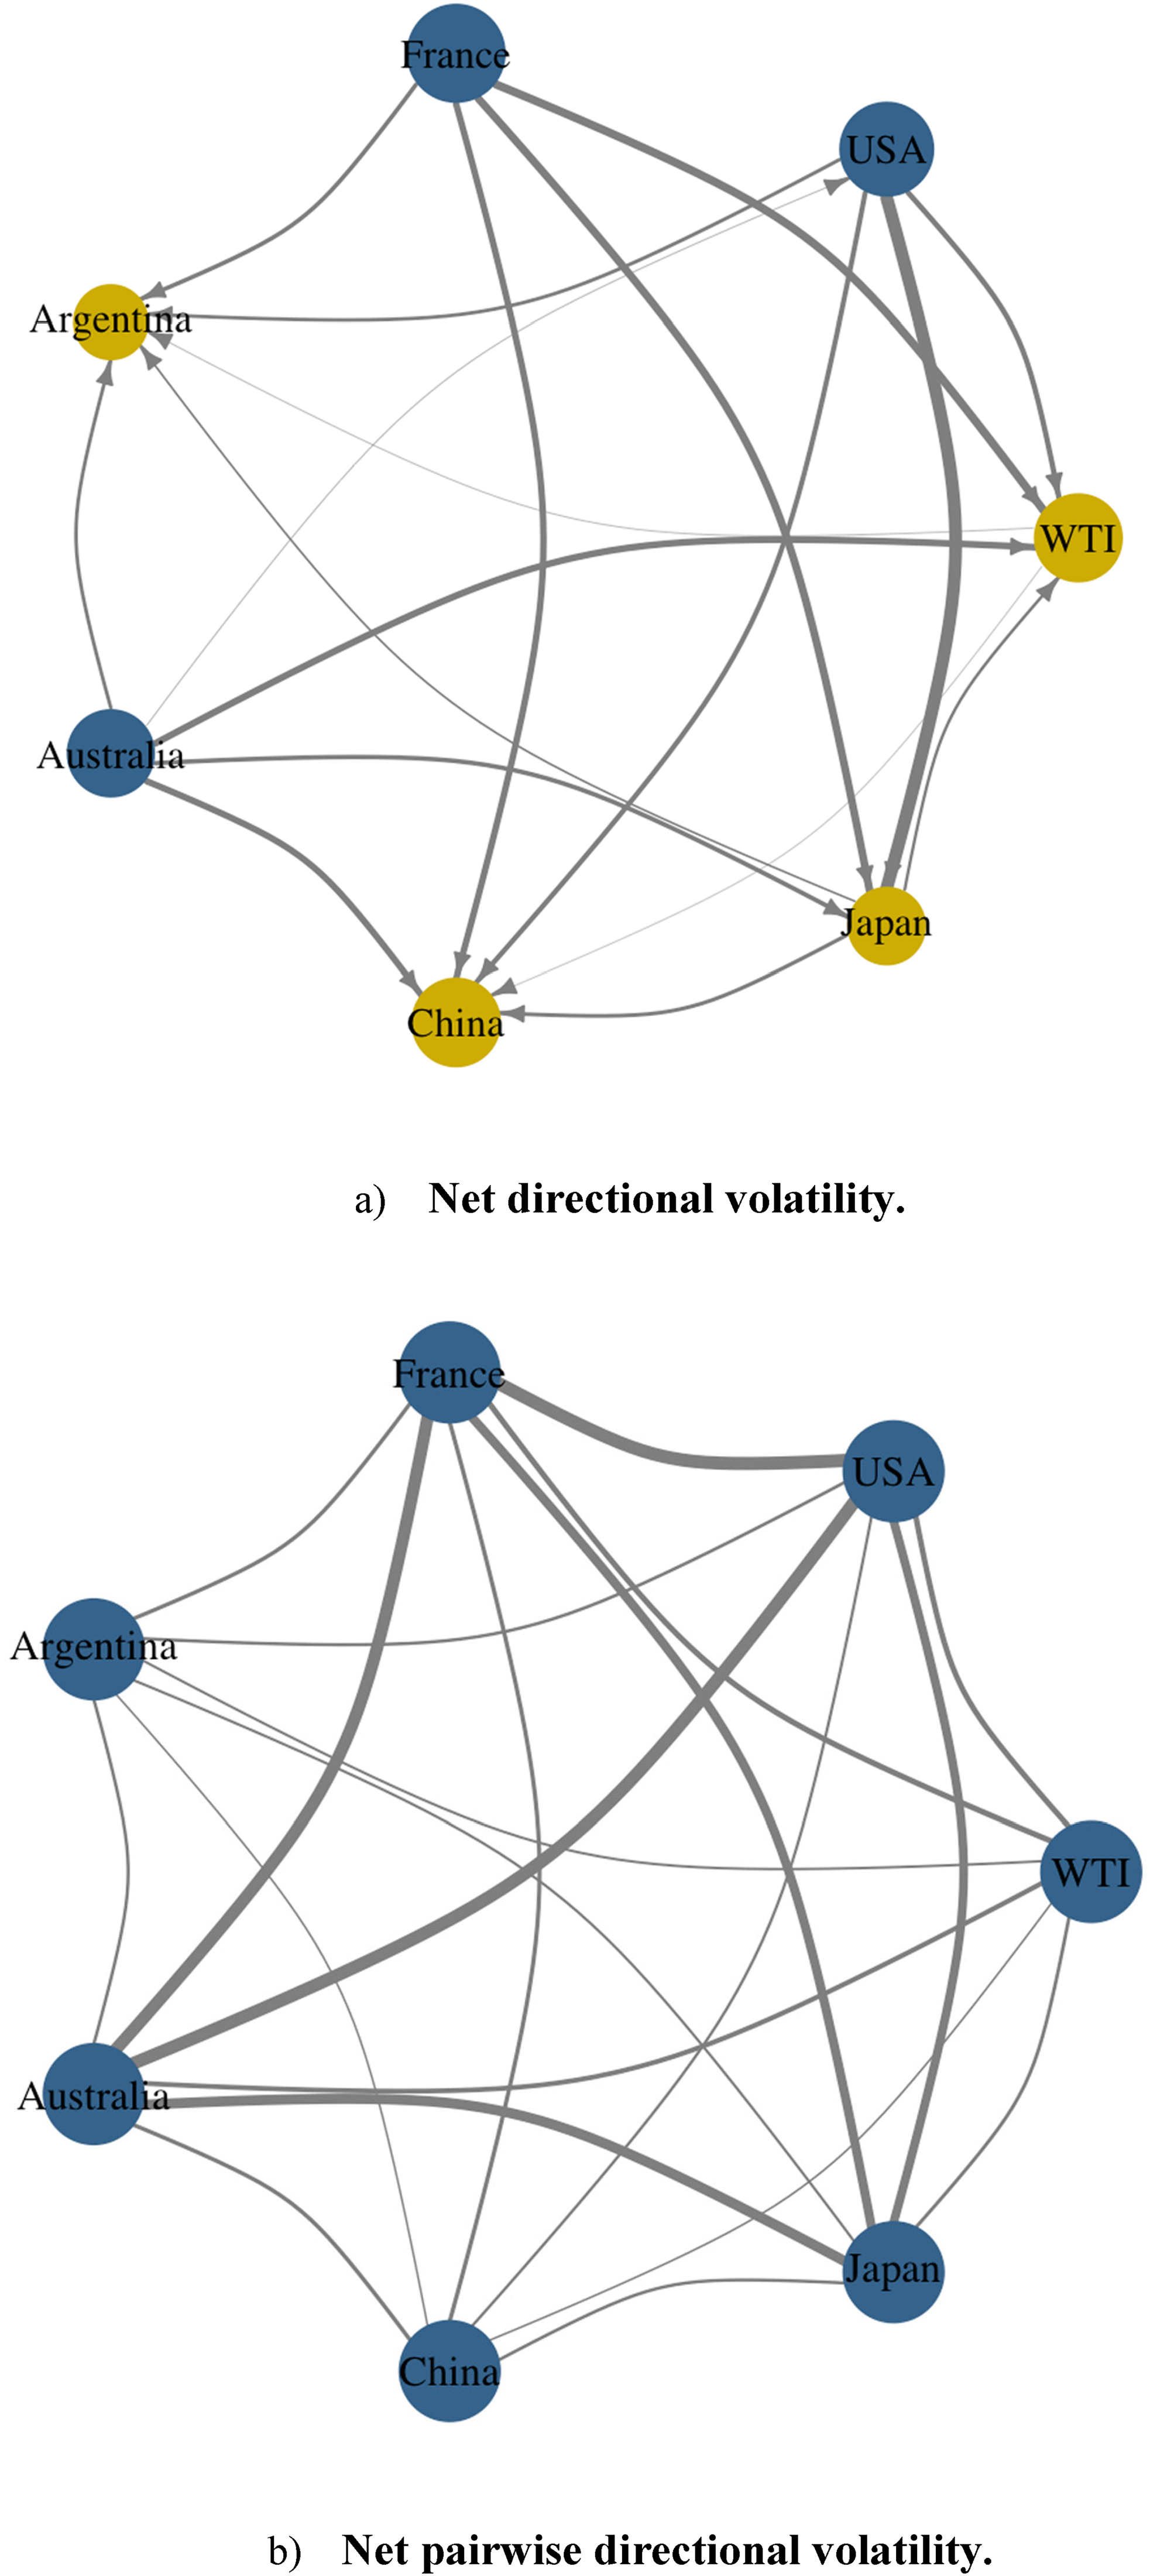
Net directional volatility (Authors own).
The patterns of volatility spillovers across all markets in the system's net pairwise directional connectedness are illustrated in Figure 10. We constructed a network graph to illustrate the directions and intensity of net volatility spillovers across time. The blue node indicates the net transmitter, and the yellow node indicates the net receiver. Each network graph displays an arrow from market i to j, indicating positive net volatility spillovers. The thickness of the arrow represents the level and magnitude of volatility spillover. Consequently, the net pairwise volatility spillover is higher for denser arrows, and vice versa (see Figure10(b)). Figure 10(a) and (b) show net directional volatility and net pairwise volatility, respectively. Figure 10(a) illustrates the net directional volatility, which indicates that the USA, France, and Australia are net transmitters of shock spillover to other markets. Whereas the size of nodes denotes the strength of transmission, the USA possesses a larger node size compared to France and Australia. In addition, the market's characteristics are defined by the node's hue. Figure 10(b) reveals that the strongest net pairwise volatility spillover occurs between the USA and France, the USA and Japan, the USA and Australia, Australia and Japan, and Australia and France.
Figure 11 shows τ equal to 0.1 for bearish, τ equal to 0.5 for normal, and τ equal to 0.9 for bullish market conditions, via the quantile VAR method. Based on subsequent analysis, the figures relate to the net total directional connectedness, which quantifies the net transmission and receipt of shocks. The results indicate that in bearish market (tau equal 0.1) conditions, the USA, France, Japan, and Australia are net transmitters of shocks, See Figure 11(a). However, under bullish market (tau equal 0.9) conditions, the net transmitters are the USA, France, and Australia, whereas the USA is the major net transmitter among considered market conditions, See Figure 11(c). This suggests that the financial shocks to the stock markets of the USA, France, and Australia have a greater effect on other markets than they do on one another. These markets seem to have a big impact on the other markets, such as WTI, China, and Argentina. Under bullish and bearish market conditions, the USA, France, and Australia are the major net transmitters, whereas Japan is a net transmitter only in bearish market conditions. Meanwhile, under normal market conditions, Japan does not appear to be the net transmitter (see Figure 11(b)). The United States, in contrast, maintains itself as a net transmitter under all market conditions. This finding is aligned with Behera & Rath 24 This in-depth study demonstrates that the quantile VAR, with a tau of 0.5, and the dynamic connectedness approach consistently reveal both the USA and France as net transmitters in return and volatility spillover. Table A1 and Table A2 present the NET connectedness across the quantile along with their TCI for both return and volatility series. The findings demonstrate that Argentina and China consistently function as net receivers throughout the quantile, encompassing both return and volatility series. Japan functions as a net receiver from quantiles 0.1 to 0.7, whereas it transitions to a net transmitter for quantiles 0.8 and 0.9 in the return series. On the other hand, the USA, France, and Australia always perform the role of net transmitters throughout the quantile of the return and volatility series. The outcome illustrates the differences between the investment policies and market responses of various countries. These patterns can be important pieces of advice that can be given to investors who want to successfully operate in the international financial markets.
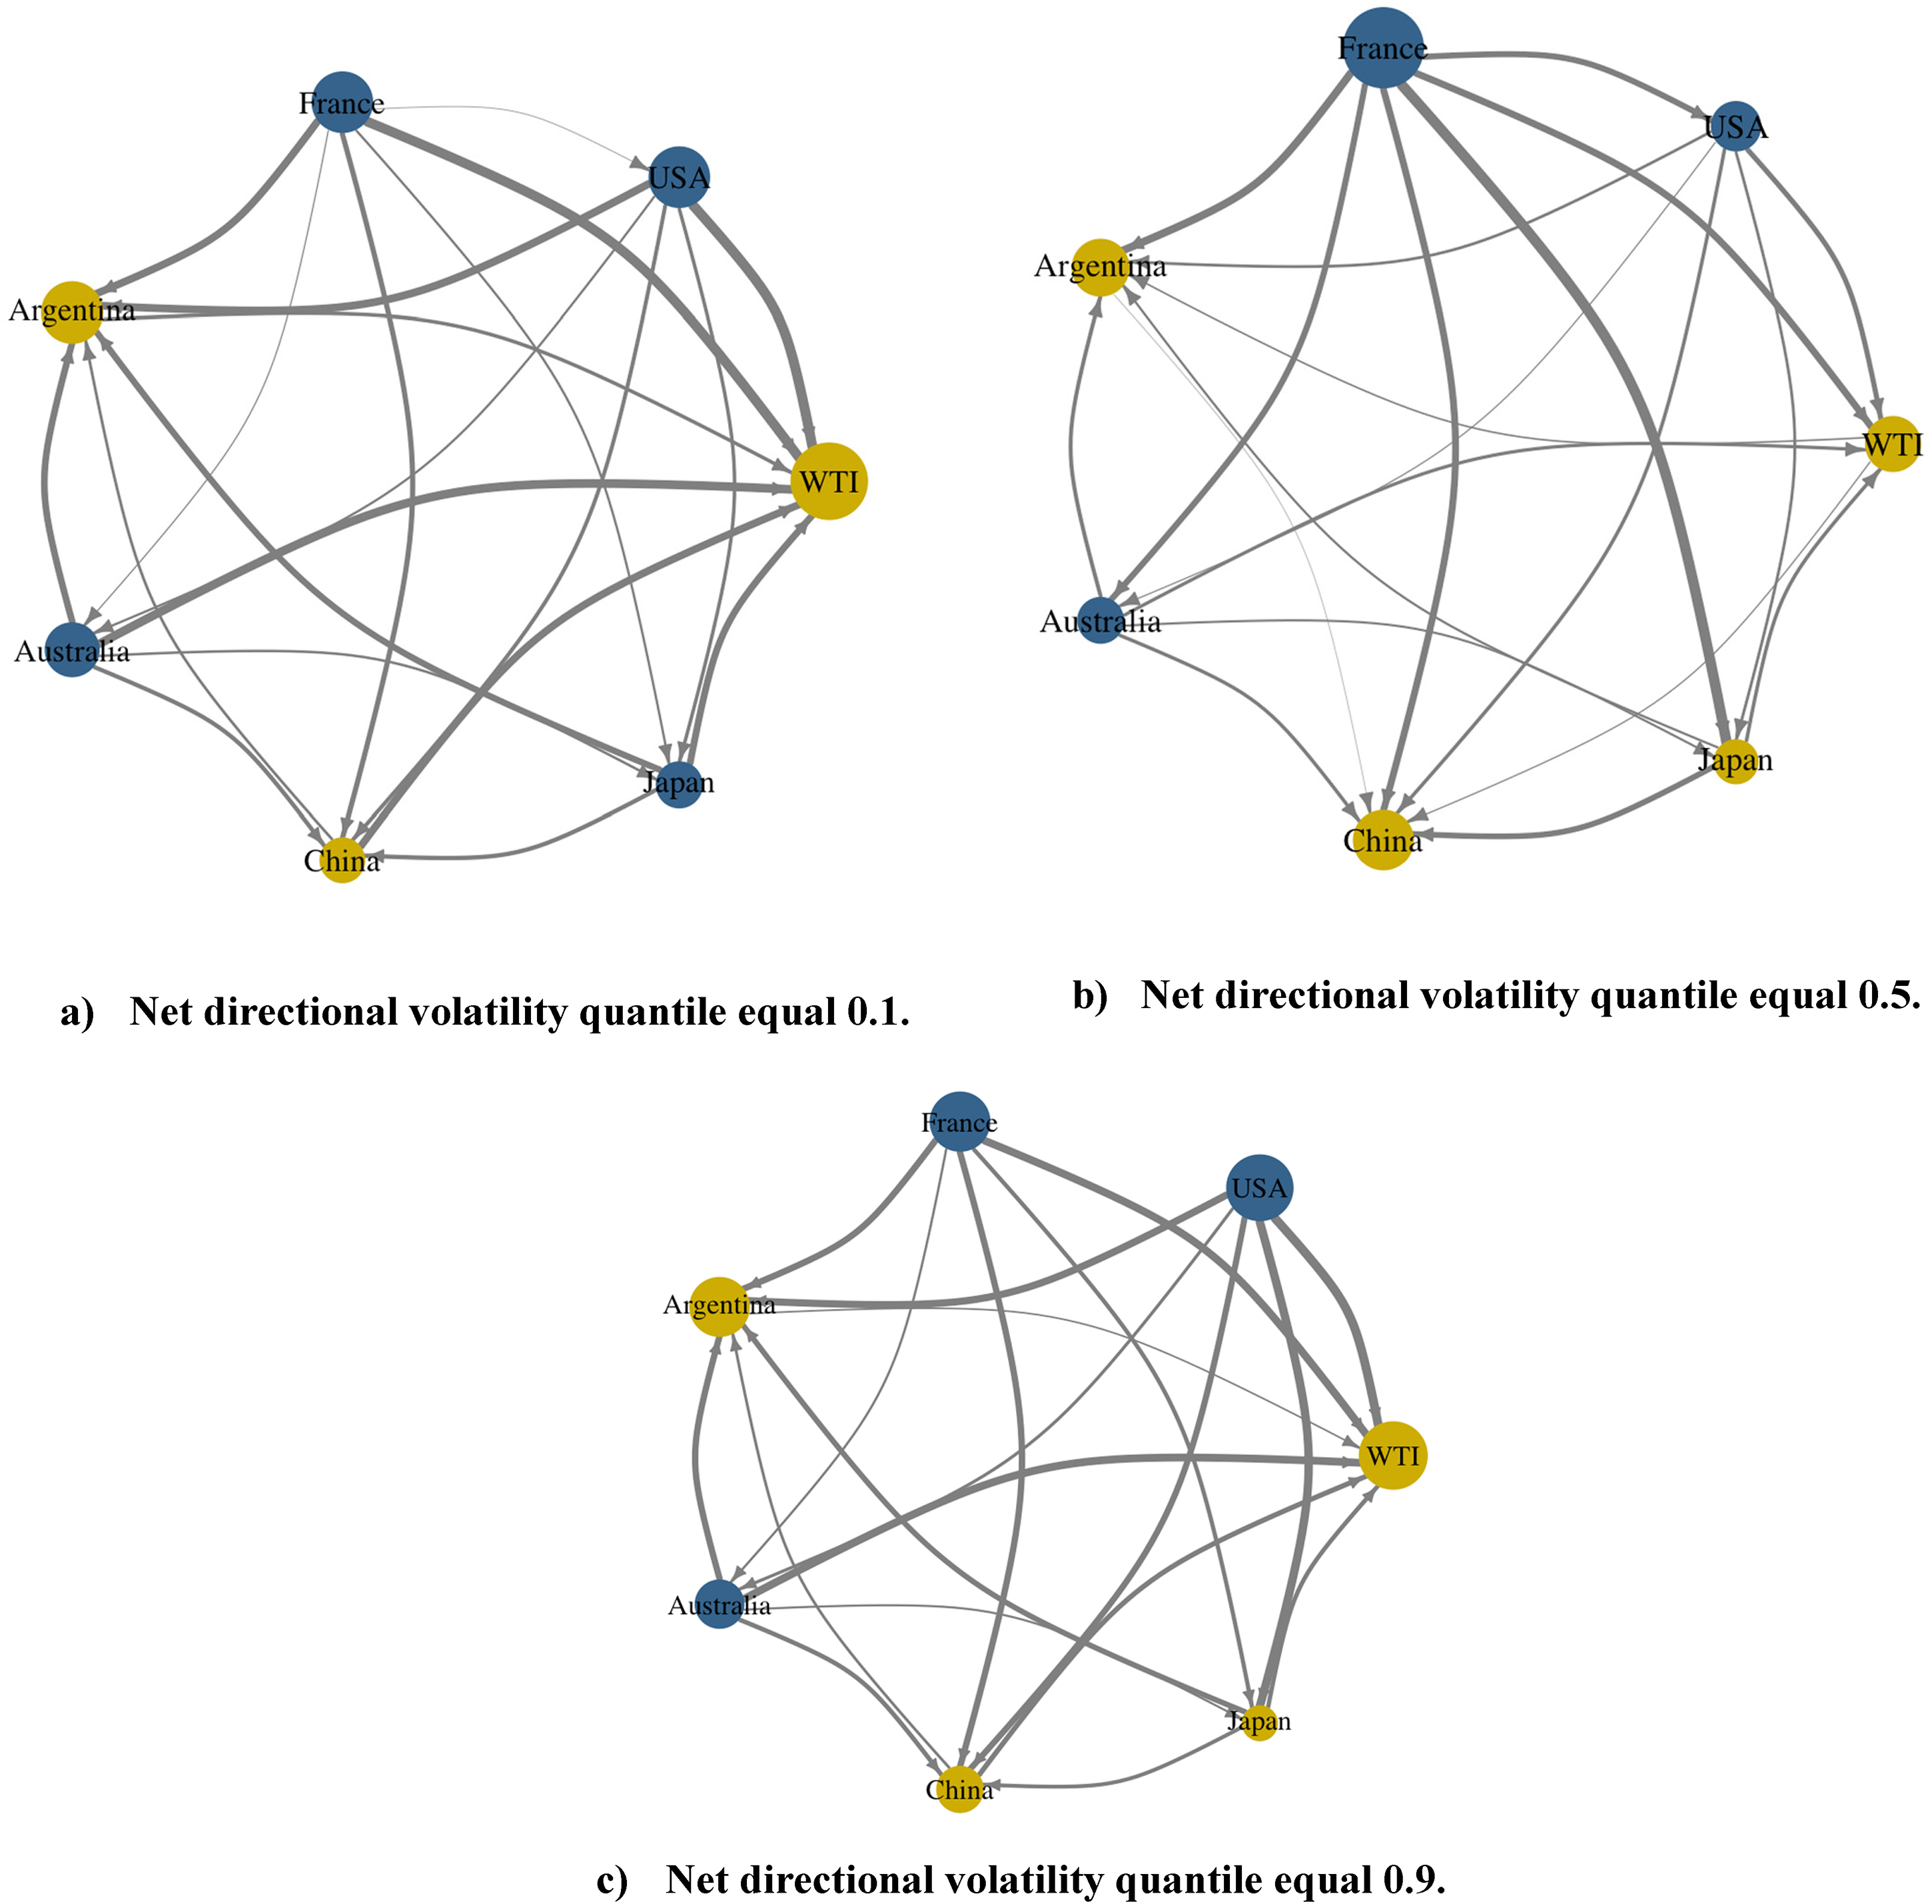
Net directional Volatility of quantiles (Authors own).
Our findings demonstrate that it is not enough to consider only a single approach to illustrate our finding as the stock market is volatile and behavior of the market changes according to the market conditions which is not ideal to cater with Antonakakis et al. 25 dynamic connectedness method even considered full sample, per/post COVID area. The quantile VAR examine return and volatility spillover under different market conditions. We found that the level of connection increases significantly when the market faces adverse events such as the COVID-19 outbreak, the Ukraine-Russia war, economic uncertainty, and the tariff war. The dynamic connectedness result indicates that the USA, Australia, and France act as net transmitters, while Argentina, Japan, WTI, and China act as net receivers. These findings of the dynamic connectedness approach remain constant across the full sample, pre-COVID, and post-COVID analyses. The application of quantile VAR reinforces the reliability of these findings across a range of market conditions. The general trend of volatility transmission is incredibly dynamic with the peak being during the recent tariff war and the COVID-19 pandemic. The USA, Australia and France become net transmitters during volatility and return transmission occurrence, which implies that the stock market is increasingly becoming more interconnected with these occurrences and more susceptible to other financial assets. The paper underlines the vulnerability of assets like the WTI crude oil which is a net receiver to volatility of these major markets. The results describe the importance of considering global market interconnectedness as dynamic, particularly in times of economic instability, and emphasize the need for investors to understand the magnitude of such shocks throughout financial markets.
Conclusions
This paper evaluates how the WTI crude oil market is linked to the stock market of G20 countries such as France, Australia, Argentina, China, Japan, and the USA using the daily data of January 24, 2017, to September 22, 2025. To deepen the insight into the impact of spillovers, we use dynamic network connectedness method constructed by Antonakakis et al. 25 and the quantile VAR that would be more effective to represent asymmetry in the transmission of returns and volatility by defining τ as 0.1 in bearish market and τ 0.9 in bullish market. Unlike the traditional mean-based models, which assume symmetric spillovers between positive and negative movements in a market setting; quantile VAR will be a more comprehensive feature since it will allow us to examine the spillovers under different market conditions such as bullish and bearish market periods. This ability adds to a better comprehension of how market shocks go round thus facilitating better policy recommendations and investment practices. United States, Australia and France are net transmitters of returns and volatility, and Argentina, Japan, WTI and China are mostly net receivers. It is worth noting that the United States, Australia, France and Japan are the significant providers of the volatility information in the bearish cases and the United States is the largest among them.
The results underscore the very important role played by the United States and France in shaping the stock market trends in other G20 nations. The net-receiving markets may experience unexpected changes due to the information conveyed by these marketplaces. Risk-averse investors can reduce their exposure to these countries, while risk-seeking investors can capitalize on market volatility. Financial authorities and governments may take advantage of such insights to avoid shocks, by adopting risk-reduction policies in net-receiving markets. The net transmitter markets increase the global volatility but provide strategic diversification and defensive positioning by holding assets. This can be managed by investors using options, volatility indices and dynamic reallocation of portfolio. Nonetheless, the risk of allocation to net receiver markets may reduce in case of crises as they receive more inbound than outbound shocks. Portfolio risk is minimized through the diversification of transmitters and receivers. During a crisis period, investors ought to hedge cross-assets, such as commodities like WTI, and redistribute the allocations depending on the net transmitter and receiver roles. Volatility hedging and index options help the transmission markets address volatility.
Financial regulators should establish real-time monitoring systems that pay attention to the relationship between the WTI crude oil market and the stock market to make the market more stable. Early warning of volatility spillover indicators should be prepared especially in bearish and bullish market conditions. The policy makers must be keen on building resilience in the net-receiving countries like Argentina, China, and Japan through development of stress tests and risk-reduction strategies especially when the volatility is expected due to the USA and France. Since the market is less predictable under the circumstances of crises such as the COVID-19 epidemic and the war in Russia and Ukraine, governments should ensure that they have sound procedures that will address the issues of geopolitics, and supply chains. The aspect of enhancing the economic resilience and saving investors will not only stabilize the stock markets but also lead to long term economic growth in the G20 countries.
Footnotes
Ethical approval
This research does not contain any studies with human participants or animals performed by any of the authors.
Authors contributions
All authors contributed equally to this work. They provided critical feedback and helped shape the research, analysis, and manuscript.
Author notes
Faridoon Khan is currently affiliated with Faculty of Computing and AI, Air University, Islamabad, Pakistan. Arshian Sharif is currently affiliated with Department of Accounting Finance and Economics, Sunway University, Malaysia; Vizja University, Warsaw, Poland; and College of International Studies, Korea University, Seoul, South Korea.
Funding
The authors received no financial support for the research, authorship, and/or publication of this article.
Declaration of conflicting interests
The authors declared no potential conflicts of interest with respect to the research, authorship, and/or publication of this article.
Data availability statement
Data are available from the authors upon request.

Author biographies
Appendix
Quantile VAR NET and TCI values across the quantiles of volatile series.

| Connectedness index | WTI | USA | France | Argentina | Australia | China | Japan | TCI | |
|---|---|---|---|---|---|---|---|---|---|
| Quantile 0.1 | NET | −9.26 | 7.9 | 9.8 | −7.53 | 5.94 | −10.65 | 3.79 | 64.91 |
| Quantile 0.2 | NET | −8.97 | 8.42 | 11.62 | −8.32 | 4.84 | −10.81 | 3.22 | 60.39 |
| Quantile 0.3 | NET | −8.18 | 8.42 | 12.62 | −8.92 | 4.35 | −10.41 | 2.12 | 54.91 |
| Quantile 0.4 | NET | −7.35 | 7.26 | 14.28 | −7.91 | 3.07 | −9.45 | 0.1 | 47.85 |
| Quantile 0.5 | NET | −5.99 | 3.65 | 16.41 | −6.75 | 2.19 | −8.08 | −1.43 | 41.02 |
| Quantile 0.6 | NET | −9.27 | 5.18 | 17.79 | −6.43 | 4.9 | −7.31 | −4.86 | 37.3 |
| Quantile 0.7 | NET | −12.04 | 11.95 | 20.11 | −9.64 | 5.77 | −8.08 | −8.06 | 41.72 |
| Quantile 0.8 | NET | −19.21 | 20.26 | 18.84 | −16.36 | 11.28 | −10.82 | −3.98 | 60.62 |
| Quantile 0.9 | NET | −16.59 | 18.25 | 8.15 | −16.86 | 12.15 | −2.1 | −3.01 | 78.81 |