
Abstract
Although there is considerable research evidence to show that children in lone parent families are at increased risk of poverty, there have been few comparative analyses of lone parents in Europe. Using the EU Statistics on Income and Living Conditions (EU-SILC) 2009, this paper compares the prevalence and characteristics of lone parent families, analyses the poverty and deprivation risks of children, and evaluates the potential impact of social transfer income packages on child poverty reduction. We use the unique personal identifiers of mothers, fathers and partners to define lone parent families with greater precision. Using a multi-level framework, we find lower child poverty rates in countries with more generous social transfers, even after controlling for the country standard of living. A reverse pattern is observed for material deprivation: the negative effect of social transfer income washes out when the GDP per capita is controlled for, which itself has a negative and significant effect on material deprivation.
Perhaps one of the most striking changes in family form in industrialized countries in the last 50 years has been the growth of lone parent families, the majority headed by a woman. It is very well documented that children are significantly more likely to be poor if they live with only one parent (Kamerman, 1984; Sorensen, 1994; Christopher et al., 2002; Rainwater and Smeeding, 2003; Robson and Berthoud, 2003; Social Protection Committee, 2008; Bradshaw and Chzhen, 2009; Atkinson and Marlier, 2010). However, the mechanisms that lead to increased socioeconomic vulnerability of lone parent families differ across countries and depend on the characteristics of lone parents (European Commission, 2007). This study analyses the relationship between poverty risks of children in lone parent families, characteristics of lone parents, and social transfer income levels in the enlarged EU.
Tackling child poverty is high on the EU’s political agenda. It was a priority in the March 2006 European Council, a focus of many of the National Reports on Social Protection and Social Inclusion 2006–2008, and the main work of the EU experts on the National Action Plans in 2007. An influential report by the Social Protection Committee (2008) reflected much of this effort and contained detailed comparative analysis of child poverty using the new EU Statistics on Income and Living Conditions (EU-SILC) 2005. The report drew attention to the fact that in the majority of the EU member states, children are at a higher risk of poverty than the population as a whole. More recent analyses of the EU-SILC (Atkinson and Marlier, 2010; Tarki, 2010; Tarki, 2011) confirmed this finding. As a part of its 10-year economic plan, the June 2010 European Council set the target to reduce poverty and social exclusion in the EU by 20 million (European Council, 2010). If this objective is to be achieved, lone parents and their children will need to be a key focus of anti-poverty policies.
Although there is a large body of research on lone parenthood, there have been relatively few EU-wide comparative analyses of lone parent families. The report by Foundation G. Brodolini (2007) undertook a child poverty analysis in lone parent families using Luxembourg Income Study data for circa 2000 for 14 EU countries and complemented this with an analysis of labour market participation and policy using national informants. However, the study did not use a common definition of lone parent families for all countries due to differences in national data sources. Ritakallio and Bradshaw (2006) analysed child poverty rates using harmonized data from the European Community Household Panel 1994–2001 for the EU-15, finding that countries with more generous child benefit packages had lower child poverty rates, on average. They did not look specifically at the relationship between child benefit packages and child poverty in lone parent families. Kilkey (2000) analysed the policy contexts of paid work and care giving for lone mothers across 20 developed countries and compared the levels of lone mothers’ economic well-being. Bradshaw et al. (1996) compared the characteristics and employment of lone parents in the UK and 19 other industrialized countries in the early 1990s using data provided by national informants.
There is relatively little comparative social policy theory that explains the country level relationship between child poverty rates in lone parent families and social transfer income packages available to them. In the first study focusing specifically on policy inputs and outcomes for lone parents, Kilkey (2000) finds no support for the mainstream welfare regime typology (Esping-Andersen, 1990, 1999) and only limited support for feminist models (for example, Lewis and Hobson, 1997). Thus, liberal regimes such as Ireland and the UK emerge as supporting or enabling (by the provision of social assistance without work requirements) lone mothers more strongly as (out-of-work/de-commodified) carers than paid workers, but at the expense of leaving them vulnerable to poverty. Corporatist Austria and Germany appear in the same category as most of the social-democratic countries (except Sweden), supporting or ensuring that lone mothers are both paid workers and carers. Sweden and Belgium form a separate cluster where lone mothers are ‘supported as paid workers who care’, similarly to Lewis’ parent–worker model (Kilkey, 2000: 268). However, poverty risks, due to the level of in-work tax and benefit package and the costs of childcare, are higher for working lone mothers in Germany and Austria than for their counterparts in Scandinavian countries, France and Belgium. As the period of Kilkey’s study precedes the EU enlargement, its relevance to the present research is limited. Nevertheless, we expect to find varying impacts of social transfer packages on the risks of both child poverty and material deprivation in lone parent families, even after controlling for lone parents’ employment status.
This paper is an up-to-date comparative analysis of lone parents and child poverty, using a more precise definition of lone parenthood than the one generally used in the literature. We employ two different measures of child poverty: relative income poverty and material deprivation. Using internationally comparable micro-data on living conditions from the EU-SILC (2009) and macro-data from the CSB-Minimum Income Protection Dataset (Van Mechelen et al., 2011), we model the effects of social transfer income packages on the risks of child poverty in a multi-level framework, with a child under 18 years old as the main unit of analysis. The next section compares the prevalence of lone parent families based on the EU-SILC household type classification and the definition of lone parents adopted in this paper. This is followed by a discussion of the characteristics of lone parents, the risks of child poverty and material deprivation in lone parent families, and the analysis of the association between social transfers and the risks of child poverty and material deprivation in the enlarged EU.
Prevalence of lone parent families
While there may be different definitions of lone parent families in specific national contexts, comparative cross-country studies tend to define lone parent families as those where a parent lives with his/her dependent children, without a spouse/partner, either on their own or within a multi-unit household (Duncan and Edwards, 1997). We opt for the more comprehensive definition of lone parents that includes those living in multi-unit households. Although due to its geographic coverage the EU-SILC is currently the best source of comparative data on the prevalence of lone parent families in the enlarged EU, it is not easy to identify the relationships between all household members. Lone parent family units living in multi-unit households are particularly difficult, but not impossible, to detect. So where, for example, a household contains three generations – grandparents, parents and children – and some of these parents are in fact ‘lone parents’, the household would often fall into the ‘other household with dependent children’ category of household type. The household type variable in the EU-SILC classifies lone parent households as those consisting of one adult and one or more dependent children, regardless of whether the adult is the child(ren)’s parent. Moreover, dependent children are defined as those under 18 years old (similarly to the definition used in this paper), but as individuals between the ages of 18 and 24 years who are economically inactive and living with at least one parent. As this study seeks to exclude the latter from its definition of children, 1 the household type variable in the EU-SILC is not suitable for the analysis.
While the EU-SILC lacks a comprehensive household grid that would describe the relationships between all household members, it reports personal identification (ID) numbers for all individuals in the household as well as mother, father and partner or spouse identifiers. Where the mother, father or partner is not a household member, the value of the corresponding ID is flagged up as missing, 2 which allows the identification of lone parent families living both within multi-unit households and on their own. Family units where a child lives with a lone parent 3 cohabiting in partnership with another adult, who is not the child’s parent, are also identified as couple families in this paper. Thus, an adult with children living with another relative or an unrelated adult, who is not his or her partner and is not the children’s parent, is treated as a lone parent in this study. In contrast, an adult with children living with a partner who is not the children’s parent are treated as a couple, although such unions may differ from cohabiting couples where both partners are the children’s parents in important ways. Given the diverse nature of cohabitation in Europe (Perelli-Harris et al., 2009), the extent to which cohabiting adults contribute to the care and financial support of their partners’ children may vary across countries. Nevertheless, this study focuses on non-cohabiting lone parents because it is the absence of a resident partner that leads to the lone parent bearing sole or primary responsibility for the well-being of children, although non-resident parents may still provide financial and emotional support to them. Furthermore, we define single adults living with unrelated 4 children under 18 years old as lone parent families, but such cases are very rare (approximately 2.5 percent of all lone parents in the sample). Although children are identified as those under 18 years old, non-partnered individuals aged 15–17 years who have their own children in the household are treated as both lone parents and children in this analysis. 5 Only 15 such lone parents (aged 16 and 17 years) are observed in the EU-SILC 2009, however.
To summarize, if a child under 18 years old has only one parent living in the same household and this parent is not in a legal or a de facto consensual union with a co-resident partner, this parent is identified as a lone parent, whose personal demographic and socioeconomic characteristics are analysed in the following sections. Furthermore, if a child lives with an adult who is not the child’s parent and is the only adult in the household, the adult is defined as the lone parent in this paper. This is a very similar methodology to that adopted in Iacovou and Skew (2010), who used the EU-SILC 2007, except that we define children living with a single unrelated adult, who might be their grandparent or another relative, as lone parent families, while Iacovou and Skew classify such households as a separate category of children not living with their parents.
Figure 1 shows the proportion of children in lone parent families using both the EU-SILC definition (that is, a single-unit household with one adult and one or more dependent children) and the broader definition adopted in this paper. Using the EU-SILC definition, the prevalence of children in lone parent families varies considerably from the low of 3 percent in Greece to the high of 19 percent in Ireland. Under the broader definition, the lone parent rate ranges from 5 percent in Greece to 24 percent in Ireland. Overall, Nordic (except Finland) and Baltic countries, as well as the UK and Ireland, have the highest lone parent rates in the enlarged EU, while relatively few children live in lone parent families in Southern European countries. The lone parent rate cannot be estimated for Portugal because the mother/father/partner identifiers are missing in the 2009-1 edition of the EU-SILC.

Proportion of children under 18 in lone parent families (%). Source: EU-SILC (cross-sectional; version 2009-1). Mother/father/partner identifiers are missing for Portugal. Child weights used.
Although the broader lone parent definition consistently yields a higher prevalence of children in lone parent families than the EU-SILC household type classification, there is considerable variation in the extent to which the two rates differ. For some countries, particularly Germany, Netherlands, Denmark, Finland and Norway, the difference between the two definitions is only 1 percentage point, but for others the broader definition results in a sizeable increase in the proportion of children in lone parent families. This is especially true for the newer member states (as well as Greece and Spain), which suggests that lone parents there face particular difficulties in forming and maintaining autonomous households. However, for some of these countries, the revised measure may be picking up the effect of a parent working abroad. It is arguable whether the absence of a parent due to that parent working abroad 6 is equivalent to the absence for other reasons. In spite of this limitation, the broader definition of lone parent families is used throughout the rest of this paper.
Characteristics of lone parents
Although we analyse the socioeconomic well-being of lone parent families from the point of view of children, the characteristics of lone parents themselves are most accurately summarized if the lone parent is the unit of analysis. Tables A1–A3 in the appendix compare the demographic and socioeconomic characteristics of lone parents across the enlarged EU. The proportion of lone fathers (of all lone parents rather than of all parents) varies strikingly from the low of 3 percent in Lithuania to the high of 30 percent in Sweden. The share of lone fathers is highest in the Nordic countries, but also in Italy, Romania and Greece. Unfortunately, the numbers of lone fathers are too low to analyse their characteristics in detail. 7 There is little variation in the average age of lone parents. As the EU-SILC does not collect individual fertility histories, it is impossible to correctly identify the age at first birth for women. We cannot, for example, determine what proportion of mothers in each country were teenagers at first birth. No substantial variation in the average number of children is observed, but lone parents in the UK and Ireland tend to have larger families than do lone parents in the other countries. Compared with mothers in couples, lone parents tend to have fewer and older children, on average (Table A4).
There is a marked divide between the old and new accession states in the share of lone parents who live in multi-unit households as opposed to living on their own with their children. Fewer than 10 percent of lone parents in Norway live in multi-unit households, compared with 71 percent in Bulgaria. In Nordic countries, as well as in Germany, France, Belgium, the Netherlands and the UK, fewer than one-third of lone parents live in such households. In contrast, more than two-thirds of lone parents live in multi-unit households in Malta, Slovakia, Poland and Bulgaria.
The vast majority of lone parents are single (never married) or divorced, with the exception of Italy (40 percent) and Malta 8 (46 percent) where less than half of lone parents fall in this category. In Iceland, Slovenia, Ireland, Norway, Sweden, Malta and the UK, at least half of all lone parents report their marital status as never married. There is remarkable variation in the proportion of lone parents who are separated, 9 ranging from 3 percent in Iceland 10 to 49 percent in Italy. It has to be noted that the meaning of separated status may differ across the studied countries, that is, legally separated or simply no longer living with the partner. 11
There is substantial cross-country variation in educational attainment of lone parents. The proportion of lone parents without upper secondary education ranges from 7 percent in Slovakia to 78 percent in Malta. In the majority of the studied countries, lone parents with upper secondary but no further or higher education are the single largest category. Only in Iceland (38 percent), Greece (39 percent) and Lithuania (57 percent) are the lone parents with further or higher education the largest group. Lone parents with lower secondary education or below are the largest group in five countries: Belgium (37 percent), Ireland (41 percent), Luxembourg (44 percent), Estonia (54 percent) and Malta (78 percent). In all countries, lone parents are less likely to have further or higher levels of education than mothers in couples (Table A4).
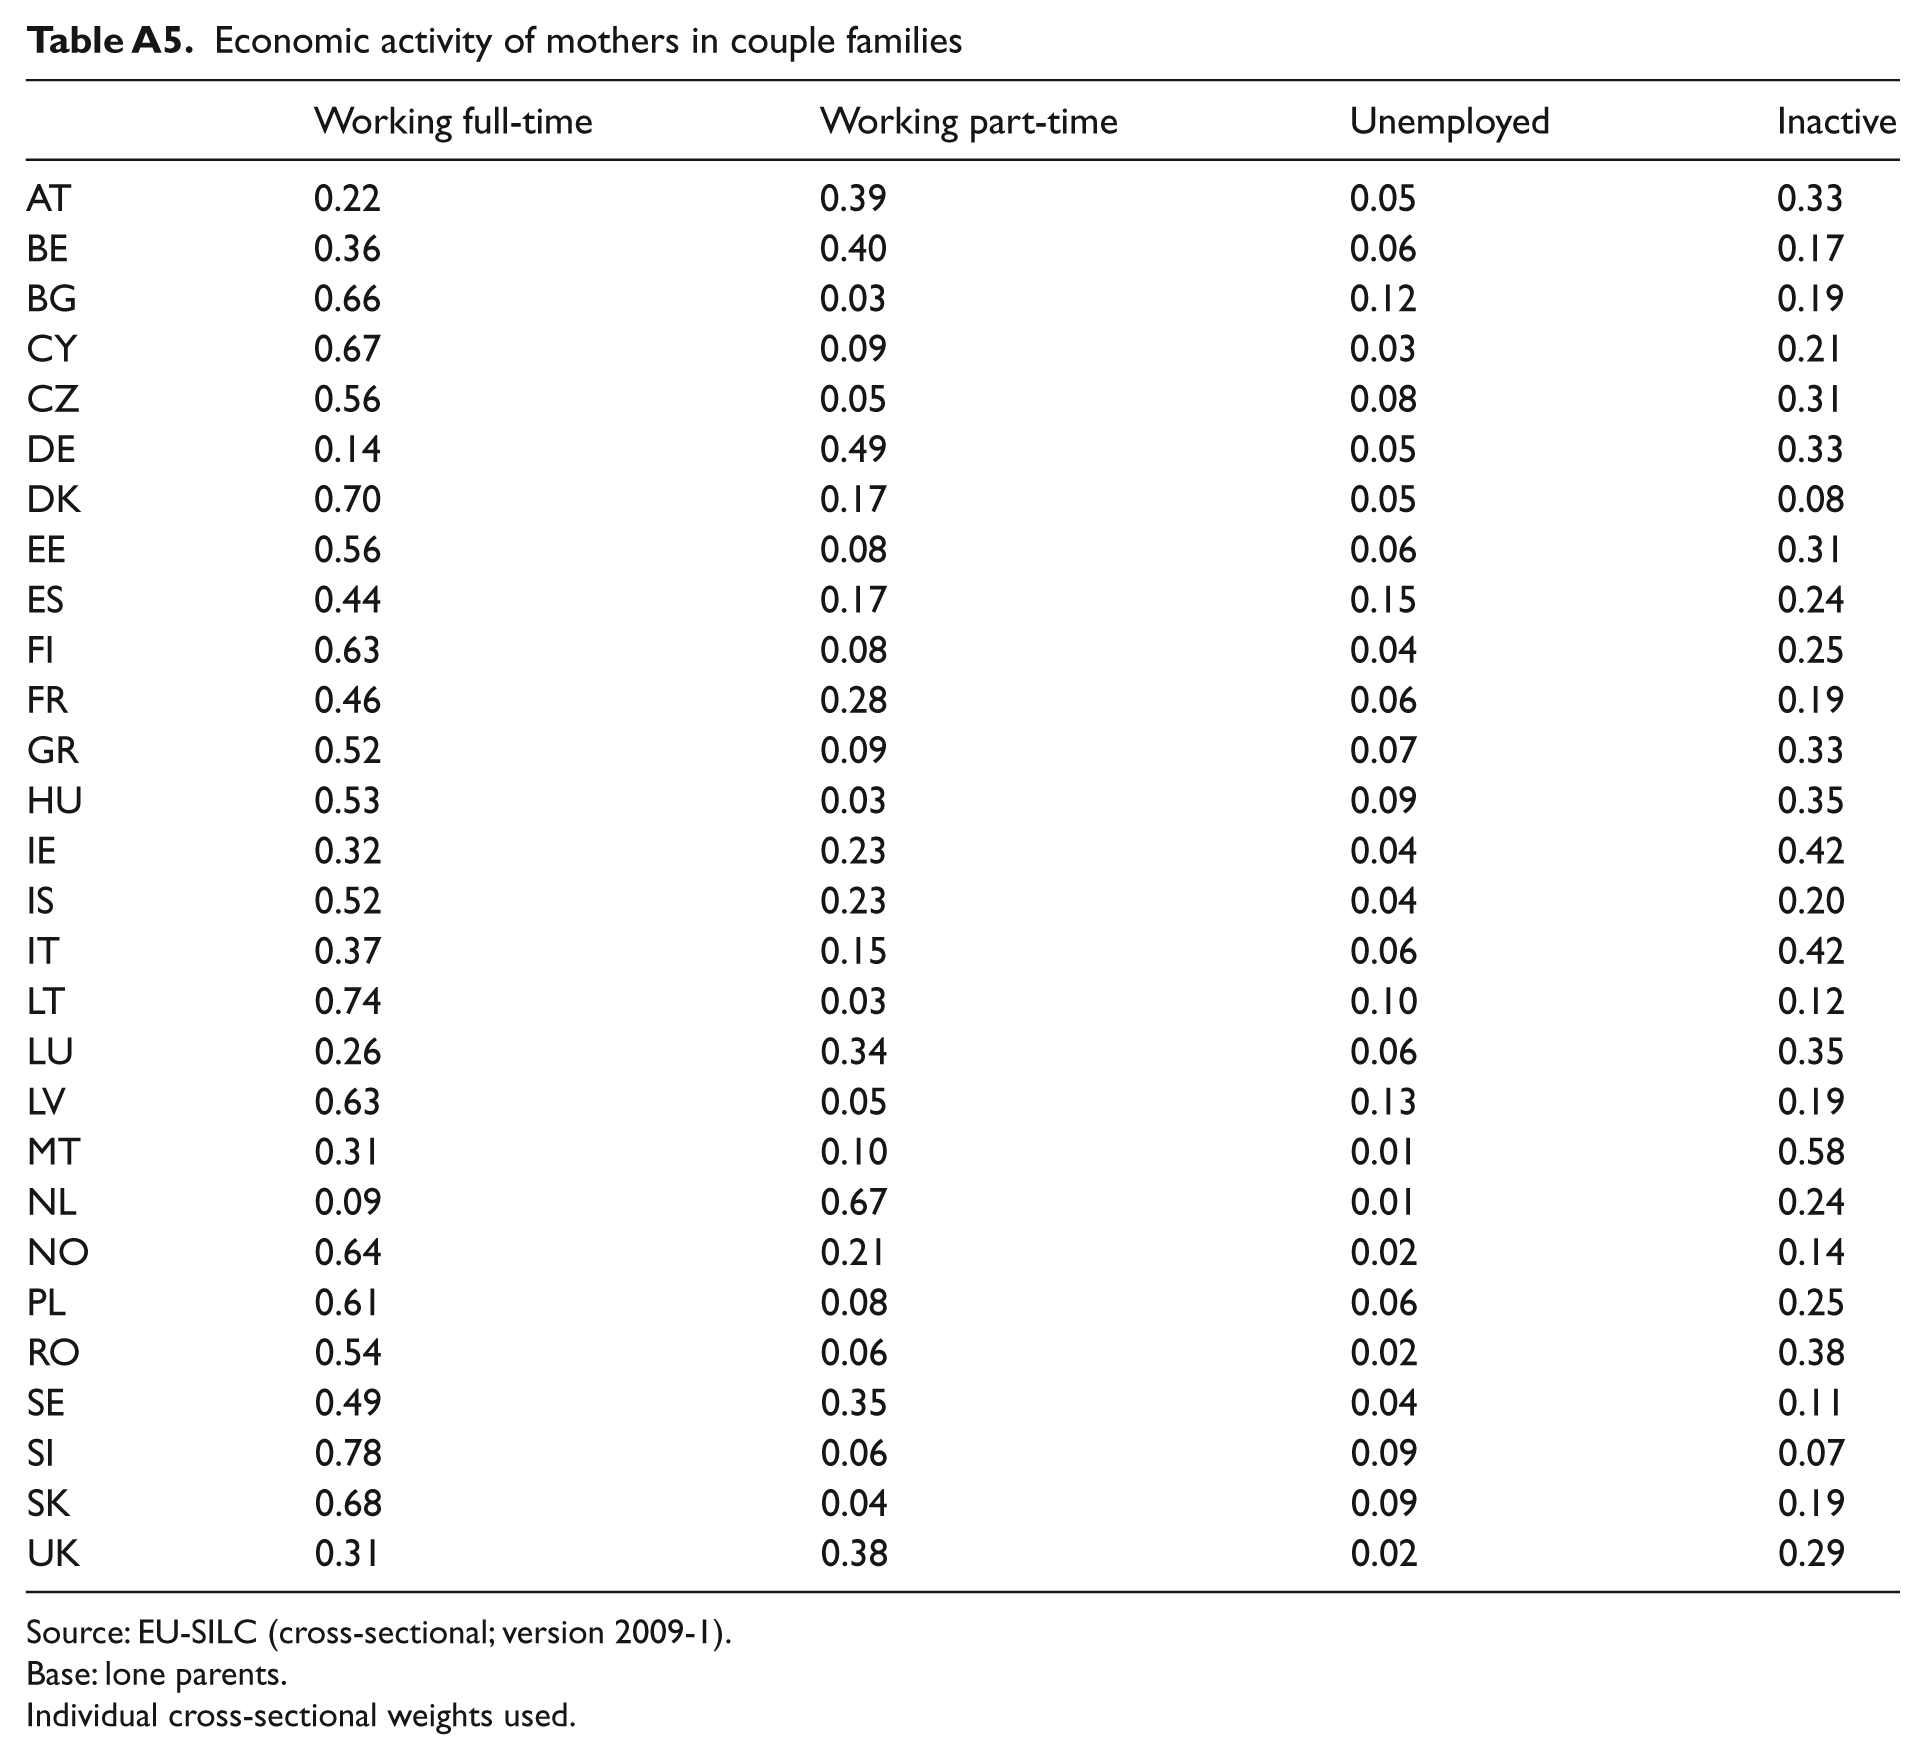
The share of lone parents working full-time 12 varies considerably from 16 percent in Ireland to three-quarters (75 percent) in Slovenia and Slovakia. The newer member states tend to have the lowest shares of lone parents working part-time, with the proportion of part-time workers reaching 11 percent in Cyprus and Malta only. Part-time work is more widespread among lone parents in the older member states, with a half (50 percent) working part-time in the Netherlands. There is a lot of variation in the shares of lone parents declaring unemployment as their main activity, ranging from 3 percent in the Netherlands to 27 percent in Germany. Since activity status is self-reported, there may be cross-country differences in the extent to which non-working lone parents are more likely to declare themselves as unemployed rather than economically inactive. 13 While only 5 percent of lone parents in Slovenia do not participate in the labour market, more than one-third fall into this category in the UK (36 percent), Ireland (49 percent) and Malta (54 percent). 14 However, compared with mothers in couple families, lone parents tend to be more likely to declare their activity status as unemployed rather than inactive. They are often more likely to work full-time and somewhat less likely to work part-time than partnered mothers (Table A5).
Poverty and material deprivation
This section analyses the socioeconomic situation of lone parent families, using the child under 18 years old as the unit of analysis. Following the Eurostat methodology for calculating the at-risk-of-poverty rates, our poverty measure is based on the annual household disposable income 15 equivalized using the modified Organisation for Economic Co-operation and Development (OECD) scale. Children in families with incomes below 60 percent of the national median are classed as income poor. Figure 2 compares the child poverty rates in lone parent and couple households. Lone parents are defined as before, but since income data are recorded on the household level, lone parent households are those with at least one lone parent family unit. 16 In all countries the relative risk of a child being poor is higher in lone parent households than in two-parent households, with the largest disparity observed in Norway (5 times) and Germany (4 times). This compares with much smaller differences in Romania (1.1) and Hungary (1.3).
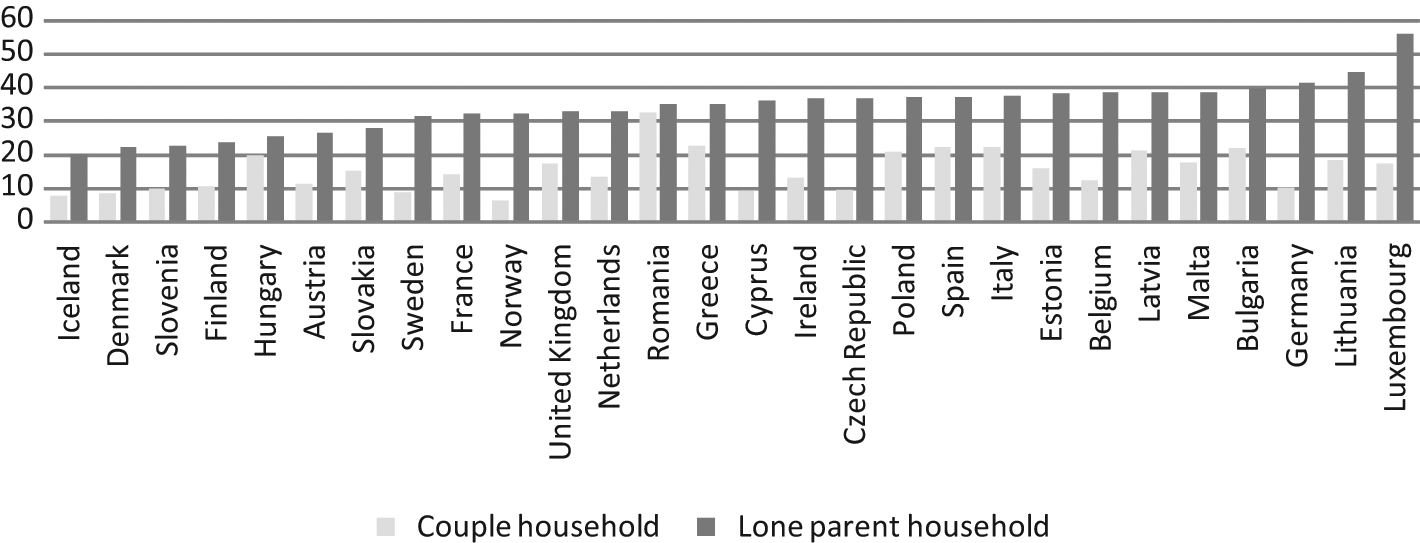
Child poverty rates for lone parents and couples (%). Source: EU-SILC (cross-sectional; version 2009-1). Base: children under 18 years old. Child weights used. Sorted by the lone parent child poverty rate.
Although the newer member states tend to have higher overall child poverty rates, the disparity between lone parent and couple families is noticeably smaller than in the older member states. Indeed, there is a significant negative correlation of −0.65 between the total child poverty rate and the ratio of the rate in lone parent households to that in two-parent households. Although a substantial one-third of children are at risk of poverty in Romania, the rate is only 3 percentage points higher for children in lone parent families (35 percent) than for the rest (32 percent). On the other extreme, 11 percent of all children in Norway are at risk of poverty, but the rate rises to 32 percent when only those in lone parent families are considered. The rest of the countries lie somewhere in between, although one cluster – Denmark, Finland, Iceland, Slovenia and Austria – have lower child poverty rates than would be linearly predicted based on their relatively low difference between the lone parent and couple family child poverty rates.
It is well known that child poverty risks are associated with variation in household type, but there is no recent comparative research on child poverty in different types of lone parent families. Figure 3 shows that in the majority of the countries studied, child poverty rates are higher in single-unit, ‘nuclear’ lone parent households consisting of a lone parent and one or more children under the age of 18 years. The difference in child poverty rates between the two household types is most pronounced in Iceland, Austria and the Netherlands. Only in five countries, Finland, Bulgaria, Italy, Slovakia and Romania, are child poverty rates higher in multi-unit lone parent households. While such households are relatively rare in Finland and Italy, most children in lone parent families in Bulgaria (74 percent), Slovakia (71 percent) and Romania (65 percent) live in multi-unit households.

Child poverty in nuclear and multi-unit lone parent households (%). Source: EU-SILC (cross-sectional; version 2009-1). Base: children under 18 years old. Child weights used. Sorted by the nuclear lone parent household child poverty rate.
To enhance our understanding of the standard of living in lone parent families, we supplement the income indicator with a measure of enforced lack of material resources. Relative income-based measures of poverty are no longer seen as sufficient to reflect the diversity of living conditions in the enlarged EU (Bradshaw and Mayhew, 2010; Fusco et al, 2010). Since 2009, the official EU social policy indicators include material deprivation items. We use the material deprivation indicators proposed by Guio (2009) and adopted by the EU Social Protection Committee. One of these indicators is the proportion of individuals living in households lacking three or more of the following nine items because they are unable to afford them: to face unexpected expenses; to afford a 1 week annual holiday away from home; to pay for arrears (mortgage or rent, utility bills or hire purchase installments); to have a meal with meat, chicken or fish every second day; to keep home adequately warm; to have a washing machine; to have a colour TV; to have a telephone; to have a personal car. See Guio (2009) for a discussion of methodological issues involved in constructing this indicator. There are better indices of child deprivation being developed using new child deprivation items in EU-SILC 2009 (see UNICEF, 2012).
Unlike Guio (2009), we focus on children, rather than all individuals, living in households lacking these items. Figure 4 shows the proportion of children living in households lacking three or more of the above items, separately for those in lone parent and couple families. Children in lone parent families are substantially more likely to be deprived than the rest in all of the studied countries. In Romania and Bulgaria, close to 80 percent of all children in lone parent families are deprived, although more than half of children in couple families are also deprived on this measure. In contrast, while no more than one in five children in lone parent families are deprived in Iceland, Sweden, Luxembourg and Denmark, fewer than 1 in 20 children in couple families are deprived. Overall, there is more cross-country variation in the deprivation rate than in the child poverty rate, along with a more visible divide between the older and the newer member states. This suggests that the two measures are complementary, rather than identical. The country level correlation between child poverty and deprivation rates for lone parent families is positive (r=0.21), 17 but not statistically significant. This is consistent with the findings from the earlier sweeps of the EU-SILC (see Fusco et al., 2010), demonstrating that income poverty and material deprivation indicators do not necessarily identify the same people as poor.
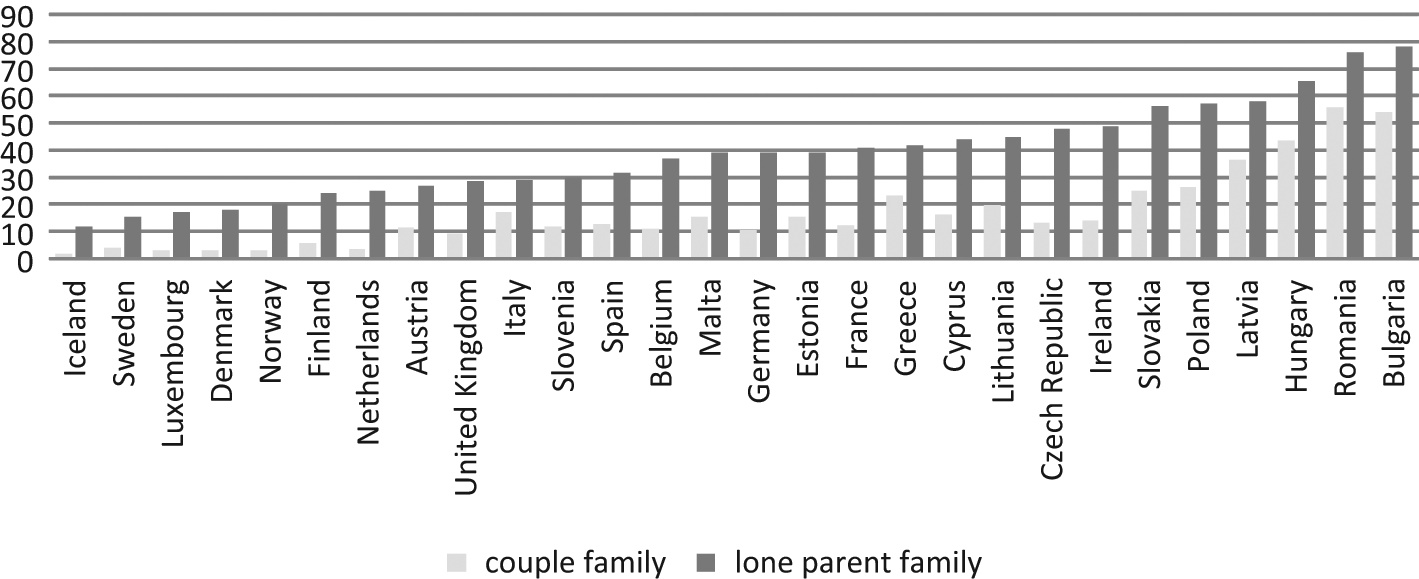
Proportion of children materially deprived (lacking 3 or more items) (%)Source: EU-SILC (cross-sectional; version 2009-1). Base: children under 18 years old. Child weights used. Sorted by the lone parent family deprivation rate.
Social transfers and poverty
This section analyses the potential impact of policy on the risks of poverty in lone parent families. In a simple standard simulation, we compare child poverty rates in lone parent families by comparing net income before and after social transfers. Social transfers include all contributory and non-contributory individual and family level cash benefits including unemployment benefits and disability benefits, housing allowances and family/child related allowances, but not including old age and survivors benefits which are treated as original (before transfers) income in this analysis. 18 This is a measure of the effort the state makes to support the incomes of lone parents. In most countries, the vast majority of children, both in lone parent and couple families, live in households that receive social transfer income, since family/children related allowances are included in the measure of social transfers. The only exceptions are Poland, Greece, Italy and Spain, where fewer than 80 percent of all children (and those in lone parent families) live in households receiving social transfers, largely due to means-testing of family/children related allowances (Van Mechelen et al., 2011).
In all countries, child poverty rates would be higher if there were no transfers 19 (Figure 5), although this analysis disregards any behavioural consequences of withdrawing them. These transfers appear to be most effective in reducing poverty in the UK, Iceland, Hungary, Ireland, Denmark and Finland, lowering the child poverty in lone parent families by 50 percent or more. Overall, social transfers make more difference to child poverty rates in the older member states, with the exception of Greece, Italy and Spain, where transfers are some of the least effective. This is not surprising, since social transfers reach fewer children in these countries. However, these findings need to be interpreted with caution, since social transfers may misleadingly appear to be most effective in the countries where a larger share of lone parents are not in employment and rely on out-of-work benefits. Other countries may be reducing the need to pay social transfers by enabling their lone parents to be in paid employment through, for instance, the provision of subsidized childcare. 20
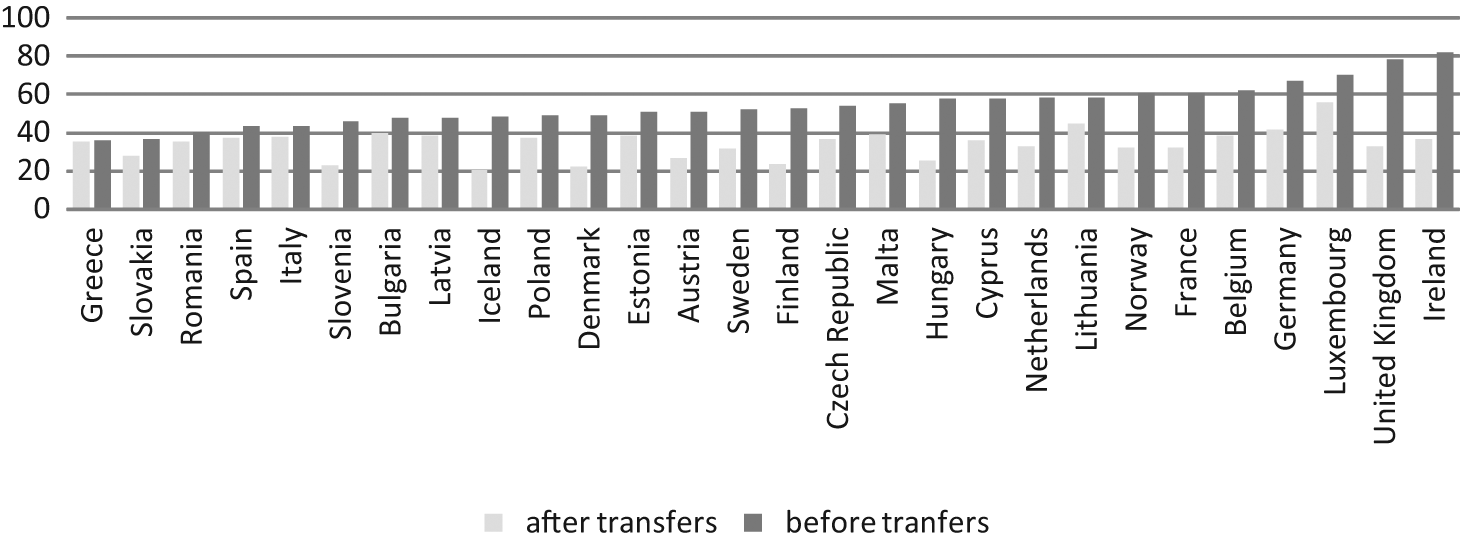
Child poverty rates in lone parent families before and after social transfers (%). Source: EU-SILC (cross-sectional; version 2009-1). Base: children under 18 years old in lone parent families. Child weights used. Sorted by the before transfers child poverty rate.
A model family approach is a different way to assess the generosity of transfers in the EU. Using information about the income protection schemes from national informants, Van Mechelen et al. (2011) simulate the net disposable incomes for different family types. Figure 6 shows the net disposable income after housing costs in Euros Purchasing Power Parity as of June 2009 for two types of lone parent households where the lone parent does not work and receives all income from social transfers: a lone parent with one child aged 2 years and a lone parent with two children (aged 7 and 14 years). Social transfers here include minimum income/social assistance (not contributory out-of-work benefits), income-tested and non-income-tested child benefits, income-tested housing benefits (but not subsidies for childcare, health or education charges). It should be noted that this analysis only covers the social transfer package for out-of-work lone parents – the social transfer package for in-work lone parents will be different. Thus, the analysis shows to what extent lone parents are supported as carers. The results largely confirm the analysis above: social transfers for lone parents vary considerably and appear to be more generous in the older member states. Data for Greece are not available.
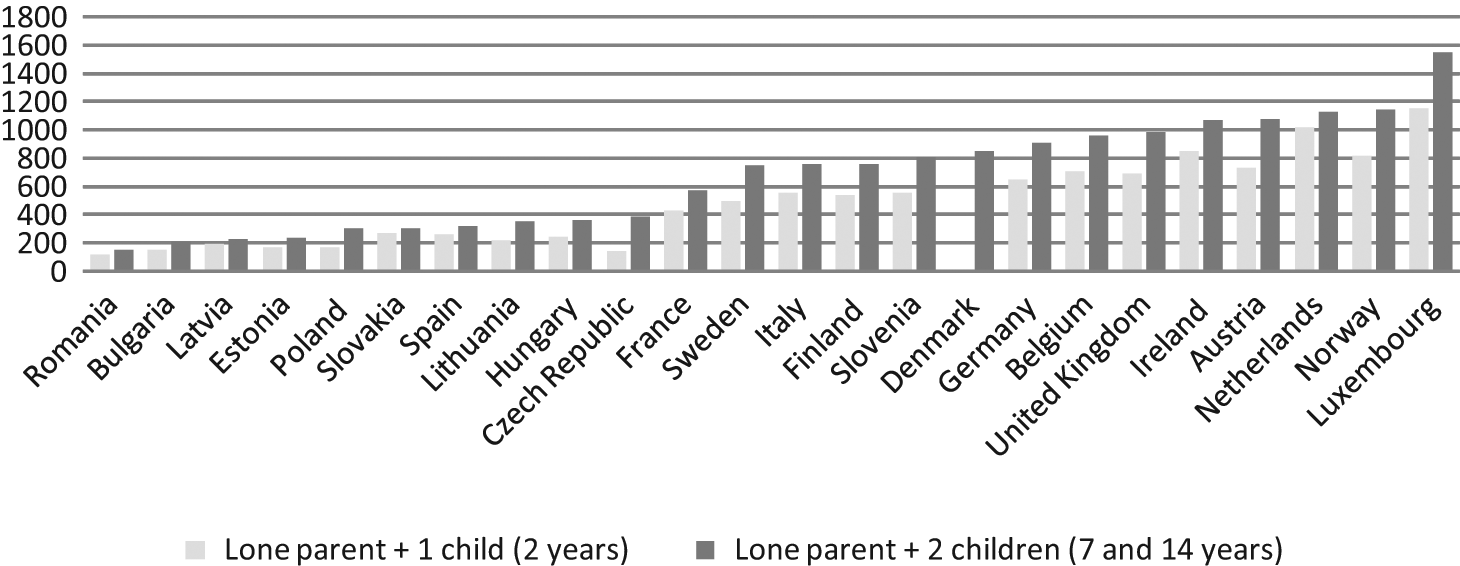
Social transfer net income after housing costs. Purchasing power parity Euro per month, June 2009. Source: CSB-Minimum Income Protection Dataset, Version 1/2011 (Van Mechelen et al. 2011). Sorted by the lone parent with two children social transfer income.
Finally, the relevance of these social transfers to the poverty risks of children in lone parent families can be gauged from multivariate analysis. We pool data for all countries and include the effect of the monthly minimum out-of-work social transfer income package in Figure 6 available to a hypothetical lone parent household with two children 21 on the risk of child poverty, controlling for the relevant lone parent and household characteristics. 22 As the amount of minimum income a lone parent family can rely on when out of work, it is a basic measure of the generosity of social transfers. The social transfer income information is not available for Cyprus, Greece, Iceland and Malta, so here the analysis is based on 24 countries only. 23 Due to the hierarchical nature of the data, we estimate multilevel logistic regression models to allow for individual-level observations to be correlated within the same higher level unit, that is, country. Since institutions vary across countries and lone parent families within the same country are subject to the same set of policies, it is important to account for such unobserved country-level effects. We first fit a baseline model with household-level predictors that includes normally distributed random country-specific intercepts, but omits the country-level social transfer income variable. We then add the social transfer income variable to check how much of the unexplained variation is due to differences in its levels. Last we add the GDP per capita (based on purchasing power parity (PPP) current international dollar 2008) transformed to the natural log scale 24 to control for any contextual, or country-level, living standard effects. Cantillon (2009, 2011) finds that, across the EU-27, relative income poverty tends to be lower in countries with higher GDP per capita. Thus, if the negative effect of social transfers on child poverty is observed after controlling for the country level of income, it is a stronger test of the significance of social transfer packages to child poverty alleviation.
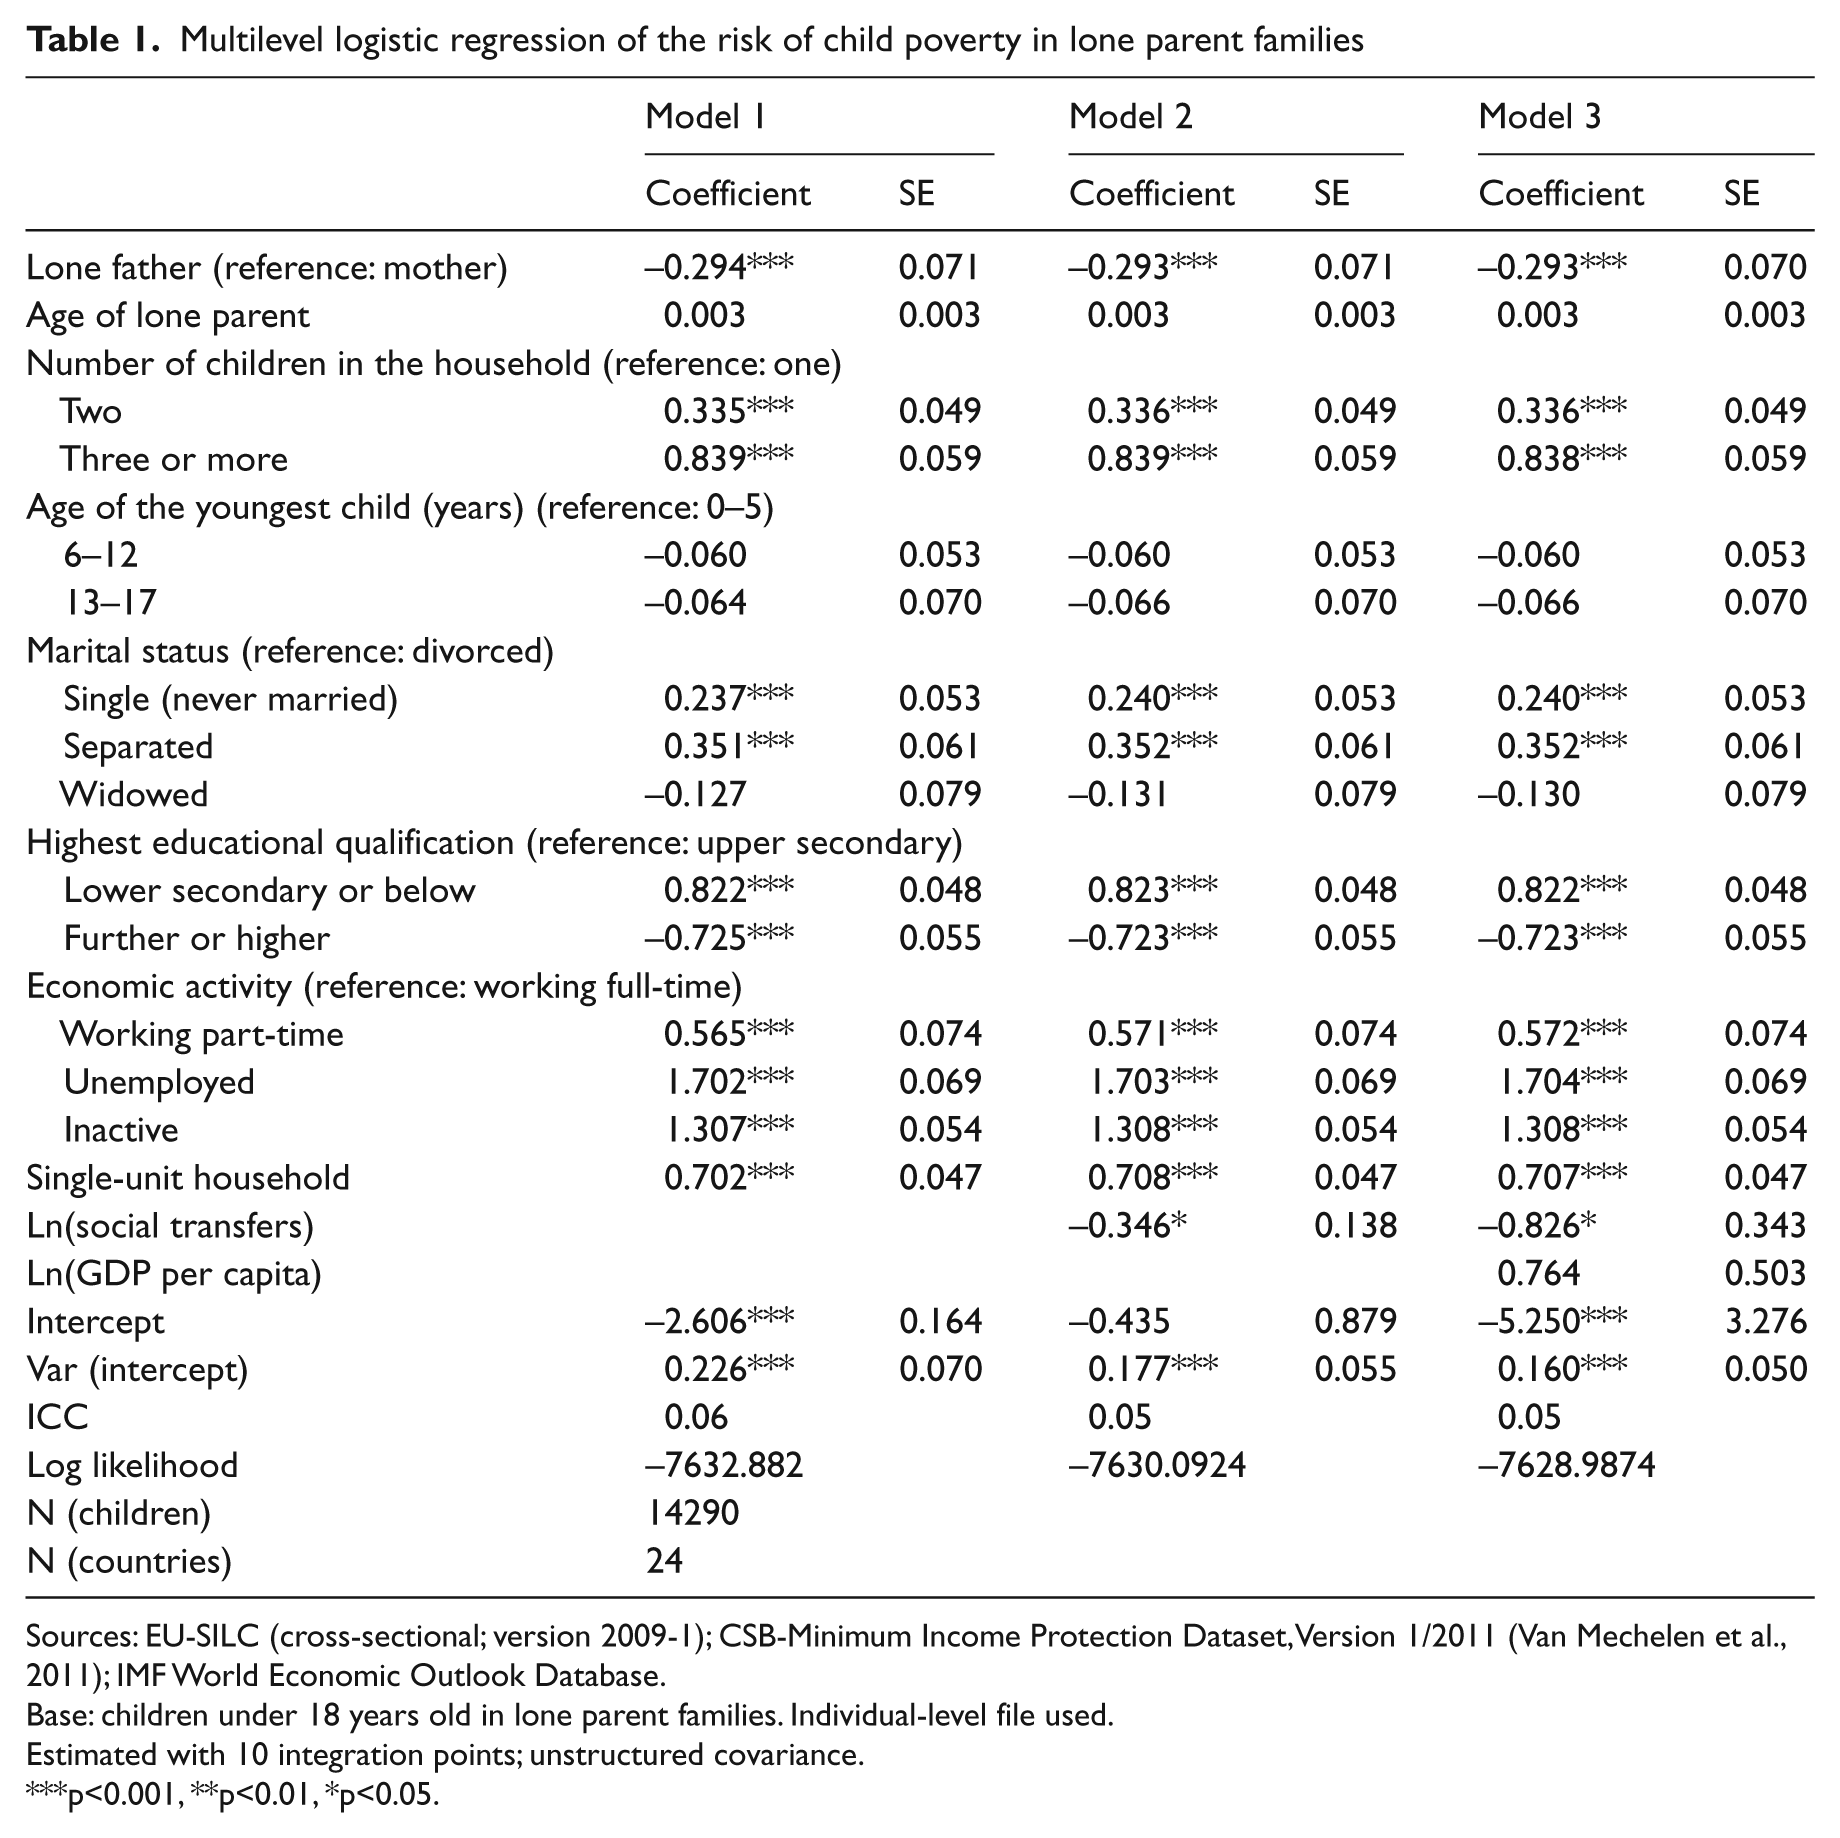
The effects of lone parent and household characteristics are very similar across the three estimated models (Table 1). Children are significantly less likely to be poor if they live with lone fathers rather than mothers, everything else being equal. The risks of income poverty are higher if there are two or more children in the household, if the lone parent 25 is single or separated, rather than widowed or divorced, if the lone parent has no upper secondary education, and does not work full-time. Given a particular country, children in single-unit lone parent families are twice as likely, on average, to be poor as those in multi-unit households. The age of the lone parent is not significantly associated with the risk of child poverty, once other characteristics are controlled for. While the number of children is a crucial predictor of child poverty, the age of the youngest child is not statistically significant. The direction of association is of the expected sign, however.
Multilevel logistic regression of the risk of child poverty in lone parent families
Sources: EU-SILC (cross-sectional; version 2009-1); CSB-Minimum Income Protection Dataset, Version 1/2011 (Van Mechelen et al., 2011); IMF World Economic Outlook Database.
Base: children under 18 years old in lone parent families. Individual-level file used.
Estimated with 10 integration points; unstructured covariance.
p<0.001, **p<0.01, *p<0.05.
Before any macro-level indicators are controlled for, about 6 percent of the residual variation in the risk of child poverty is found to be due to country-specific effects, as measured by the intra-class correlation (ICC). Adding the social transfer income indicator reduces the estimated ICC from 6 percent to 5 percent, which is a 17 percent reduction in relative terms. This suggests that variation in the out-of-work social transfer income levels accounts for some of the unobserved country-level heterogeneity. As expected, the social transfer income coefficient is negative and statistically significant, indicating that countries with more generous minimum social transfer incomes for lone parents tend to have lower child poverty rates. Controlling for the GDP per capita does not appear to alter this finding 26 (model 3), suggesting that social transfers have an effect on child poverty risks in lone parent families even after accounting for differences in country wealth. This is not surprising given that social transfers add to incomes directly.
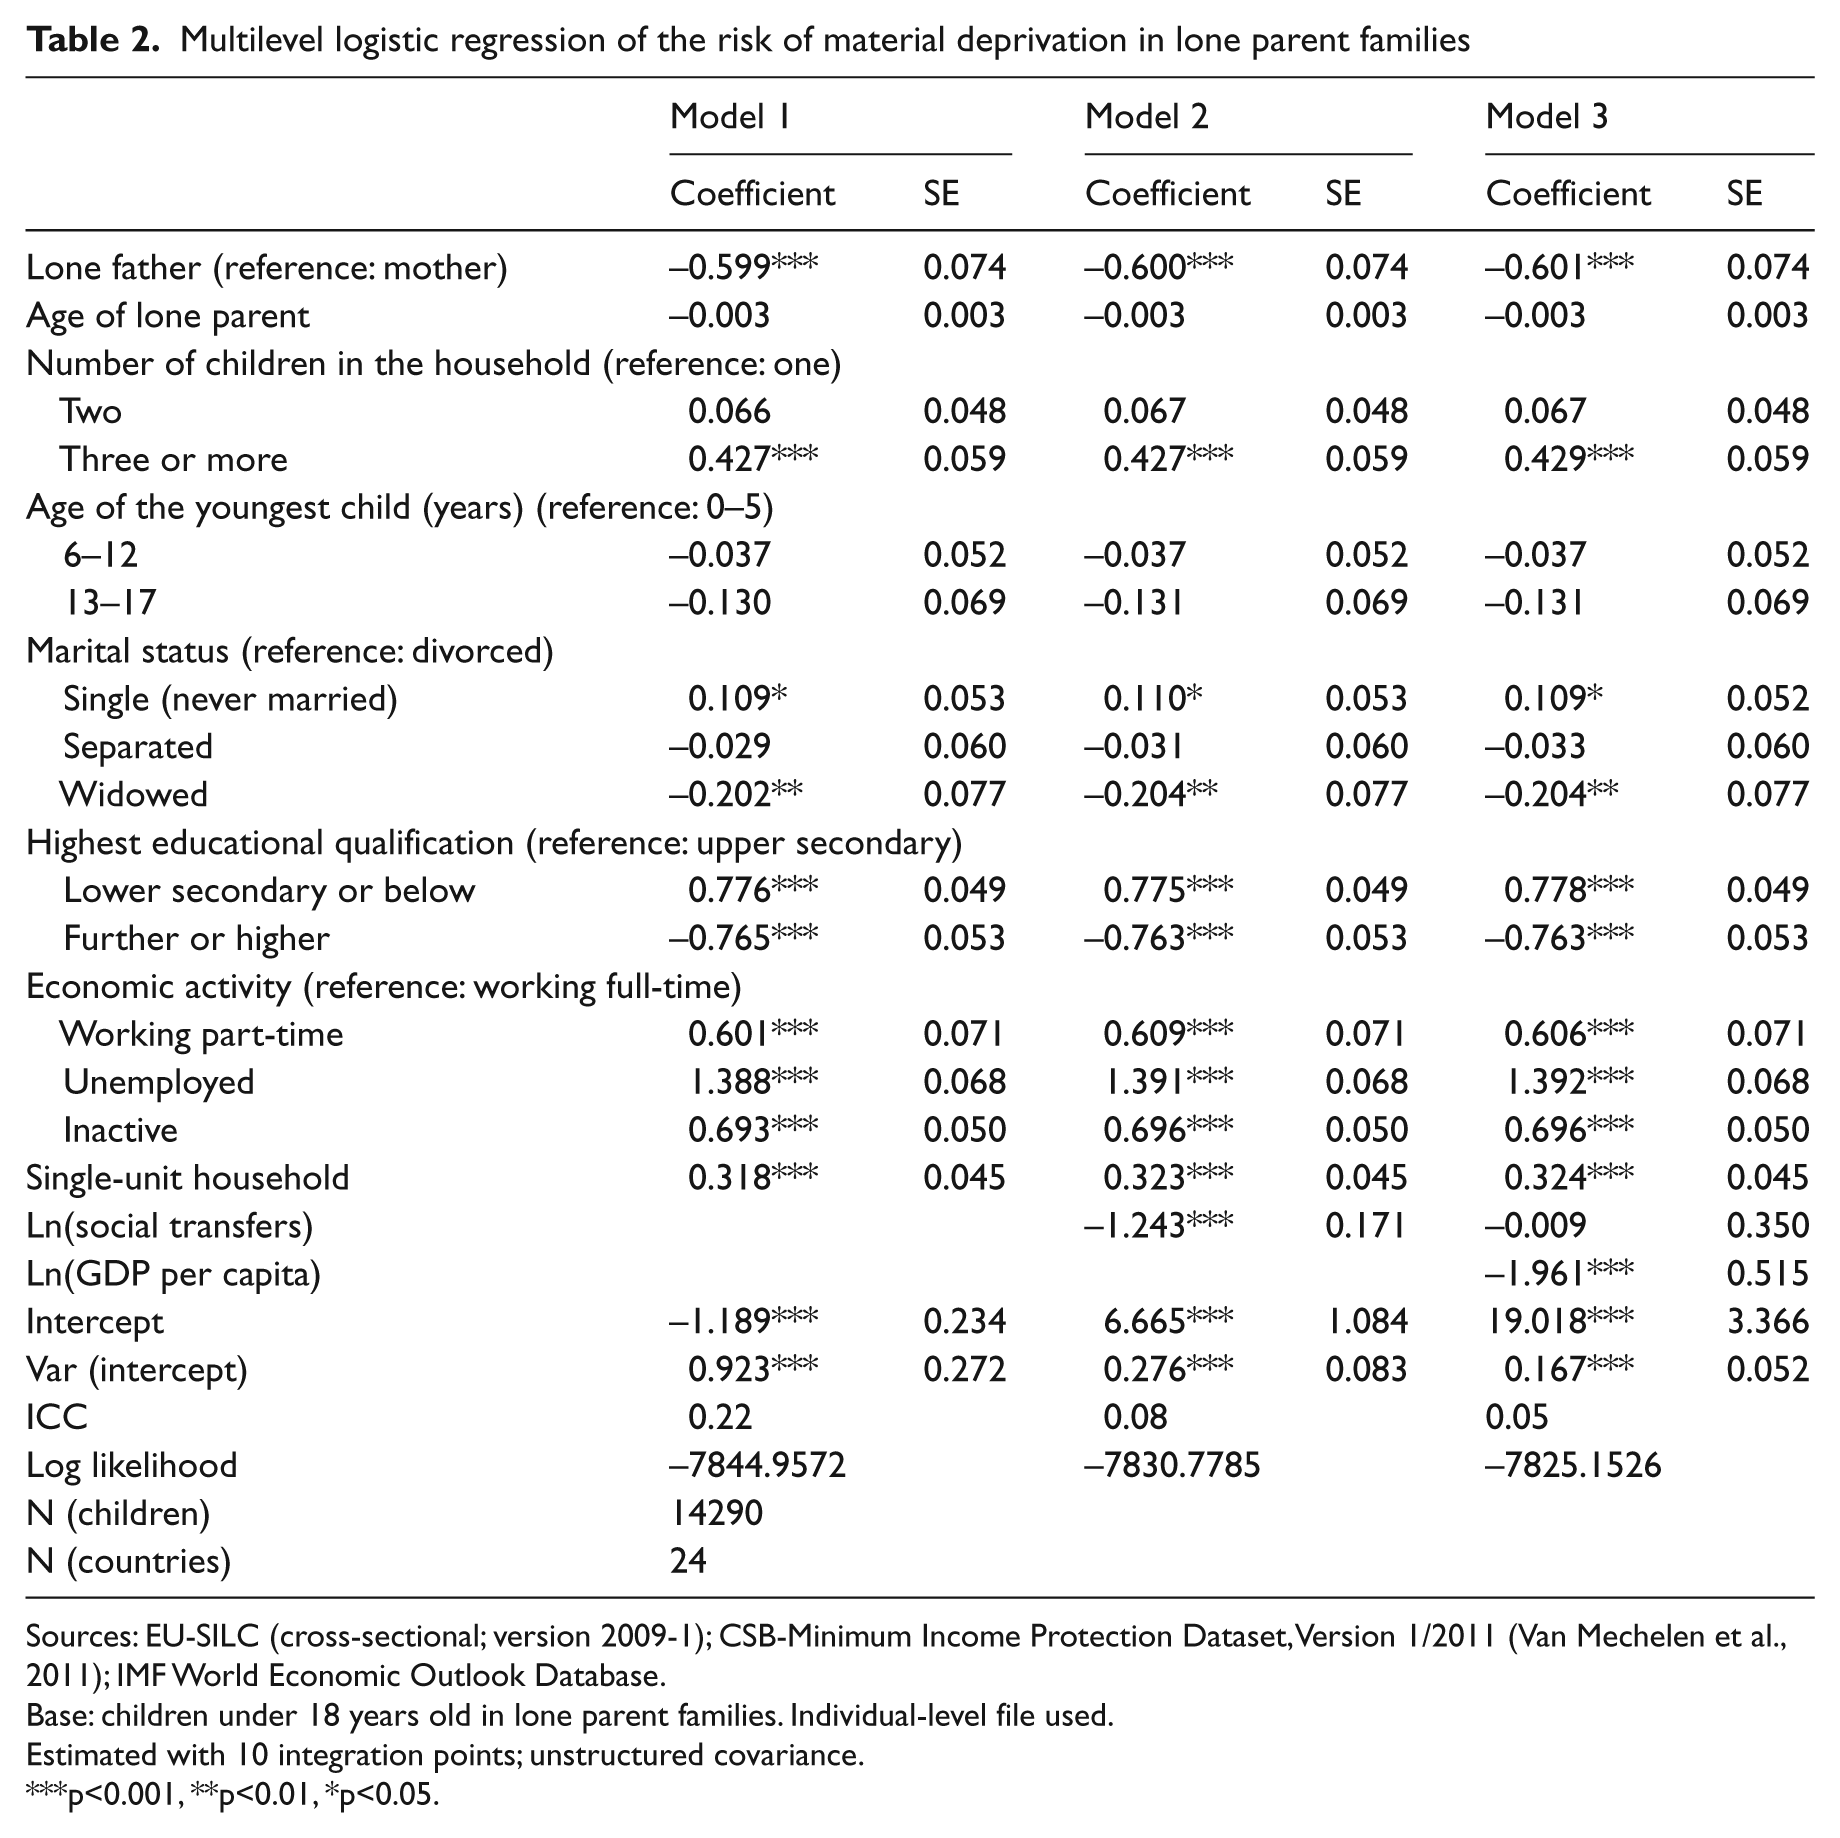
The pattern of association between lone parent and household characteristics is similar when child deprivation (Table 2), measured as living in a household lacking three or more out of nine items (Guio 2009), is used as the dependent variable. Children in lone parent families are less likely to live in materially deprived households, everything else being equal, if they live with a lone father, if there are no more than two children in the household, if the lone parent is widowed, rather than divorced or never married, and if the lone parent is university educated and working full-time. Children in ‘nuclear’ lone parent households are more likely to be deprived.
Multilevel logistic regression of the risk of material deprivation in lone parent families
Sources: EU-SILC (cross-sectional; version 2009-1); CSB-Minimum Income Protection Dataset, Version 1/2011 (Van Mechelen et al., 2011); IMF World Economic Outlook Database.
Base: children under 18 years old in lone parent families. Individual-level file used.
Estimated with 10 integration points; unstructured covariance.
p<0.001, **p<0.01, *p<0.05.
The effect of the social transfer income levels on deprivation (model 2) is negative and statistically significant. It is also larger than the corresponding effect on child poverty. To illustrate, a one unit increase in social transfer income support on the log scale 27 is associated with a 30 percent reduction in the odds of child poverty (Table 1, model 2), compared with a corresponding 70 percent reduction in the odds of material deprivation (Table 2, model 2). Controlling for social transfer income reduces the residual variation in material deprivation substantially: the ICC decreases from 0.22 in the model without any country-level predictors to 0.08 in the model with the social transfer income indicator. Thus, cross-country differences in social transfer income account for a large proportion of unobserved contextual country-level effects. However, when a measure of country income or living standard (log of GDP per capita) is added to the material deprivation model, the estimated effect of social transfer income disappears. The effect of country income, on the other hand, is negative and significant: a one unit increase in the log of the GDP per capita is associated with an 86 percent reduction in child deprivation, on average. 28 It perhaps should not be surprising that an indicator of a living standard on the country level is significantly associated with a household measure of material living standards. Social transfer income does not necessarily translate into improved material conditions and ownership of durable goods directly. Moreover, the deprivation measure is based on an EU-wide threshold, rather than a national one, highlighting income differences across the member states.
Conclusion
This paper compared the prevalence of lone parent families in the enlarged EU and analysed the relationship between social transfer income levels and poverty and material deprivation risks of children living in lone parent families. We find considerable variation in the prevalence of lone parents. Even after taking into account lone parent families in multi-unit households, fewer than one in ten children live in lone parent families in Greece, Spain, Romania, Slovenia and Cyprus. This compares with between one in five and one in four children living with lone parents in the Baltic countries as well as in the UK and Ireland. Lone parents are not a homogenous group: there is much variation in the male share of lone parents, marital status and economic activity of lone parents across the EU. However, there are fewer differences in the average number and ages of children of lone parents.
Children in lone parent families are substantially more likely to be poor and materially deprived than those in couple families. Although the newer member states tend to have higher overall child poverty rates, the disparity between lone parent and couple families there is noticeably smaller than in the older member states. The risk of poverty and material deprivation is also associated with variations in the type of lone parent family. It tends to be higher in single-unit households as well as in families with female lone parents, those with more children, lower educated lone parents and single never married lone parents. Children are significantly more likely to be poor in families where the lone parent is not able to work, particularly to work full-time.
However, lone parent and household characteristics do not explain all of the variation in the risks of child poverty and deprivation. In a multilevel logistic regression framework, we find evidence of significant contextual country-level effects. The studied countries differ in the extent to which their welfare states alleviate child poverty in lone parent families with out-of-work social transfers. Transfers appear to make the biggest difference to average income poverty rates in lone parent families in the UK, Iceland, Hungary, Ireland, Denmark and Finland. If all social transfers were omitted from the calculation of household income, aggregate child poverty rates in these countries would appear to double. Overall, social transfers make more difference to child poverty rates in the older member states.
Once the cross-country variation in the demographic characteristics and employment status of lone parents is accounted for, child poverty risks are still significantly lower in countries with more generous social transfer income packages. The association persists even after controlling for the country standard of living. The effect of transfers is found to be even larger for alleviating material deprivation, but only when the differences in GDP per capita are not controlled for. Once the variation in country wealth is taken into account, the effect of social transfers all but disappears. This suggests that out-of-work social transfer income packages are more effective in alleviating income poverty than material deprivation, which appears to depend more on the overall standard of living in a country. This is perhaps not surprising given that social transfers impact incomes directly, thus having more bearing on an income-based measure of poverty than on a non-monetary indicator. As noted in Fusco et al. (2010), unlike the relative poverty indicator, the EU measure of material deprivation emphasizes the cross-country differences in living standards. This analysis shows the importance of employing more than one indicator of child poverty when studying the effects of poverty-reduction policies.
Footnotes
Appendix
Economic activity of mothers in couple families
| Working full-time | Working part-time | Unemployed | Inactive | |
|---|---|---|---|---|
| AT | 0.22 | 0.39 | 0.05 | 0.33 |
| BE | 0.36 | 0.40 | 0.06 | 0.17 |
| BG | 0.66 | 0.03 | 0.12 | 0.19 |
| CY | 0.67 | 0.09 | 0.03 | 0.21 |
| CZ | 0.56 | 0.05 | 0.08 | 0.31 |
| DE | 0.14 | 0.49 | 0.05 | 0.33 |
| DK | 0.70 | 0.17 | 0.05 | 0.08 |
| EE | 0.56 | 0.08 | 0.06 | 0.31 |
| ES | 0.44 | 0.17 | 0.15 | 0.24 |
| FI | 0.63 | 0.08 | 0.04 | 0.25 |
| FR | 0.46 | 0.28 | 0.06 | 0.19 |
| GR | 0.52 | 0.09 | 0.07 | 0.33 |
| HU | 0.53 | 0.03 | 0.09 | 0.35 |
| IE | 0.32 | 0.23 | 0.04 | 0.42 |
| IS | 0.52 | 0.23 | 0.04 | 0.20 |
| IT | 0.37 | 0.15 | 0.06 | 0.42 |
| LT | 0.74 | 0.03 | 0.10 | 0.12 |
| LU | 0.26 | 0.34 | 0.06 | 0.35 |
| LV | 0.63 | 0.05 | 0.13 | 0.19 |
| MT | 0.31 | 0.10 | 0.01 | 0.58 |
| NL | 0.09 | 0.67 | 0.01 | 0.24 |
| NO | 0.64 | 0.21 | 0.02 | 0.14 |
| PL | 0.61 | 0.08 | 0.06 | 0.25 |
| RO | 0.54 | 0.06 | 0.02 | 0.38 |
| SE | 0.49 | 0.35 | 0.04 | 0.11 |
| SI | 0.78 | 0.06 | 0.09 | 0.07 |
| SK | 0.68 | 0.04 | 0.09 | 0.19 |
| UK | 0.31 | 0.38 | 0.02 | 0.29 |
Source: EU-SILC (cross-sectional; version 2009-1).
Base: lone parents.
Individual cross-sectional weights used.