
Abstract
This article analyses the redistributive efficiency of social transfers and direct taxation in a panel of 28 developed economies during the period 1995–2010. In order to explore how redistribution is achieved through these fiscal policies, a two-stage approach is applied. First, we evaluate their redistributive efficiency – the degree of redistribution attained for a given level of transfers and taxes – using data envelopment analysis (DEA). We find lower redistributive efficiency in Southern Europe and the United States and higher efficiency levels in the Nordic and Central European countries and Australia. Second, we use panel regression analysis to identify the determinants of efficiency differences and reveal the crucial role of government quality as well as factors affecting the redistributive profile of fiscal policies.
Introduction
The fact that income inequality has generally been rising in both advanced and developing economies in recent decades (International Monetary Fund (IMF), 2014; Organisation for Economic Co-operation and Development (OECD), 2008, 2011), coupled with the growing realization that inequality could be harmful for economic growth and development, 1 highlights the need for policies that can reduce inter-personal income differences. In this context, the redistributive potential of fiscal policies, both on the tax and spending sides, can play an important role.
The capacity of countries to deploy fiscal policies to reduce income differences faces important budgetary restrictions. Developing countries tend to have smaller public sectors and thus fewer fiscal resources available to address inequalities (Barreix et al., 2007; Goñi et al., 2011). Some developed countries have experienced an unprecedented increase in public debt in the context of the ‘Great Recession’ of 2007–2009, raising serious concerns about fiscal sustainability. Against this backdrop, many governments have been making substantial fiscal adjustments through a combination of spending cuts and tax hikes to reduce their ratios of debt to gross domestic product (GDP). At the same time, public support for redistributive policies has grown, especially in advanced economies where the crisis has hit hardest (see IMF, 2014).
Because of increasing income inequalities and scarce budgetary resources, attention needs to be paid to the redistributive efficiency of fiscal policies: efficiency allows the attainment of a given level of redistribution at lower levels of spending and taxes or the attainment of more redistribution at given tax and spending levels.
A range of studies has used data envelopment analysis (DEA) to measure the efficiency of government spending, either total spending or spending in specific policy areas, in attaining a range of socio-economic objectives such as health and education outcomes (see, for example, Afonso et al., 2005; Gupta and Verhoeven, 2001). A number of contributions have gone further by, moreover, analysing a set of non-discretionary factors that may explain cross-country differences in public sector efficiency. Thus, Herrera and Pang (2005), Afonso and St Aubyn (2006), St Aubyn et al. (2009), Afonso et al. (2010) and Hauner and Kyobe (2010) use DEA methodology to calibrate the efficiency of health, education or social spending in the pursuit of specific socio-economic objectives and then explain cross-country differences in government efficiency by way of factors which, they argue, are immutable in the short run.
In this article, we examine how efficient social transfers (social benefits in cash) and direct taxation (payroll and income taxes) are in redistributing income and consider those variables that determine redistributive efficiency. We focus on social transfers and direct taxes because of the expectation that these policies are likely to have a strong redistributive impact since the former are mostly directed towards lower income groups and the elderly, while the latter are mostly paid by high-income individuals. The important redistributive effect of these policies has in fact been documented by a range of studies over the years (see, for example, Korpi and Palme, 1998; Mahler and Jesuit, 2006; Wang et al., 2012). 2 Our interest here is to apply DEA methodology to examine the overall impact of social transfers and direct taxes on two measures of redistribution that exploit the difference between market inequality and net income inequality (after direct taxes and social transfers) – measures that we fully explain below. Having done so, we then aim to uncover those factors that might explain cross-country differences in the redistributive efficiency of these fiscal policies based on panel truncated and bootstrap truncated regressions. 3
The main objective of DEA is to rank countries according to their distance vis-à-vis an efficiency frontier that represents the best performing countries in the sample. If the country’s input–output combination lies on the DEA frontier, the country is considered efficient. Conversely, the country is considered inefficient if the country’s input–output combination lies inside the frontier. DEA is an alternative analytic technique to regression analysis which represents a central tendency approach that evaluates countries relative to an average. In contrast, DEA is an extreme point method that compares each country with the best country in the sample. The main advantage of DEA is that unlike regression analysis, it does not require an assumption about the functional form relating inputs to outputs, and moreover, it does not imply a causal model thus obviating the issue of the endogeneity of the inputs employed (Tauchmann, 2012). Instead, it constructs the best production function solely on the basis of observed data; hence, statistical tests of the significance of the parameters are not necessary (Chansarn, 2008).
In sum, regression-based estimates compare countries to the average performer, whereas the DEA approach compares them to the best performers. This differentiates our approach from previous work that has employed regression analysis to explain cross-country differences in redistribution (e.g. Bradley et al., 2003; Huber and Stephens, 2014). That work has revealed a positive relationship between welfare state size and redistribution and, moreover, identifies a set of non-discretionary factors that may affect the redistributive profile of social spending and taxation. On this latter count, it will thus inform our second-stage analysis of the determinants of cross-country differences in efficiency. With regard to their reported relationship between the size of the welfare state and redistribution, our focus is instead on the extent of redistribution achieved with a given amount of spending and taxation or, in other words, redistributive efficiency.
Our first-stage results, based on the DEA methodology applied to a panel of 28 developed countries for the period 1995–2010, allow us to identify countries with similar public spending and tax levels that obtain very different redistributive results signalling important differences in redistributive efficiency across countries. Our second-stage results obtained from panel truncated regression analysis point to the crucial role when explaining these differences of factors reflecting on the capacity of public officials to design and implement redistributive measures, as well as factors potentially affecting the redistributive profile of fiscal policies. This article is structured as follows: after reviewing the key indicators employed in the analysis in section ‘Key indicators: measuring redistribution and the inputs’, we explain the empirical methodology and discuss our results in sections ‘Empirical methodology’ and ‘Results’, respectively, before concluding this article in section ‘Conclusion’.
Key indicators: measuring redistribution and the inputs
To measure redistribution, we take advantage of a recently updated cross-country data set by Solt (2016) that combines data from the Luxemburg Income Study (LIS) and United Nations University–World Institute for Development Economics Research (UNU-WIDER). This data set, called the Standardized World Income Inequality Database (SWIID), provides information on market and net income inequality in some 174 developing and advanced economies from 1960 to 2013. This is a far wider sample than the largest attainable by LIS which has been the main source of previous work studying the determinants of redistribution. 4
In this article, we use version 5.0 of the SWIID, as published in October 2014. Whereas an earlier version of the data set was criticized by Jenkins (2015), Solt (2015, 2016) shows that most of the concerns are misplaced or have been addressed with the most recent version of the data. Notwithstanding this discussion, we address data quality concerns by restricting our analysis to a more reliable subsample of 28 developed countries corresponding to the years 1995, 2000, 2005 and 2010. By excluding developing countries and limiting ourselves to more recent data, we are avoiding those countries where the use of SWIID data could be more problematic (Ferreira et al., 2015).
Our chosen variables for measuring redistribution are obtained as the difference between the Gini coefficient for market and for net income (absolute measure), and the same difference weighted by the Gini coefficient for market income (relative measure). Some scholars have measured redistribution in absolute terms (Kenworthy and Pontusson, 2005; Thewissen, 2014; Wang et al., 2012, 2014), while others consider redistribution in relative terms, arguing that the percentage reduction in inequality is a better reflection of redistributive effort (Bradley et al., 2003; Huber and Stephens, 2014; Iversen and Soskice, 2011; Korpi and Palme, 1998; Mahler and Jesuit, 2006). For the purpose of measuring the redistributive efficiency we have used alternately both measures as the output DEA variable and obtained two different sets of efficiency scores that we then use in the second-stage analysis.
Our DEA input variables are direct taxes and social transfers in cash to households. Social transfers include wages during absences of work (due to illness, accidents or maternity), the payment of education or other allowances and retirement or survivors’ pensions. Direct taxes include current taxes on income and wealth and also social contributions paid by employers, employees, self-employed and non-employed people to social security funds (European Commission, 2015). DEA methodology implicitly assumes that output is only affected by a specified list of inputs. It is important to emphasize that the inputs employed in our DEA are precisely the ones that Solt uses to explain the difference between market and net income inequality – our DEA output variable. Thus, by employing as input variables the same ones used to generate the output variables, we can precisely measure how efficient the former are in attaining the latter. Alternatively, considering a different list of inputs is likely to undermine the reliability of our efficiency estimates.
Before ending this section, it is worth stating that the Gini-based redistributive variables have been criticized because they ignore behavioural changes induced by the presence (or absence) of the welfare state (Bergh, 2005). For example, generous social transfers might decrease labour supply by lower income earners thus increasing market inequality. As such, estimates for redistribution based on transfers should be regarded as upper bounds (Wang et al., 2012). However, direct taxes may reduce the labour supply of high-income earners, thus reducing market inequalities. In our analysis, which considers both transfers and taxes, we follow Ostry et al. (2014) in suggesting that the effect of redistribution on market inequality may not be substantial, as its effects on the lower and on the upper scale of the income distribution are at least to some extent offsetting.
Empirical methodology
In this section, we present the DEA methodology used to empirically evaluate the redistributive efficiency (absolute and relative) of social transfers and direct taxation and then explain the empirical approach used to identify the non-discretionary determinants of this efficiency.
DEA methodology
DEA is a linear programming technique that identifies the optimal performance within a sample and computes efficiency scores by taking differences between observed and best practice decision-making units (DMUs) – in our case countries. The DEA belongs to a range of nonparametric frontier methods. With DEA, efficiency is defined with respect to a production possibility frontier that indicates feasible output levels given the amount of inputs employed. More specifically, economic efficiency is a combination of technical and allocation efficiency. The former indicates the competence with which inputs are transformed into valued outputs and the latter whether input use ensures a minimal cost for given market prices. This study is concerned with technical efficiency. Hence, it considers country governments as producers of one output (absolute or relative redistribution) using two costly inputs: social transfers in cash, on one hand, and direct taxes, on the other hand.
When performing DEA, several decisions must be taken. One concerns the choice between an input or output orientation. While an input-oriented model maintains the current level of output constant and minimizes inputs, an output-oriented model maximizes output given the amount of inputs. We choose the latter model because we are interested in assessing the redistributive efficiency of given levels of social transfers and taxation. Hence, governments are considered more efficient if they produce a larger output for given inputs. Another decision is whether to apply constant or variable returns to scale (VRS) in the production function. We employ VRS since our inputs are ratio data, and, as explained by Hollingsworth and Wildman (2003), in that case, the model with the VRS constraint performs better. The DEA methodology translates efficiency into ‘scores’, and based on these scores, one can build ordinal rankings of a country’s relative performance (Coelli and Perelman, 1999). 5
Analysing the non-discretionary factors: a panel data approach
The DEA method assumes that output efficiency is purely the result of ‘discretionary inputs’ and as such ignores the influence of ‘non-discretionary factors’ or environmental variables that may also impact on efficiency. These are considered as non-controllable inputs because they cannot be directly manipulated by the producer but do influence the DEA estimates. To account for this, we perform a second-stage analysis where the DEA efficiency scores are regressed on a set of possible exogenous factors that might explain redistributive efficiency.
Thus, we regress the estimated output efficiency scores,
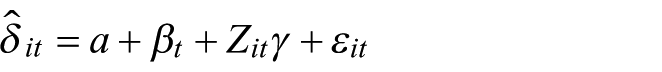
where
Since the DEA efficiency scores are truncated at 1, following McDonald (2009) and Simar and Wilson (2007, 2011), we employ truncated regression in the second stage of our analysis. In addition, it is important to consider that because DEA is a data-driven approach where the scores are obtained by an implicit data-generating process, it is convenient to consider the sensitivity of the estimated efficiency scores to sampling variation (bootstrapping). Thus, we correct the efficiency scores obtained in the first stage of our DEA through this bootstrapping procedure before employing them in the second-stage analysis. 6
We account for a range of non-discretionary factors that might explain redistributive efficiency differences across countries. One set of factors relates to what Afonso et al. (2010) call, ‘public sector technology’ or, in other words, the restrictions faced by public officials who must design and implement redistributive policies. In this sense, we include a variable from the World Governance Indicators labelled ‘Government Effectiveness’ that describes ‘the quality of public services, the quality of the civil service and the degree of its independence from political pressures, the quality of policy formulation and implementation, and the credibility of the government’s commitment to such policies’ (Kaufmann et al., 2010: 4). The basic argument is that an inefficient public administration implies poor design and implementation of policies (Rajkumar and Swaroop, 2008), and consequently, we would expect countries with less competent bureaucracies to redistribute less for a given volume of resources employed towards this aim. In this vein, we also control for the level of human capital since it is likely to affect administrative competence. Moreover, we account for population size (in logs) on the strength of the argument that larger countries may be more difficult to govern (Aristotle, 1932; Treisman, 2002).
Another set of factors affecting redistributive efficiency broadly stems from the structure of public spending and taxation. For a given volume of resources spent or taxed, the redistributive impact will depend on the specific tax and spending policies employed. Previous work has revealed that different spending and tax policies have different redistributive effects (measured in terms of either absolute or relative redistribution): for example, Wang et al. (2012, 2014) emphasize the redistributive impact of income tax, pensions and survivors’ benefits as well as social assistance in the form of disability and unemployment benefits, while Huber and Stephens (2014) put the emphasis on unemployment benefits and transfers to single-mother households.
From this perspective, we account for a range of factors that may affect the redistributive profile of spending and taxation. We control for unemployment and population above 65 years old since they are likely to have an impact on the profile of social transfers. We control for ethnic heterogeneity on the strength of the argument that it may make agreement over tax and public spending decisions more difficult to reach because people may not be willing to transfer resources to people from ‘other’ ethnicities (Alesina et al., 1999; Alesina and Glaeser, 2004). In addition, we attempt to account for the possibility that, faced with demands for redistribution by social majorities in the context of democratic states, wealthy elites employ their economic and political influence to undermine redistributive action by the state (Acemoglu et al., 2015; Acemoglu and Robinson, 2008; Gupta et al., 2002; Rodríguez, 2004). To account for elite influence, we turn to educational inequalities from Castelló-Climent and Doménech (2014), under the assumption that an unequal distribution in education may be indicative of elite influence. 7
Beyond these two sets of factors, we also control for GDP per capita (in logs) in an attempt to account for the possibility that wealthier countries may enjoy a higher level of redistributive efficiency for a range of observable (but omitted) or unobservable non-discretionary factors related to development.
Results
In Tables 1 and 2, we present the DEA efficiency scores obtained using two inputs (social transfers and direct taxes) and one output, relative and absolute redistribution, respectively, for the four periods. These tables indicate that, in general, the country scores are slightly higher when using relative (as opposed to absolute) redistribution, and moreover, country performances do not change radically through time. This said, it is also true that the DEA results differ using both indicators, as we detail next.
Relative redistributive efficiency by country (output-oriented VRS technical efficiency).
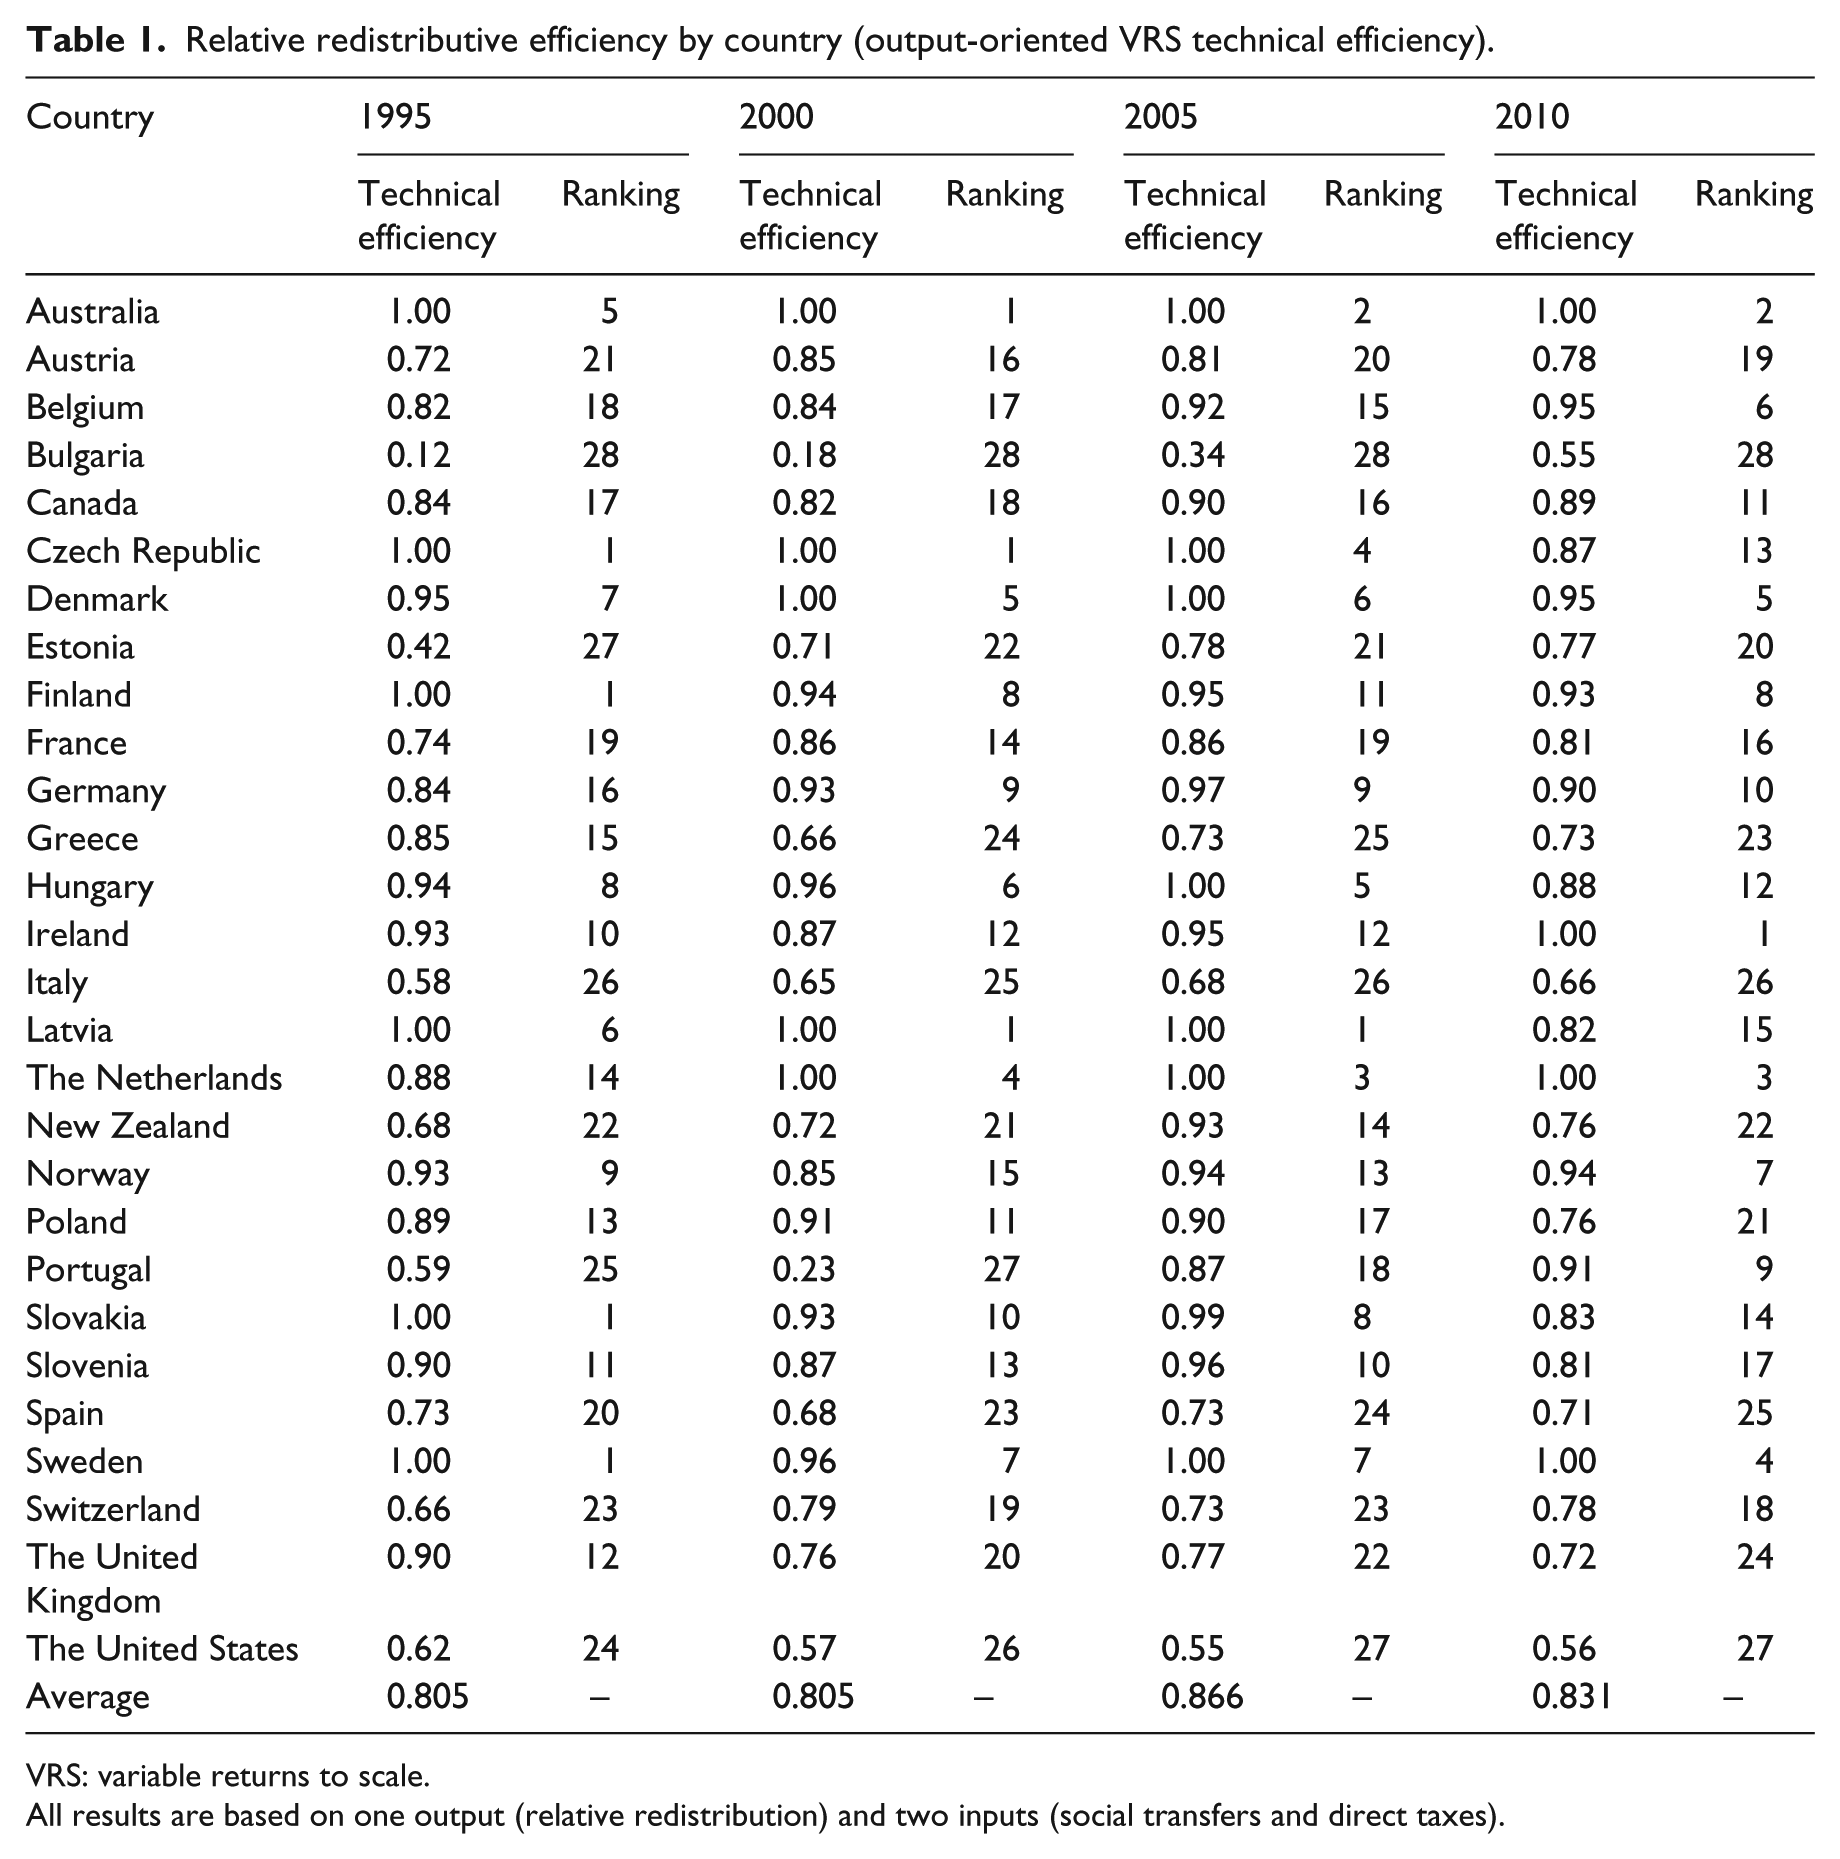
VRS: variable returns to scale.
All results are based on one output (relative redistribution) and two inputs (social transfers and direct taxes).
Absolute redistributive efficiency by country (output-oriented VRS technical efficiency).

VRS: variable returns to scale.
All results are based on one output (absolute redistribution) and two inputs (social transfers and direct taxes).
Focusing first on the DEA using relative redistribution, we observe from Table 1 that the Czech Republic, the Nordic countries, Australia, the Netherlands and Latvia emerge as the most-efficient countries in the sample since they are located very close to the efficiency frontier during all the period (score values close to 1). Another set of countries is located at the opposite end (Bulgaria, the United States, Italy, Estonia, Spain, Portugal and Greece), with Bulgaria being by far the worst performer. Table 1 shows that, on average, countries could potentially increase their redistributive efficiency by almost 20 percent.
Table 2 shows the results when employing instead absolute redistribution as the output measure. The results are similar but not identical. Thus, Latvia, Sweden, Australia and Finland still appear in the group of the most-efficient countries, but the Czech Republic and Norway present much lower scores, while Hungary and Germany take their place. On the other extreme, Bulgaria continues to be the least-efficient country and is accompanied by the same group of countries as before, with the only exception of Switzerland which now is very far from the efficiency frontier. Again, with average efficiency scores around 0.75, there is considerable scope for increasing redistributive efficiency.
The differences that emerge when using the two indicators are explained by the fact that relative redistribution is weighted by initial inequality, while absolute redistribution is not. To see what this implies in practice, consider, for example, the case of the United Kingdom and the Czech Republic. These two countries have similar social transfers and direct taxation relative to GDP and have similar levels of absolute redistribution – a net income Gini of around 18.5 points below the market Gini (see Appendix 2). But while the first country goes from a Gini market of 54 to a Gini net of 35, the second moves from 44 to 25. Measuring redistribution in absolute terms would lead us to conclude that they have been equally effective in redistributing income. Employing relative redistribution, however, indicates that the Czech Republic redistributes more than the United Kingdom (0.43 vs 0.34). In other words, a more unequal country (United Kingdom) will manifest a lower level of relative redistribution than a more equal country (Czech Republic) even if the two countries implement redistributive policies that result in a similar reduction in income inequality (or absolute redistribution).
The results reported in Tables 1 and 2 suggest that, on the one hand, redistributive efficiency is very low in Bulgaria and relatively low in the Southern European countries and the United States, and, on the other, social transfers and direct taxes redistribute income relatively efficiently in the Nordic and Central European countries as well as Australia.
Table 3 reports the results obtained using panel data truncated regressions of the estimated efficiency scores that appear in Tables 1 and 2 on the non-discretionary factors presented in section ‘Empirical methodology’. The results confirm the expected effect of the non-discretionary factors. We find that redistributive efficiency increases with government effectiveness and human capital and decreases with population. This is consistent with the expectation that smaller countries, ones with better quality public administrations and more human capital, are better able to design and implement redistributive policies.
Main results (dependent variable: output efficiency scores).

WGI: World Governance Indicators; GDP: gross domestic product.
Standard errors in parentheses. All regressions include a constant (not shown).
,**,***Statistical significance at the 10.5 and 1 percent levels, respectively.
Moreover, we find that a higher rate of unemployment and a larger share of the population above 65 years of age are positively associated with redistributive efficiency which is consistent with the expectation that these needs-based measures will tend to reinforce the redistributive profile of the welfare state. We also find ethnic fractionalization and educational inequalities reduce redistributive efficiency. Again, this is in line with the expected effect of these variables on the redistributive orientation of public spending and taxation. Ethnic heterogeneity implies a weaker demand for redistribution. Educational inequality, as a proxy of elite influence, is associated with less redistributive efficiency, consistent with the argument that economic elites in democratic countries may use their economic power to influence the suppliers of public policies with the aim of circumventing redistributive demands stemming from the electorate.
We further pursue the robustness of our regression results in Table 4. In the first four columns, we employ an alternative measure of administrative efficiency: a variable from the International Country Risk Guide (ICRG) database that measures the quality of the bureaucracy. Higher points are given to countries where the bureaucracy is autonomous from political pressure, has expertise and has established mechanisms for recruitment and training. In columns 5–8, we control for the existence of veto points in the political decision-making process. Bradley et al. (2003) argue that more veto points may empower special interests opposed to welfare enhancing legislation thus reducing the size of the welfare state (see also Persson and Tabellini, 2004) at the same time as they make the retrenchment of established welfare programmes more difficult. By the same token, veto points may have an impact on redistributive efficiency by empowering groups who want to either tone down or enhance the redistributive profile of fiscal policies while they may also lock-in existing profiles. To measure veto points, we turn to a measure from Gerring and Thacker (2004), low values of which capture federal and presidential systems, while higher values reflect unicameral and parliamentary ones.
Robustness (dependent variable: output efficiency scores).

WGI: World Governance Indicators; ICRG: International Country Risk Guide; GDP: gross domestic product.
Standard errors in parentheses. All regressions include a constant (not shown).
,**,***Statistical significance at the 10.5 and 1 percent levels, respectively.
Finally, in columns 9–12, we further pursue the idea that redistributive efficiency depends on the redistributive orientation of transfers and direct taxes by controlling for the welfare state regime in place (see Kammer et al., 2012). Specifically, we consider four different types of welfare regimes in our sample of countries according to the characteristics of their tax and transfer systems based on the Joumard et al. (2012) classification which uses 19 policy indicators of the size, mix and progressivity of taxes and public expenditure. In short, they classify OECD countries into four groups or regimes, according to their tax and transfer systems. The first regime (welfare 1 variable) is characterized by large cash transfers to households (not dominated by old-age pensions) and by high tax to GDP ratios (with a large role for direct taxes). The second one (welfare 2) features large cash transfers to households dominated by old-age pensions and high tax to GDP ratios but with a marginal role for personal income tax. The third system (welfare 3) presents relatively small cash transfers and taxes combined with a large role for property and personal income taxes. Finally, the base category is characterized by relatively low public spending (and dominated by in-kind services rather than in cash transfers), and consumption taxes play a dominant role in total taxes.
The results reported in Table 4 are broadly consistent with those in Table 3. Countries with better public administrations attain higher levels of redistributive efficiency. Alternatively, in political systems with fewer veto points, redistributive efficiency is greater, indicating that veto points may enable interest groups opposed to fiscal policies with a more redistributive bent. Finally, we do not find welfare state regimes to be robustly associated with redistributive efficiency, while their inclusion alters the impact of the needs-based variables included in the regressions, namely, unemployment rate and population above 65 years of age. This is to be expected given the fact that the regime classification (especially regime types 1 and 2) accounts for cash transfers to households which include unemployment assistance and pensions. 8
Finally, we have also pooled all the country-year observations in the first stage in order to measure redistribution efficiency relative to what is possible among these countries in recent history and not relative to what was achieved in a particular year. We then employ the resultant scores in the second-stage regression analysis. As can be seen in the Supplementary Online Appendix of this article (Supplementary Tables SA.3 and SA.4), this additional robustness exercise confirms our main findings.
Conclusion
Theoretical and empirical work suggests that income inequality could have a negative impact on economic development. The redistributive potential of fiscal policy, both on the tax and spending sides, can therefore play an important role in both reducing inequalities and raising long-term growth. In the context of increasing income inequalities and scarce budgetary resources experienced by many countries, attention needs to be paid to the efficiency of fiscal policy in redistributing income. Efficiency alleviates budget constraints as it facilitates the attainment of greater levels of redistribution at given levels of spending and taxation. In this article, we empirically evaluate the redistributive efficiency of social transfers and direct taxation through the DEA methodology, and we then use the efficiency scores obtained to analyse the determinants of cross-country variation in efficiency through panel regression analysis. Because these fiscal policies have other objectives, it is important to state that we are not trying to evaluate their efficiency beyond redistribution. Moreover, it is worth pointing out that one limitation of the analysis undertaken in this article is that it does not capture all the policies that governments can use to redistribute beyond transfer and tax policies. For example, governments can also redistribute through labour regulations (minimum wages, retirement age and affirmative action and gender policies).
Our first-stage results – obtained through the DEA methodology and based on a panel of 28 developed countries for the period 1995–2010 – reveal important differences in redistributive efficiency across countries. Specifically, we identify higher efficiency levels in the Nordic and Central European countries and Australia, while the Southern European countries and the United States display much lower levels of efficiency and consequently a greater scope for improvement. That is to say, for a given level of social transfers and direct taxation, the former group of countries achieves a higher degree of redistribution than the latter group. As such, the Southern European countries and the United States could, in principle, redistribute more with the same fiscal effort (transfers and direct taxes). However, the extent to which they can improve redistributive efficiency partly depends on a set of non-discretionary factors revealed by our second-stage results. In particular, the analysis reveals the crucial role of government quality, as well as variables affecting the redistributive profile of fiscal policies. The non-discretionary nature of all these factors does not mean that improvements in redistributive efficiency are impossible. Rather, they point to the possibility that such improvements are partly the result of slow changing factors and, as a result, are likely to occur over a longer time horizon.
Footnotes
Appendix 1
Acknowledgements
Kyriacou and Roca-Sagalés would like to thank the School of Public Policy and Governance (University of Toronto) and the Geary Institute of Public Policy (University College Dublin), for their kind hospitality during July 2015 and 2016 respectively. The usual disclaimers apply.
Authors’ Note
Leonel Muinelo-Gallo is now affiliated to Instituto de Economía de la Universidad de la República, Uruguay. Oriol Roca-Sagalés is now affiliated to Universitat Autònoma de Barcelona, Spain.
Funding
The author(s) disclosed receipt of the following financial support for the research, authorship, and/or publication of this article: The authors would like to thank the financial support from, ECO2016-75623-R (Ministerio de Economía i Competitividad), 2014SGR239 and XREPP (Direcció General de Recerca - Spain), as well as the project “Calidad de gobierno, gasto público social y financiamiento: impacto en la trayectoria de crecimiento económico de países de América Latina, 1950-2011” of the Comisión Sectorial de Investigación Científica – Universidad de la República - Uruguay.
Notes
References
Supplementary Material
Please find the following supplemental material available below.
For Open Access articles published under a Creative Commons License, all supplemental material carries the same license as the article it is associated with.
For non-Open Access articles published, all supplemental material carries a non-exclusive license, and permission requests for re-use of supplemental material or any part of supplemental material shall be sent directly to the copyright owner as specified in the copyright notice associated with the article.