




Abstract
Keywords
Introduction
Skin aging is a natural process that is impacted by a variety of extrinsic and intrinsic variables, including pollution, UV exposure, and lifestyle choices, as well as heredity and the passage of time. 1 Important structural proteins like collagen and elastin are produced at a decreasing rate as skin ages. 2 While elastin gives the skin its elasticity and capacity to regenerate itself, collagen gives the skin strength and structure. It is the breakdown of these proteins that causes drooping, wrinkles, and a loss of firmness. 3 Because they neutralize free radicals, which are unstable chemicals that damage cells and hasten the aging process, antioxidants are essential in the fight against skin aging. Antioxidants aid in the preservation and repair of skin by lowering oxidative stress. They support the restoration of collagen and elastin, promoting a more youthful appearance by maintaining the skin's structure and elasticity. Incorporating antioxidants into skincare routines, through topical applications or diet, can thus significantly enhance skin health and slow the visible signs of aging. 4
N-acetylcysteine (NAC) is a glutathione (GHS) precursor and prodrug of the L-cysteine amino acid; NAC has anti-inflammatory, antioxidant, mucolytic, and anti-cancer properties. 5 As an L-cysteine prodrug, the body can use the available cysteine to replenish the GHS to reduce inflammation and damage from free radicals. 6 Pharmacologically NAC can be consumed as a dietary supplement for the treatment of various conditions and diseases such as polycystic ovary syndrome (PCOS), acetaminophen overdose, chronic bronchitis, and asthma. It can also be given to treat cystic fibrosis (CF) due to its mucolytic properties, in that it breaks up the mucus lining the lungs. This breakdown occurs when NAC reduces the disulfide bonds within the mucus lining making the mucus less viscous and easier to expel. 7
Coenzyme Q10 (CoQ10) is a fat-soluble antioxidant that plays a crucial role in cellular energy production and protection against oxidative stress. It is naturally found in the mitochondria of cells, where it participates in the electron transport chain to generate ATP, the primary energy currency of the cell. 8 CoQ10 also helps neutralize free radicals, thereby protecting cells from damage. As an antioxidant, CoQ10 also contributes to skin health by reducing the signs of aging and protecting against UV damage. 9
Niacinamide, also known as vitamin B3 or nicotinamide, is a water-soluble vitamin with significant antioxidant and anti-inflammatory properties. 10 It plays a vital role in cellular metabolism and DNA repair, helping to protect skin cells from environmental stressors and oxidative damage. 11 Niacinamide has been shown to improve skin barrier function, reduce the appearance of fine lines and wrinkles, and address issues like hyperpigmentation and acne. 10
Gamma cyclodextrin (GAMMA) is a cyclic oligosaccharide that acts as an antioxidant by enhancing the solubility and stability of various bioactive compounds. 12 Its unique structure allows it to form inclusion complexes with other molecules, thereby protecting them from degradation and increasing their bioavailability. Gamma cyclodextrin is used in pharmaceuticals, cosmetics, and food industries to deliver active ingredients more effectively. By improving the stability of antioxidant compounds, gamma cyclodextrin helps in protecting cells from oxidative stress and extends the shelf life of products. 13
Retinol, a form of vitamin A, is a potent antioxidant widely recognized for its role in skin health and anti-aging treatments. It works by promoting cell turnover and collagen production, which helps to reduce the appearance of wrinkles, fine lines, and age spots. Retinol also enhances skin texture and tone, making it a popular ingredient in skincare products. Beyond its cosmetic benefits, retinol supports vision, immune function, and overall cellular health by neutralizing free radicals and preventing oxidative damage. 14
Epigallocatechin Gallate (EGCG) has been studied for its numerous health benefits, including its anti-inflammatory, anti-cancer, and neuroprotective properties. 15 It supports cardiovascular health, aids in weight management, and promotes skin health by reducing inflammation and protecting against UV-induced damage. EGCG's antioxidant properties make it a valuable component in both dietary supplements and skincare products. 16
Ellagic acid (ELA) is a natural polyphenol antioxidant found in various fruits and nuts, particularly in berries and pomegranates. 17 It is known for its ability to scavenge free radicals, reduce oxidative stress, and protect cells from damage. Ellagic acid has anti-inflammatory, anti-cancer, and antimicrobial properties, making it beneficial for overall health. It supports skin health by reducing inflammation, preventing collagen breakdown, and protecting against UV damage. Additionally, ellagic acid may improve liver function and promote cardiovascular health, making it a versatile and valuable antioxidant. 18 This paper presents the synergistic effect of CoQ10, EGCG, Retinol and NAC on the formation of elastin and type 1 collagen in human dermal fibroblasts surpassing the individual component effects observed before.
Methods
Cell culture
In this study, the primary human dermal fibroblasts (HDFs) were used between passages 4–6. The HDFs are cultured using Fibroblast Medium (FM) (ScienCell Research Laboratories, Carlsbad, CA) with added 100 units/mL penicillin and streptomycin, 5% fetal bovine serum (FBS), and fibroblast growth serum (FGS) (ScienCell, Cellgro Mediatech, Herndon, VA) in an incubator with 5% CO2 at 37°C. Media changes are completed every 3–4 days with weekly passages until a final passage of the HDF cells is completed into culture dishes for treatment.
Antioxidant treatment
Gamma cyclodextrin (GAMMA), Niacinamide(NIAC), Epigallocatechin gallate (EGCG), Coenzyme Q10 (CoQ10), Retinol, N-acetylcysteine (NAC) and ellagic acid, are dissolved into stock solutions using dimethyl sulfoxide (DMSO) (Sigma Aldrich, St Louis, MO) and sterilized through 0.2 µm membrane filters (Corning Incorporated, Corning, NY). Each testing formulated medium contains 100 µg/mL NAC, 5 µg/mL EGCG, 5 µg/mL retinol, 10 µg/mL coQ10, 10 µg/mL NIAC, 500 µg/mL GAMMA, and 2.5 µg/mL ellagic acid or a mixture of them. The control FM contains the same volume of DMSO as the other testing FM groups. The HDF cells are treated for 14 and 21 days for analysis and imaging.
Fastin assay for elastin
Fastin assay kit (Accurate Scientific and Chemical Corporation, Westbury, NY) quantifies the total deposition of matrix elastin. Elastin deposited in the extracellular matrix (ECM) is quantified post-treatment. The collected elastin is spun into a pellet digested in 3 cycles of 0.25 M oxalic acid for 1 h each in a hot bath at 100°C.
Immunofluorescence
For imaging, each treatment is washed twice using phosphate-buffered saline (PBS) then fixed with 3.7% formaldehyde at room temperature for 15 min. 5% bovine serum albumin (BSA) blocking buffer is added to each treatment and incubated. A 1:100 dilution of elastin antibodies [Alexa Fluor® 594] (Novus Biologicals, Centennial, CO) and rabbit anti-rat collagen type 1 antibodies [Alexa Fluor® 488] (Novus Biologicals, Centennial, CO) are applied at 4°C overnight. Samples are imaged using CytoViva's proprietary Dual Mode Fluorescence (DMF) module and configured using an Olympus BX51 upright microscope with an oil UPL fluorite objective and an adjustable iris.
Circle assay for collagen
Sircol collagen assay kit (Biocolor, Carrickfergus, United Kingdom) is used to quantify collagen. Treatment cell lysate and medium are collected on days 14 and 21 for analysis. The reagent is added to 200 µL of collected samples, mixed for 30 min at room temperature, and centrifuged for 10 min at 15,000 rmp to concentrate precipitate into a pellet. The collected pellet is mixed with 0.5 M NaOH into 96 well-plates. The plate is analyzed with a plate reader at 556 nm.
PCR analysis
The high-capacity cDNA reverse transcription kit (Applied Biosystems, Foster City, CA) quantifies real-time polymerase chain reaction (PCR) for analysis. Assay primers, designed with primer 3, sequences are listed in table 1. PCR analysis for genes of interest is performed using the BioRad CFX384 Real-Time PCR Detection System (BioRad, Hercules, CA). The final reaction volume of 10 µL contains 250 nM of relevant forward and reverse amplification primers, 20 ng RNA, 5 µL PowerUp™ SYBR Green Master Mix (Applied. Biosystems, Foster City, CA, USA; Cat. no. A25742), and the remaining volume cDNA. The cycle protocol for real-time PCR analysis requires initial conditions for polymerase activation at 95°C for 10 min followed by 40 cycles at 95°C in 15 s increments and a final condition of 60°C for 1 min. COL1A1 gene expression levels were determined with the COL1A1 gene expression assay (Thermo Fisher, Hs00164004_m1).
Primers.

Data collected is analyzed using Biocad CFX Manager version 3.1 software in which the calibration of the experimental cycle quantification (Cq) is set against glyceraldehyde-3-phosphate dehydrogenase (GAPDH) as the endogenous control product.
Statistical analyses
The testing was completed in 2 trials of triplicate experiments. Quantified data was compared and expressed using unpaired t-tests, one-way, or two-way ANOVA where the mean standard deviation results are deemed significant if p ≤ 0.05. Turkey's Honest Significant Difference (HSD) is used when significant deviations in data are found.
Results
Figure 1A shows the elastin mRNA fold change normalized to the control group. For NAC, the fold change in mRNA levels for elastin is 1.57 compared to the control group. The p-value indicates a nonsignificant difference from the control group. For CoQ10, the fold change in mRNA levels for elastin is 1.61 compared to the control group. The p-value indicates a nonsignificant difference from the control group. For Niacinamide (NIAC). The fold change in mRNA levels for elastin is 1.9 compared to the control group. The p-value indicates a nonsignificant difference from the control group. For Gamma, the fold change in mRNA levels for elastin is 2.7 compared to the control group. The p-value indicates a nonsignificant difference from the control group. For Retinol, the fold change in mRNA levels for elastin is 3 compared to the control group. The p-value is approximately 0.008, indicating a significant difference from the control group. For EGCG, the fold change in mRNA levels for elastin is 14 compared to the control group. The p-value is approximately 0.001, indicating a significant difference from the control group. After observing that EGCG by itself has the maximum effect of elastin production in mRNA level. We decided to look at the combinational treatment.
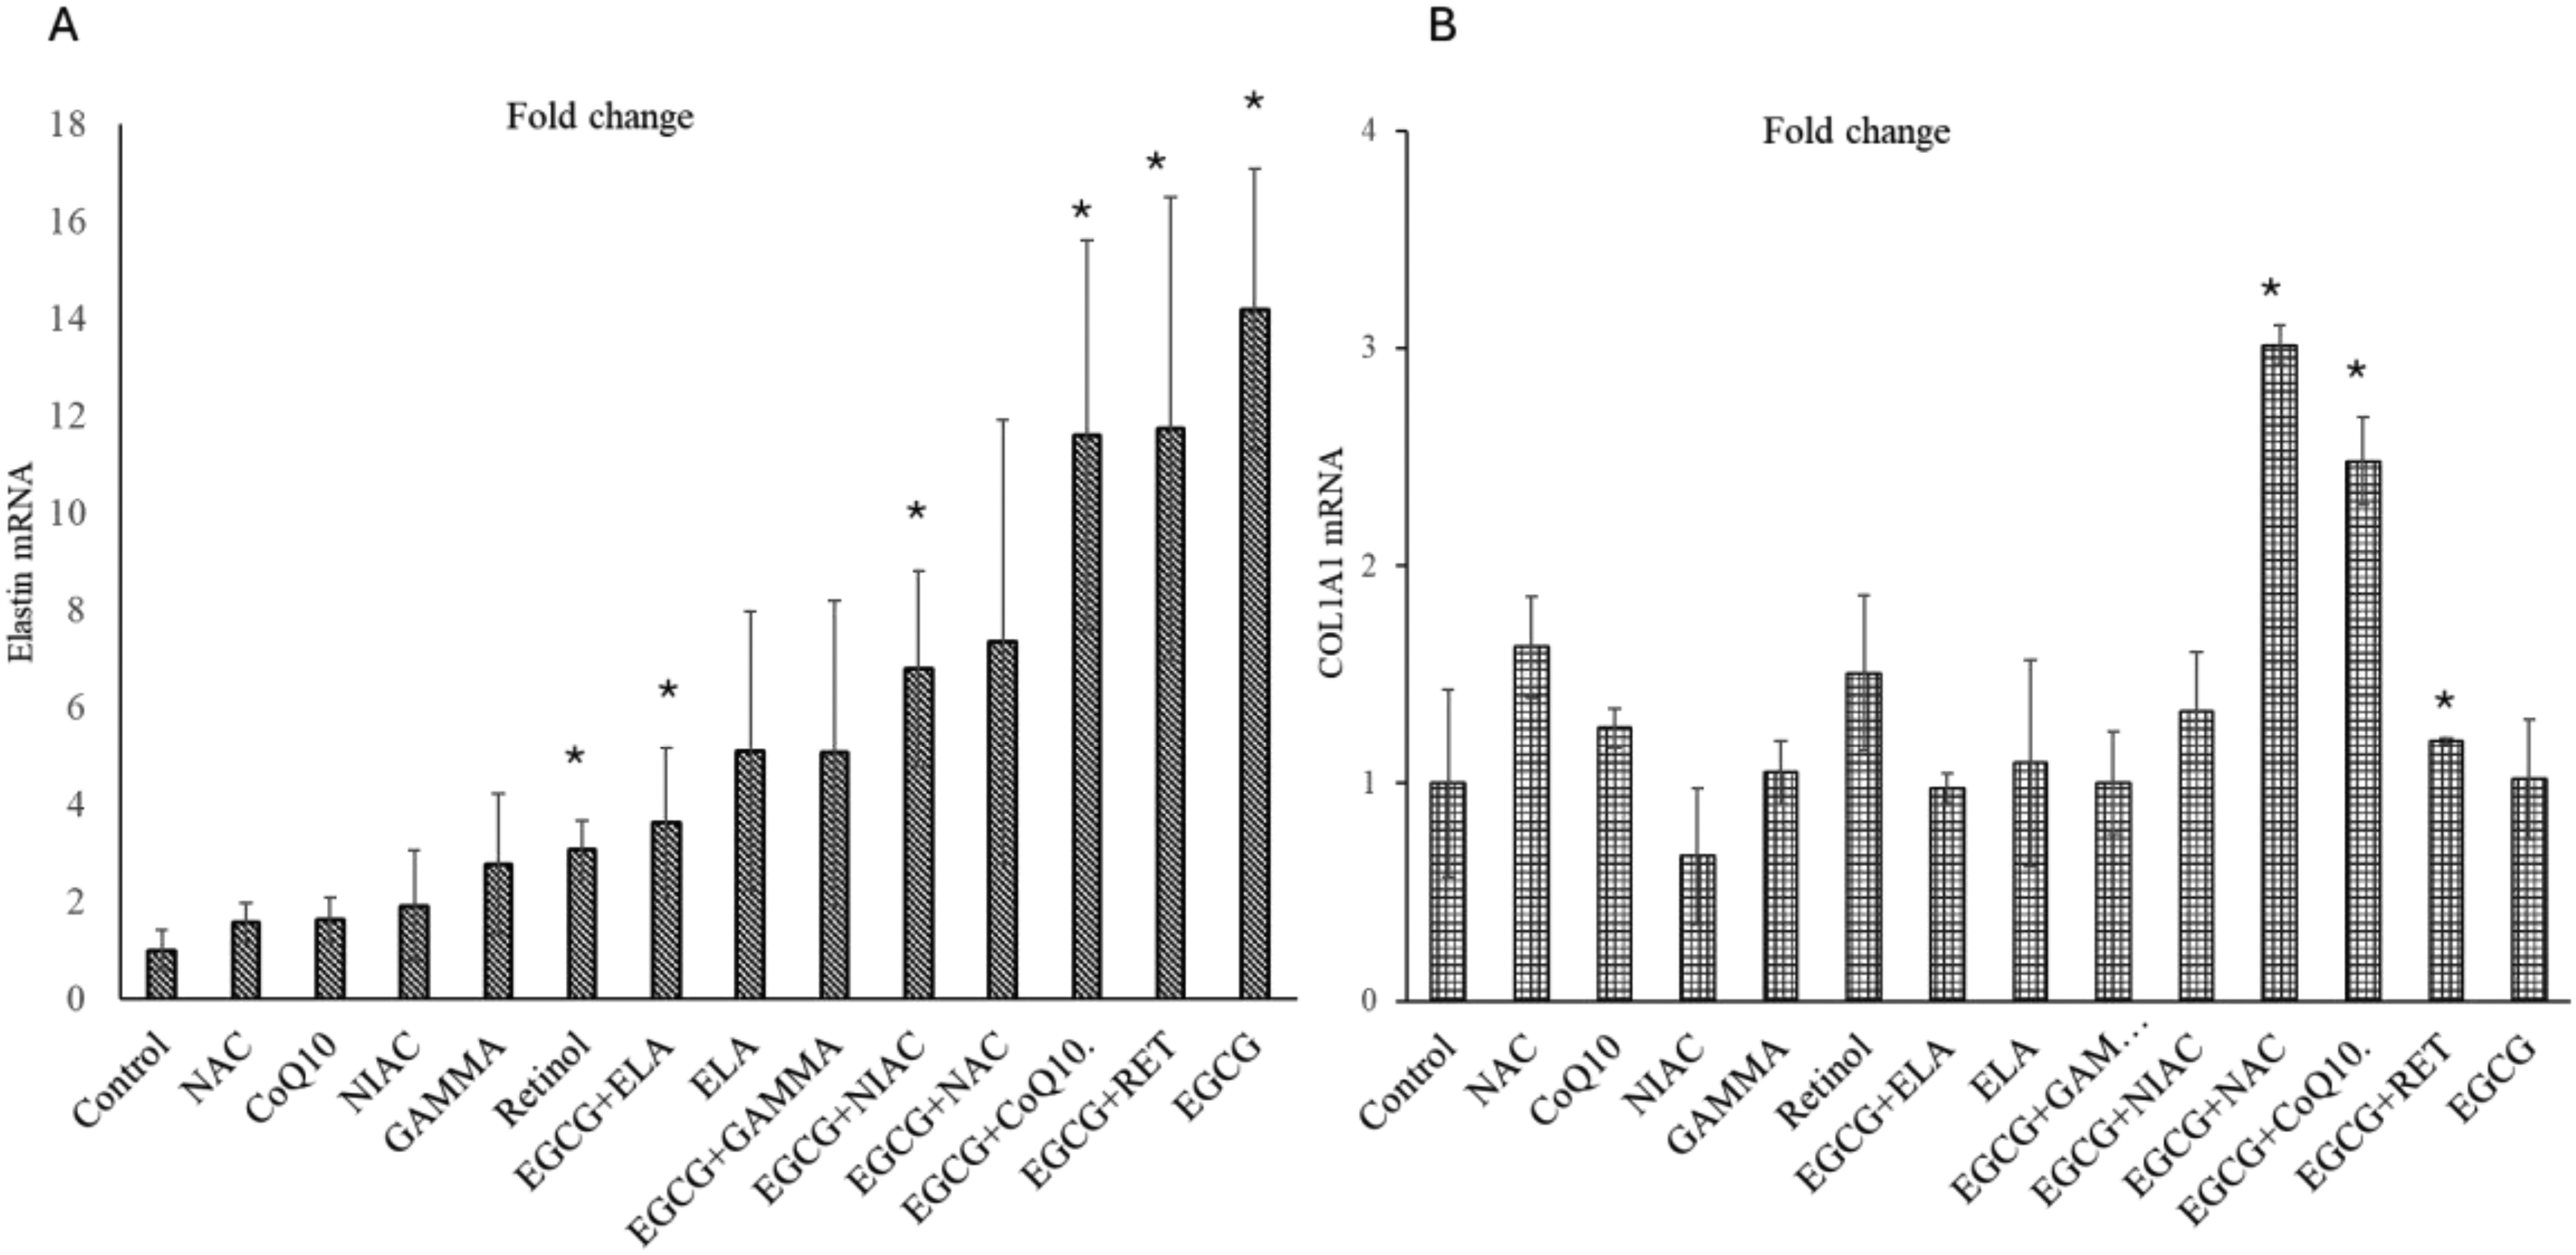
Quantitative analysis of mRNA expression levels for elastin (A) and collagen type I (B) across different treatment groups. Fold changes are normalized to the control group, which is set at 1. In panel (A), elastin mRNA expression shows a significant increase in the Retinol, EGCG + ELA, EGCG + NIAC, EGCG + CoQ10, EGCG + RET and EGCG groups compared to the control (indicated by *). The EGCG group demonstrates the highest fold change in elastin mRNA expression. In panel (B), collagen type I mRNA expression is significantly elevated in the EGCG + NAC, EGCG + CoQ10, and EGCG + RET groups compared to the control (indicated by *). Error bars represent the standard deviation of the mean.
EGCG + NIAC, EGCG + Retinol, EGCG + CoQ10, and EGCG + ELA have fold changes of 6.7, 11.7, 11.5, and 3.6, respectively, with very significant p-values indicating a substantial difference in elastin mRNA from the control.
Figure 1B shows the collagen 1 mRNA fold change normalized to the control group. For NAC, the fold change was 1.627. However, this change was not statistically significant compared to the control. For CoQ10 the fold change was 1.254, which was not statistically significant. For NIAC the fold change was 0.665. This decrease was not statistically significant. For GAMMA the fold change was 1.051, showing no significant difference from the control. For Retinol, the fold change was 1.507, but this increase was not statistically significant. For EGCG + ELA, the fold change was 0.977, which was not significantly different from the control. For ELA, the fold change was 1.094, and this difference was not statistically significant. For EGCG + GAMMA, the fold change was 1.002 with a standard deviation of 0.238, showing no significant change compared to the control. For EGCG + NIAC, the fold change was 1.329 with a standard deviation of 0.274. This increase was not statistically significant. For EGCG + NAC: The fold change was 3.014 with a standard deviation of 0.091, and this increase was statistically significant (p = 0.0005). For EGCG + CoQ10, the fold change was 2.481 with a standard deviation of 0.201, showing a statistically significant increase (p = 0.0016). For EGCG + RET, the fold change was 1.196 with a standard deviation of 0.011, and this increase was statistically significant (p = 0.0008). For EGCG, the fold change was 1.019 with a standard deviation showing no significant change compared to the control. In summary, among the treatment groups, EGCG + NAC, EGCG + CoQ10, and EGCG + RET showed statistically significant increases in collagen-1fold change compared to the control. EGCG + CoQ10, and EGCG + RET were shown to have a significant effect on elastin and collagen both.
Figure 2 shows the immunofluorescence staining of elastin in different groups. Groups treated with EGCG, EGCG + Retinol, EGCG + NAC, EGCG + CoQ10, and EGCG + NIAC showed the highest increase in elastin expression, as evidenced by the strong red fluorescence. Groups treated with ELA, Retinol, and EGCG + Gamma showed a moderate increase in elastin expression.
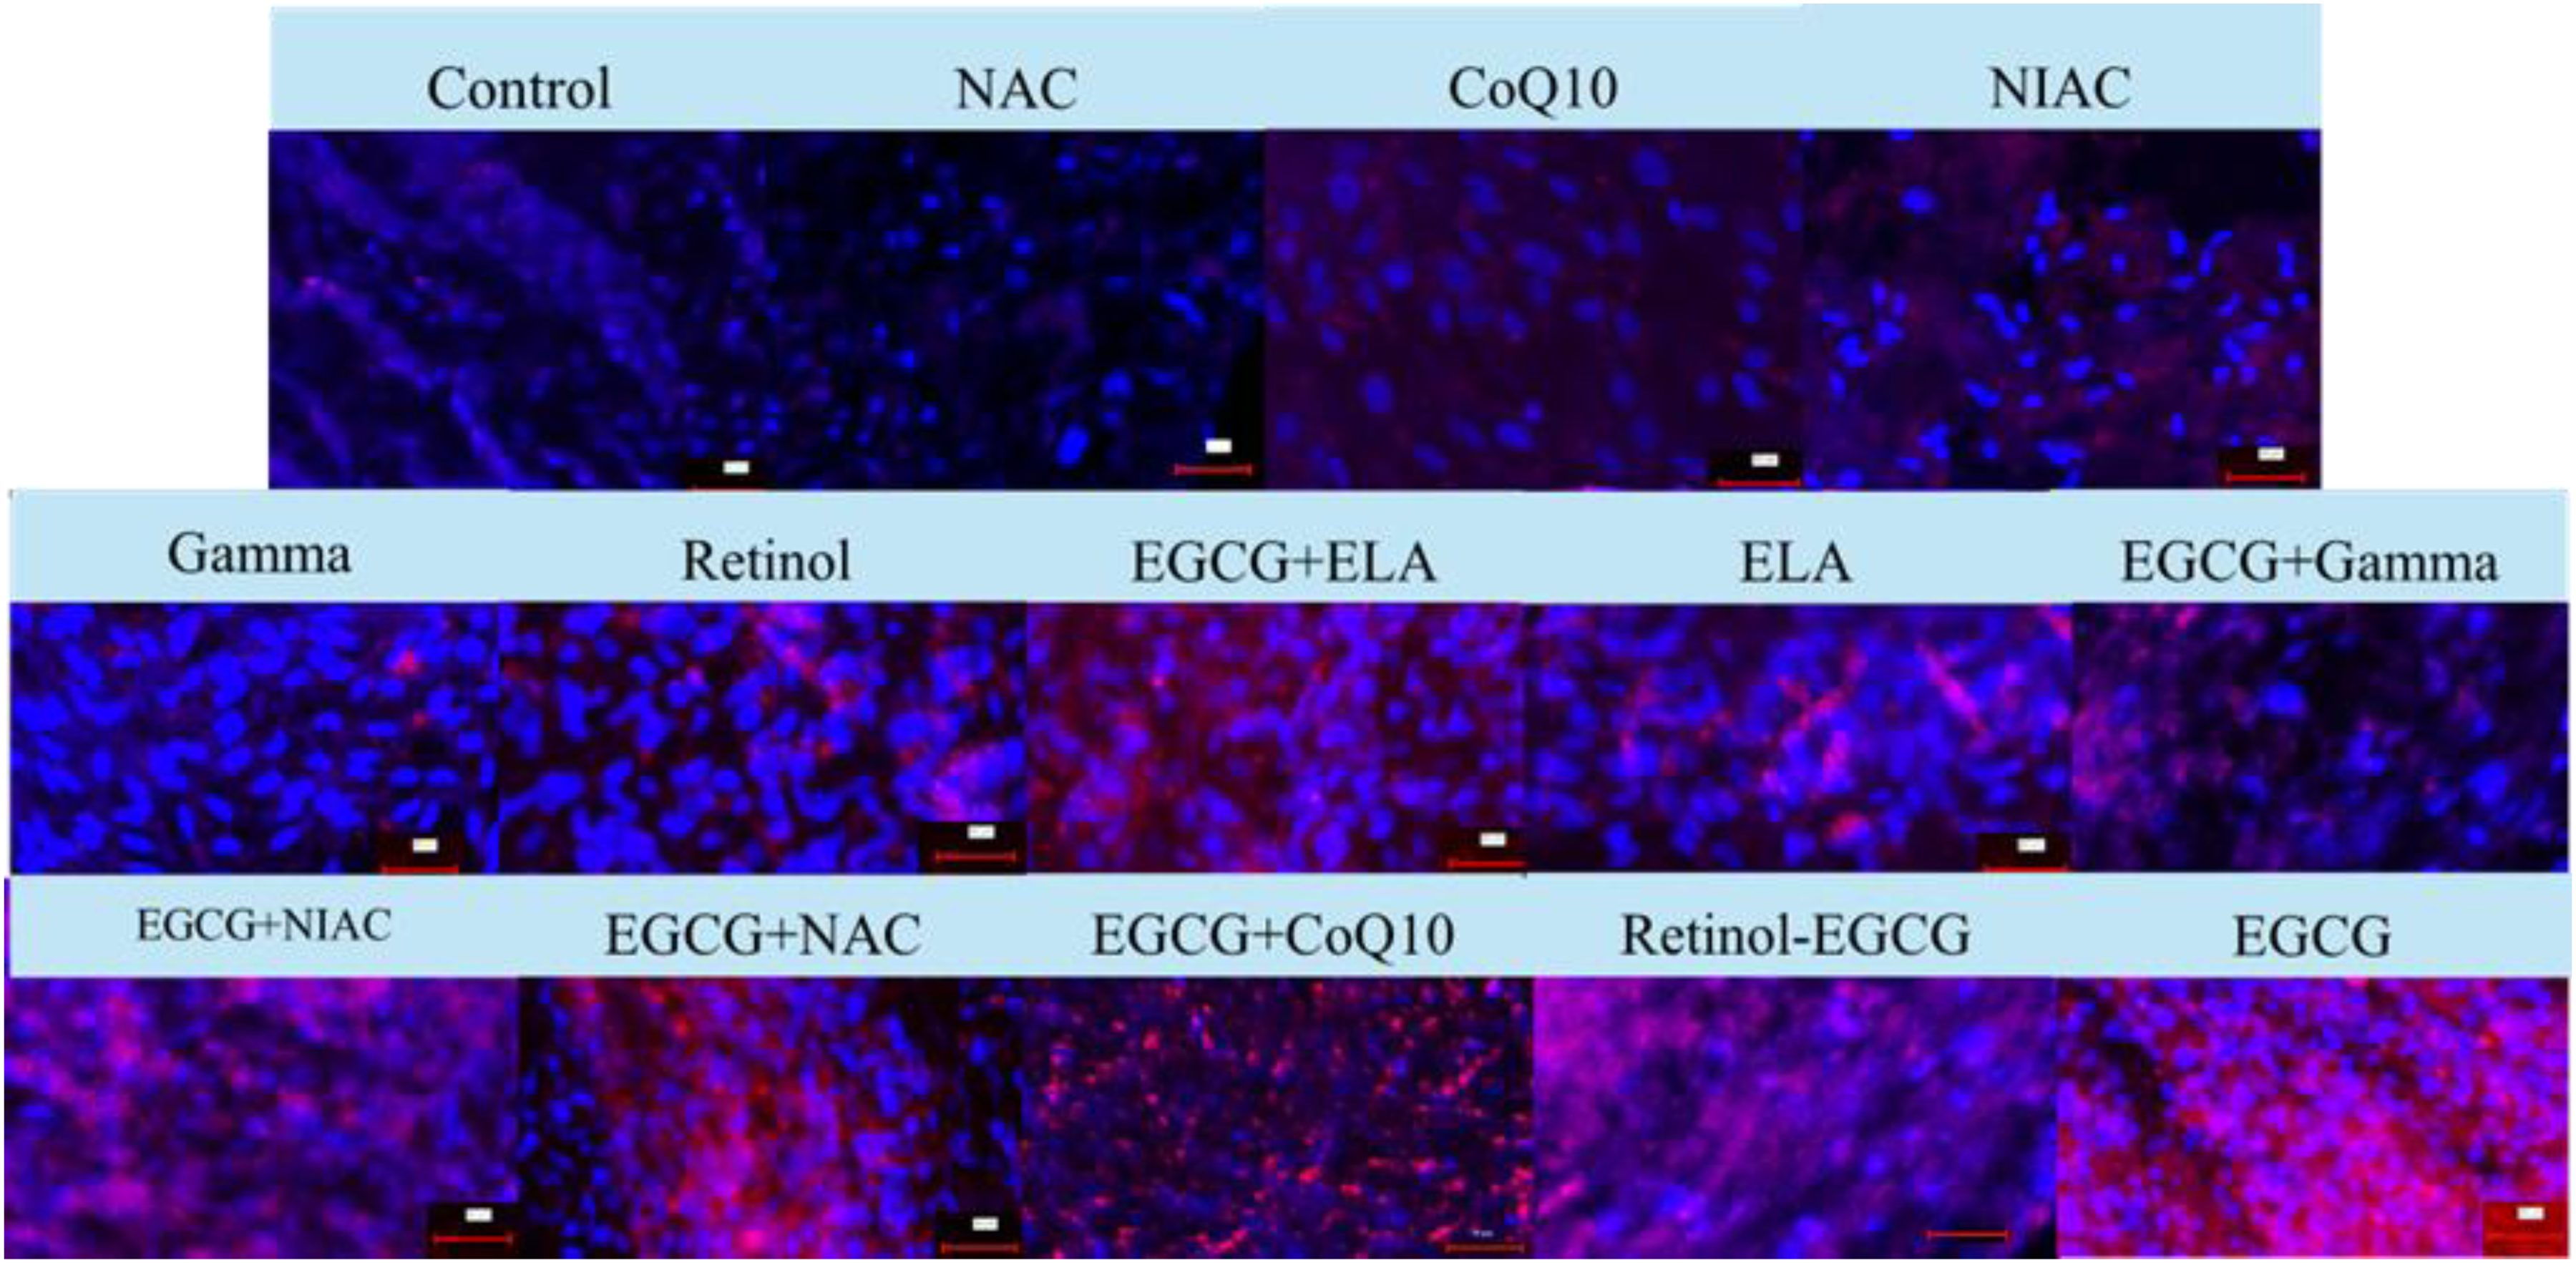
Immunofluorescence staining of elastin in various treatment groups using elastin antibodies (Alexa Fluor® 594, red) and DAPI (blue) to label nuclei. The images compare elastin expression in the Control, NAC, CoQ10, NIAC, Gamma, Retinol, EGCG + ELA, ELA, EGCG + Gamma, EGCG + NIAC, EGCG + NAC, EGCG + CoQ10, Retinol-EGCG, and EGCG groups. Each scale bar represents 50 µm.
In Figure 3A, matrix elastin production in the matrix of human dermal fibroblasts showed a significant increase in several treatment groups compared to the control. The EGCG + ELA, ELA, and Retinol groups exhibited a significant increase, with a fold change nearing 2. The EGCG + GAMMA group demonstrated a significant increase, with a fold change near 2. The EGCG + CoQ10 group had the highest increase, with a fold change nearing 4. The EGCG + RET group also showed a significant increase, with a fold change above 4. Finally, the EGCG group displayed a high increase, with a fold change above 3.
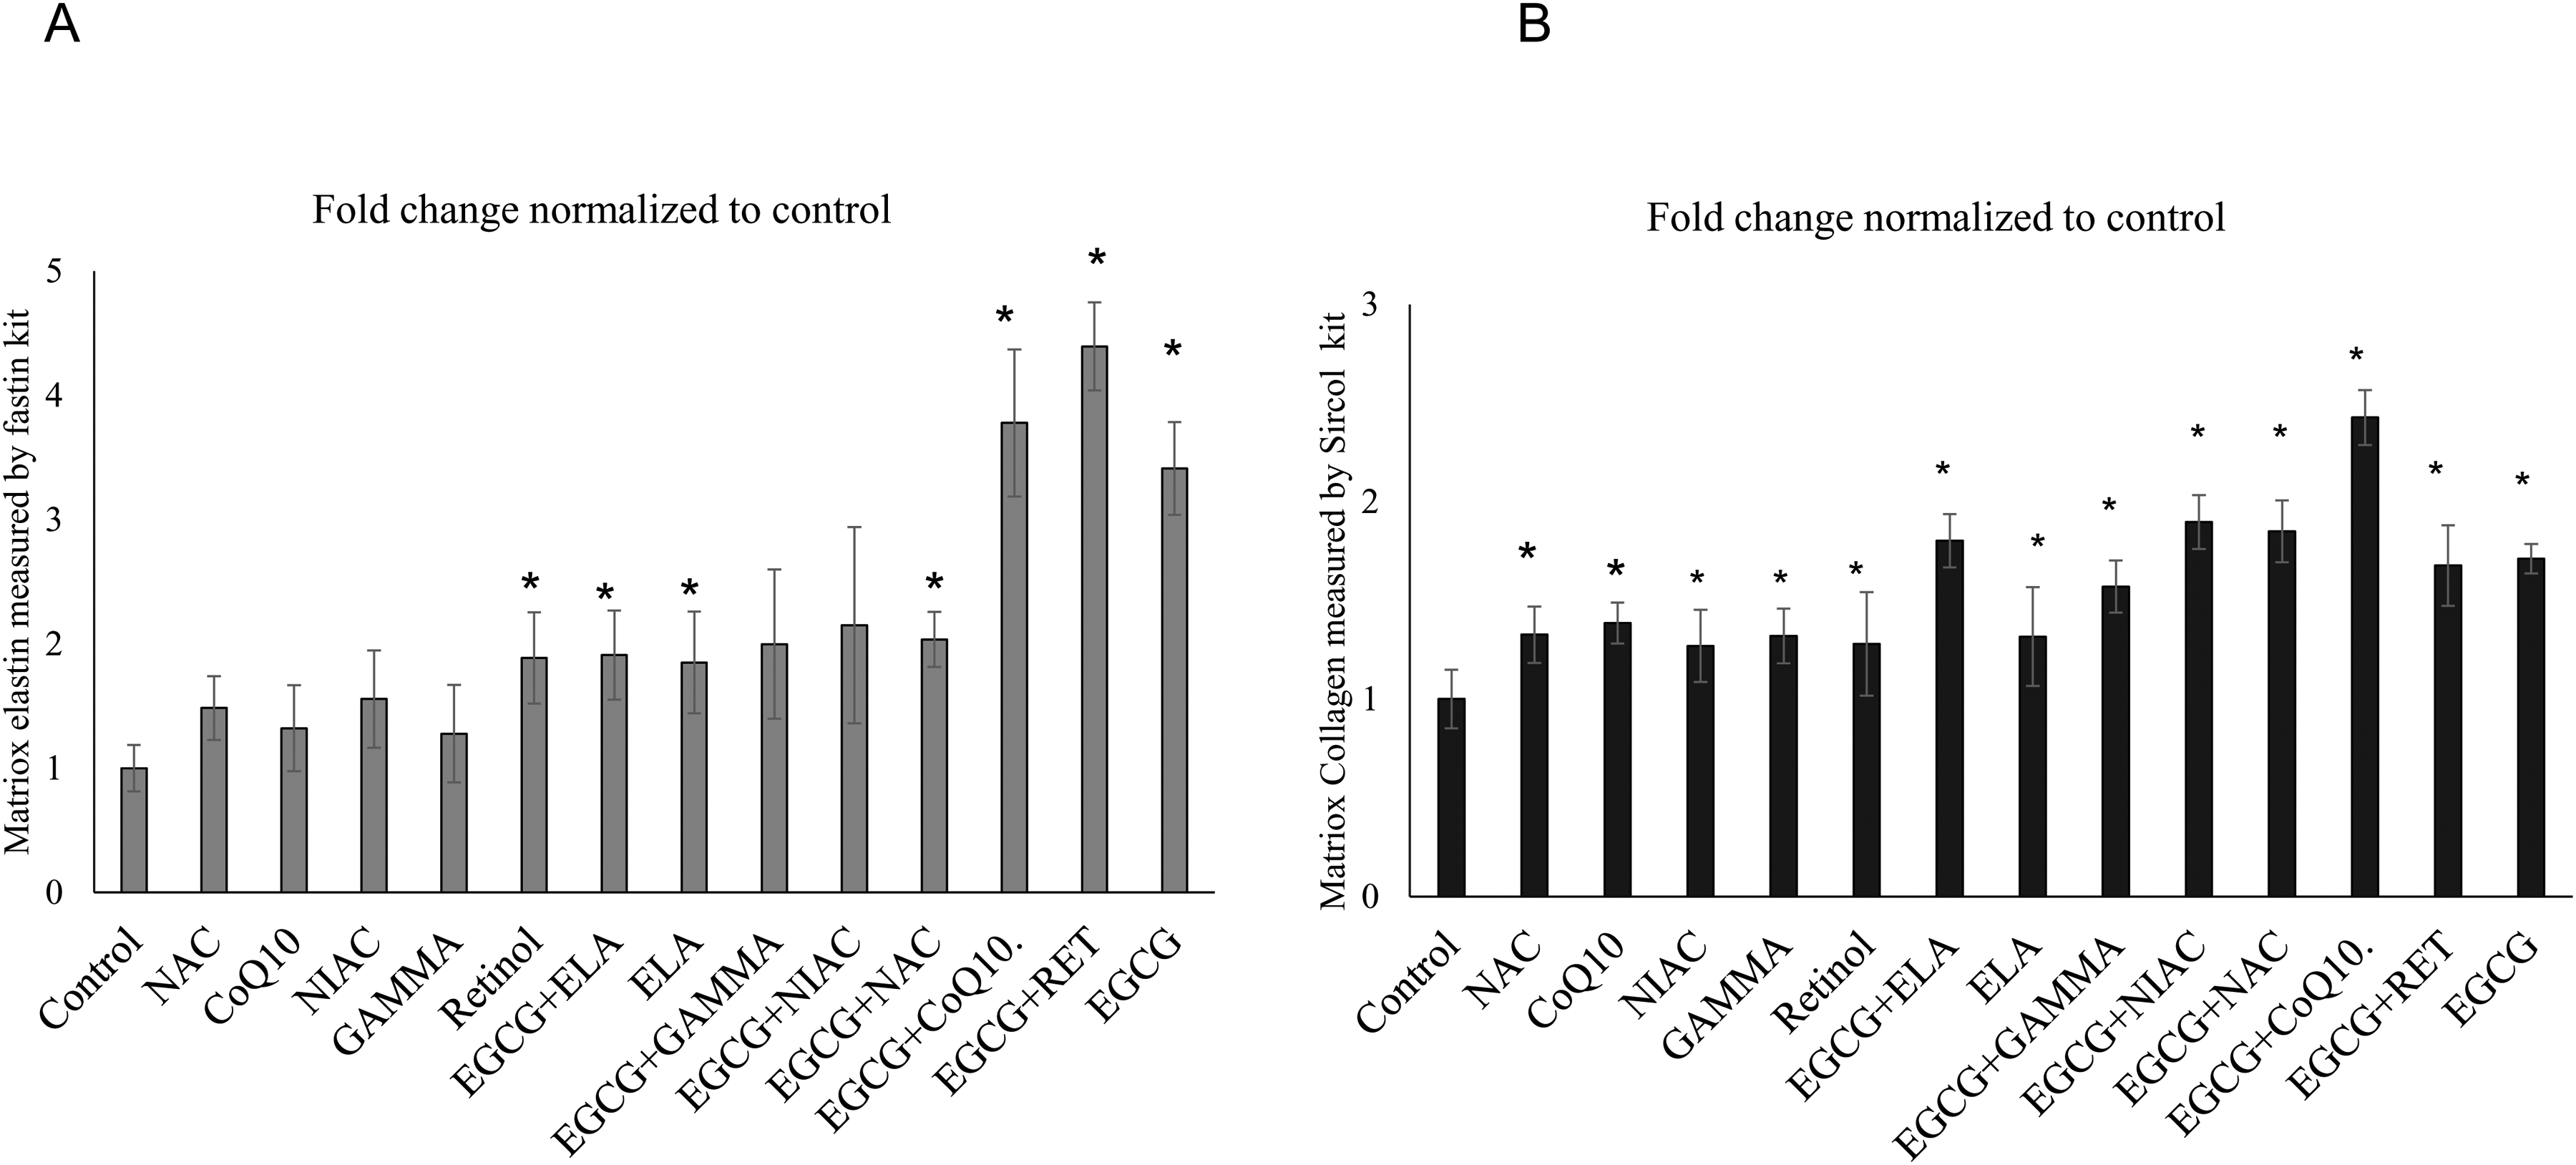
Matrix elastin and collagen production in human dermal fibroblasts. Figure A demonstrates the matrix elastin production, while Figure B illustrates the collagen Type I production in human dermal fibroblasts cultured for 14 days under different treatment conditions. Each bar represents the mean fold change in production normalized to the control, with error bars indicating standard deviation. Statistical significance compared to the control group is marked by an asterisk (*).
In Figure 3B, we are looking at the matrix collagen. The production of collagen was significantly higher in all treatment groups compared to the control group. The fold changes in collagen production were highest in EGCG + CoQ10, EGCG + NIAC, EGCG + NAC, EGCG, and EGCG + RET respectively.
Overall, the combination treatments, especially those involving EGCG, demonstrated the most pronounced increases in both elastin and collagen Type I production. The EGCG + CoQ10 combination yielded the highest fold changes in both elastin and collagen production, suggesting a synergistic effect of these compounds in promoting extracellular matrix protein synthesis in human dermal fibroblasts.
The immunofluorescent staining of collagen Type I in human dermal fibroblasts cultured for 14 days under various treatment conditions is shown in Figure 4. The staining was performed using an anti-collagen Type I antibody conjugated with Alexa Fluor 488, resulting in green fluorescence indicative of collagen presence. Blue fluorescence represents nuclear staining, providing a reference for cell density and distribution. The control group exhibits a baseline level of collagen production. In contrast, all other treatment groups demonstrate substantial increases in collagen Type I deposition, as evidenced by the pronounced green fluorescence. Overall, the combination treatments, particularly those involving EGCG, demonstrate the most pronounced increases in collagen Type I production, consistent with the mRNA data presented earlier. The EGCG + CoQ10 combination, in particular, yields the highest level of collagen Type I deposition, suggesting a synergistic effect of these compounds in enhancing collagen synthesis in human dermal fibroblasts.

Immunofluorescence staining of collagen type I in various treatment groups using elastin antibodies (Alexa Fluor® 488, green) and DAPI (blue) to label nuclei. Th.
Discussion
The combination of CoQ10 and EGCG and NAC and EGCG demonstrated the most significant increase in collagen Type I production in human dermal fibroblasts while their individual effects were not significant. Several factors contribute to this synergistic effect, leading to enhanced collagen synthesis.
One potential effect involves NF-κB (Nuclear Factor kappa-light-chain-enhancer of activated B cells), a protein complex that acts as a transcription factor crucial for regulating immune responses, cell proliferation, and inflammation. 19 Typically, NF-κB suppresses collagen I synthesis during inflammation. 20 When activated under inflammatory conditions, NF-κB induces the production of cytokines and other factors that inhibit collagen I gene expression. 21 CoQ10 may exert its anti-inflammatory effects by inhibiting the activation of NF-κB and AP-1 (Activator Protein-1). 22 Consequently, CoQ10 can reduce NF-κB activity, thereby decreasing its inhibitory effect on collagen I production.
NAC has been shown to inhibit phosphorylation of NF-κB.23,24 Similar to CoQ10, inhibiting NF-κB activity can increase the production of collagen I mRNA. However, this happens just in combination with EGCG. EGCG has been shown to influence TGF-β signaling, which plays a crucial role in collagen synthesis. By modulating TGF-β pathways, EGCG can affect the expression of collagen I. One of the effects of EGCG is the inhibition of TGF-β signaling pathways. 25
It has been shown that by increasing TGF-β, type I collagen decreases via the transcription factor CUX1. 26 By inhibiting TGF-β, EGCG may indirectly affect collagen I synthesis, potentially through various transcription factors and signaling pathways. However, the specific role of the transcription factor CUX in this context requires further investigation.
Elastin mRNA and matrix elastin production were affected by EGCG and its combination with Retinol and CoQ10. EGCG has increased the mRNA and matrix elastin both. Polyphenols have been shown to promote the coacervation of cell-secreted tropoelastin due to their elastin-binding properties, thereby increasing insoluble elastin in human dermal fibroblasts. 27 EGCG (Epigallocatechin gallate) is a polyphenol. It is a type of catechin, which is a subgroup of flavonoids found in tea, particularly green tea. 28 So, phenol groups in EGCG might be the reason behind the enhancement of matrix elastin when EGCG is present.
CoQ10 increases both elastin mRNA and matrix elastin. CoQ10 can inhibit the activation of NF-κB, 29 which is a transcription factor known to suppress elastin expression under inflammatory conditions. 30 By inhibiting NF-κB, CoQ10 might help reduce the suppression of elastin gene expression. Moreover, CoQ10 is crucial for mitochondrial electron transport and ATP production. 31 Improved mitochondrial function can enhance overall cellular health and support the synthesis of extracellular matrix proteins, including elastin. Furthermore, by increasing ATP levels, CoQ10 supports the cellular processes required for elastin production and assembly.
Retinol presence causes Retinoic Acid Formation. Afterward Retinoic acid binds to retinoic acid receptors (RARs) which are transcription factors. RARs, when activated by retinoic acid, bind to specific DNA sequences called retinoic acid response elements (RAREs) in the promoter regions of target genes. The binding of RARs to these elements can activate or enhance the transcription of genes involved in extracellular matrix production, including elastin. 32
While this study highlights promising synergistic effects between several antioxidants in enhancing elastin and collagen synthesis, these findings are based on in vitro experiments and limited mechanistic inference. The pathways proposed here are derived from known antioxidant activity in the literature but have not yet been directly validated in our system. Further studies using targeted molecular assays and in vivo models will be needed to confirm these mechanisms and evaluate therapeutic efficacy.
The observed synergistic effects of EGCG, CoQ10, Retinol, and NAC highlight the potential for combination therapies in anti-aging skin treatments. These antioxidants are commonly used in topical formulations, and our concentrations were chosen to reflect ranges reported in commercial products and prior research. However, further work is needed to assess the stability, skin penetration, and long-term safety of these combinations in vivo. These findings lay the groundwork for future development of optimized delivery systems, such as nanoparticles or microneedles, to enhance therapeutic outcomes in clinical and cosmetic applications.
Conclusion
This study demonstrates that the combination of EGCG with CoQ10, Retinol, or NAC significantly enhances the production of collagen type I and elastin in human dermal fibroblasts, surpassing the effects of individual antioxidants. These findings suggest that certain antioxidant combinations exert a synergistic effect on extracellular matrix protein synthesis. By comparing both mRNA expression and matrix protein levels, this work provides a more comprehensive understanding of antioxidant action in skin regeneration. These insights may guide future development of effective anti-aging therapies and topical formulations.
Footnotes

Funding
The authors disclosed receipt of the following financial support for the research, authorship, and/or publication of this article: This work was supported by the National Science Foundation under Award No. 2337961. This work also made use of the CytoViva enhanced, high signal-to-noise darkfield optical microscope, which has received support from the Major Research Instrumentation program (NSF MRI- 2116140) at Marshall University. Jada Stutts and Kayla Clatterbuck were supported by NSF S STEM” grant (2030806). Chloe Duckworth was supported in the summer of 2022 by the WV Higher Education Policy Commission, Division of Science and Research under award dsr.20.16 (Summer Undergraduate Research Experiences program).
Declaration of conflicting interests
The authors declared no potential conflicts of interest with respect to the research, authorship, and/or publication of this article.