
Abstract
Background
The lack of a standardized starting cadence for the acceleration phase makes comparing results challenging, in non-elite participants.
Objective
The aim of this study was to determine the impact of different starting cadences on the Wingate Anaerobic Test (WAnT) indices.
Methods
Twenty-four recreationally active males participated in the study. WAnT protocols consisting of different starting cadences of 60 (WAnT60rpm), 80 (WAnT80rpm), 100 (WAnT100rpm), and 120 rpm (WAnT120rpm) were randomly applied on different days. Differences between variables were determined using repeated measures ANOVA (LSD) analysis. An alpha value of p < 0.05 was considered significant. The effect size (ES) was calculated using Cohen's d.
Results
WAnT80rpm trial produced significantly higher peak power output (PPO) in comparison to WAnT100rpm (WAnT80rpm vs. WAnT100rpm = 948 ± 129 W vs. 888 ± 112 W, p = 0.002, ES = 0.50) and WAnT120rpm (WAnT80rpm vs. WAnT120rpm = 948 ± 129 W vs. 878 ± 139 W, p = 0.000, ES = 0.51) trials. The average power output (AvPO) values in the WAnT60rpm and WAnT80rpm trials were significantly higher than those in WAnT100rpm (WAnT60rpm vs. WAnT100rpm = 592 ± 76.4 W vs. 574 ± 76.5 W, p = 0.001, ES = 0.23; WAnT80rpm vs. WAnT100rpm = 589 ± 83.9 W vs. 574 ± 76.5 W, p = 0.007, ES = 0.17) and WAnT120rpm (WAnT60rpm vs. WAnT120rpm = 592 ± 76.4 W vs. 573 ± 85.3 W; p = 0.002, ES = 0.23; WAnT80rpm vs. WAnT120rpm = 589 ± 83.9 W vs. 573 ± 85.3 W, p = 0.007, ES = 0.18).
Conclusions
This study suggests that starting the WAnT test when 60 or 80 rpm reached by recreationally active participants during the acceleration phase may be more suitable to achieve higher peak power and average power outputs. This study emphasizes the need to reconsider the standard starting cadence for the WAnT in anaerobically untrained individuals.
Introduction
The Wingate Anaerobic Test (WAnT) is a valid and reliable protocol for assessing and measuring anaerobic power and capacity.1–3 The WAnT test is conducted on a mechanically braked cycle ergometer, where participants pedal against a load equal to 7.5% of their body mass for 30-s at maximal effort. 4 Traditionally, the WAnT includes a flying start, in which the individual reaches maximum pedal revolutions per minute (rpm) within approximately 5-s before being subjected to the predetermined load (approximately 140–160 rpm).5,6 Although not explicitly stated in the literature, reaching maximum revolutions before applying the load may result in unnecessary energy expenditure. 7 Concerns regarding the validity of the widely used ‘flying start’ methodology continue prompting further investigation worldwide.8,9 Currently, a cadence range of 60–140 rpm is set as the target during unloaded pedaling before the load is released from the basket. 10 Releasing the load to the flywheel when the cadence reaches a certain level during the acceleration phase without load is intended to minimize any associated error in accelerating the flywheel. 11 It is known that maximum power output is achieved at approximately 120 rpm during maximal activation of type II muscle fibers.12–14 Therefore, the most commonly used starting cadence to maximize PPO production ranges between 100 and 120 rpm.15–22 Additionally, it has been suggested that a starting cadence of 70 rpm does not provide a high enough starting cadence to elicit PPO. 20 However, using 100 or 120 rpm as the starting cadence may pose a disadvantage, especially for those who are not anaerobically trained or sedentary. In the unloaded pedaling phase before the WAnT application, the relatively long time taken to reach 100 and 120 rpm starting cadence may increase unnecessary ATP-CrP usage. This could result in lower PPO compared to lower starting cadences (60 or 80 rpm). On the other hand, the use of high starting cadences may lead to a decrease in creatine phosphate earlier during the test and trigger an increase in glycolytic contribution earlier in the test period. Therefore, higher starting cadences may result in lower average power output (AvPO) levels compared to lower starting cadences.
Studies conducted by Robergs et al. 23 and Clark et al. (2018) 8 compared WAnT performance between a flying start model and a stationary start model after pedaling against no resistance as fast as possible for 5 23 and 6 8 seconds, respectively, during the initial unloaded acceleration phase.8,23 Their findings indicated that the flying start produced higher PPO and shorter time to peak power output (tPPO).8,23 In another study by Macintosh et al. (2003), WAnT results were compared between a flying start and a stationary start model established following a 15-s unloaded acceleration phase, demonstrating that the flying start model led to higher PPO values post-test. 17 Lunn et al. (2015) also applied the WAnT using two different initial acceleration phases of 5 s each. 9 Participants began one WAnT application with an all-out flying start, while in another, they started the test pedaling at a steady 80 rpm against a 25-watt load during the acceleration phase. 9 Their research showed that the initial acceleration phase set at 80 rpm in the stationary start model resulted in higher PPO and AvPO compared to the flying start model. 9 Despite evidence suggesting that different starting models can affect anaerobic power indices differently,8,9,17,23 there is currently insufficient scientific evidence specifically examining the effects of different starting cadences before the test begins or before the load is released. Contrary to existing studies in the literature, our research examines the effects of predetermined different starting cadences during the unloaded pedaling phase on anaerobic power and capacity. To the best of our knowledge, our study is the first to investigate the effects of different starting cadences on anaerobic power and capacity by utilizing a model where the flywheel load is released once the predetermined starting cadence is reached during the initial acceleration phase against no resistance.
While the details of the test protocol remain largely unchanged in published literature, there is no standardization for the target starting cadence to be reached during the acceleration phase before the WAnT begins. 9 This lack of standardization contributes to difficulties in comparing results obtained from different laboratories. Determining the extent to which different starting cadences affect recreationally active participants’ indices of anaerobic power and capacity associated with WAnT can add value to the test, particularly in generating normative data. These data highlight the need for scientific investigation into the effects of pre-test pedaling cadence on the accuracy of WAnT results, particularly considering that these effects have been overlooked in the published literature and that numerous practitioners rely on normative WAnT data. Therefore, the aim of this study is to determine the impact of different starting cadences, specifically 60, 80, 100, and 120 rpm, on WAnT indices. In our study, it was hypothesized that our participant group would achieve higher PPO and AvPO levels would be achieved with starting cadences of 80 and 60 rpm compared to 100 and 120 rpm.
Method
Participants
In the G*Power F-test analysis performed to determine the number of volunteers to participate in the study, when effect size (f) = 0.25, type 1 error rate (α) = 0.05, 1-β (power) = 0.80, number of groups = 1, and number of repetitions = 4 were selected, the sample size was found to be 24. Therefore, twenty-four male sports science students who were recreationally active participated in our study (age: 21.1 ± 2.1 year; height: 179 ± 6.4 cm; weight: 69.8 ± 7.1 kg). Participants were instructed to refrain from engaging in vigorous physical activities throughout the measurement period. Our study was approved by the Ethics Committee of the Gendarmerie and Coast Guard Academy (ethics number: 27073192), and participants were informed about the benefits and risks of the research before signing an institutionally approved informed consent form to participate in the study. Experimental procedures were designed and implemented according to the Helsinki Declaration standards. Prior to the research, each participant provided written informed consent after being explained the procedures, potential risks, and benefits of participation in the study.
Design
Participants visited the laboratory five times, with 72-h intervals between visits. During the initial laboratory visit, participants’ body masses were determined. The saddle and handlebar settings of the cycle ergometer were individually adjusted, and familiarization with the WAnT protocol was conducted. Participants were allowed to rest passively for 5-min after completing the warm-up procedure recommended by the Wingate Institute. A pre-acceleration phase was used before the start of the WAnT trials. During this phase, participants were instructed to reach the target starting cadence as fast as possible without any resistance to overcome the flywheel's inertia. Different starting cadences of 60, 80, 100, and 120 rpm were randomly used in each of the four WAnT sessions. All sessions were conducted between 14:00 and 17:00. To minimize daily variations, each participant's test was conducted at approximately the same time each day (±1 h). A total of 4 WAnT sessions were randomly carried out in a cross-over design and completed within a 21-d period.
Warm-up protocol
A standard warm-up procedure was performed in the way recommended by the Wingate Institute. Thus, participants pedaled against a 1 kg load at of ∼ 60 rpm for five minutes on the cycle ergometre, and during the last 5-s of the 3rd, 4th and 5th minutes of the five minute pedaling, they pedaled at maximum speed against a 2 kg load. 11 All athletes completed a standardized warm-up before the WAnT protocol. Then, participants rested passively for 5-min following the standardized warm-up.
The WAnT protocol
The saddle height, angle, handlebar height, proximity to the saddle, and other necessary adjustments of the cycle ergometer were optimized for each participant and recorded. Before each WAnT application, the saddle height, angle, handlebar height, and proximity to the saddle were checked to ensure they were suitable for the participants. Test load corresponding to 7.5% of body weight was calculated for each participant before the test and prepared by placing them in the load basket of the cycle ergometer. Just before starting the WAnT, all participants were instructed to pedal with maximal effort from the beginning to the end of the test. 24
Participants completed a total of 4 WAnT interventions with a 72-h interval between each session. In these four WAnT applications, the starting cadences required to release the test load from the basket differed from one another. These starting cadences were set at 60, 80, 100, and 120 rpm levels, and these 4 different WAnT sessions were named WAnT60rpm, WAnT80rpm, WAnT100rpm, and WAnT120rpm respectively. The order of the tests was randomized. A pre-acceleration phase was used before the start of each of the four WAnTs. During this phase, participants were instructed to pedal as fast as possible without any resistance in order to overcome the flywheel's inertia and reach the target caddence. Once the target starting cadence was achieved during pre-acceleration phase, the test load was applied to the system, and data collection commenced immediately. 25 They then pedaled maximally against this load for 30-s. Participants pedaled in a seated position throughout the test to avoid any effect of postural change. 26 To ensure maximal effort performance during the test, participants were verbally encouraged by the researchers throughout the test. 24 After completing the WAnT protocol, participants pedaled unloaded for a 5-min active cooldown period.
Two parameters related to the assessment of anaerobic performance were obtained from the WAnT test: i) PPO, representing anaerobic power, which is the highest mechanical power output achieved during the test, and ii) AvPO, representing anaerobic capacity, which is the AvPO over the 30-s period. PPO and AvPO were automatically calculated using the cycle ergometer's software (Anaerobic Test Software; Monark Exercise)
Statistical analysis
The normality of the data was assessed using the Shapiro-Wilk test. Differences between variables were determined using repeated measures ANOVA (LSD) analysis. An alpha value of p < 0.05 was considered significant. The effect size of the differences was calculated using Cohen's d. The effect sizes were categorized as no effect (0–0.2), small effect (0.2–0.5), medium effect (0.5–0.8), and large effect (>0.8). Bland-Altman plot with 95% limits of agreement (LoA) was used to measure agreement between WAnT80rpm and WAnT60rpm, WAnT100rpm, and WAnT120rpm. 27 Whether the mean differences (Bias) obtained from the Bland-Altman analyses differed from zero was determined using a one-sample t-test.
Results
Peak power output
The PPO values varied significantly across conditions (F(3, 69) = 5.50, p = 0.002). While WAnT80rpm trial produced significantly higher PPO in comparison to WAnT100rpm trial (WAnT80rpm vs. WAnT100rpm = 948 ± 129 W vs. 888 ± 112 W, p = 0.002, ES = 0.50) and WAnT120rpm (WAnT80rpm vs. WAnT120rpm = 948 ± 129 W vs. 878 ± 139 W, p = 0.000, ES = 0.51) trials, the WAnT60rpm trial resulted in significantly higher PPO only compared to WAnT120rpm (WAnT60rpm vs. WAnT120rpm = 924 ± 134 W vs. 878 ± 139 W, p = 0.045, ES = 0.33) (Figure 1A-1B). Bland-Altman results for PPO showed narrow LoA (−154 to 202 W) and low bias (bias = 24 ± 90.8 W; P = 0.208) between WAnT80rpm and WAnT60rpm only (Figure 2).
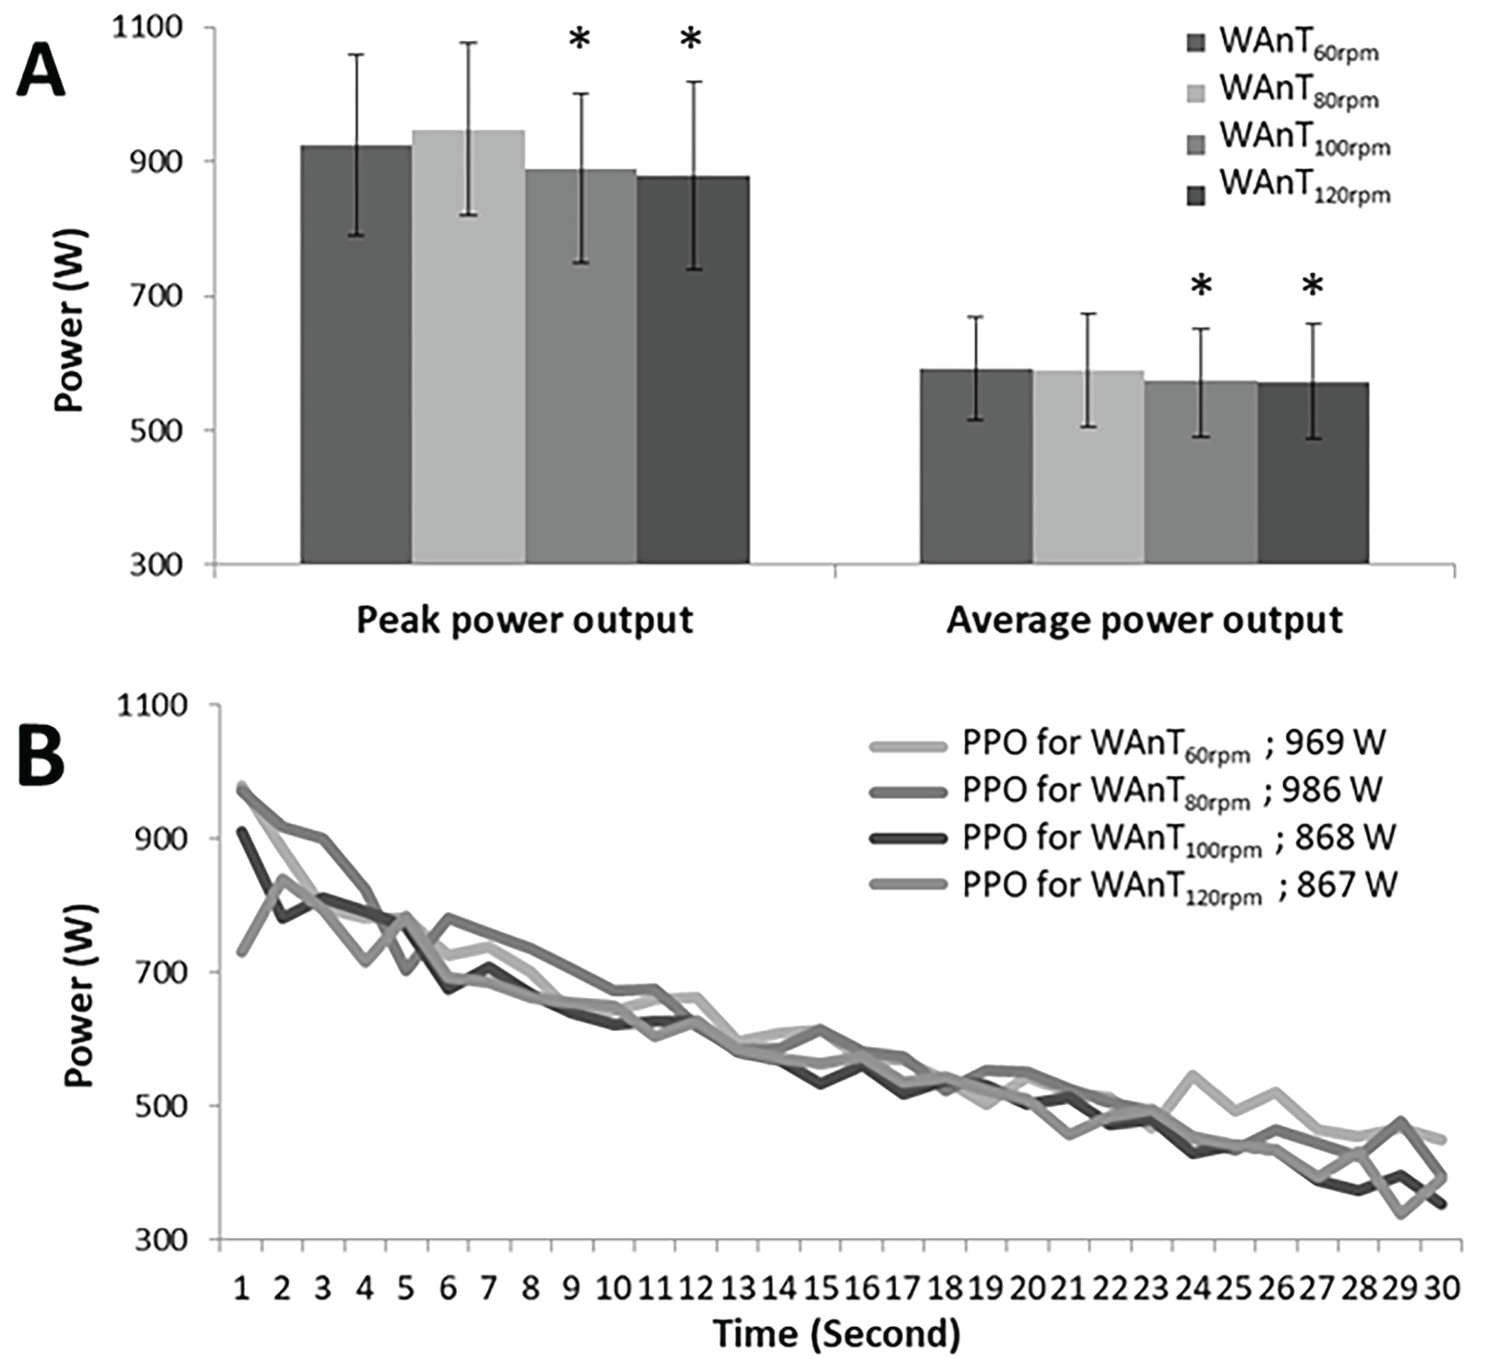
A) Effects of different starting rpm on the wingate test performance indice. B) Power data over time obtained from Wingate all-out tests belonging to participant #23. Data are mean ± SD. *Statistically significantly lower power output than WAnT80rpm protocol (p < 0.05).
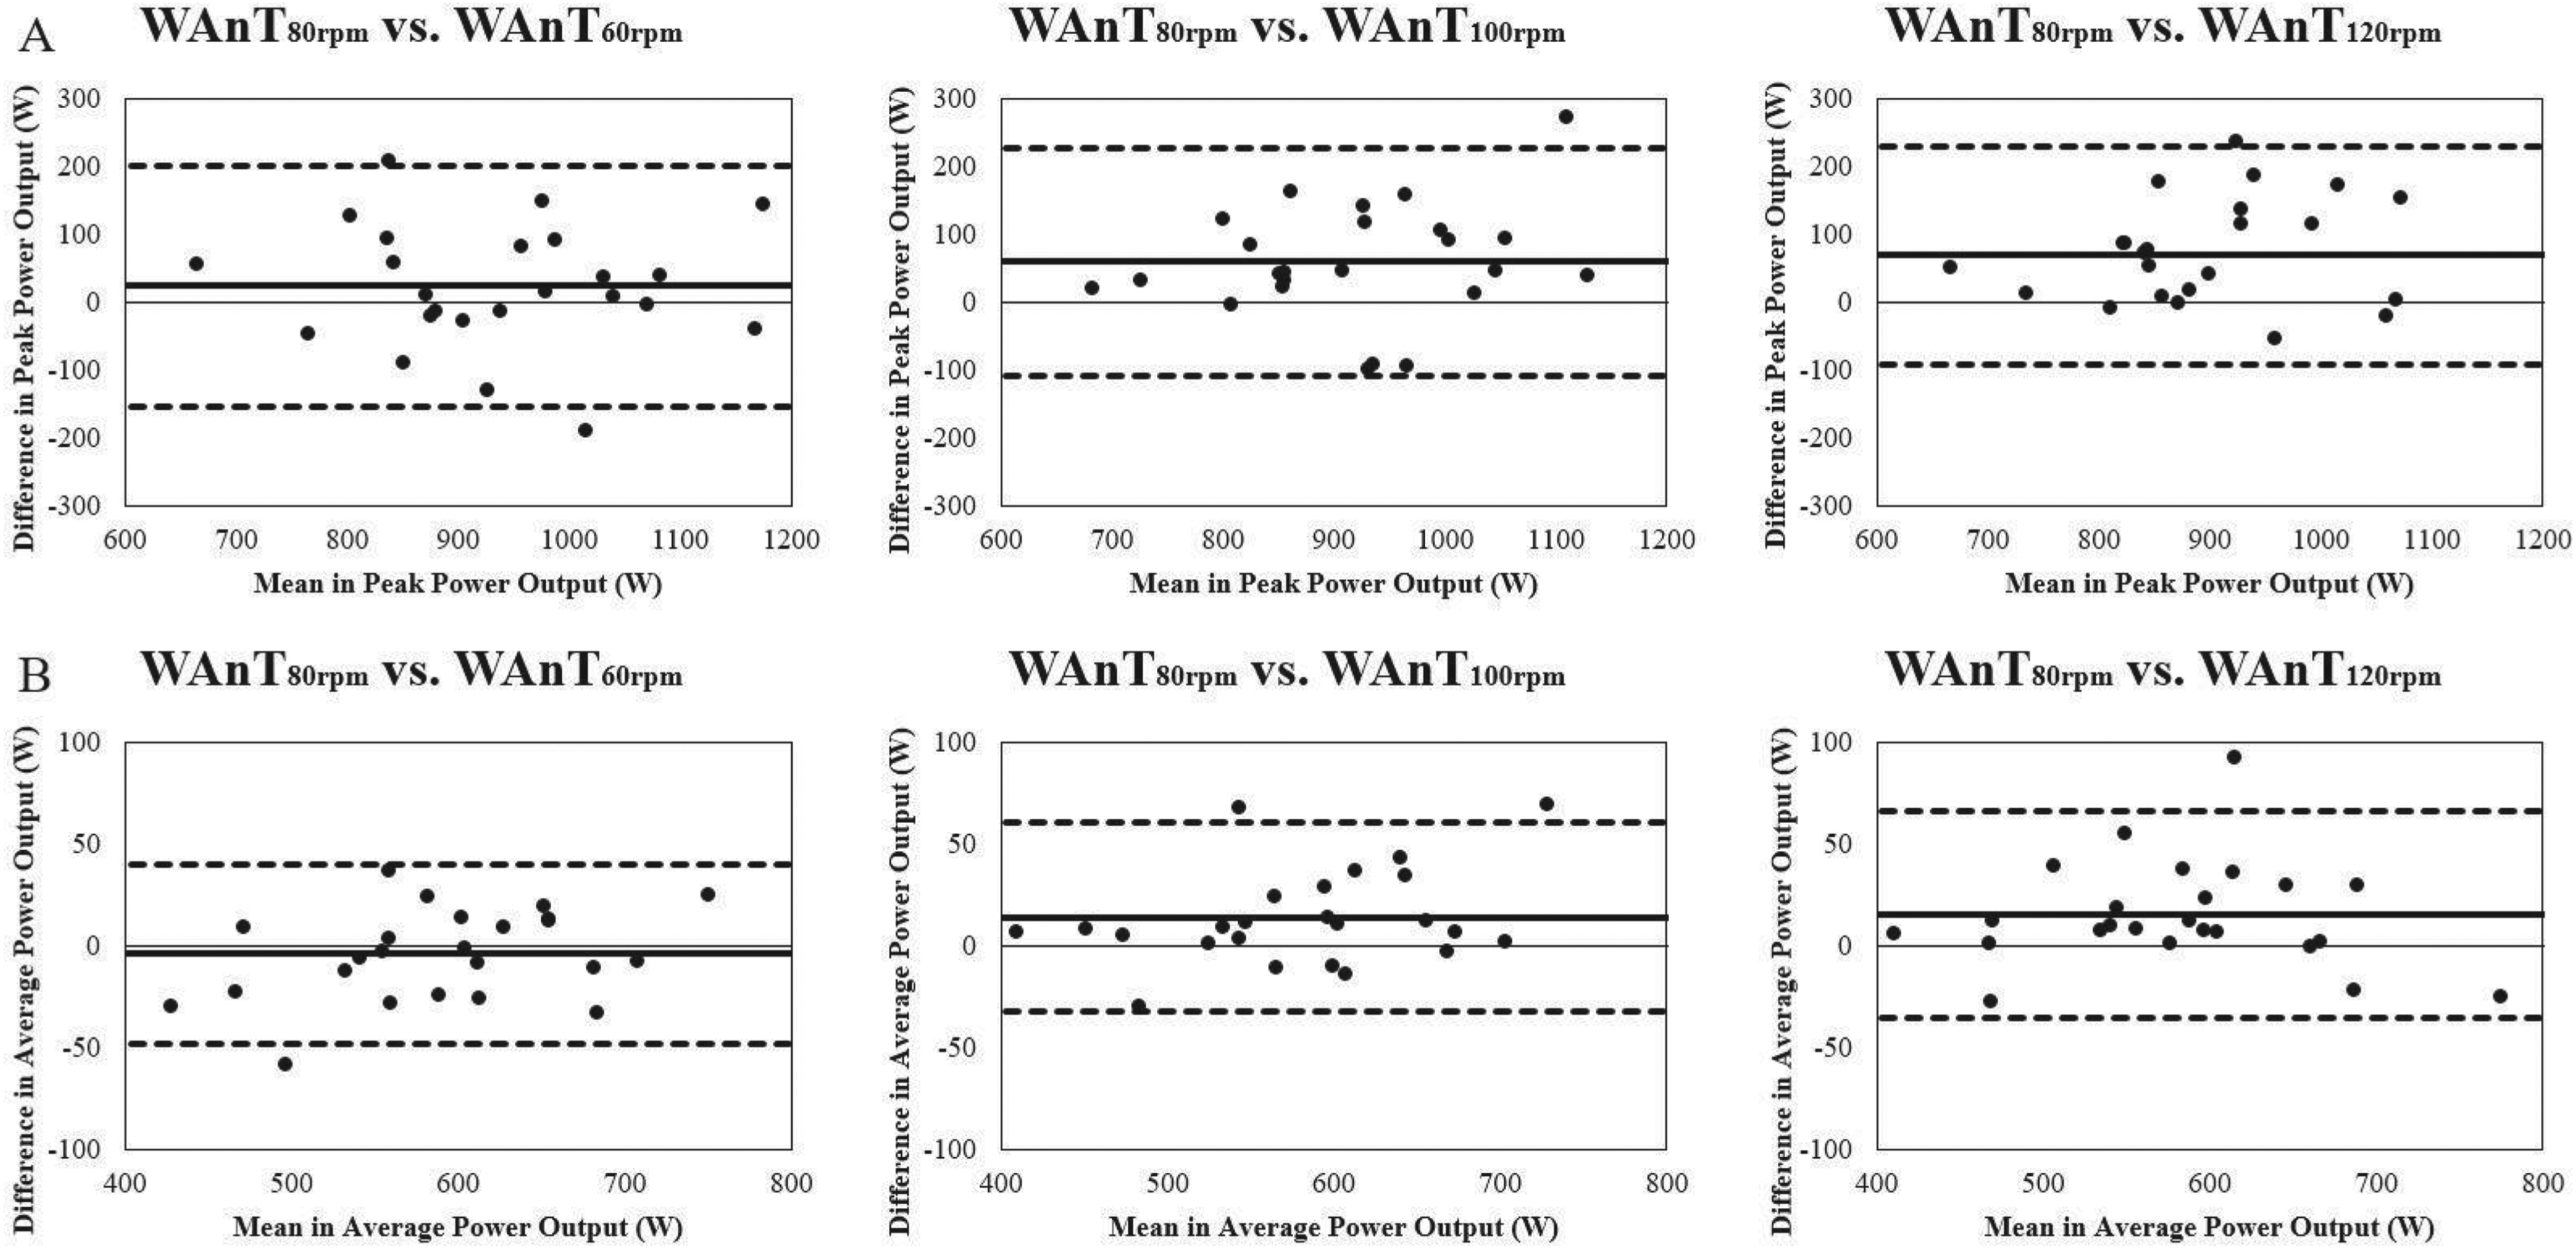
Bland-Altman plot of limits of agreement between WAnT60rpm, WAnT100rpm, and WAnT120rpm trials compared to the WAnT80rpm trial. In the Bland-Altman plot panel, the thin straight line represents zero, the thick straight line represents the mean difference between the two measurements, and the dotted lines represent the 95% limits of agreement between measurements. Abbreviations: A) plot of peak power output parameter obtained from WAnT60rpm, WAnT100rpm, and WAnT120rpm trials against WAnT80rpm, B) plot of average power output parameter obtained from WAnT60rpm, WAnT100rpm, and WAnT120rpm trials against WAnT80rpm.
The AvPO values significantly differed across the conditions (F(3, 69) = 6.50, p = 0.001). The AvPO values in the WAnT60rpm and WAnT80rpm trials were significantly higher than those in the WAnT100rpm trial (WAnT60rpm vs. WAnT100rpm = 592 ± 76.4 W vs. 574 ± 76.5 W, p = 0.001, ES = 0.23; WAnT80rpm vs. WAnT100rpm = 589 ± 83.9 W vs. 574 ± 76.5 W, p = 0.007, ES = 0.17) and WAnT120rpm (WAnT60rpm vs. WAnT120rpm = 592 ± 76.4 W vs. 573 ± 85.3 W; p = 0.002, ES = 0.23; WAnT80rpm vs. WAnT120rpm = 589 ± 83.9 W vs. 573 ± 85.3 W, p = 0.007, ES = 0.18). Bland-Altman results for AvPO showed low LoA (−47.7 to 40 W) and low bias (bias = −3.82 ± 22.4 W; P = 0.411) between WAnT80rpm and WAnT60rpm only (Figure 2). The Bland-Altman results for PPO and AvPO are shown in Table 1 and Figure 2.
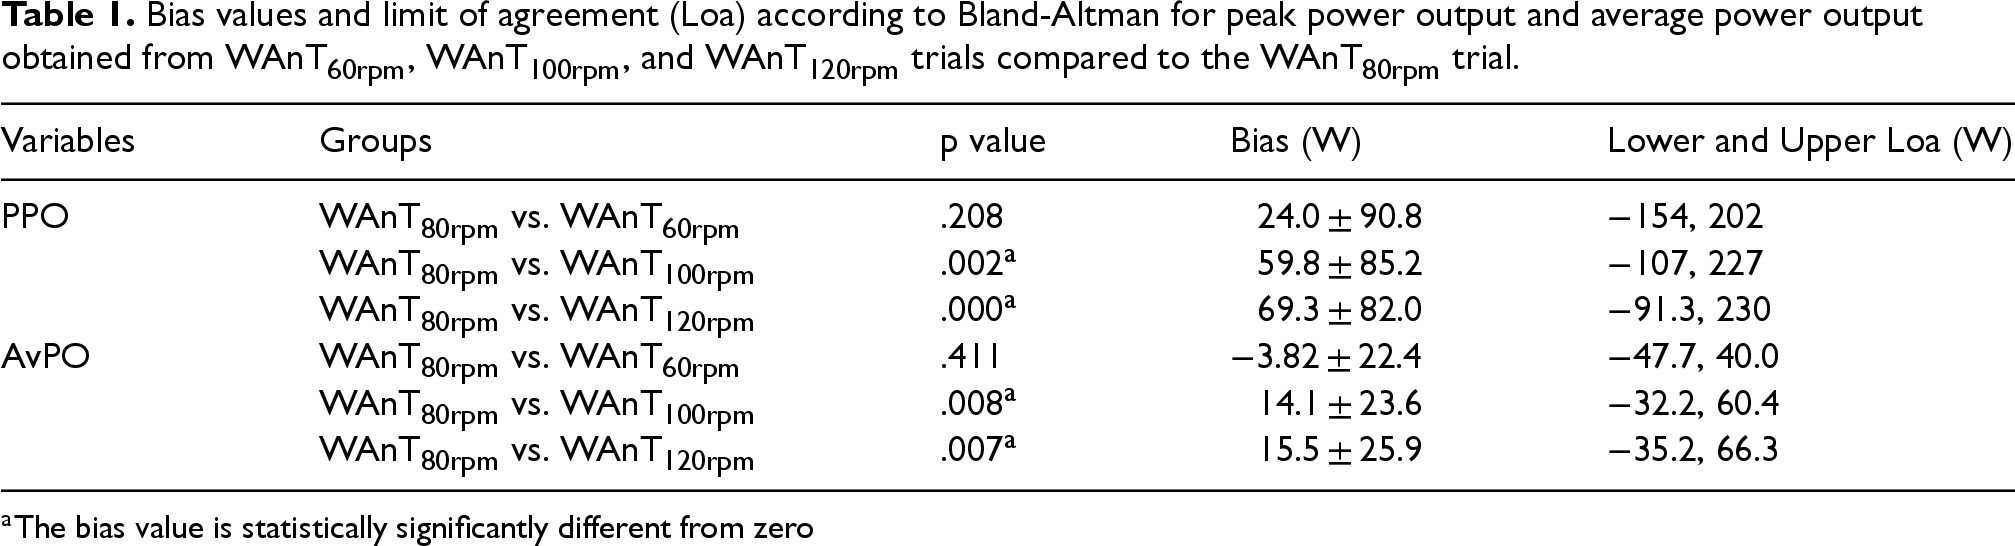
Bias values and limit of agreement (Loa) according to Bland-Altman for peak power output and average power output obtained from WAnT60rpm, WAnT100rpm, and WAnT120rpm trials compared to the WAnT80rpm trial.
Bias values and limit of agreement (Loa) according to Bland-Altman for peak power output and average power output obtained from WAnT60rpm, WAnT100rpm, and WAnT120rpm trials compared to the WAnT80rpm trial.
The bias value is statistically significantly different from zero
The aim of our study was to determine the extent to which different starting cadences affect power indices associated with anaerobic power and capacity obtained from the WAnT application. Our main results indicate that different starting cadences affected PPO and AvPO values. Compared to WAnT100rpm and WAnT120rpm, the WAnT60rpm and WAnT80rpm protocols yielded 4–8% higher PPO values and 3–4% higher AvPO values. We conducted Bland-Altman analyses for the PPO and AvPO parameters obtained from four different WAnT protocols, and the Bland-Altman results support these significant differences. According to the Bland-Altman results, the WAnT80rpm protocol showed high agreement with the WAnT60rpm protocol, while the WAnT100rpm and WAnT120rpm protocols exhibited lower agreement with the WAnT80rpm protocol. Our results confirm the hypothesis that higher PPO and AvPO levels would be achieved with WAnT60rpm and WAnT80rpm starting cadences compared to WAnT100rpm and WAnT120rpm. Given that power is a function of force and angular velocity (cadence) during higher speed cycling, a higher pedal caddence for the flying start is expected to result in larger power values directly.8,28 Contrary to this, Lunn et al., (2015) found that PPO and AvPO were lower for the WAnT when initiated with an ‘all-out’ flying start compared to a moderate cadence set at 80 rpm. Similarly, in our study, the lower PPO and AvPO obtained in WAnT100rpm and WAnT120rpm may be due to increased muscle fatigue during the acceleration phase before the start of WAnT. The longer duration required to reach high cadence levels during WAnT100rpm and WAnT120rpm interventions compared to WAnT60rpm and WAnT80rpm interventions may explain higher muscular fatigue. Studies have observed higher tissue oxygenation and lower blood lactate concentrations at a cadence of 60–80 rpm compared to cadences above 100 rpm during steady-state submaximal cycling. These results suggest that higher cadence submaximal cycling requires greater involvement of glycolytic type II muscle fibers. Molina and Denadai (2011) supported these results, observing slower oxygen uptake during fast cycling (100 rpm) compared to slow cycling (50 rpm), indicating that type II fibers are more engaged during high-cadence cycling. 29 Additionally, it is well established that type I muscle fibers are more efficient than type II fibers. 30 It shows that type II fibers require more ATP hydrolysis per unit of force production. Therefore, selecting 100 or 120 starting rpm levels during the unloaded pedaling phase before WAnT is likely to recruit more type II muscle fibers. As a result, the accumulation of acidosis due to proton release, which stems from increased ATP hydrolysis and the conversion of pyruvate to lactate during glycolytic processes, 31 may lead to a reduction in power output. Another possible reason could be that initiating the cadence at 100 or 120 rpm may have restrained muscle force development because of the inverse relationship between muscle contraction velocity and force. Dorel et al., (2010) demonstrated that, in untrained active participants during 5-s all-out sprints, the time spent in the 30–150 degree angular range, where the highest force is produced, was the longest at 80 rpm, followed by 117 rpm, and the shortest at 170 rpm. 32 In order to enhance motor unit recruitment and facilitate force production, it is required to decrease the cadence, thus allowing adequate time for the generation of muscle contraction force. 23 In fact, starting cadences of 100 and 120 rpm are known as the most ideal starting cadences to generate PPO. However, on condition that our participant group had been anaerobically trained, our study could have provided different results. Samozino et al., (2007) found that in individuals who are not specialists in sprint cycling, muscle coordination limits power production at pedaling rates above 120 rpm. 18 Other research groups also suggest that in anaerobically untrained participants, mechanical efficiency deteriorates at high cadence rates. For example, Dorel et al., (2010) showed that in untrained active participants during 5-s all-out sprints, the mechanical effectiveness index (total effective force/total force) on the left pedal was 70% at 80 rpm, 49% at 117 rpm, and 33% at 170 rpm. 32 Additionally, the total effective force was found to be 702 N at 80 rpm, 602 N at 117 rpm, and 210 N at 170 rpm. Furthermore, it has been shown that sprint cycling specialists generate higher maximum power by pedaling at faster rates. 33 Nevertheless, there is no widely accepted method to evaluate an appropriate starting cadence based on participants’ individual performance characteristics. 20 The target starting cadence to be reached during the acceleration phase before the start of the test may vary in metabolic and mechanical effects. Therefore, the use of 100 or 120 rpm during the acceleration phase where unloaded resistance is used may lead to lower PPO and AvPO in our anaerobically untrained group. No previous study has compared the effects of a start model that initiates the test as soon as a predetermined cadence level is reached in the unloaded acceleration phase using different starting cadences on anaerobic power indices. Hence, we will discuss our starting model by comparing it with stationary start and flying start models. Macintosh et al., (2003) showed, in their first study questioning the Flying start model used in the original wingate test, that the PPO value was higher in the stationary start model compared to the traditional flying start model. 17 Robergs et al., (2015), on the contrary, obtained %10 higher PPO and 6-s shorter tPPO value in the traditional flying start model compared to the stationary start model. 23 When WAnT results obtained from flying start and stationary start were compared, Clark et al., (2018) obtained similar AvPO values, while up to %23 higher PPO and up to 10-s shorter tPPO were obtained in WAnT application with flying start in advanced resistance-trained males. 8 In the studies conducted by Robergs et al. (2015) and Clark et al. (2018), a 5-s 23 and 6-s 8 acceleration phase was employed in the flying start model, whereas Macintosh et al. (2003) may have achieved different results as they utilized an acceleration phase of up to 15 s 17 . In general, in studies comparing stationary start and flying start models, it is observed that the acceleration phase without load in the flying start application is an important component in achieving higher peak power and reaching peak power in a shorter time. Indeed, the contribution of creatine phosphate hydrolysis is only supported for the first few seconds of ‘all-out’ exercises, and it is accepted that the best way to represent the PPO is the first 5-s. 34 Then, glycolysis increases and oxidative phosphorylation also becomes more dominant towards the end of the test. The stationary start model may not provide a realistic assessment of PPO because tPPO is often much longer than 5-s.8,34 On the other hand, in the test process of flying model that starts with the participant reaching maximum speed (140–160 rpm) before the load is applied, it is interpreted that the time until the maximum speed is reached may be an unnecessary waste of energy. 7 Therefore, a starting model that begins when reaching lower rpm levels becomes more important rather than one based on reaching maximal cadence. In our study, we conducted WAnT interventions using different starting rpm levels commonly used in the literature. Previous research consistently demonstrates that the optimal cadence for developing maximum mechanical power lies between 100 and 120 rpm.15–18 However, starting the WAnT test appears to be less successful in obtaining recreationally active participants’ actual peak power and AvPOs when 100 or 120 rpm reached during the acceleration phase. Therefore, our study suggests that starting the WAnT test when 60 or 80 rpm reached by participants during the acceleration phase may be more suitable to achieve higher peak power and AvPOs.
Limitations
The study was conducted exclusively with recreationally active male participants, which may limit the generalizability of the results to a broader population, particularly women and different age groups. The fact that participants were recreationally active suggests that the results may differ when compared to professional athletes, and thus, the results may not be applicable to professional athletes. It should also be noted that our participant group was not familiar with the WAnT protocols prior to the study. Although a familiarization session was conducted to minimize learning effects, it is possible that these effects were not entirely eliminated. Additionally, despite randomization of the order of WAnT protocols, learning effects may still have influenced the results of each session.
Conclusions
The starting model used for the WAnT test should consider the starting cadence levels that could affect participants’ performance. Specifically, commencing the test at lower RPM levels might be more suitable for recreationally active or anerobically untrained groups. Our study suggests exploring the examination of predetermined different starting cadences for the WAnT test as the starting model, including stationary and flying start models. Understanding how these models affect anaerobic power and capacity indices is important. Future studies should comprehensively examine the effects of the starting model for the WAnT test on different athlete groups and training levels. Finally, developing guiding protocols to standardize the starting model for the WAnT test and ensuring consistency across laboratories are essential. This will facilitate easier comparison of results in future researches.
Footnotes
Acknowledgments
The authors would like to express their sincere gratitude to all the participants who generously contributed their time and effort to this study. Without their valuable participation, this research would not have been possible.
Ethical considerations
This study was approved by the Ethics Committee of Gendarmerie and Coast Guard Academy (ethics number: 27073192) on March 7, 2024. All participants provided written informed consent prior to enrollment in the study. This research was conducted ethically in accordance with the Declaration of Helsinki.
Author contributions/CRediT
Performance of Work: Onur Demirarar and Refik Çabuk
Interpretation or Analysis of Data: Refik Çabuk and Onur Demirarar
Preparation of the Manuscript: Refik Çabuk and Onur Demirarar
Revision for Important Intellectual Content: Onur Demirarar and Refik Çabuk
Supervision: Refik Çabuk and Onur Demirarar
Funding
The author(s) received no financial support for the research, authorship, and/or publication of this article.
Conflicting interests
The author(s) declared no potential conflicts of interest with respect to the research, authorship, and/or publication of this article.
Correction (May 2025):
This article has been updated with some decimal points in Table 1 and symbols in Figure 1 as well as Refik Çabuk’s institutional affiliation since its original publication.