
Abstract
Background
In the triple jump event, the explosive power, coordination, and specialized performance of lower limb muscles are key factors determining athletes’ performance. However, traditional high load resistance training has limitations in improving athletes’ lower limb coordination and sustained explosive power.
Objective
The main purpose of the study is to investigate the training effect of low-load resistance combined with single-leg pressurized exercise method on athletes’ lower limb muscle explosive power, coordination, and special performance.
Method
For the study, twenty male triple jumpers were enlisted and split into ten-person experimental and control groups at random. The training effects of conventional single-leg high load resistance training and low-load resistance mixed with single-leg compression training were compared using the experimental approach. The experimental duration was 8 weeks. Before and after the experiment, the athletes’ lower limb muscle circumference, body composition, lower limb dynamic balance ability, isokinetic strength, counter movement jump, one repetition maximum squats, key performance indicators of lower limb explosive power, and triple jump special scores were tested.
Results
After an eight-week training period, the experimental group showed significantly greater improvement than the control group across key performance metrics. Specifically, the experimental group showed superior gains in lower limb muscle circumference, dynamic balance, isokinetic peak torque, and maximum power in the countermovement jump (p < 0.05). Furthermore, their 1RM squat strength and triple jump performance were also significantly enhanced.
Conclusion
It shows that the low-load resistance combined with single-leg pressurization exercise method can effectively improve the athletes’ lower limb explosive power, coordination, and special performance. This provides a reliable lower limb explosive power training program for athletes and coaches.
Introduction
Triple jump is a kind of high difficulty sport, which requires athletes to have strong lower limb explosive power (LLEP), and be able to precisely control the direction and power to ensure that the jump reaches the maximum distance. Therefore, triple jump athletes need to adopt effective single-leg strength training to enhance the LLEP.1–3 The traditional training method is single-leg high load resistance training. This method can enhance the athlete's muscle mass and promote the use of fast muscle fibers, which in turn enhances single-leg lower limb strength. 4 However, single-leg high-load resistance training usually requires a large load and therefore a long recovery time, limiting the athletes’ training frequency and training volume. At the same time, high-load resistance training puts more stress on joints and soft tissues. This can easily lead to joint wear and tear, soft tissue injury, and other problems that affect athletes’ long-term health and sports performance.5,6 In recent years, pressurization training is widely used in athletes LLEP training. Pressure training, also known as blood flow restriction training, is a method of restricting muscle blood flow to achieve better training results. This training method was first proposed in Japan. 7
Scholars at home and abroad have conducted extensive research on pressure training: J. Hou et al. proposed a method of combining outdoor resistance training with pressure training. The results showed that the experimental group's basketball players’ jumping ability improved significantly, while the control group showed no significant changes. This confirmed that this combined training played an important role in improving college basketball players’ lower-limb explosive power. 8 W. Li et al. designed a four-week pressure training program for taekwondo athletes and found that their jumping ability, knee muscle function, and kicking skills significantly improved. Additionally, muscle fibers increased and transferred to type II. 9 C. Bahamondes, Avila, et al. compared the effects of partial pressure training and high-intensity strength training. They found that partial pressure training led to a more significant improvement in reverse jumping performance, while high-intensity strength training led to a more significant improvement in squat jumping performance. 10 Although existing research has confirmed the positive effect of pressure training on improving lower limb explosiveness, there are shortcomings such as short training cycles and a single evaluation dimension. In addition, relevant studies have shown that pressure training can achieve similar effects to traditional high-intensity training with 80% one repetition maximum (1RM) under a maximum single weight (1RM) load of 30%. Moreover, the recovery time is shorter, which can improve training efficiency. 11
Relevant studies have shown that pressurized training can produce similar effects to conventional 80% 1RM high-intensity training with the application of a load of about 30% 1RM. Meanwhile, compared with conventional high resistance, pressurized training had shorter recovery time, which significantly improved the training efficiency while ensuring the training effect. However, previous studies rarely practiced pressurized training in conjunction with low-load resistance training methods. 12 For this reason, the study takes male triple jump athletes as the research object, and adopts the low-load resistance combined with single-leg pressurization training method to train the EG athletes. At the same time, the traditional single-leg high load resistance training is used to compare with it. Through the experimental comparison method, the athletes are provided with effective LLEP training methods to improve the strength quality and special performance of triple jump athletes. The research hypothesis is that compared with traditional high load resistance training, low load resistance combined with single leg pressure training will have a greater improvement on the explosive power and athletic performance of triple jump athletes. The innovation of the research lies in two aspects. First, it combines low load resistance with single-leg compression training. This provides triple jump athletes with a solution that offers low joint load and high training efficiency. Secondly, the system evaluated the comprehensive impact of this training mode on specific performance through comprehensive testing indicators. It especially assessed its potential value in correcting lower limb strength imbalance and improving dynamic coordination.
Research target
The research subjects selected 20 male triple jump athletes with about 5 years of training experience. The study randomly divided 20 athletes into two groups in a 1:1 ratio using computer-generated random number sequences. To ensure allocation concealment, the grouping results were placed in opaque sealed envelopes and assigned by an independent researcher. Because of the nature of training interventions, it was not possible to blind athletes and coaches. However, all personnel involved in data testing and analysis remained blinded to the grouping of athletes.
Research method
Documentation method
During the literature collection process, the subject keywords used in the study included “men's triple jump”, “LLEP”, “pressurization training “, “pressurization training”, and “resistance training”. The search databases included Springer, Elsevier, and China National Knowledge Infrastructure. When performing literature screening, the study focused on the relevant literature that contained one of the above keywords in the title and abstract, and the relevant literature was analyzed in detail.
Experimental method
Basic experimental setup
The experimental site was the physical training gym of a sports academy, and the athletes received training three times a week, on Tuesdays, Thursdays, and Saturdays. The study used B STRONG brand pressure training tape (medical grade nylon composite cuff, width of 12.7 cm (5 inches)) to intervene in the experimental group, and fixed pressure method was used to intervene in the experimental group. Before each training session, the cuff should be positioned snugly against the upper thigh of the athlete's training leg. Using the accompanying pressure pump, the pressure inside the cuff should be evenly inflated to 150 mmHg. The selection of this absolute pressure value was mainly based on two reasons. First, it was ensured that all subjects in the experimental group received standardized and uniform training stimuli. Second, this pressure value referred to previous studies that confirmed its safety and effectiveness in the athlete population. 13 The assembly position diagram is shown in Figure 1.

Schematic diagram of assembly position of pressure training belt.
Basic information for athletes
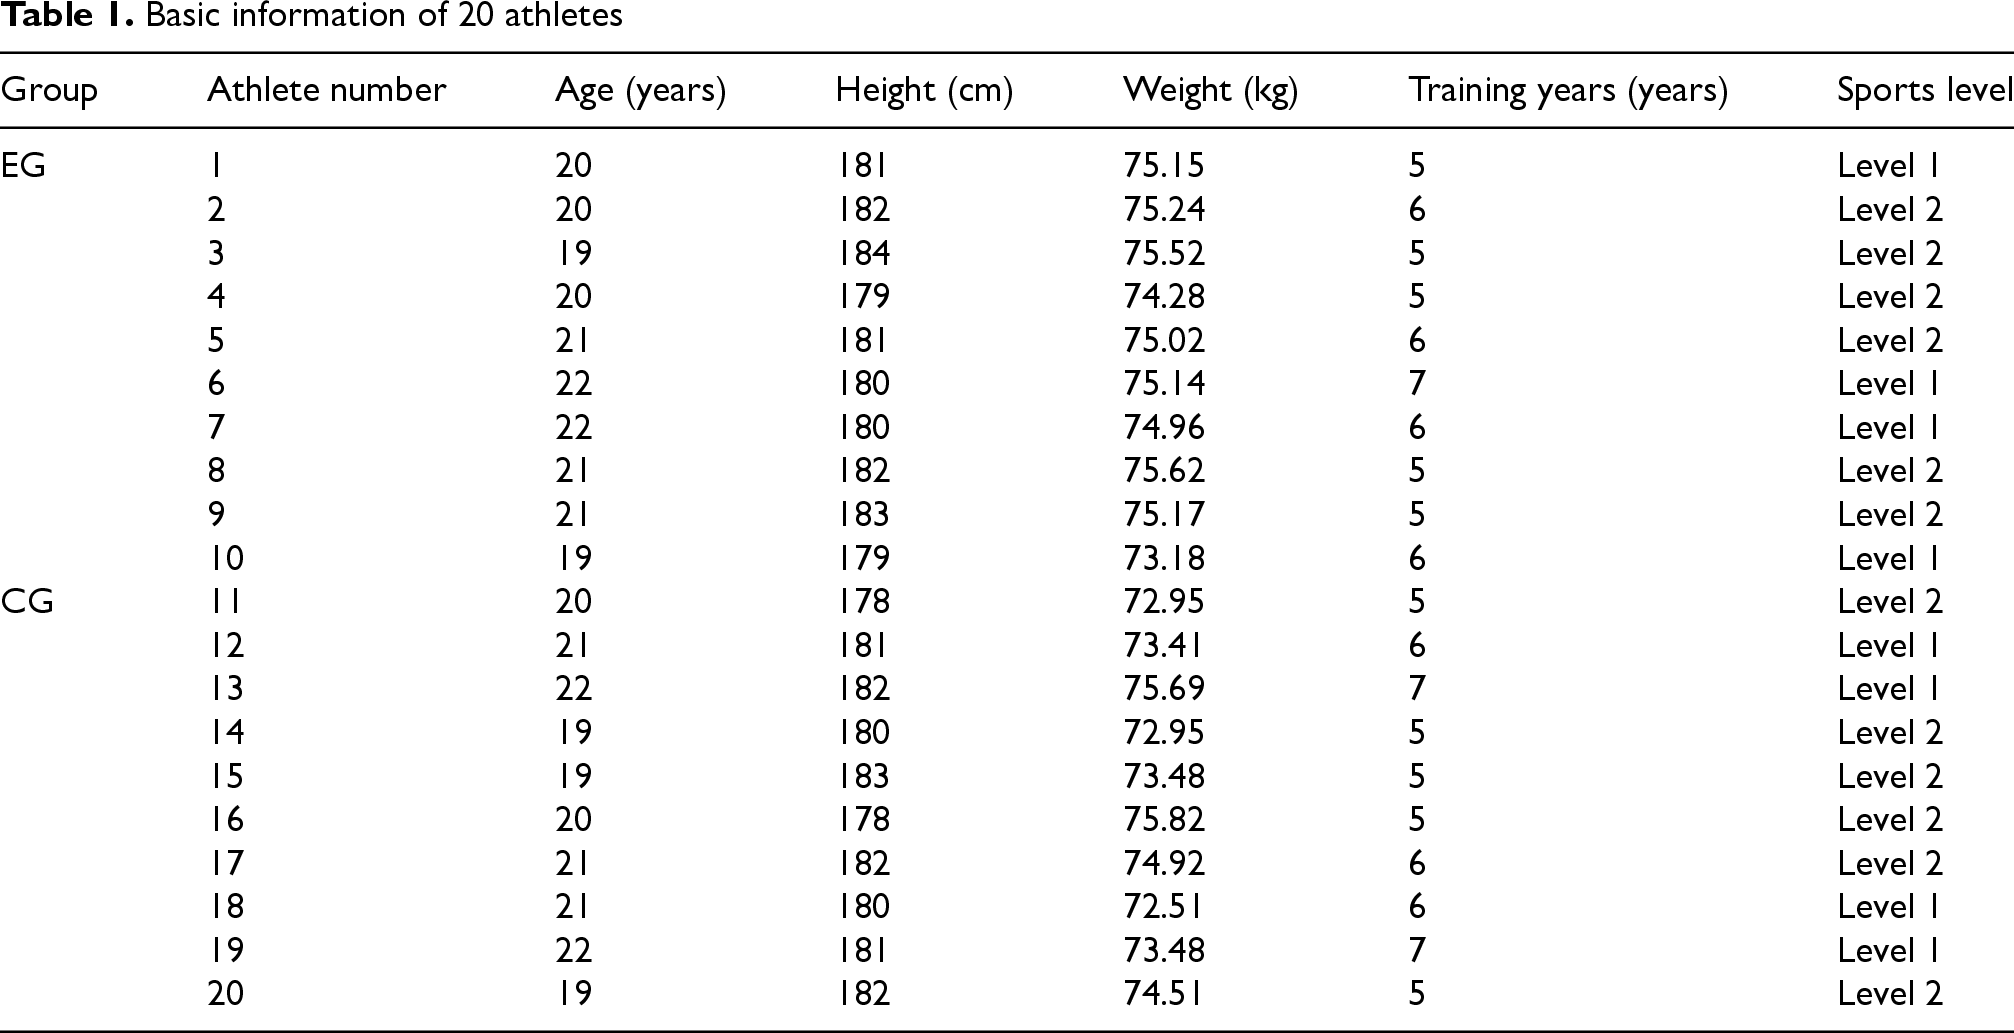
The study mainly used the experimental method to test the effects of different training programs on the LLEP of male triple jump athletes, and to compare whether there were statistically significant differences in the relevant indexes before and after the experiment. It was hypothesized that single-leg pressurization combined with low-intensity resistance training would have the best effect on the athletes’ LLEP. In the process of recruiting experimental subjects, it was necessary to screen the athletes’ physical health status. Thirty male triple jump athletes were finally selected as experimental subjects. The basic information of the athletes was collected before the experiment, and they were randomly grouped by drawing lots, with 10 people in each group. Table 1 displays the fundamental data for 20 athletes.
Basic information of 20 athletes
Design of training programs for two groups of athletes
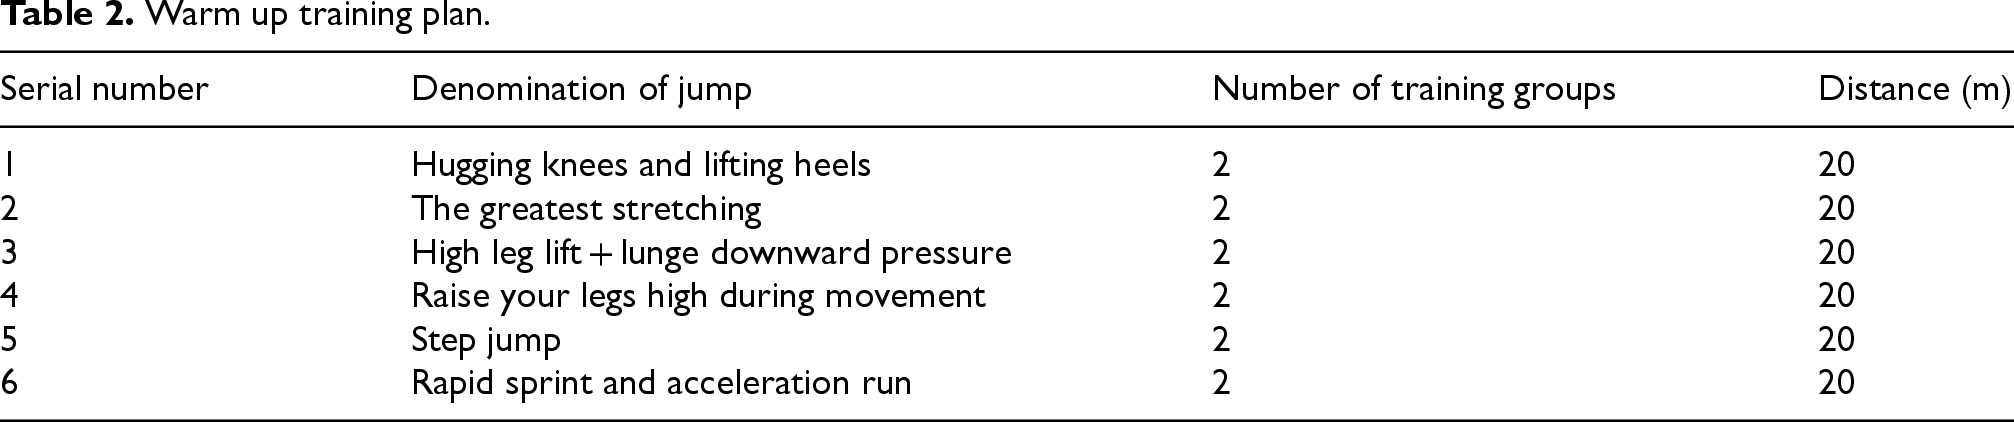
During the experiment, the EG received low-load resistance combined with single-leg pressurization training, and the CG received traditional unilateral resistance training. Before the training, a unified warm-up activity was required. The specific warm up training plan is shown in Table 2.
Warm up training plan.
The specific training program of the EG is shown in Figure 2. The training of the EG consisted of three phases, namely, the adaptation phase, the basic reinforcement phase, and the consolidation phase. Among them, the training movements in both the adaptation phase and the consolidation phase were the same. In the basic strengthening phase, the pressurized single-leg continuous jumping hurdle was replaced by pressurized single-leg jumping hurdle. In the adaptation phase, the number of training groups was 4, and the interval between groups was 60 s. In the basic strengthening phase, the number of training groups was 5, and the interval was 45 s. In the consolidation phase, the number of training groups was 6, and the interval was 30 s. The pressurized pressure of each group was 150mHg, and the percentage of training load 1RM was 30%. The rhythm control for each training action was centripetal contraction for 1 s and centrifugal contraction for 2 s. During the inter group rest period, the pressure band of the experimental group remained inflated and only deflated after completing all training groups. The training load was evaluated weekly and gradually adjusted based on the 1RM test results of the athletes. The training compliance rate of all athletes was 100%, and the subjective fatigue level (RPE) of each athlete was recorded during the training period. The average RPE of the experimental group was 7.5 ± 0.8, while that of the control group was 8.2 ± 0.6. No adverse events related to training were reported throughout the entire experimental period.
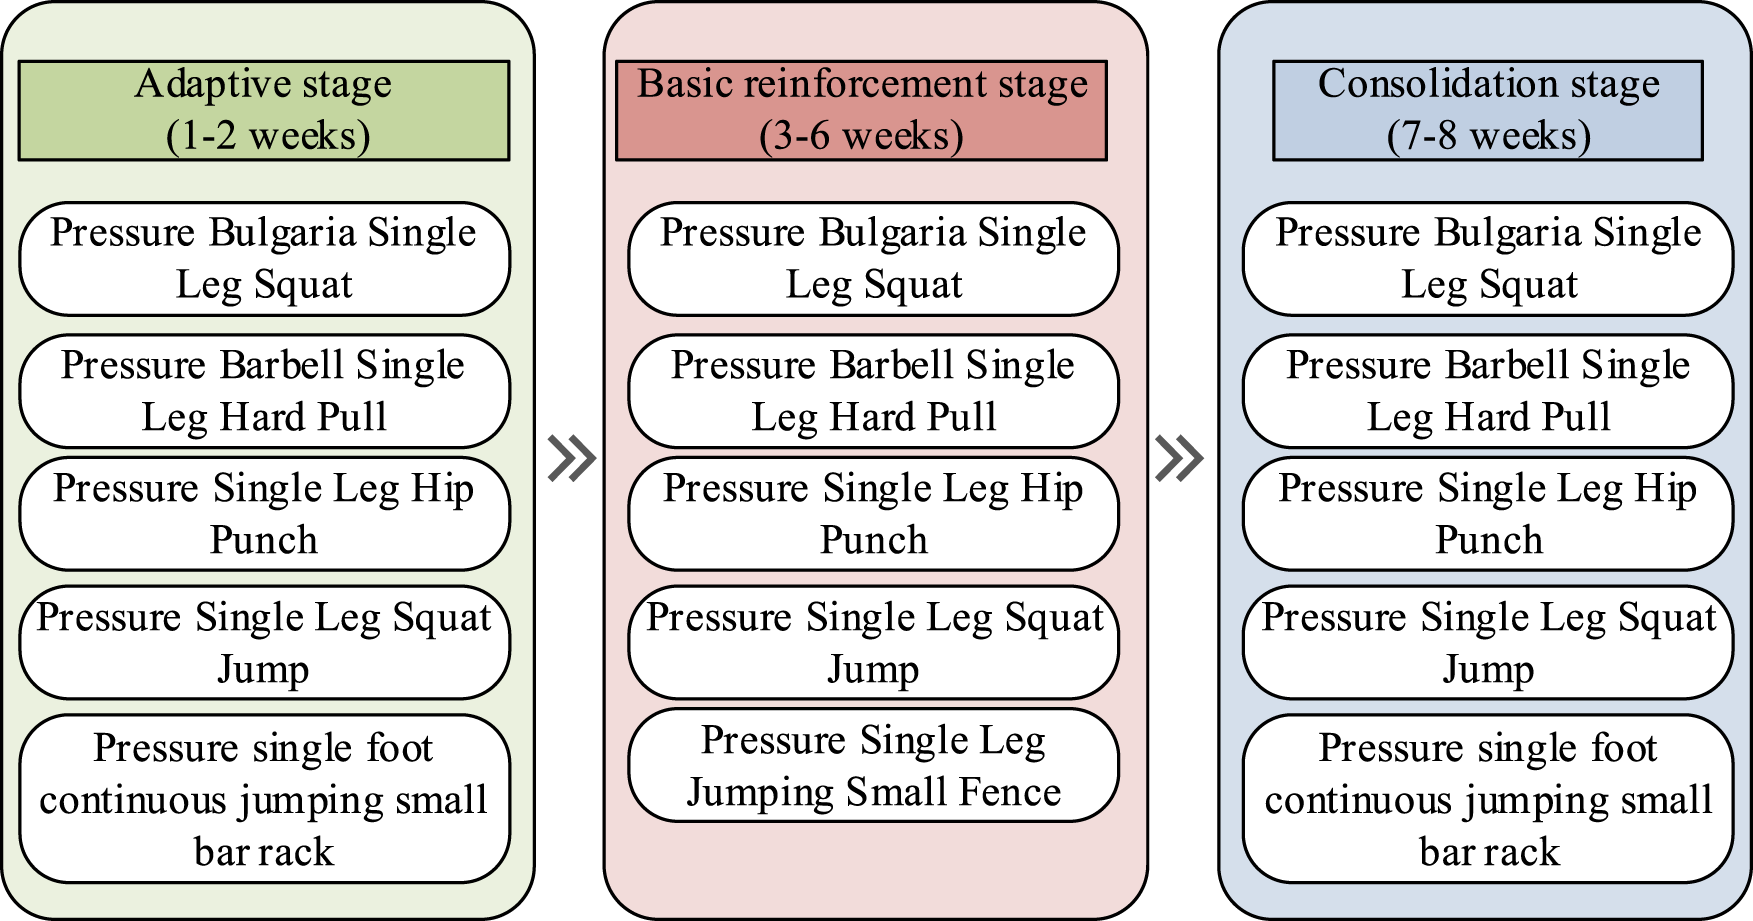
Specific training plan for the EG.
Figure 3 displays the CG's training program. The training of the CG was also divided into three phases. Among them, the training movements in both the adaptation and consolidation phases were the same. Unlike the rest of the phases, the basic reinforcement phase replaced the single-leg continuous jumping hurdle rack with the single-leg jumping hurdle rack. The number of training sets, the interval duration between each phase, and the percentage of 1RM training load were all in line with the EG.
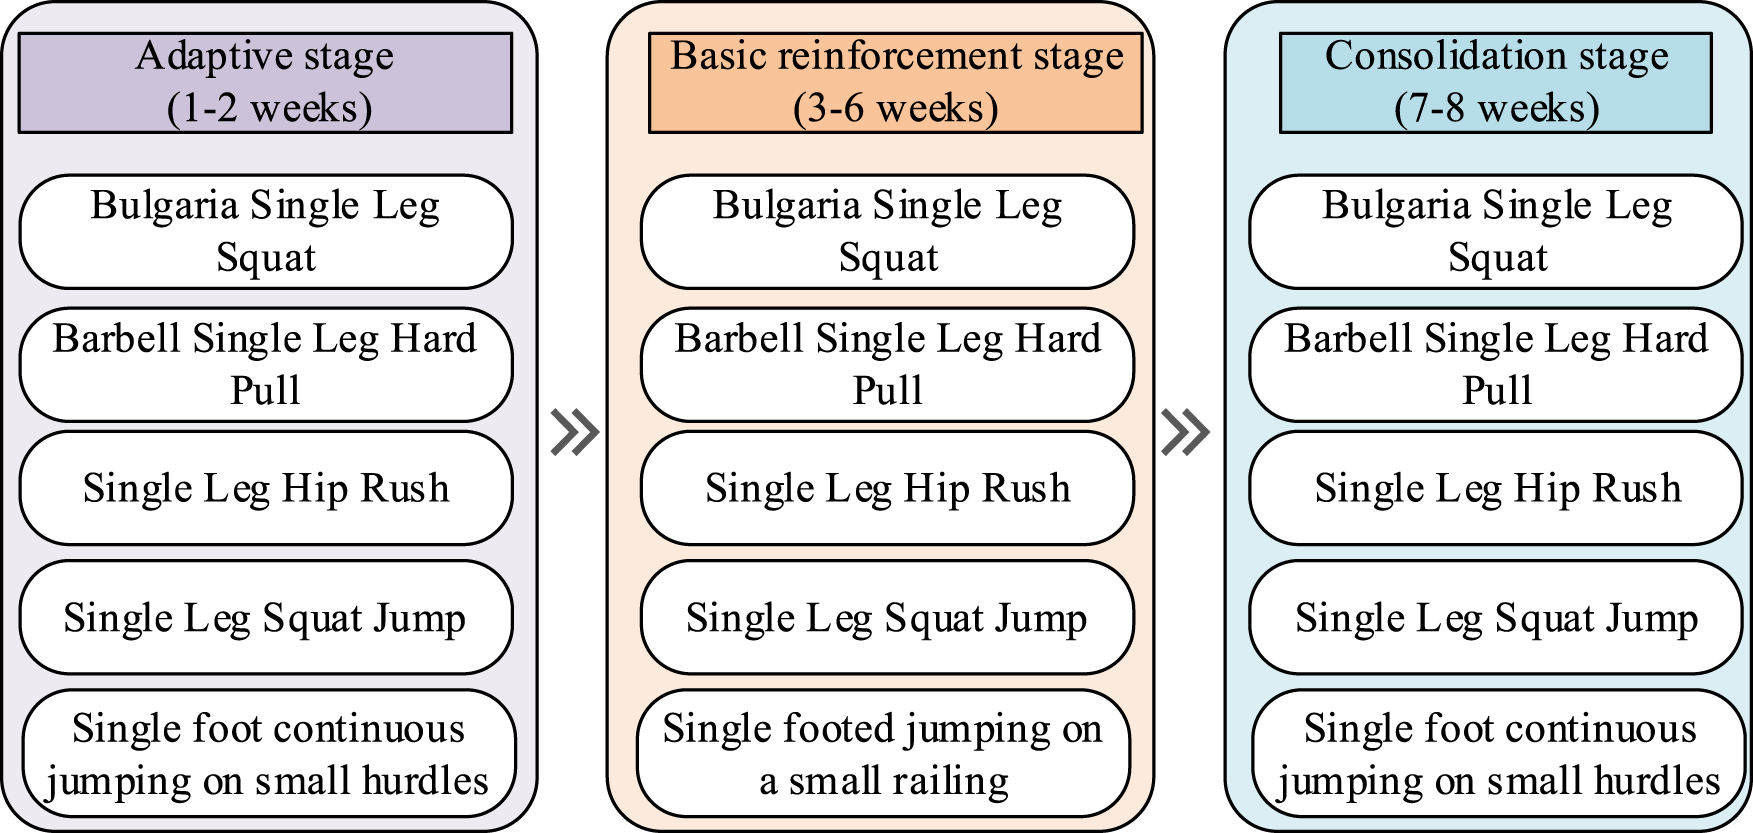
Training plan for the CG.
Both groups of athletes were required to perform muscle relaxation at the end of the training session, using a foam roller to relieve the muscles in the core area. This was followed by static stretching, including shoulder stretching, posterior leg lateral stretching, and quadriceps stretching.14,15
Athletes lower limb explosive power test
Before and after the experimental intervention, the level of LLEP needed to be measured in both groups of athletes. Specific test indexes included isokinetic strength (IS), counter movement jump (CMJ), skeletal muscle content, body fat percentage, 1RM test, and LLEP.
In conducting the lower limb circumference test, the study used an inelastic circumference tape measure to measure the thigh circumference of the athletes. The athletes stood comfortably with their feet slightly apart and their arms swinging loosely on each side of their bodies while the measurements were being taken. The test position was one-third of the way from the groin to the upper edge of the patella. Each leg was tested three times and the average value was taken as the final result. 16
In the body composition test, the study used the Visbody-E490 3D body tracker to test the athletes’ body composition, including body fat percentage, skeletal muscle, muscle mass, waist to hip ratio, body fat, protein, and body weight. The procedure involved first asking the athlete to remove his/her jacket, metal jewelry, shoes and socks. Next, the athlete stood barefoot in the footprint position of the turntable and followed the voice prompts to perform the operation. Finally, the test was concluded to generate the final body composition report.17,18
The Y balance test apparatus was used to assess the athletes’ lower limbs’ dynamic balance in an attempt to determine the stability of contralateral limb extension during unilateral support. The specific operation was as follows: First, the athletes performed simulation exercises in three directions to familiarize themselves with the process. Then they took off their shoes and socks, stood on the test bench with one foot, crossed their arms and toes close to the red line. The other foot pushed the test board as far as possible in the three directions of front, back center and back out. Three tests were conducted for each direction, and the final outcome was determined by taking the best score.19,20 The test bar cannot be used to support the test plate during the test. To ensure measurement reliability, all tests are conducted by the same experienced tester. The Y-balance test showed good test-retest reliability among the athlete population (intra group correlation coefficient ICC > 0.85). Figure 4 displays the Y balance test schematic diagram.
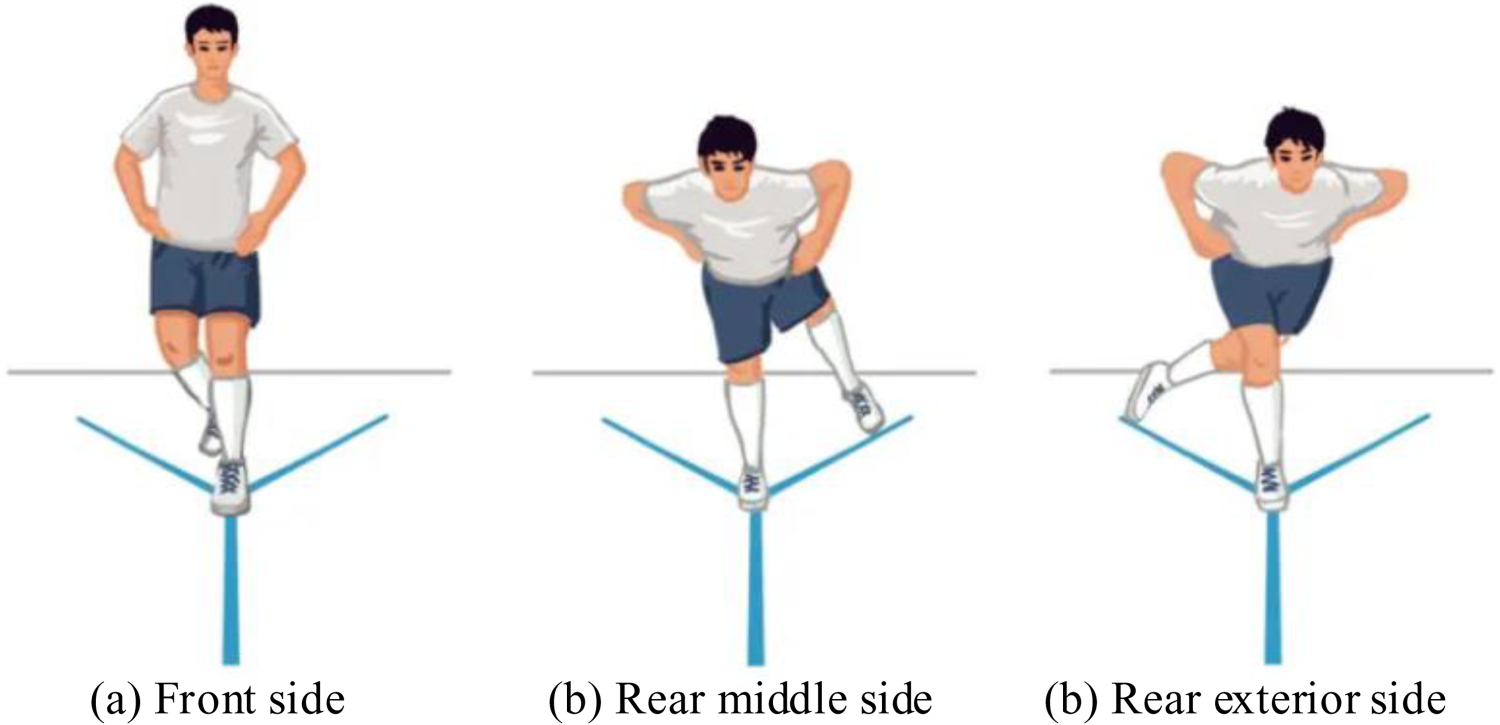
Y balance test diagram.
In the process of testing IS, when athletes performed wrestling leg holds, they needed to utilize knee stirrups to accomplish this. Therefore, the IsoMed2000 IS testing device was used to test the LLEP of the athlete's knee. A 10-min warm-up exercise was performed before the test. According to the basic information of the athlete, the main unit and the seat were adjusted. Then the athletes’ knee flexors and extensors were tested for peak torque at different angular velocities, which were set at 60°/s and 180°/s, respectively. 21 The strength and endurance of the knee extensors and flexors were tested using the IsoMed 2000 IS test device. The test was performed 5 and 15 times at an angular speed of 60°/s and 180°/s.
The CMJ test was designed to assess the ability of the lower limb extensor muscle groups to rapidly change from centrifugal to centripetal contractions. Prior to the test, the athlete should warm up for 10 min. During the test, the athlete stood with one foot in the center of the force platform and the other foot on a force plate, ready to jump. After clicking on the “Start” sign, the athlete jumped quickly with arms crossed and knees bent in a squat according to the command. The best value was used as the final test result after each leg was tested three times, separated by one minute. 22 According to the preliminary data from this laboratory, the CMJ power test has a high test-retest reliability (ICC = 0.92).
The apparatus in the 1RM test consisted of a barbell and a training rack. During the test, the athlete should have their feet open shoulder width apart, with the knees pointing in the same direction as the toes. The athlete should hold the barbell bar with the palms of both hands forward and carry the barbell with the back of the shoulders. The athlete slowly bent the knees and lowered the barbell, keeping the knees no higher than the toes. When the thighs were parallel to the ground, slowly extend the hip and knee joints and smoothly lift the barbell back to the starting position. During the testing phase, a light weight deep squat warm-up was completed first, followed by a one-minute rest. A warm-up of three reps was completed by increasing the weight by 10 kg, followed by a three-minute rest. Additional 10 kg of weight was added again to complete a 3-rep warm-up, followed by a three-minute rest period. The cycle increased the weight by 3 repetitions of the squat for 2 repetitions with a three minute rest period between sets. The 1RM test was determined within five sets only, with the maximum weight successfully completed in the squat being the final test result. 23
The key indicators of LLEP used in the study consisted of four tests. Among them, the standing long jump mainly assessed the LLEP and physical coordination. During the test, subjects were asked to stand with their feet naturally apart, behind the jumping line without stepping on the line with their toes. Both feet should jump in place at the same time, without padding or continuous jumping. The best outcome may be recorded as the final outcome, and each person could leap again. The upward explosive force of the lower body was measured by jumping vertically in place and touching high. The participant started from a standing position, jumped vertically in place and touched high on a wall marker. The 6-step run-up and 5-step single-leg jump were used to assess lower body stability and explosive power. A 20-meter test area was drawn before the test and the subject stood in front of the starting line. When the whistle was heard, the participant jumped on one leg and reached the finish line as fast as possible. During the test, the feet could not be changed, and two tests were conducted to take the best score. Standing triple jump mainly tested the athlete's speed and strength and special jumping power. During the test, the subject should jump with both feet and land on one foot to take the step. The other foot landed and then stride, with both feet landed. The best score was taken after two tests were administered. The schematic diagram of each test item is shown in Figure 5.

Schematic diagram of testing items for lower limb explosive power.
Mathematical and statistical methods
The data collected for the study were entered into Excel 2021 software and the data processing tool was SPSS 26.0 software. All measurement data were first subjected to normality testing using the Shapiro Wilk test. For data that conforms to a normal distribution, mean ± standard deviation was used for statistical description.24,25 A two-factor mixed analysis of variance should be used to test for differences in each dependent variable across groups and time periods. The focus should be on the interaction effect between groups and time to reveal whether the differences between the two groups over time are statistically significant. If the interaction effect was significant, a simple effects analysis could be conducted. Bonferroni correction could be used for post hoc multiple comparisons to test differences between groups before and after the experiment, as well as differences within each group before and after the experiment. The inter group comparison of athlete baseline information was conducted using independent sample t-test. The significance level of all statistical tests was set at α = 0.05, meaning p < 0.05 indicates statistical significance of the difference.
The minimum detectable change (MDC) between CMJ power and triple jump distance should be studied and calculated. The SEM of CMJ power was calculated based on laboratory reliability data (ICC = 0.92) and the baseline standard deviation of CMJ power (4.5 W/kg), resulting in a power of 1.2 W/kg. The SEM of triple jump distance was taken as 0.11 m based on the research of similar triple jump athletes. The smallest worth while change (SWC) was determined based on consensus in the field of sports science and the specific requirements of triple jump. The SWC of CMJ power was set at 2.25 W/kg, and the SWC of triple jump distance was set at the recognized practical improvement threshold of 0.28 m in special training.
Results
Comparison of basic information
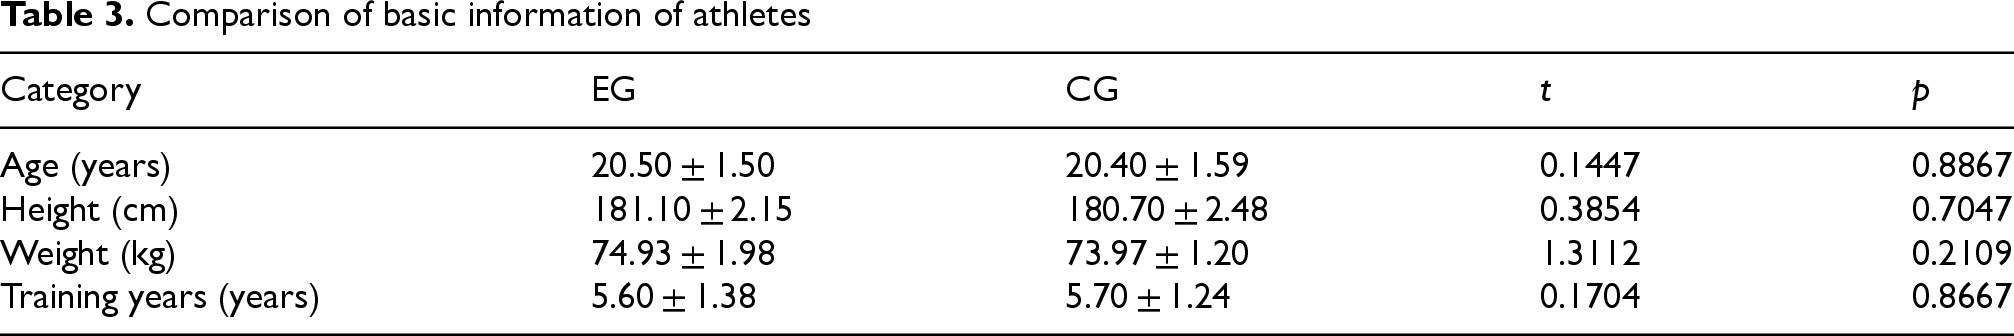
The basic information of the two groups of athletes participating in the experiment was compared and analyzed using SPSS26.0 with independent samples t-test, and Table 3 displays the findings. There was no SSD in basic information of each group (p < 0.05), which was comparable.
Comparison of basic information of athletes
The effect of compression training on lower limb circumference in athletes
The study tested the lower limb muscle circumference of both groups of athletes before and after training. The statistical results of lower limb muscle circumference before and after the experiment are shown in Figure 6. Figure 6(a) represented the changes in left thigh lower limb muscle circumference of both groups of athletes before and after the experiment. The lower limb muscle circumference of the EG was 55.43 ± 1.58 cm before the training, and it was elevated to 57.25 ± 1.62 cm after the training. There was a SSD between the two comparisons (p < 0.05). The lower limb muscle circumference of the CG before and after training was 54.89 ± 1.82 cm and 55.21 ± 1.58 cm respectively, with a SSD. After the experiment, there was a SSD in lower limb muscle circumference between the EG and the CG (p < 0.05). Figure 6(b) represents the changes in lower limb muscle circumference of the right thigh of the two groups of athletes before and after the experiment. There was no SSD in lower limb muscle circumference of the right thigh between the EG and the CG before training (p > 0.05). At the end of training, there was a SSD in lower limb muscle circumference of the two groups (p < 0.05).

Lower limb muscle circumference of two groups of athletes before and after training. Note: “a” indicates statistically significant differences within the group comparison, while “b” indicates statistically significant differences between the groups.
Effects of pressurized training on body composition in athletes
Table 4 shows the results of body composition comparison between the two groups of athletes before and after the experiment. There was no SSD in body composition between the two groups of athletes before and after training. Except for the body fat index, there was no SSD in inter-group in the rest of the indexes (p > 0.05). Moreover, there was no SSD in intra-group in body composition indicators between the two groups of athlete (p > 0.05). Protein, skeletal muscle, and muscle mass growth rates in the EG were clearly higher than those in the CG, despite the fact that there was no SSD between the two groups before and after training. The body fat percentage decreased faster than that in the CG.
Comparison of body composition between two groups of athletes.
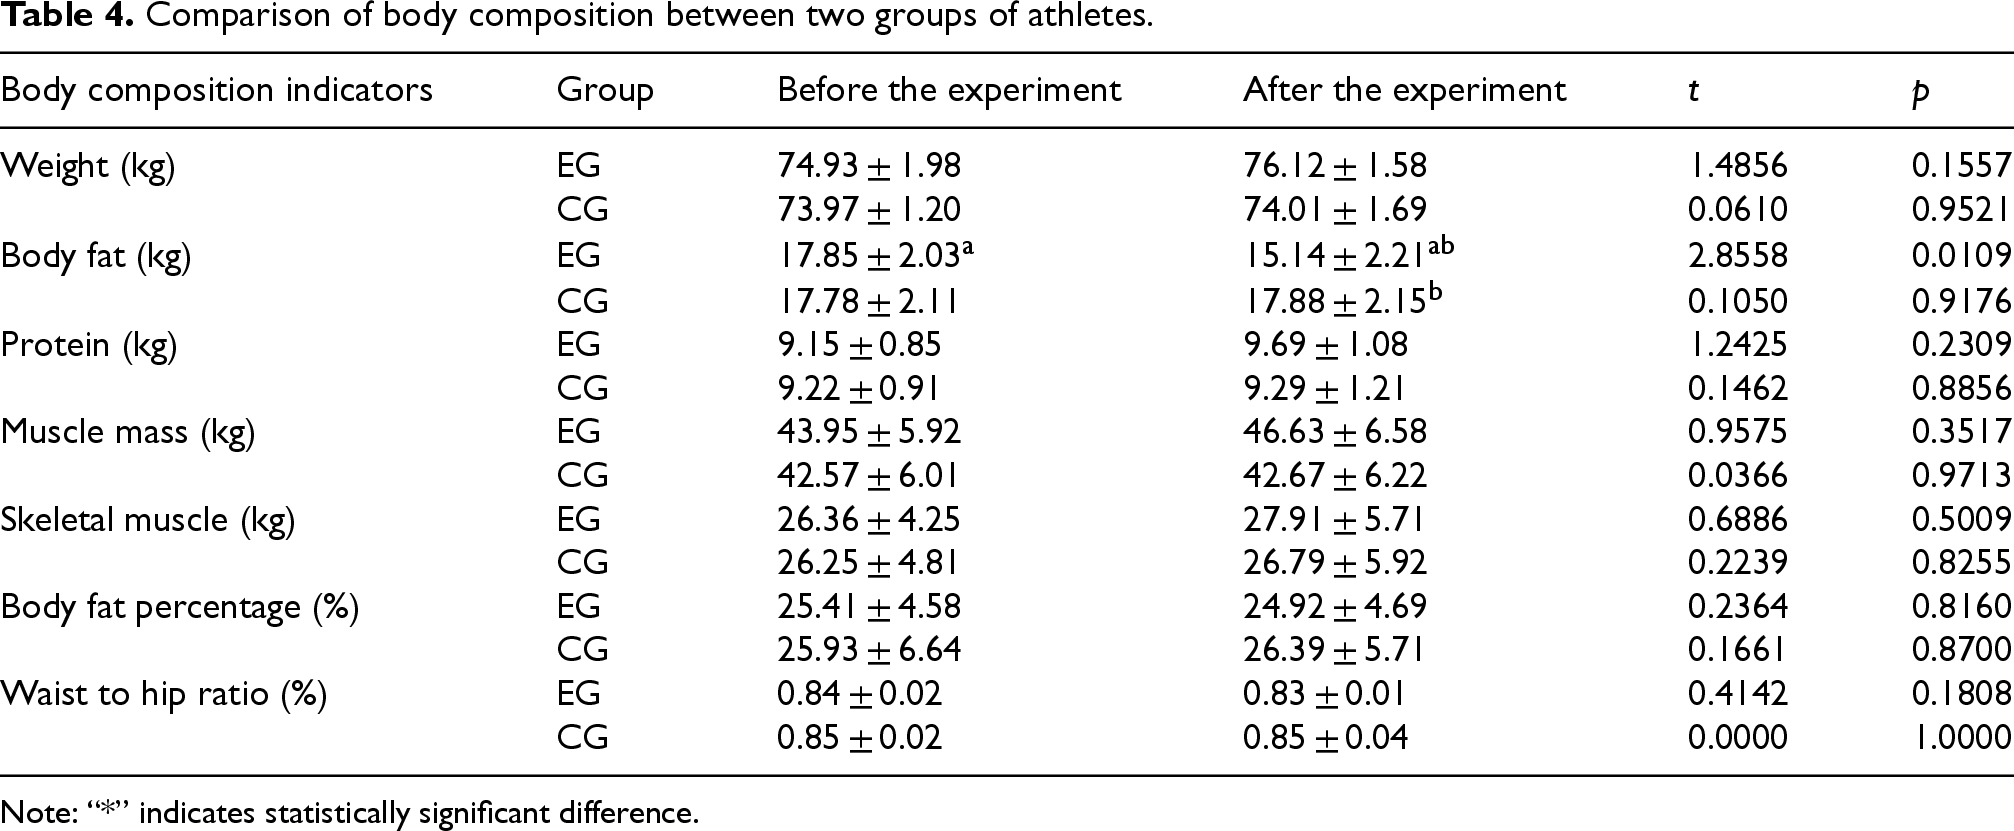
Note: “*” indicates statistically significant difference.
The effect of pressurization training on lower limb DBA in athletes
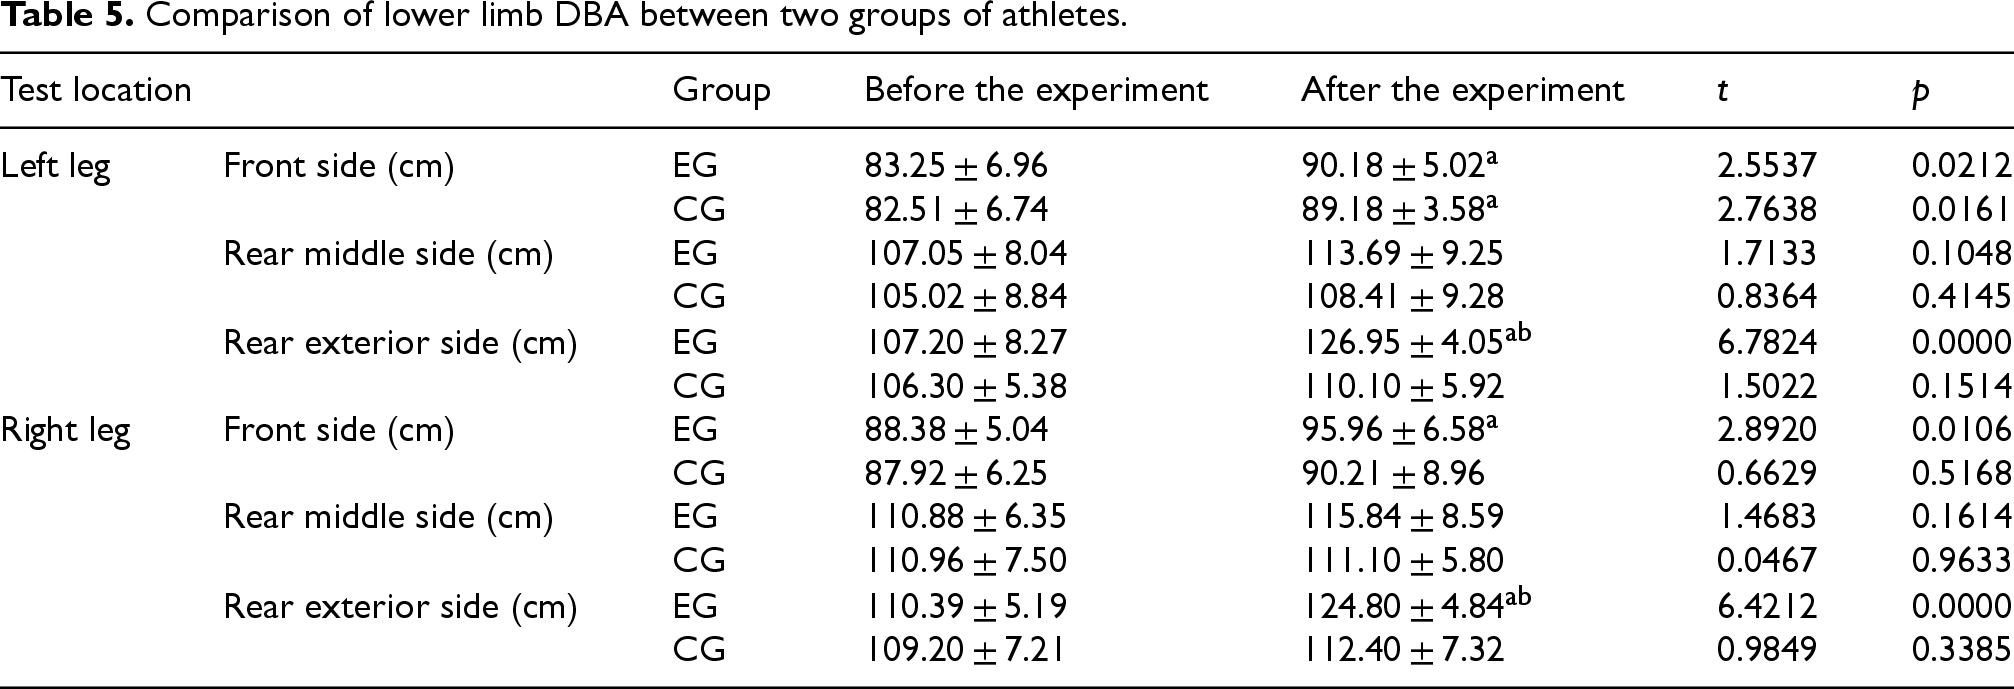
Table 5 shows the test results of lower limb dynamic balance ability (DBA) of both groups of athletes before and after training. Both groups of athletes improved their lower limb DBA after training. Among them, the EG had a more significant improvement. In the anterolateral extension of the left leg, the extension distance of the EG increased from 83.25 ± 6.96 cm to 90.18 ± 5.02 cm. The p value of the comparison was 0.212, which was statistically significant. In the posterior lateral extension of the left leg, the extension distance in the EG improved from 107.20 ± 8.27 cm to 126.95 ± 4.05 cm, which was statistically significant (p < 0.05) in the intra-group comparison. While the CG improved from 106.30 ± 5.38 cm to 110.10 ± 5.92 cm, with no SSD (p > 0.05). In the posterior lateral extension of the right leg, the EG improved from 110.39 ± 5.19 cm to 124.80 ± 4.84 cm, with a SSD in intra-group comparison (p < 0.05). While the CG elevated from 109.20 ± 7.21 cm to 112.40 ± 7.32 cm, with no SSD (p > 0.05). In addition, there was a SSD in the posterior lateral extension distance between the two groups after the experiment (p < 0.05). It indicated that the pressurization training could significantly improve the lower limb DBA of the athletes.
Comparison of lower limb DBA between two groups of athletes.
Effects of pressurized training on isokinetic strength in athletes
Comparison of normalized peak knee flexion and extension torque of athletes at 60°/s angular velocity
Figure 7 represented the comparative results of the athletes’ normalized peak knee flexion and extension torque at 60°/s angular velocity. In Figure 7(a), the peak torque of left knee flexor muscle of the athletes in the EG increased from 82.15 ± 8.92 N·m before the experiment to 102.36 ± 9.01 N·m, and there was a SSD in the within-group comparison (p < 0.05). In contrast, the peak torque of left knee flexor muscle of the CG athletes did not change much, and there was no SSD in the comparison before and after the experiment (p > 0.05). There was a SSD in the comparison of the results between the two groups in the post-experimental period (p < 0.05). From Figure 7(b), the peak torque of left knee extensor muscles of the EG athletes increased from 125.25 ± 8.56 N·m to 138.47 ± 8.54 N·m, there was a SSD in the EG (p < 0.05). In contrast, the peak torque of the CG athletes was only 124.36 ± 7.47 N·m after training, there was a SSD in the EG (p < 0.05). In Figures 7(c) and 7(d), both peak torque of right knee flexor and extensor muscles were significantly improved in the EG, while only peak torque of right knee extensor muscles was more significantly improved in the CG. In the comparison between the groups, there was a SSD in peak torque of right knee flexor and extensor muscles between the EG and the CG after training (p < 0.05).

Comparison of normalized peak knee flexion and extension torque of athletes at 60°/s angular velocity.
Comparison of normalized peak knee flexion and extension torque of athletes at 180°/s angular velocity
Figure 8 represents the comparative results of normalized peak knee flexion and extension torque of the athletes at 180°/s angular velocity. In Figure 8(a), at 180°/s angular velocity, the peak torque of left knee flexor muscle of the athletes in the EG increased from 71.07 ± 4.85 N·m before the experiment to 88.24 ± 5.02 N·m, and there was a SSD in the comparison of values (p < 0.05). After training, there was a SSD in the between-group comparison between the EG and the CG (p < 0.05). In Figure 8(b), the peak torque of left knee extensor muscles of the athletes in the EG increased from 94.85 ± 5.85 N·m to 104.28 ± 4.17 N·m, with a SSD (p < 0.05). Furthermore, the post-experimental results were statistically different from the CG (p < 0.05). In Figures 8(c) and 8(d), at 180°/s angular velocity, there was a SSD in post-training peak torque of the right knee flexor and extensor muscles of the athletes in the EG from the pre-experimental results (p < 0.05). The results were statistically different from the CG.

Comparison of normalized peak knee flexion and extension torque of athletes at 180°/s angular velocity.
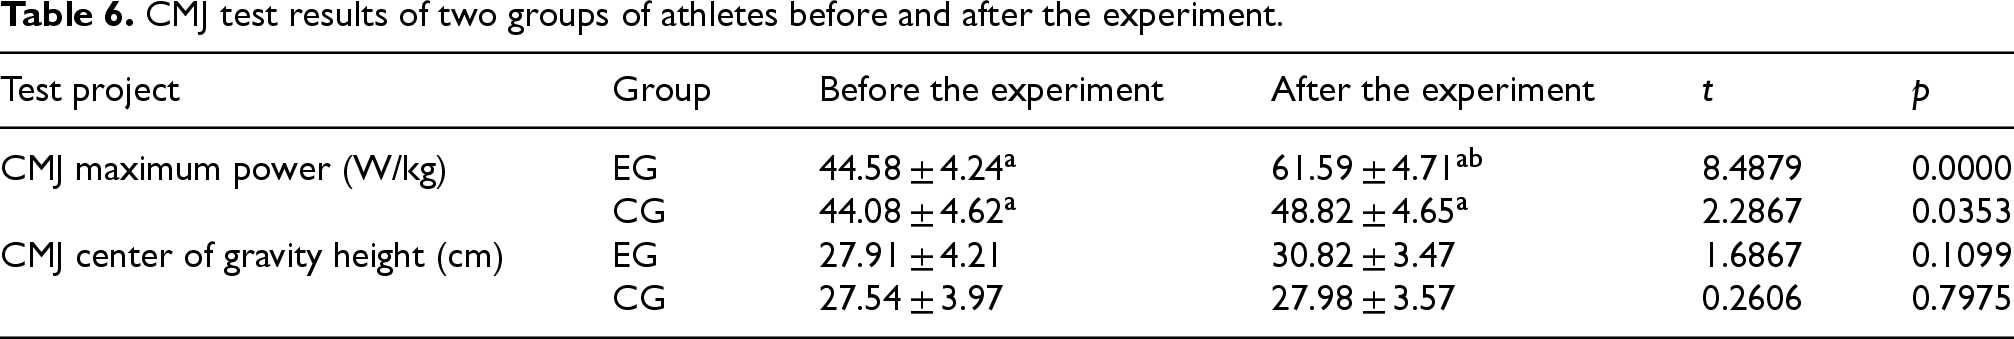
Comparison of pressurized training on CMJ test results in athletes
Table 6 shows the CMJ test results of the two groups of athletes before and after the experiment, which included CMJ center of gravity height and CMJ maximum power. The CMJ maximum power of the EG before and after training was 44.58 ± 4.24 W/kg and 61.59 ± 4.71 W/kg, respectively, with a SSD (p < 0.05). Meanwhile, the maximum power of CMJ in the CG before and after the experiment was 44.08 ± 4.62 W/kg and 48.82 ± 4.65 W/kg, respectively, with a SSD (p < 0.05). In contrast, there was no SSD in CMJ center of gravity heights of the experimental and CGs before and after training did not differ significantly (p > 0.05). In the between-group comparison, there was a SSD between the two groups of athletes in terms of CMJ maximum power after training (p < 0.05), and there was a SSD in CMJ center of gravity height (p > 0.05). However, it was obvious that the CMJ center of gravity height increase of the EG was higher than that of the CG. It indicated that the pressurization training could significantly enhance the muscle power of the athletes due to the fact that the pressurization training promoted the excitation of α motor neurons, which in turn enhanced the muscle power. The study found that the CMJ power MDC was 1.2 W/kg and the SWC was 2.25 W/kg. After training, the experimental group showed an average increase of 17.01 W/kg in CMJ power. The improvement values of ten athletes exceeded the MDC and SWC values. The control group's CMJ power increased by an average of 4.74 W/kg, with 8 athletes improving by more than MDC and 6 athletes improving by more than SWC. This confirmed the practical value of low load resistance combined with single leg compression training in improving athletes’ LLEP.
CMJ test results of two groups of athletes before and after the experiment.
The effect of compression training on the maximal strength of the lower limb in athletes
Figure 9 represents the results of 1RM squat comparison between the two groups of athletes before and after training. In Figure 9, the 1RM squats of the EG were 113.15 ± 10.58 kg before the experiment and elevated to 166.00 ± 4.48 kg after the experiment, with a SSD between the before and after comparisons (p < 0.05). The 1RM squats of the CG were 113.17 ± 9.69 kg and 133.50 ± 8.69 kg before and after the training respectively, with a SSD (p < 0.05). After training, the difference in 1RM squats between the two groups was statistically significant (p < 0.05). It indicated that the effect of pressurized training on maximal strength improvement was better than that of traditional training.

Comparison of 1RM squats between two groups of athletes before and after training.
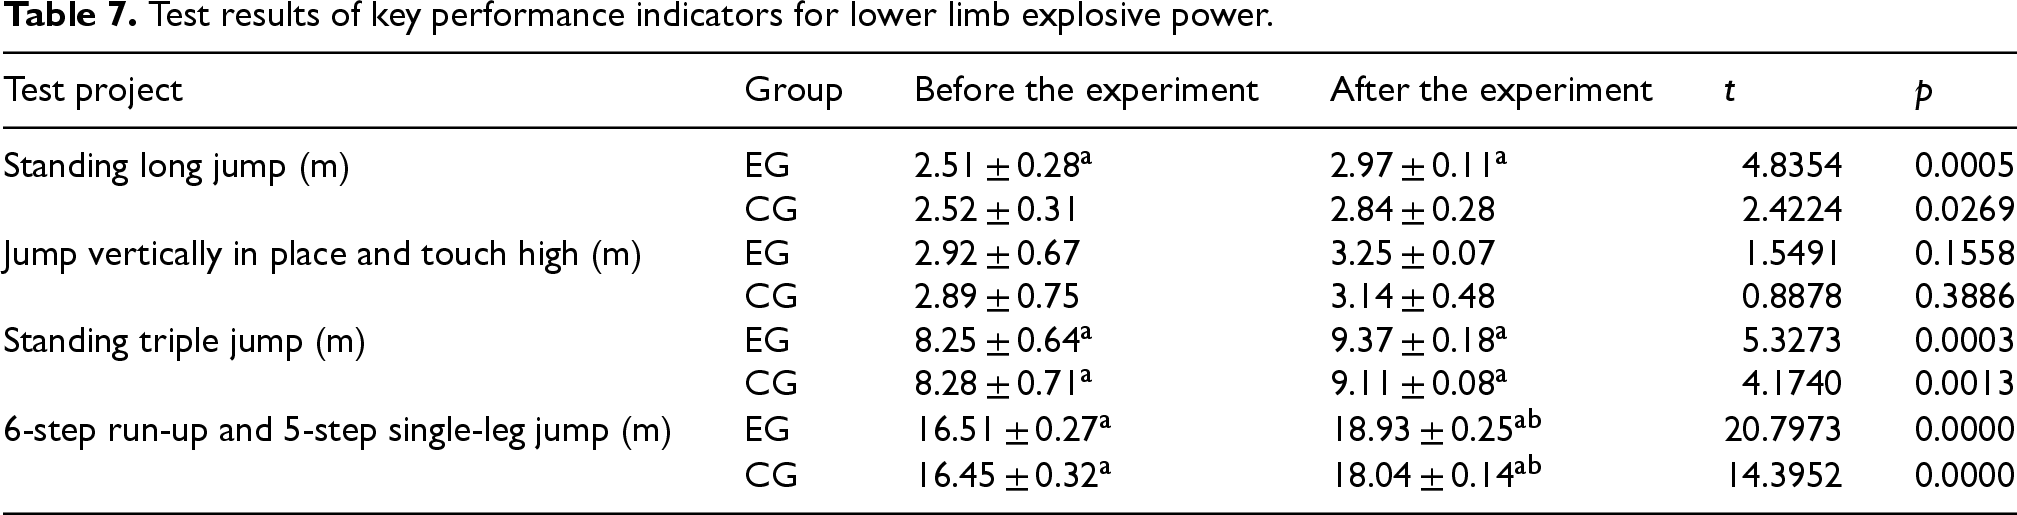
The effect of pressurized training on key performance indicators of lower limb explosive power in athletes
The results of the two groups of athletes’ LLEP main performance indices before and after the experiment are displayed in Table 7. There was a SSD in the results of standing long jump, standing triple jump, and 6-step run-up and 5-step single-leg jump of the two groups of athletes before and after training (p < 0.05). Meanwhile, the EG's performance indexes were better than the CG. The EG's post-training standing long jump was 2.97 ± 0.11 m, while the CG's was 2.84 ± 0.28 m. The EG's post-training jump vertically in place and touch high was 3.25 ± 0.07 m, while the CG's was only 3.14 ± 0.48 m. 0.48 m. The result of standing triple jump of the EG after training was 9.37 ± 0.18 m, while the result of the CG was only 9.11 ± 0.08 m. In addition, there was a SSD between the results of 6-step run-up and 5-step single-leg jump of the two groups after training (p < 0.05). This indicated that the EG combined with pressurized training had the best effect on the enhancement of athletes’ LLEP.
Test results of key performance indicators for lower limb explosive power.
The effect of pressurized training on athletes’ triple jump special performance
Figure 10 shows the triple jump special performance of the two groups of athletes before and after training. In Figure 10, the triple jump special performance of the EG athletes was 13.95 ± 0.16 m before training and increased to 14.77 ± 0.21 m after training, with a SSD (p < 0.05). Meanwhile, the triple jump special performance of the CG athletes before and after training was 13.96 ± 0.18 m and 14.28 ± 0.15 m, respectively, with a SSDt (p < 0.05). In addition, following training, the EG's triple jump special performance was noticeably better than the CG's. (p < 0.05). The study found that the distance of the triple jump was 0.11 meters for MDC and 0.28 m for SWC. After training, the average triple jump performance of the experimental group improved by 0.82 m, and the improvement values of 10 athletes exceeded those of MDC and SWC. The average triple jump performance of the control group increased by 0.32 m. Nine athletes improved by more than the MDC, and seven improved by more than the SWC. This further confirmed the advantages of low load resistance combined with single leg compression training in optimizing the specialized performance of triple jump athletes.
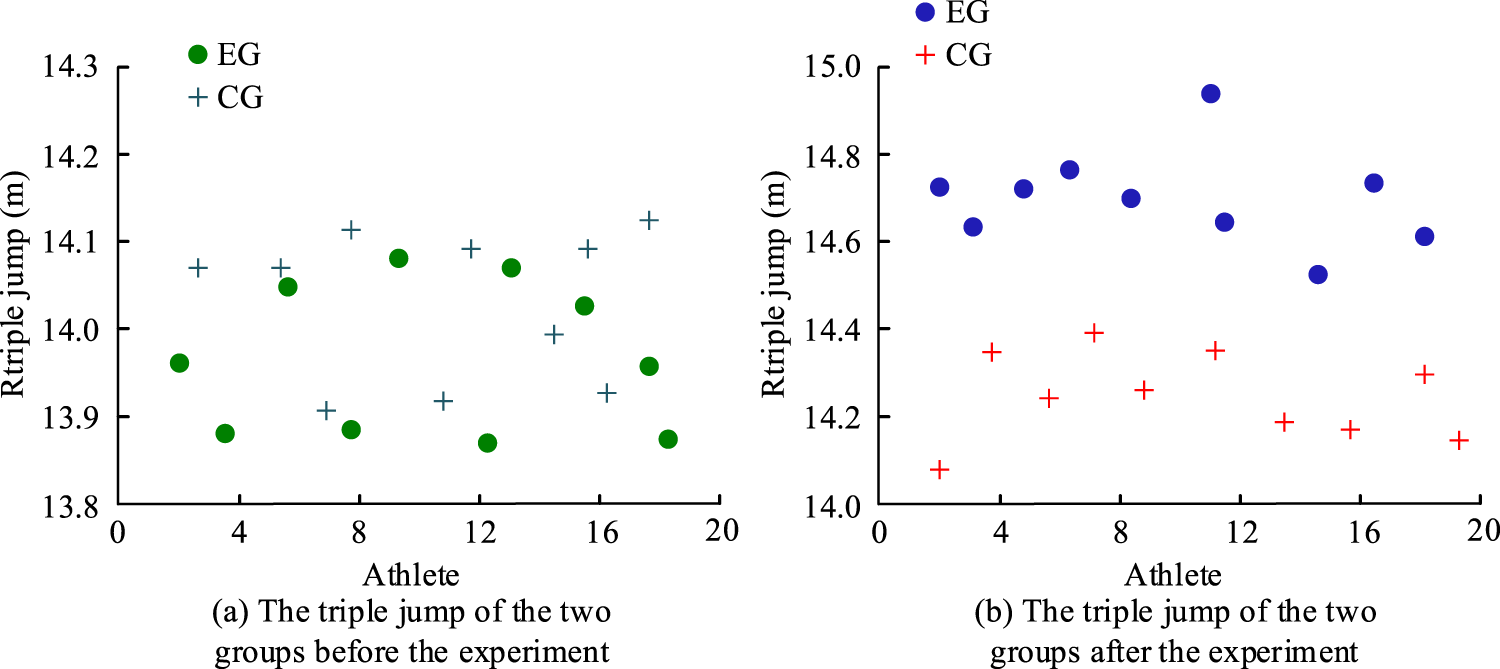
Comparison of athletes’ triple jump special results.
Discussion
LLEP, as a key performance indicator, played a crucial role in sports such as triple jump that require high explosive power and lower limb coordination. 26 Compression training, also known as pressurization training, progressively applied to the training of athletes for the enhancement of LLEP. This method primarily affected the limb by reducing arterial blood inflow and increasing venous blood pooling. This resulted in mechanical compression of the blood vessels, which maintained arterial blood inflow to the muscles while limiting venous blood return to the distal limb. This effect resulted in the limb entering a state of relative ischemia and hypoxia. The inability to effectively remove metabolites such as lactic acid during this process resulted in a notable increase in metabolic stress. This could be mitigated by employing a lower exercise intensity, which demonstrated to enhance protein synthesis, stimulate muscle growth, and improve muscle fitness. This approach was shown to elicit outcomes that are comparable to those achieved through prolonged high-intensity training. Based on this advantage, the study proposed a combined training method of single-leg pressurized exercise and low-load resistance to explore its effect on the promotion of LLEP.
Research confirmed that, after eight weeks of training, the experimental group that used low-load BFR training outperformed the control group that used traditional, high-load training in multiple key indicators. In terms of muscle morphology, the thigh circumference of the athletes in the experimental group significantly increased. Body composition analysis showed that this increase was primarily due to an increase in muscle mass rather than fat accumulation. This result was consistent with previous findings in other athletic populations. For example, A. W. Cranston et al. confirmed that BFR training effectively promoted lower limb muscle circumference growth in high-level rugby players. The main physiological mechanism was believed to be the accumulation of metabolites leading to cell swelling and activation of synthetic signaling pathways.
The results of the study were consistent with recent meta-analyses on the impact of pressure training on explosive power. X. Wang et al.'s systematic review and meta-analysis compared the effects of pressure training and traditional resistance training on explosive power. The conclusion pointed out that pressure training was more effective than traditional resistance training in improving lower limb explosiveness in healthy individuals. 27 The quantitative effect of this analysis (jump SMD = 0.36, the explosive power SMD = 0.72) provided strong external evidence support for the observations in this study. In addition to verifying the final performance output results, recent research also provided a physiological mechanism explanation for why pressure training can produce such effects. C. Liu et al.'s research suggested that BFR training was an effective means of inducing post activation potentiation (PAP) effects. The PAP phenomenon referred to the short-term enhancement of the explosive power output ability of muscles after a pre intense contraction activity. This study found that BFR training at 40%−70% 1RM intensity was most likely to induce PAP effects. 28 The 30% 1RM load used in this study felt below the optimal range, yet the core mechanism was analogous. The process entailed generating local metabolic pressure by constricting blood flow under low load, thus prompting more robust neuromuscular adaptation.
In terms of functional performance, the DBA of the lower limbs of the experimental group athletes improved significantly. This could be attributed to metabolic pressure caused by pressure training, which effectively activated more fast muscle fibers and deep stable muscle groups. This enhanced the neuromuscular system's coordination and control ability. 29 A. Pereira et al. found that blood flow restriction training could improve athletes’ balance and coordination while enhancing their LLEP, which was similar to the research results. 30 Additionally, the experimental group demonstrated significantly greater increased in isokinetic muscle strength at various angular velocities, vertical explosive force (as measured by CMJ), and maximum force (as measured by 1RM squat) compared to the control group. This indicated that pressure training could not only improve the strength output ability of muscles at different exercise speeds. It could also optimize the recruitment efficiency of neuromuscular systems. It did so by more effectively stimulating alpha motor neurons. This resulted in comprehensive enhancement of the maximum strength and power output of athletes. 31 From the practical significance of sports, the CMJ power and triple jump performance improvement of all athletes in the experimental group exceeded the threshold of MDC and SWC. This improvement not only eliminated measurement error interference, but also had practical value for the performance of triple jump. Although some athletes in the control group improved beyond the threshold, the overall compliance rate was lower than in the experimental group. This further indicated that low-load resistance training combined with single-leg compression training better met the actual competitive needs of the triple jump event. The rationale behind this phenomenon was that the pressurized training regimen resulted in a reduction of oxygen content within the muscles, which in turn stimulated the nervous system's motor center, thereby initiating muscle contraction and exertion. This ultimately led to an enhancement in the maximum strength of the lower limbs. 32
In conclusion, the combination of low-load resistance and single-leg compression training, as employed in the study, has been demonstrated to yield superior outcomes compared to traditional training methods. This approach is advantageous for enhancing the LLEP of male triple jump athletes. However, there are some limitations to the research. First, the small sample size (N = 20) limits the statistical power and generalizability of the results. Second, the study uses fixed compression pressure instead of individualized arterial occlusion pressure percentage, which affects the standardization of stimulation. Third, although significant effects are observed in the 8-week intervention, the adaptability of longer-term training still needs to be explored. Fourth, the pressure calibration method used in the study is a fixed absolute pressure (150 mmHg), without personalized settings based on the individual limb occlusion pressure (LOP) of each athlete. To further optimize the training strategies of triple jump athletes, future research should expand the sample size, include female athletes, adopt individualized pressure programs, and set longer follow-up periods. At the same time, Doppler ultrasound devices should be used to measure LOP individually in order to improve the study's accuracy, safety, and comparability.
Conclusion
Through an eight-week experimental intervention, the study systematically compared the effects of low-load resistance combined with single-leg compression training and traditional high-load resistance training on male triple jump athletes. The research results showed that low-load, single-leg compression training significantly improved athletes’ lower-limb explosive power, specialized performance, and related athletic abilities more effectively than traditional high-load training. Morphologically, the experimental group athletes achieved a significant increase in thigh circumference, and the increase was mainly due to muscle mass rather than fat. In terms of functional performance, the lower limb DBA, knee joint flexion extension isokinetic muscle strength at different angular velocities, maximum strength represented by 1RM squat, and explosive power represented by CMJ power had all been significantly improved. In the end, there was a significant improvement in the triple jump performance of the group. In addition, the practical significance of the research results was also validated. The specialized performance and CMJ power improvements of all athletes in the experimental group exceeded the MDC and SWC thresholds, proving that their training was not only statistically significant, but also had important applications in the field. The reason was that, under lower mechanical loads, pressure training could promote muscle adaptation and nerve recruitment efficiency more efficiently by creating local metabolic stress and hypoxic environments.
In summary, low-load resistance combined with single-leg compression training is an efficient and safe advanced training method that puts less stress on joints. This method provides a scientific solution that can effectively replace traditional high-load training for athletes in explosive events, such as the triple jump.
Footnotes
Acknowledgments
N/A
Ethics approval and consent to participate
The research was ethically approved by the Ethics Committee of the North China Electric Power University to participation, all participants were duly informed of their rights and responsibilities and provided explicit written consent. The study was conducted in agreement with the guidelines governing research involving human participants, as outlined by the Ethics Committee of the North China Electric Power University.
Funding
No funding
Declaration of conflicting interests
The author declared no potential conflicts of interest with respect to the research, authorship, and/or publication of this article.
Data availability statement
Data is provided within the manuscript.