



Abstract
Understanding the mid-Holocene dynamics of the East Asian monsoon (EAM) is integral to improving models of the Holocene development of the global climate system. Here we reconstruct the mid-Holocene EAM history from the Pearl River estuary, southern China, using bulk organic carbon isotopes (δ13C), total carbon to total nitrogen (C/N) ratios and total organic carbon (TOC) concentration. Sedimentary δ13C, C/N and TOC are potentially good indicators of changes in monsoonal precipitation strength. Sediments buried during a period of high precipitation exhibit a high proportion of terrigenous material, and have low δ13C and high C/N, and vice versa during a period of low precipitation. Results suggest a general decreasing trend in monsoonal precipitation from 6650 to 2150 cal. yr BP because of the weakening Northern Hemisphere insolation most likely related to the current precession circle. Superimposed on this trend are apparent dry–wet oscillations at centennial to millennial timescales most likely in response to solar activity. Mismatches between our δ13C record and results from the Dongge Cave in southern China at millennial timescales may indicate that the δ13C from the Pearl River estuary reveals changes in precipitation over a broader area than the δ18O from Dongge Cave.
Introduction
The East Asian monsoon (EAM) forms as a result of unequal heating of the Asian landmass and the Pacific and Indian Oceans (Figure 1a) and subsequent energy re-distribution. At the present day the EAM plays a significant role in the global and regional hydrological and energy cycles (Webster et al., 1998). It is suggested that fluctuations during the Holocene exerted a major influence on human societies (Mischke and Zhang, 2010; Shi et al. 1994). For example, during the stable warm and wet phase from 7200 to 6000 cal. yr BP, the Neolithic Yangshao Culture in the Yellow River catchment and the Majiabang Culture in the lower Yangtze plain, reached their climax (Shi et al., 1994). A sudden dry and cold event around 4000 cal. yr BP recorded in the Dunde ice core, Northwest China (Thompson et al., 1989, 1993), is suggested to be responsible for the end of the Longshan and Liangzhu Cultures in East China (Shi et al., 1994). Nearly two-thirds of the world’s population live in areas influenced by the EAM. A better understanding of the past variability of the EAM and the associated links with human cultures is, therefore, crucial to improve our understanding of potential implications of future changes in monsoon climate.
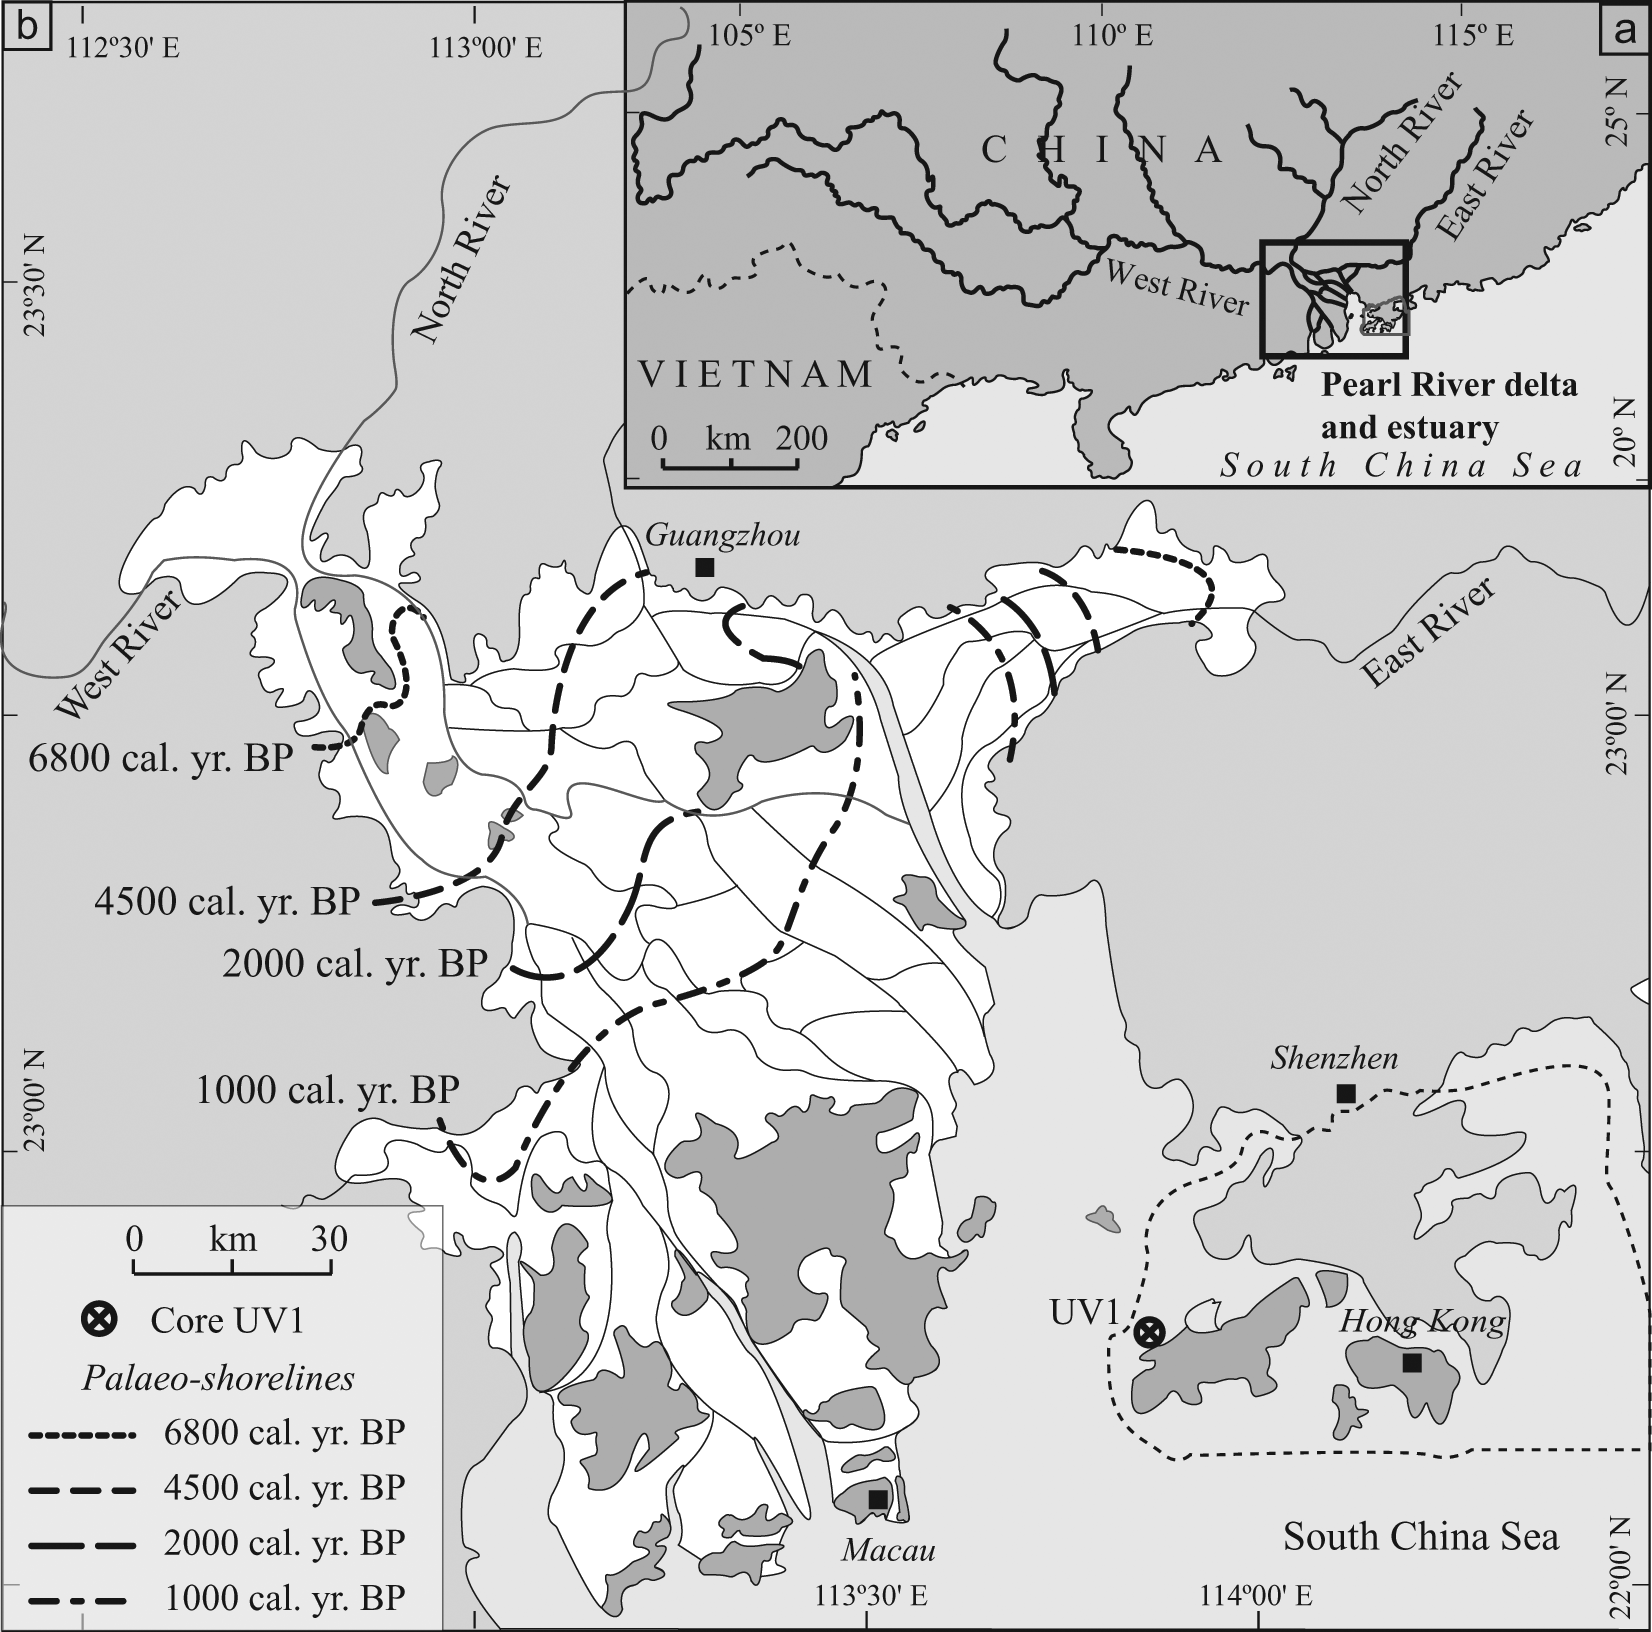
Study area. (a) Location of Pearl River estuary, East Asia; (b) locations for core UV1 (this study) and palaeoshorelines (Zong et al., 2009a)
The history of the EAM during the Holocene can be regarded as an alternation between dominance of a cold-dry winter monsoon and a warm-wet summer monsoon (An, 2000). After the Younger Dryas (11 200–10 000 cal. yr BP), a cold period which might have included some dry/wet oscillations (Xiao et al., 1998), the EAM switched to relatively warm and wet conditions (the Holocene). Based on evidence from ice cores (e.g. Thompson et al., 1989, 1993), lake water levels (e.g. Li et al., 1990; Wang and Fen, 1991), as well as archaeological records (e.g. Zhou et al., 1991), Shi et al. (1994) suggested that Holocene Megathermal phases mainly occurred during 8500–3000 cal. yr BP. They divided the Holocene EAM into several phases: 8500–7200 cal. yr BP characterised by unstable temperature fluctuations with an increase in precipitation; 7200–6000 cal. yr BP was a stable, warm and wet phase when the monsoon rainfall occurred almost throughout China; 6000–5000 cal. yr BP was characterized by strong climatic fluctuations and adverse climatic conditions; after 5000 cal. yr BP the climate became warm and stable – suitable for cultural development in China. Around 4000 cal. yr BP, the climate deteriorated and catastrophic floods occurred in East China; from 4000 to 3000 cal. yr BP, the climate was warm and humid. Based on geological data and numerical modelling, An et al. (2000) suggested that the front of the EAM retreated from north to south China during the Holocene. This resulted in the Holocene Optimum, a period of maximum precipitation, occurring earlier in the north and northeast of China and later in the south and southeast. The hydrological and thermal dynamics of the EAM system are perturbed by external and internal factors at a range of timescales. These factors range from solar forcing at millennial timescales, high latitude cooling events at centennial timescales, to low latitude El Niño events at decadal timescales (An et al., 2000).
Variability of the Holocene EAM has been reported from a range of archives, including natural records, such as loess (e.g. Porter and An, 2005), tree rings (e.g. Wu, 1992; Wu et al., 1988), ice cores (e.g. Thompson et al., 1989), and stalagmites (e.g. Wang et al., 2005), as well as historical archives (Shi et al., 1994). Each of these has specific advantages and disadvantages. Loess deposits from the Loess Plateau, central China, are good archives for investigating the EAM over timescales of millions of years. However, it is hard to undertake high-resolution studies based on these records because of the low sedimentation rates. Ice cores and deep-ocean deposits also suffer from a similar problem of low resolution. Stalagmites provide high-resolution studies; however, the δ18O signature can be influenced by both temperature and precipitation, which are also subject to local scale variability. Historical records can provide valuable information, but can be difficult to interpret and are spatially and temporally fragmented.
This study reconstructs the EAM during the mid Holocene from a estuarine core (core UV1) collected from Pearl River estuary (Figure 1b). Previous studies in the Pearl River estuary have shown that changes in the organic carbon isotopic signature of estuarine sediments can be used as an indicator for changes in the freshwater discharge induced by the monsoonal precipitation (Yu et al., 2010; Zong et al., 2006).
Over centennial and millennial timescales the sources of estuarine sediments (Figure 2) are influenced by relative shoreline movements, sea-level changes, and monsoonal climate change. Zong (2004) re-examined the Holocene sea-level history for the low latitude part of the China coast by re-assessing all the sea-level data available from the east to south coasts. The sea-level curve from west Guangdong and Hainan, a geologically stable region, shows that the relative sea level reached the present-day height by 6200 cal. yr BP and since then has been relatively stable (Zong, 2004). The time of maximum emergence of the sea-level highstand occurs earlier at tidal river sites than at coastal sites (Zong, 2004). In the Pearl River Delta, the maximum emergence of the highstand was around 7000 cal. yr BP (Li et al., 1990; Zong, 2004).
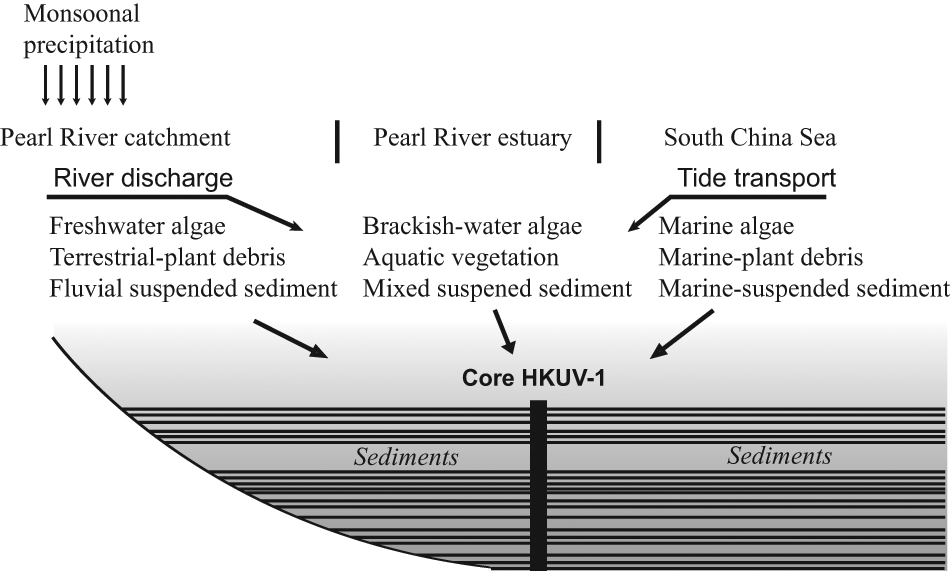
Sediment input into the Pearl River estuary from three main sources including terrestrial, brackish-water and marine areas (adapted from Zong et al., 2006)
As the sea level in this area has been relatively stable since the mid Holocene, monsoonal climate is one of the most important controlling factors for the sediment flux into the estuary (Li et al., 1990; Wang et al., 2005; Zong et al., 2006). For example, Zhang et al. (2008) suggested a positive linear correlation between cumulative freshwater discharge and cumulative sediment flux in the Pearl River. As outlined by Zong et al. (2006) the Pearl River estuary receives sediments from three main sources: river, marine and in situ brackish-water derived material (Figures 1b, 2); the proportion of these three main sources of organic matter to the estuarine sediment is controlled by the strength of the river discharge due to monsoonal precipitation. Therefore, during a period of strong summer monsoon, increased precipitation levels will generate a large volume of freshwater discharge into the estuary, along with high sediment flux. It follows that estuarine sediments preserved during periods of strong summer monsoon will have a higher proportion of terrigenous sediments compared with periods of stronger winter monsoon (lower precipitation, lower freshwater flux, hence lower proportion of terrigenous sediments relative to marine/brackish sediments). Thus, the monsoon-induced freshwater discharge can be reconstructed by examining changes in the relative dominance of organic matter from the three sources identified above preserved in the Pearl River estuary (Yang et al., 2011; Yu et al., 2010; Zong et al., 2006).
This study applies this methodology to reconstruct the EAM during the mid Holocene at decadal resolution, employing bulk organic carbon isotopes (δ13C) and total carbon to total nitrogen (C/N) ratios, to help understand possible driving mechanisms behind monsoon variability. Application of δ13C and C/N analyses of sedimentary organic matter for reconstructing palaeoenvironmental changes have been carried out in a range of environments (Lamb et al., 2006), including lagoons (Müller and Mathesius, 1999; Yamamuro, 2000), isolation basins (Chivas et al., 2001; Mackie et al., 2007; Westman and Hedenström, 2002), fjords (Bird et al., 1991; St-Onge and Hillaire-Marcel, 2001; Smittenberg et al., 2004), as well as estuaries (Malamud-Roam et al., 2006; Middelburg et al., 1997; Wilson et al., 2005; Zong et al., 2006). The advantage of δ13C and C/N analysis is that it can be performed on most sediment, as only a small amount of organic carbon (micrograms to milligrams) is required for analysis. Organic δ13C and C/N ratios can be measured rapidly and analyses are relatively inexpensive, leading to high-resolution studies (Lamb et al., 2007). To explore driving mechanisms for oscillations of the EAM at millennial to centennial timescales, general trends of δ13C and other proxies were removed.
Study area
The Pearl River catchment, located between 21°20′–23°30′N and 112°40′–114°50′E (Figure 1a), formed as a result of the uplift of the Tibetan Plateau during the Tertiary and Quaternary periods (Aitchison et al., 2007). Before the late Quaternary, sediment from the river system bypassed the current deltaic basin and was deposited on the continental slope and shelf (Zong et al., 2009a). Only since the Late Pleistocene has the deltaic basin started to receive sediments from the river system (Huang et al., 1982; Xu et al., 1985). The lower fluvial/deltaic plains of Guangdong and Guangxi provinces have been gradually infilled during the late Quaternary with progradation of the delta front since 6800 cal. BP (Zong et al., 2009a; Figure 1b).
The Pearl River catchment lies in the transitional area between the tropical and subtropical climate zones. The West River, 2214 km in length with a catchment area of 425 700 km2, contributes the majority of both water and sediment flux reaching the Pearl River Estuary (Kot and Hu, 1995; Zhang et al., 2008). Under strong influence of the monsoon climate, freshwater discharge and sediment flux show great seasonal variability due to seasonal changes in monsoonal precipitation. The mean annual precipitation of the catchment is 1200–2000 mm, which mainly occurs during the wet season lasting from April to September. Annual discharge of the whole Pearl River system is 330 × 109 m3 (Hu et al., 2006), and the annual sediment load is 89 × 109 kg (Zhang et al., 2008). Statistics since 2002 show that more than 86.9% of the annual suspended sediment is discharged during the wet season and 67.6−83.5% of annual water flux occurs in this season (Shen and Wang, 2009). Seasonal changes in monsoonal precipitation also results in changes in salinity within the estuary. For example, in summer (June–August), high precipitation generates strong freshwater flux into the estuary, resulting in a low-salinity estuarine environment, with water salinity lower than 1 PSU at the river mouth. Saline water intrudes much further upstream in winter (December–February) than in summer because of a significant reduction in freshwater flux (Yu et al., 2010; Zong et al., 2010a). In addition to the seasonal salinity variability, within the estuary there is a northwest–southeast isohaline system, due to decreasing freshwater influence seawards (Yu et al., 2010) and the strong tidal currents in the eastern part of the estuary (Zong et al., 2010a).
Material and methods
Vibracore UV1 was collected from 22°17′10″N, 113°51′49″E (Figure 1b) from a water depth of 8.6 m. The top 10 m of sediment spanning the last c. 6500 years was used for this study. The top 0.35 m of the core was washed away during the coring process and sediments from 6.00–6.25 m were missing because of gaps in the sampling tube. The core was sampled at 2 cm intervals for δ13C, C/N and TOC, producing a total of 501 samples.
The chronology for UV1 used here is that of Zong et al. (2010b) and is based on seven radiocarbon dates which are mostly from benthic foraminifera samples collected from various depths (Table 1). There is a small age reversal between GZ2213 at 2.6 m and SUERC-9602 at 1.9 m, the reason for this age reversal is not clear. The sedimentation environment was stable because particle size analysis shows no major change in sand, silt or clay fractions (Zong et al., 2010c), and there is no bioclastic storm bed found in this sediment section (e.g. Huang and Yim, 2001). The only thin sandy layer found in the core is located at 1.0 m (Zong et al., 2010c). Diatom assemblages from the section containing the age inversion show no significant change either (Zong et al., 2010b). All other dates lie in stratigraphic order producing a relatively robust age model (Figure 3; Zong et al., 2010b). Accordingly, these dates suggest a period of steady sedimentation from c. 6650 cal. yr BP at 10 m depth to c. 3300 cal. yr BP at 2.6 m. The average sedimentation rate in this period is c. 0.22 mm/yr. The top 2 m section of the core was deposited in the last 3300 years, with a reduced sedimentation rate of c. 0.08 mm/yr (Figure 3).
Radiocarbon dates from Core UV1

Radiocarbon dates are calibrated using Calcuve Intcal 09, 95% and 50% HDR ages are estimated using Bchron (Parnell et al., 2008), HDR, highest posterior density region; adates are cited from Zong et al. (2009b), where calibrated ages are expressed at ±2s level.

Age model for Core UV1 (modified from Zong et al., 2010b). The age model is established via Bchron using the method suggested by Heegaard et al. (2005) and Parnell et al. (2008). The 95% highest posterior density ranges (HDR) indicate the uncertainty of the ages assigned to each sample between the dated depths, together with the mean modelled age for each sample. In the graph, the number of samples involved in the calibration is shown as n, and the modelled age curve is established based on the 50% chronology
Sediment samples for δ13C and C/N analyses were prepared using 100 ml 5% HCl to remove carbonates. They were then washed three times with deionised water using the fibreglass filter paper (Fisher Brand 200), before being dried at 50°C overnight, homogenised in a pestle and mortar, and weighed (25–50 mg) for δ13C and C/N analysis. Carbon isotopes and C/N analyses were performed by combustion in a Carlo Erba NA1500 (Series 1) online to a VG Triple Trap and Optima dual-inlet mass spectrometer, with δ13C calculated to the VPDB scale using a within-run laboratory standards (BROC) calibrated against NBS-19 and NBS-22. Replicate analysis of well-mixed samples indicated a precision of ±<0.1‰ (1SD). C/N was determined by reference to an Acetanilide standard. Replicate analysis of well-mixed samples indicated a precision of ±<0.1%. The isotopic ratios are expressed as δ13C, in units of per mil (‰). The C/N is given using weight ratio of total organic carbon (%TOC) to total nitrogen (%TN). Where duplicate analyses was carried out, the data presented are the average value (SC typically <0.1‰).
For particle size analysis, sediment (0.2−4 g) was soaked in 5% Calgon solution overnight before analysis to allow disaggregation of the sediment. An ultrasonic treatment was applied when the sample did not completely disaggregate. Samples were then stirred before being introduced to the laser granular meter (Coulter LS 13200) for the analysis of fractions of sand, clay and silt. Results of particle size analysis are presented in the format of ‘average value ± standard deviation (SD)’.
Exponential smoothing of δ13C and C/N data were performed using the SPSS for Windows program. This method was chosen over other methods such as moving average, because it does not result in data loss, and it catches the general trend of the data series. To compare periodicity between δ13C and other proxies, the new δ13C data presented here was de-trended along with the previously published 10Be (Finkel and Nishiizumi, 1997) and Hematite-strained glass data (HSG, Bond et al., 2001). Spectral analysis on δ13C and 10Be and de-trending of data were carried out using the PAST program (Hammer et al., 2001).
Results
The δ13C, C/N and TOC data are presented in Figure 4. There is a clear change in sedimentation at 10.07 m marking the boundary between Holocene sedimentation above and pre-Holocene sedimentation below (poorly sorted firm clay through to gravel sediments below, soft silt and clay above). This is supported by the radiocarbon date of 33 500 ± 360 cal. yr BP at 12.5 m (Zong et al., 2009b). The age of the base of the Holocene section is estimated at 6650 cal. yr BP based on the age model developed by Zong et al. (2010b) (Figure 3). One of the possible reasons for the absence of early-Holocene deposition is that the core site was subaerially exposed at this time, when the sea level was low (Zong, 2004; Zong et al., 2009a), and sediment only starts accumulating when the sea level stabilized around 7000 cal. yr BP.

Results of δ13C, C/N and TOC for core UV1 (10.29–0.35m)
The Holocene section of the core is split into two zones based on the lithology, grain size and δ13C values. Zone 1 from 10.07 to 1.30 m is composed of dark greenish grey silt and clay (63.6±5.2% silt and 24.9±3.9% clay; Table 2). Zone 2 from 1.30 to 0.35 m is composed of yellowish silt and clay with a higher proportion of sand (17.0±12.1%; Table 2), mixed with large amounts of shell fragments. There are clear changes in δ13C, TOC and C/N values between Zones 1 and 2 (Figure 4); the average δ13C value for Zone 1 is −25.2±0.3‰, compared with −23.1±2.0‰ for Zone 2 (Figure 4). The radiocarbon date from 0.52 m produced a modern age (108 cal. yr BP), while the date from 1.33 m (immediately below the boundary between Zones 1 and 2) provided an age of 2337–2162 cal. yr BP. Based on the chronology and clear change in character of the sediments, the change from Zone 1 to Zone 2 most likely relates to enhanced human activity in this area as discussed by Zong et al. (2010c). In this paper we concentrate on the mid-Holocene section preserved in Zone 1.
Measurements of Zone 1 and Zone 2 of Core UV1

Values are presented as ‘average values± the standard deviation’.
Sediment from Zone 1 is mainly composed of silt (average 63.5 ± 5.2%) and clay (average 24.9 ± 3.9%), while sand concentrations average 11.4 ± 6.6% (Figure 5; Table 2). The proportion of sand and silt are negatively correlated through the core. Clay concentration gradually decreases from approximately 30.0% at the base to 20.0% at the top of the core.
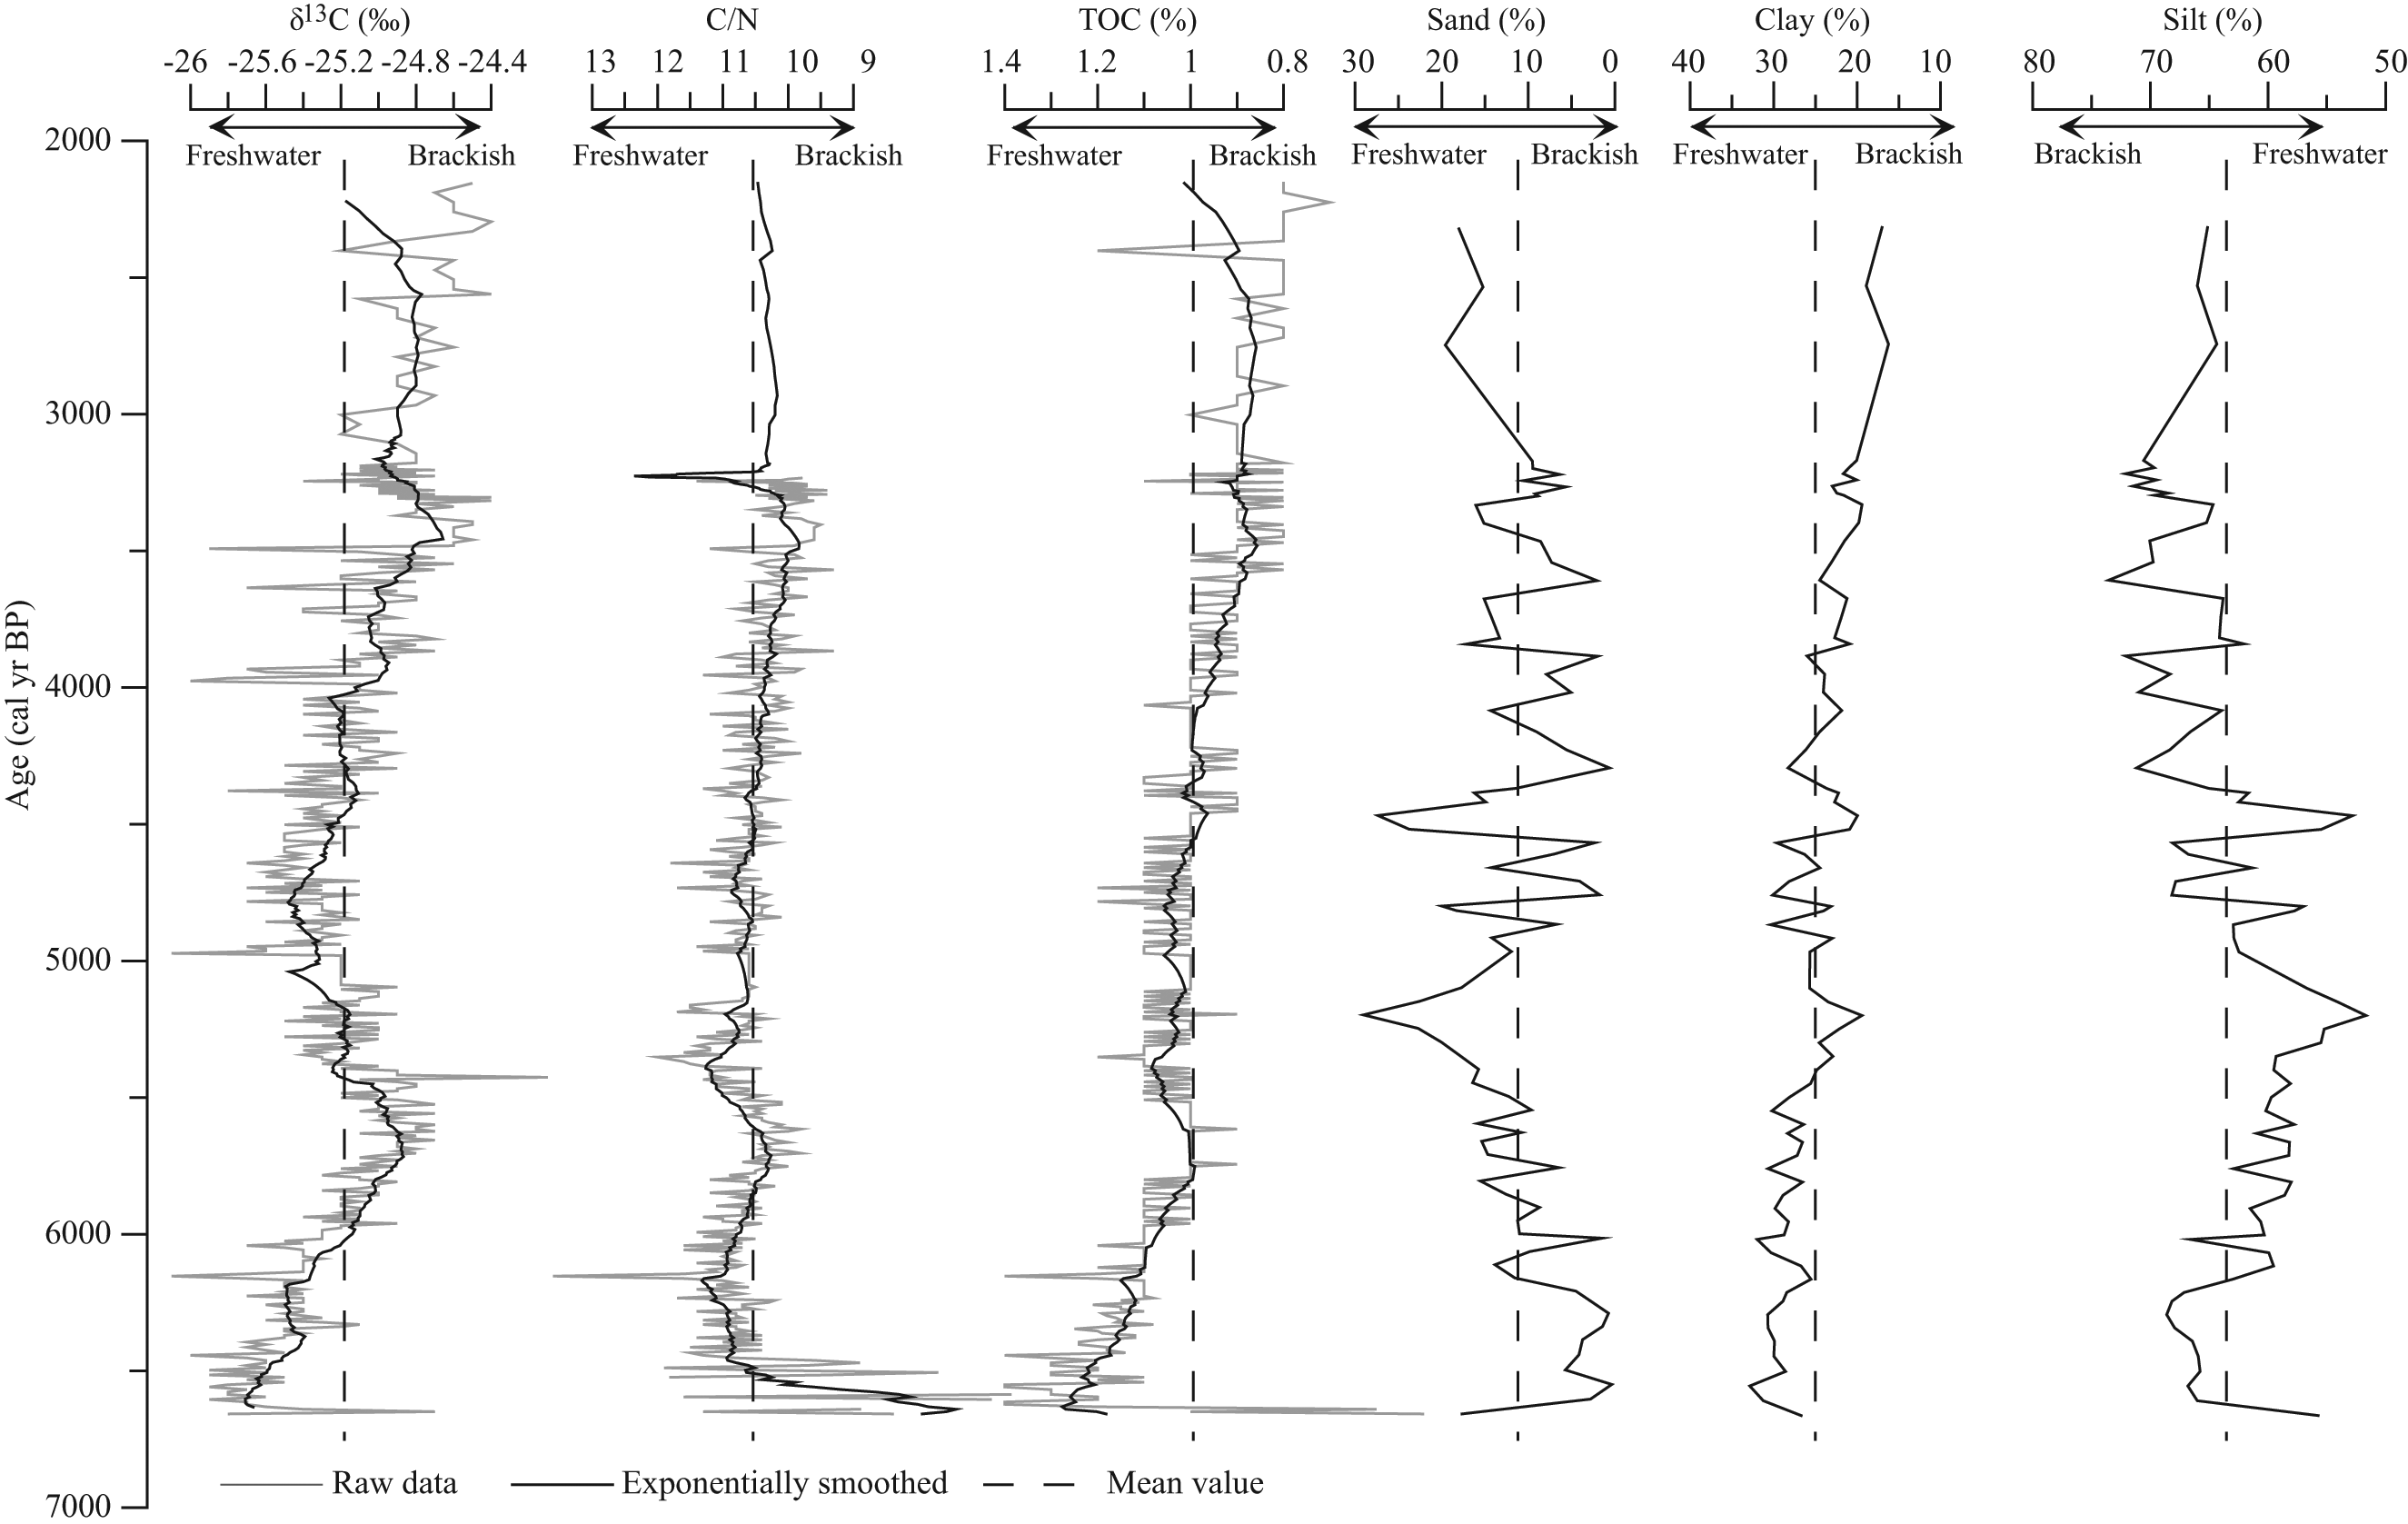
Results of δ13C, C/N, TOC and particle size during the mid Holocene (10.07–1.31 m of core UV1, ranging from 6650 to 2150 cal. yr BP) plotted against calibrated ages at 95% HDR
The δ13C values of Zone 1 show a general increasing trend from the base to the top of the zone (Figure 5). Superimposed on this increasing trend, the δ13C values fluctuate between −26.4‰ and −24.1‰, the average value (−25.2‰) for Zone 1 is shown by the dashed line (Figure 5). Exponential smoothing of the δ13C data suggests two oscillations are recorded in this section. The first complete oscillation starts from the base of this section, c. 6650 cal. yr BP to c. 4600 cal. yr BP. The second oscillation runs from c. 4600 to c. 2100 cal. yr BP, although the last part of this oscillation is not so clearly defined and may be incomplete (Figure 5). The mean C/N ratio in Zone 1 is 10.5 (dashed line, Figure 5). C/N ratios in Zone 1 show a general decreasing trend, except for very low C/N ratios (4.0−9.0) from 6650 to 6480 cal. yr BP (Figure 5). TOC records of UV1 show a general decreasing trend from 1.4% to 0.8% throughout Zone 1 with the average value of 1.01% (Figure 5). The exponential-smoothed TOC record shows a relatively close correlation with the δ13C values (Figure 5).
Discussion
An East Asian monsoon history during the mid Holocene
The δ13C and C/N signature preserved in core UV1 outlined above can be used to infer changes in the sediment sources during the mid Holocene. Changes in sediment source can then be used to indicate changes in EAM precipitation-induced freshwater flux.
General weakening EAM during the mid Holocene
Increasing δ13C, decreasing C/N ratios and decreasing TOC found in sediments spanning the period 6650−2150 cal. yr BP indicate a long-term trend of weakening precipitation-induced freshwater discharge linked to a weakening summer monsoon (Figure 5). This trend is highlighted in Figure 6a by higher than average δ13C values (−25.2‰) from 4350 to 2150 cal. yr BP and generally lower than −25.2‰ from 6650 to 4350 cal. yr BP. Possible forcing mechanisms that could influence the proportion of sediments from different sources in UV1 during this time period are sea-level change, delta progradation and freshwater flux. Sea level reached its present-day level around 6800 cal. yr BP and has been relatively stable since then (Zong, 2004). Thus, the influence of sea-level changes on the δ13C signal is assumed to be relatively minor. As a consequence of the stable sea level, the deltaic shoreline advanced slowly seawards between 6800 and 2000 cal. yr BP (Figure 1b, Zong et al., 2009a). Delta progradation during the mid Holocene has led to core UV1 being more proximal to terrestrial source areas through time (Figure 1b). Based on this we would expect larger amounts of terrestrial sediment to be delivered to the core site through time. However, the general increase in bulk organic carbon δ13C values recorded in UV1 during the mid Holocene indicates a decreasing proportion of terrestrial organic matter (Figure 6a). Terrestrial/freshwater-sourced organic material has an average δ13C value of −25.0‰, compared with marine-sourced organic material with an average of −21.0‰ (Hu et al., 2006; Yu et al., 2010; Zong et al., 2006). This suggests that a decrease in terrestrial material input due to lower freshwater flux is far greater than an assumed increase in terrestrial material input expected because of increased proximity associated with delta front advance. This, therefore, suggests that the actual reduction in terrestrial material input (hence freshwater flux) is in fact even more significant.

Comparison between δ13C of UV1 and other records. (a) Exponentially smoothed δ13C from 6650 to 2150 cal. yr BP (this study); (b) palaeo-salinity based on diatom-salinity transfer function from core UV1 by Zong et al. (2010b); (c) δ18O of stalagemite from Dongge Cave, southern China (Wang et al., 2005). In (a), (b) and (c), dashlines show the mean value of each proxy. (d) Insolation changes at 30°N (Berger and Loutre, 1991); (e) detrended δ13C from core UV1 (this study); (f) detrended concentration of 10Be of GISP2 ice core (Alley et al., 1995; Davis et al., 1990; Finkel and Nishiizumi, 1997), where higher 10Be concentration is responding to stronger solar activity; (g) detrended hematite-stained grains (HGS) of Core MC52 and VM29-191 (Bond et al., 2001), with IRD events 2, 3 and 4 (Bond et al., 1997) marked by black bars; (h) detrended δ18O of stalagemite from Dongge Cave, southern China (Wang et al., 2005). In (e) and (h), black bars show the possible position of IRD events 2, 3, and 4. In (e), grey bars are dry events observed in this study. Detrending of these data was taken using the PAST programme (Hammer et al., 2001)
The general decrease in C/N ratios up core (Figure 5) also supports the interpretation of weakening monsoon strength. Lower C/N ratios suggest increased proportion of estuarine/marine particulate organic matter and algae which typically have C/N values < 10 compared with terrestrial organic matter with typical C/N values > 10 (Yu et al., 2010). This suggests reduced terrestrial/freshwater material input due to reduced freshwater flux, hence reduced monsoon precipitation.
General weakening freshwater flux suggested by δ13C and C/N is supported by the grain size results of core UV1. Modern samples from the Pearl River estuary collected by Yu et al. (2010) suggest that sediments from the riverine area are usually composed of >30% sand and <50% silt, and 17−18% clay, and those from brackish/marine areas usually have >60% silt, <20% sand, and 25−28% clay composition. Domination of clay and silt in the sediment suggests a relatively weak hydrological system under marine/brackish-water environment at this site during 6600−2200 cal. yr BP. Increase in silt concentrations from generally < 63.6% before ~4600 cal. yr BP, to > 63.6% after ~4400 cal. yr BP, possibly indicates a strengthening marine influence at this site (Figure 5), e.g. changing from brackish to marine conditions responding to reduced freshwater flux. This is supported by the generally increasing clay concentration during 6600–2200 cal. yr BP.
Diatom flora from core UV1 (Figure 6b) show a general increase in marine species since 6650 cal. yr BP. This is interpreted as indicating weakening monsoon-induced freshwater discharge (Zong et al., 2010b). Wang et al. (2005) examined the δ18O of stalagmites from the Dongge Cave in southern China, and revealed a general decreasing summer monsoon during the past 9000 years (Figure 6c). Pollen records from Jiangxi province, southern China, investigated by Xiao et al. (1998), also show a clear decrease of evergreen trees that prefer humid conditions and shrubs, replaced by herb and ferns in the area, indicating decreasing monsoonal precipitation since early Holocene.
Dry/wet fluctuations at millennial to centennial timescales
Superimposed on the general weakening trend discussed above are centennial- and millennial-scale fluctuations in δ13C interpreted as wet/dry fluctuations linked to EAM variability during the mid Holocene (shown by the de-trended δ13C record of Figure 6e). The δ13C data show one oscillation between 6650 and 4650 cal. yr BP and another oscillation from 4650 to 2150 cal. yr BP (Figure 6e). This suggests a possible periodicity for the EAM precipitation change of around 2000 years. Shorter period, centennial scale, dry events are also suggested by the δ13C record, for example at 6300, 5700, 4300, 3800, 3400 and 2500 cal. yr BP (shown by horizontal bars in Figure 6e). Each of these dry events lasts for 100−300 years. Spectral analysis on de-trended δ13C data also suggests two very significant periodicities of 2514 years and 1408 years (significance level > 99%), and two significant ones of 765 years and 476 years (significance level > 95%; Figure 7a).

Spectral analysis of (a) δ13C of Core UV1 (this study) and (b) 10Be of GISP2 ice core (Alley et al., 1995; Davis et al., 1990; Finkel and Nishiizumi, 1997). Exponentially smoothed δ13C and 10Be data have been de-trended prior to spectral analysis using the PAST program (Hammer et al., 2001). Dashlines show significance levels of 99% (d=0.01) and 95% (d=0.05), respectively
Various studies have suggested a general weakening trend in monsoonal climate during the Holocene (e.g. reducing precipitation since the early Holocene), with fluctuations revealed by a range of proxies such as the Loess deposit in central China (e.g. An, 2000) and the stalagmite record from Dongge Cave, southern China (Wang et al., 2005). Zong et al. (2006) examined the bulk organic δ13C record from the Pearl River estuary and suggested a strong freshwater flux during 8000–6000 cal. yr BP induced by a strong summer monsoon. They then identified a gradual reduction in monsoonal freshwater discharge from 6000 cal. yr BP, with fluctuations towards the present (Zong et al., 2006). Although the high-resolution δ18O of stalagmite from Dongge Cave (Wang et al., 2005) also indicates the general weakening monsoon since the mid Holocene (Figure 6c), it does not pick up centennial and millennial fluctuations found in δ13C signal from the Pearl River estuary (Figure 6e and h). This is probably because the δ18O of stalagmite can be influenced by both temperature and precipitation, and δ18O of the stalagmite is thought to mainly reflect more local environmental changes (e.g. Kelly et al., 2006) while δ13C likely shows broader catchment area change.
Driving mechanisms for the EAM variability during the mid Holocene
Orbital forcing
Orbital forcing, specifically the precession cycle, has been suggested as the most important driving mechanism for EAM precipitation variability during the Holocene (An, 2000; An and Thompson, 1998; Huang et al., 2008; Kutzback, 1981; Mayewski et al., 2004). This study shows a general weakening precipitation during the mid Holocene following part of the precession cycle (Figure 6a and d). Precession influences the monsoon through its impact on seasonal contrasts. Half a precession cycle in the past (at approximately the beginning of the Holocene), perihelion occurred in the boreal summer, causing enhanced summer insolation in the Northern Hemisphere, and aphelion fell in the boreal winter, causing reduced winter insolation. Such seasonal contrast was strongest at the beginning of the Holocene and has weakened towards present during the current precession cycle (Figure 6d; Berger and Loutre, 1991; Bradley, 2003). Today, in its slightly elliptical orbit, the Earth is at perihelion around the boreal winter solstice, and at aphelion around the boreal summer solstice (Bradley, 2003). Berger and Loutre (1991) calculated the insolation values at different latitude zones in both summer and winter, showing weakening summer insolation at 30°N (Figure 6d). The weakening East Asian summer monsoon during the 6650−2150 cal. yr BP identified here is most likely a response to the orbital-induced weakening insolation since about 11 000 years BP (An, 2000; Wang et al., 2005).
There are many possible ways that insolation could influence the EAM system. One possible process is that reducing insolation leads to changes in oceanic and atmospheric circulation, resulting in changes in temperature and precipitation (An and Thompson, 1998; Huang et al., 2008; Xiao et al., 2006). For example, reducing insolation results in cooler tropical temperature and thus resulted in a weakened Hadley circulation (Rind and Overpeck, 1993) and reduced water vapour content of the atmosphere. Thereby it would reduce the monsoonal precipitation and resultant freshwater runoff. The influence of precession on the EAM is also supported by a variety of other proxies, e.g. pollen records from the desert/loess transition of north central China (e.g. Jiang et al., 2006) and loess deposits from central China (An et al., 2000; Kukla et al., 1990). Owing to the short record from UV1, this study only demonstrates EAM changes following part of the precession cycle during the mid Holocene.
Solar modulation
Solar activity is one of the possible controlling factors for EAM changes at the millennial timescale. One proxy used to reflect solar modulation (cosmic ray flux) is 10Be concentration in ice cores (Masarik and Beer, 1999; Raisbeck et al., 1990). Studies show that high 10Be concentrations can be attributed to lower solar shielding and consequently to a lower solar activity (Finkel and Nishiizumi, 1997; Muscheler et al., 2004). Horiuchi et al. (2008) analysed an ice core at the Dome Fuji station, inland Antarctica, and found that both the concentration and the flux of 10Be increased at the known solar-activity minimums during the past millennia, e.g. Oort (1010−1050 yr CE) and Wolf (1280−1340 yr CE). Finkel and Nishiizumi (1997) suggest that oscillations in the 10Be concentration of the GISP2 ice core indicate changes in cosmic ray flux and thus (activity of) solar output, as production rates at geomagnetic latitudes above 60° are almost completely insensitive to changes in geomagnetic field intensity (Lal and Peters, 1967). Spectral analysis on 10Be (GISP2 ice core) indicates two significant periodicities of 2475 years and 1125 years (significance level > 99%; Figure 7b), which is similar to the two periodicities (2514 and 1408 years) derived from δ13C (Figure 7a). The similar periodicities at millennial scale, together with a good correlation between de-trended δ13C signal (core UV1) and de-trended 10Be concentration (GISP2, Finkel and Nishiizumi, 1997) (Figure 6e and f) indicate that solar irradiation might be a driving mechanism of EAM variability at millennial and centennial timescales (e.g. Chen et al., 2008).
Although studies have hypothesized several possible correlations between solar activity and the Earth’s climate, the exact process controlling how the EAM responds to insolation change still remains unclear. Haigh (1996) suggested that strong solar output increases UV radiation, resulting in an increase in stratospheric O3. The stratospheric O3 absorbs radiation and heats up the stratosphere, and the heat propagates down into the troposphere. However, whether the stratospheric heat is strong enough to pass down through the atmosphere far below still needs further investigation. Carslaw et al. (2002) proposed the ‘cosmic ray-cloud effect’ to explain the link between solar activity and atmospheric processes. Cosmic rays are charged particles with very high energy. Charged particles can move freely along with the magnetic field lines, but not when its track is transverse to the field lines. On their way to the Earth, cosmic rays must cross through interplanetary (IP) magnetic fields, and thus, the stronger IP magnetic field will result in less cosmic rays arriving at the Earth. The strength of the IP magnetic field at solar maxima is almost 1.5 times that at solar minima (Yuming Wang and Tengfei Zhang, personal communication, 2011). Therefore, stronger solar activity will result in fewer cosmic rays reaching the Earth, which is then correlated with a reduction in cloud cover (Parker, 1958). One possible mechanism for the cosmic ray-cloud effect is suggested by Yu and Turco (2001). Cosmic rays, with their high energy, are able to ionize the atmospheric molecules during the collision, which results in charged molecular clusters. These clusters then work as the condensation nuclei for the cloud formation. Thus shortage of cosmic rays during periods of strong solar activity will discourage cloud formation, and result in higher solar radiation reaching the Earth, resulting in higher Earth surface temperature (Carslaw et al., 2002). As a high 10Be concentration has been found to be related to periods of low solar activity during past millennia at centennial timescales (e.g. Finkel and Nishiizumi, 1997; Horiuchi et al., 2008; Muscheler et al., 2004), the Earth surface temperature would be low during periods of low solar activity indicated by high concentration of 10Be in the GISP2 ice core (Figure 6e; Finkel and Nishiizumi, 1997). Thus, it is possible that at the millennial timescale, solar activity might influence the EAM through changing the Earth surface temperature, and resultant changes in strength of the Siberian High. The Siberian High becomes strong during periods of low solar activity, resulting in strong winter monsoons of low precipitation (e.g. An, 2000). For example, dry and wet periods indicated by de-trended δ13C signal (Figure 6e) are coherent with low and high solar activity indicated by 10Be concentration (Figure 6f).
Solar forcing seems to explain most of the fluctuations observed in this study, however, correlation between EAM and insolation breaks down from 4500 cal. yr BP to 3500 cal. yr BP. Strengthened solar activity around 3930 cal. yr BP indicated by low 10Be concentration (Figure 6f), might result in the wet event around 3990 cal. yr BP indicated by high δ13C (Figure 6e). Solar activity the weakens gradually until c. 3300 cal. yr BP (indicated by increasing 10Be concentration, Figure 6f), and correspondingly, the EAM weakens generally.
Other forcing
Decadal to centennial fluctuations in EAM might be due to other forcing, such as high-latitude IRD events (Figure 6g and h). Changes in solar activity have been suggested as a possible forcing mechanism for millennial-scale cooling events in the Northern Atlantic area, such as the North Atlantic ice-rafted debris (IRD) events (Bond et al., 2001). Such correlation is supported by comparison of de-trended 10Be (Figure 6f) and de-trended hematite-stained grain concentration (HSG, Bond et al., 2001) in the North Atlantic sediments (Figure 6g). These changes in the North Atlantic lead to enhanced strength of the Siberian High (Bianchi and McCave, 1999; Rohling et al., 2002) which, in turn, can lead to reduced EAM precipitation. Connection between the IRD events and the EAM is supported by good consistence between de-trended HSG (Figure 6g, Bond et al., 2001) and de-trended δ13C (Figure 6e). For example, three key IRD events from the North Atlantic during the mid Holocene, at 5900−5800, 4300−4100 and 2800−2700 cal. yr BP (Bond et al., 1997; black bars numbered 2, 3 and 4 in Figure 6g) appear to correlate with dry events observed in the Pearl River area, at around 5700, 4300 and 2700 cal. yr BP (black bars in Figure 6e). Dry events observed in UV1 are slightly delayed compared to IRD events suggested by Bond et al (2001). This might be due to the time lag between vegetation change and climate change (likely to be 100–200 years), and the UV1 record is based on vegetation signal.
However, in addition to the dry events addressed above (black bars in Figure 6e), there are other dry events lasting 100−300 years suggested by δ13C (grey bars in Figure 6e). These additional dry events seem to be consistent with low solar activity (Figure 6f), while none of them is correlated with IRD events. These additional dry events might be linked to some regional forcing such as ENSO and possibly high-frequency and low-amplitude changes in the sea level.
Correlation between high-latitude cooling events and the EAM at centennial timescales is supported by the δ18O record from stalagmites (Figure 6h, Wang et al., 2005). Wang et al. (2005) suggested good correlation between EAM and IRD events during the Holocene, suggesting a possible connection between EAM and high-latitude cooling events. However, comparison between the Pearl River estuary δ13C record, and the δ18O from the Dongge Cave, reveals some obvious mismatches. The δ13C from UV1 indicates two significant dry periods around 5700 and 3500 cal. yr BP, respectively (Figure 6a), while δ18O from Dongge Cave does seem to suggest a cool period around 5700 cal. yr BP and no obvious change around 3500 cal. yr BP (Figure 6c). It is particularly noticeable that the correlation between our Pearl River estuary record (Figure 6e) and the Dongge Cave stalagmite record (Figure 6h) at a millennial timescale seems to be weak compared with the correlation between the Pearl River estuary, 10Be concentration and HSG records (Figure 6e, f and g). Comparison between δ13C and 10Be suggests the two dry periods (~5700 and ~3500 cal. yr BP) might be due to low solar activity (Figure 6e and f), while the δ18O stalagmite record might be more sensitive to local scale variability and thus does not catch up these changes (Figure 6h).
Conclusion
Results from this study suggests that the East Asian Monsoon experienced a general weakening between 6650 and 2150 cal. yr BP. Superimposed on this trend are wet/dry oscillations at millennial to centennial timescales, with major millennial periodicities of about 2500 years and 1400 years, and centennial periodicities of 770 years and 480 years. Our data support the view that orbital-induced precession forcing is the primary controlling mechanism for the monsoonal variability during the Holocene, while solar modulation is a significant forcing for wet/dry oscillations at millennial timescales. Solar activity influences the EAM by changing the strength of Siberian High at millennial timescales (also influencing the North Atlantic through IRD events). Results of this study are supported by other records, especially the high-resolution stalagmite record from Dongge Cave (Wang et al., 2005). However, mismatches between millennial cycles from the δ13C record presented here and the Dongge Cave δ18O stalagmite record suggest the Dongge Cave might reflect more local conditions, while δ13C presented here reflects broader climate conditions.
Footnotes
Acknowledgements
We thank two anonymous reviewers for valuable comments and suggestions for improvement of this manuscript. We acknowledge staff at the RCL and NIGL for their analytical support.
This research was part of the PhD project sponsored by NERC/EPSRC (UK) through the Dorothy Hodgkin Postgraduate Award (to FY). This research was also supported by the University of Durham through a special research grant (to YZ), the NERC Radiocarbon Laboratory Steering committee (1150.1005) (to YZ) and the NERC Isotope Geosciences Facilities Steering Committee (IP/883/1105) (to YZ) and a research grant from the Research Grant Council Hong Kong (HKU707109P) (to YZ). This research was also supported by the Research Grants Council of the Hong Kong SAR through research grants HKU7058/06P and HKU7052/08P (to W.W.-S. Yim). We also acknowledge support from the University College (Durham University) to complete fieldwork and laboratory visits.