
Abstract
The woodland history of the forest of Stodthagen (northern Germany) was investigated by using complementary palaeobotanical indicators. Six soil profiles from the study plot were sampled, the wood charcoal pieces extracted from the soil samples were quantified, taxonomically identified, and some were radiocarbon dated. Peat sequences from a small adjacent mire were also sampled and the pollen, microcharcoal, and macrocharcoal were analysed. The pollen record shows a continuous forestation during the Holocene, with small indication of a disturbance phase during the late Holocene. This continuity of the woodland presence is confirmed by the weak quantity of macrocharcoal, indicating that fire did not have a serious impact during the Holocene in terms of canopy opening, despite the identification of three local fire events. However, large amounts of wood charcoal pieces were found in the soil samples allowing the identification of at least one more fire event, dated in the Iron Age, unrecorded in the charcoal signal from the peat sequences. The taxonomical charcoal assemblage is in agreement with the pollen data. This innovative multiproxy approach allows the assessment of the ancient and continual presence of a woodland at the study site, which highlights the biological and patrimonial interest of the area and justifies the ongoing conservation management of the woodland.
Keywords
Introduction
The Holocene vegetation history of Central Europe has been studied extensively, providing information about the major temporal and spatial patterns of vegetation dynamics linked to climate and/or human determinism (e.g. Berglund et al., 1996; Birks, 1993; Kalis et al., 2003; Lang, 1994). However, there are still many open questions, especially in the case of the assessment of the Holocene fire history in Central Europe. Long-term fire history investigations in Central Europe are rare. Moreover, most of the existing knowledge is based on the analysis of charcoal-signals combined with palynological studies (e.g. microcharcoal counting on pollen slides, Clark et al., 1989). Nevertheless, this approach provides reliable and relevant data, which allows to conclude that ecosystems of Central Europe burnt in the past (under oceanic and continental climate as well), even if they are less ‘fire sensitive’ than, e.g., Mediterranean and Boreal biomes (Carcaillet et al., 2002; Power et al., 2008). In that context, human practices (i.e. fire ignition and /or fire usage) had an important role in the past fire regime (Berglund, 2011), at least since the Neolithic and following the Human development (Goldammer and Page, 2000), but also during older phases (e.g. Mason, 2000). However, despite this general assessment, there is still a lack in fire history investigation analyzing charcoal records in depth, especially from natural archives, using modern investigation methods (e.g. Higuera et al., 2010). This is an important issue for understanding past ecosystem dynamics, since fires might be one of their important drivers, as disturbance events (Pickett and White, 1985).
Another important current issue of palaeoecological approaches is how they can contribute to the sustainable management, conservation and/or restoration of ecosystems. In the context of the current ecosystem threats (e.g. global warming, Intergovernmental Panel on Climate Change (IPCC), 2007; diminishing biodiversity, Giam et al., 2010), the role of palaeoecological studies is to contribute to the understanding of the long-term dynamics of ecosystems and provide data able to contribute to sustainable management and/or conservation of the ecosystem (Birks, 1996; Callicott et al., 1999; Willis and Birks, 2006). However, one characteristic of palaeoecological data is to be segmented. A single proxy provides restricted information about an ecosystems’ history. In this context, multiproxy approaches are essential, providing a more complete reconstruction of the past dynamics of ecological systems (e.g. Birks and Birks, 2006; Mazier et al., 2009).
It this paper, we present a palaeoecological multiproxy investigation of the Holocene woodland dynamic and fire history of a woodland, under a biological conservation act, combining pollen analysis, sedimentary anthracology (i.e. micro- and macrocharcoal records), and pedoanthracology. Such combination of methods is, for the first time, applied on the forest stand scale to (1) assess the occurrences of fires and their potential impact on woodland dynamics by (2) the reconstruction of the history of a forest in fine spatial resolution, including the question of Holocene woodland continuity. Therefore we aimed to test whether such multiproxy analysis can provide new insight into fire history. Based on this multimethodological approach, we discuss the potential source of fire, i.e. whether they were ignited by natural or human forcing.
Study area
The Stodthagen Forest is situated in the eastern part of Schleswig-Holstein (northern Germany, N54.25/E10.03), in northern Central Europe (Figure 1). This is the biogeographic domain of temperate deciduous forests with an oceanic climate (annual rainfall average: 880 mm, annual temperature average: 9.1°C; Deutscher Wetterdienst, 2008).
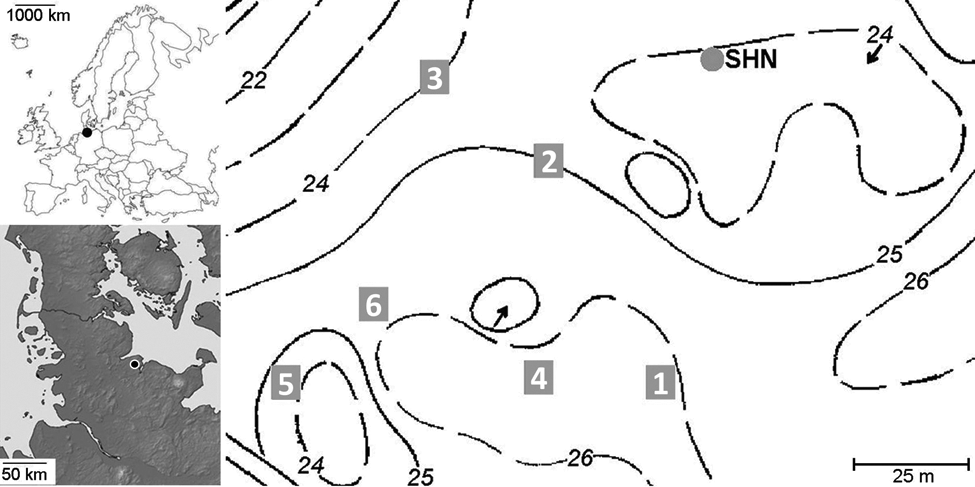
Study area Stodthagen Forest (Northern Germany). Left above and below: localization of the study site (black dot). Right: topographical map with elevation isolines (1 m resolution). Number in grey squares: soil samples location. Grey circle: peat coring location
During the maximum of the Weichselian glacial this area was covered by ice. The ice withdrawal left a heterogeneous microtopography on a young-moraine substratum (Nelle and Dörfler, 2008), producing numerous small mires embedded in a slightly hilly landscape with elevations between 20 m and 30 m a.s.l. These small mires have an area of less than 500 m2, and are not totally covered by the forest canopy. The small mire which was cored twice is about 250 m2, with a canopy opening over it of about 100 m2.
The forest area under study is owned by the ‘Stiftung Naturschutz’ and has been managed for ecosystem conservation since 1994. Prior to this, the area was managed for timber production and some exotic tree species (e.g. Picea abies, Picea sitchensis) were planted and are still present today. However, nowadays the woodland is dominated by beech (Fagus sylvatica), with some oaks (Quercus robur), ash (Fraxinus excelsior), birch (Betula spp.), maple (Acer pseudoplatanus) and alder (Alnus glutinosa).
Methods
Pedoanthracology
Six soil profiles, separated by about 50 m, have been dug in the immediate vicinity (max. c. 60 m) of a small mire (Figure 1). Soil samples were taken on each profile, for continuous 10 cm arbitrarily fixed layers (0–10 cm, 10–20 cm, etc., up to 60–70 cm), from the bottom to the top. The bottom of the soil profiles correspond to the presence of a compact soil horizon (i.e. compacted sand) or to the presence of the water-table level. Between 5 and 10 l of soil was collected per layer. Wood charcoal pieces bigger than 1 mm were extracted from the soil samples by wet and dry sieving, providing the ‘megacharcoal’ signal. Charcoal assemblages made of pieces smaller than 1 mm were not taken into account in this investigation, since they are usually too small for taxonomical identification. We expressed the total soil charcoal richness in charcoal concentration per unit of sediment: specific anthracomass (SA), in mg/kg. This is the dry weight in mg of wood charcoal pieces bigger than 1 mm, divided by the dry weight of either soil profile (SAP), or layer (SAL), in kg (Carcaillet and Thinon, 1996; Talon, 2010). This provides comparable quantitative data. We also got comparative data for the pedoanthracological taxonomic assemblages. Part of the charcoal fragments extracted from soil samples were taxonomically identified with a stereo lens (Nikon SMZ1500, magnifications ×7.5 to 112.5) and an episcopic microscope (Nikon ME600, ×100, ×200, ×500), based on wood anatomy atlases (Schweingruber, 1990a, b) and on the carbonized wood reference collection of the Institute for Ecosystem Research (Christian-Albrechts-University of Kiel). For every sample 90 pieces of charcoal (or the total amount of charcoal pieces if less than a total of 90 pieces) have been randomly selected equitably shared in different size classes: > 5mm, 5–2 mm, and 2–1 mm (i.e. 30 charcoal pieces per class of size), for microscopic analysis. We express the results of the taxonomic analysis in concentration: specific anthracomass per taxon (i.e. SAT in mg/kg). SAT is the dry weight of a taxon in one sample (all size classes added up) in mg, divided by the dry weight of earth of the corresponding sample in kg. We observed the SAT per layers of all the profiles of sampling cumulatively, by doing a principal component analysis of the data set in a correlation matrix, including 11 variables corresponding to the identified taxa. Before running the PCA, the overall SAT data set was centered and standardized to make the data comparable. This allowed us to analyze together large charcoal amounts and small charcoal records. These data sets have been correlated to the depth of sampling on the six soil profiles, which are the ‘explicative parameters’ of the analysis. Because of the various depth of sampling we separated the data set in two different PCA: one with the SAT from the deepest profiles of sampling (STO1, 3 and 5; with seven ‘parameters’: A/0–10 cm, B/10–20 cm, C/20–30 cm, D/30–40 cm, E/40–50 cm, F/50–60 cm, G/60–70 cm) and another one with the data set from the less deep profiles (STO2, 4 and 6; with four ‘parameters’: A/0–10 cm, B/10–20 cm, C/20–30 cm, D/30–40 cm).
Macrocharcoal analysis
A peat sequence was cored in 2004, from one of the small mires of the study site, for pollen and microcharcoal analysis (Rickert, 2006). A second peat sequence ‘SHN’, about 1 m distant from the first coring location was cored in 2008 to obtain additional material. Both corings were done with a rod-operated Usinger piston corer, which enables the retrieval of 1 m long and 80 mm diameter round undisturbed cores (Mingram et al., 2007).
One longitudinal half of the most recent core was used for macrocharcoal analysis, following the ‘Oregon sieving method’ (Millspaugh and Whitlock, 1995) and using a digital picture treatment to obtain quantitative measurement (Mooney and Radford, 2001). Samples of 5 cm3 were taken continuously every 1 cm along the core, treated with 75 ml of sodium hypochlorite solution (NaOCl 13%) during 24 h and sieved using a 200 µm mesh. Then, the samples were sorted with a stereo lens (magnification ×10 to ×110) to keep only charcoal pieces. The samples were digitally photographed with identical camera settings, and digitally analyzed with the Scion Image Program (Scion Corporation) to obtain the number and the surface area of macrocharcoals (density slice function; Mooney and Black, 2003). It is a matter of debate whether the quantification of the charcoal should be based on the number or on the area of charcoal pieces per sample. Indeed, the quantification based on the counting of charcoal pieces might be a limiting factor, since secondary fragmentation might bias the signal (Ali et al., 2009). However, the strong correlation (i.e. R2 = 0.98), of the linear regression between the amount of charcoals (no/cm3) and the charcoal area (mm2/cm3) per sample of the investigated peat sequence, indicate that the number and the area of charcoal pieces follow comparable trends. Therefore, we quantified the macrocharcoal record with the program CharAnalysis 0.9 (Higuera, 2009; Higuera et al., 2009), which allows us to model charcoal records along interpolated temporal series based on the counted number of macrocharcoal pieces (Higuera, 2009). Thus, the charcoal concentration per cm3 was estimated based on the macrocharcoal counting and was multiplied by the growth rate of the peat sequence (cm/yr) to get the macrocharcoal accumulation rate. The low-frequency trends (i.e. ‘background’, Cback, reflecting rate changes of charcoal formation, secondary deposit, sediment mixing) was estimated in the interpolated macrocharcoal signal (i.e. Cint), with a weighted regression with a window of 500 yr. Local fire events were identified based on macrocharcoal peak identification, while removing the low-frequency trend from the interpolated macrocharcoal signal (i.e. Cpeak = Cint − Cback).
Pollen and microcharcoal analysis
The other longitudinal half of the most recent peat sequence was used for pollen and microcharcoal analysis. The new pollen data was correlated with the comprehensive description of the forest history based on the detailed pollen diagram and additional analysis of plant macrofossils given in Rickert (2006).
Peat samples of 1 cm3 were treated according to standard methods (Faegri and Iversen, 1989), including the use of hot KOH and acetolysis. Pollen, spores and microcharcoals (i.e. >10 µm) were counted on microscopic slides with a light microscope (magnification ×400 and ×1000). The nomenclature for pollen types follows Beug (2004). A minimum of 300 arboreal pollen (excl. Corylus) were counted per sample. The calculation of the pollen-percentage values is based on the sum of arboreal pollen. Calculations and diagrams were done with TILIA and TGView (Grimm, 1993).
Radiocarbon dating
Eight taxonomically identified single wood charcoal pieces from soil samples were dated by AMS-14C (noted STO; Table 1). They were selected according to their position in the soil profiles, their size, their taxonomical significance and the general charcoal quantities and taxa distribution in their respective charcoal assemblages. Four peat samples (noted SHN; Table 1), and a single wood charcoal piece (i.e. SHN63) from the 2008 sequence were also dated.
AMS-14C dates from single charcoal pieces from soil samples (STO) and from the peat sequence (SHN) (Leibniz-Laboratory for Radiometric Dating and Stable Isotope Research,University of Kiel, Germany). *2σ calibrated with Oxcal 4.1.56 (Bronk-Ramsey, 2010)
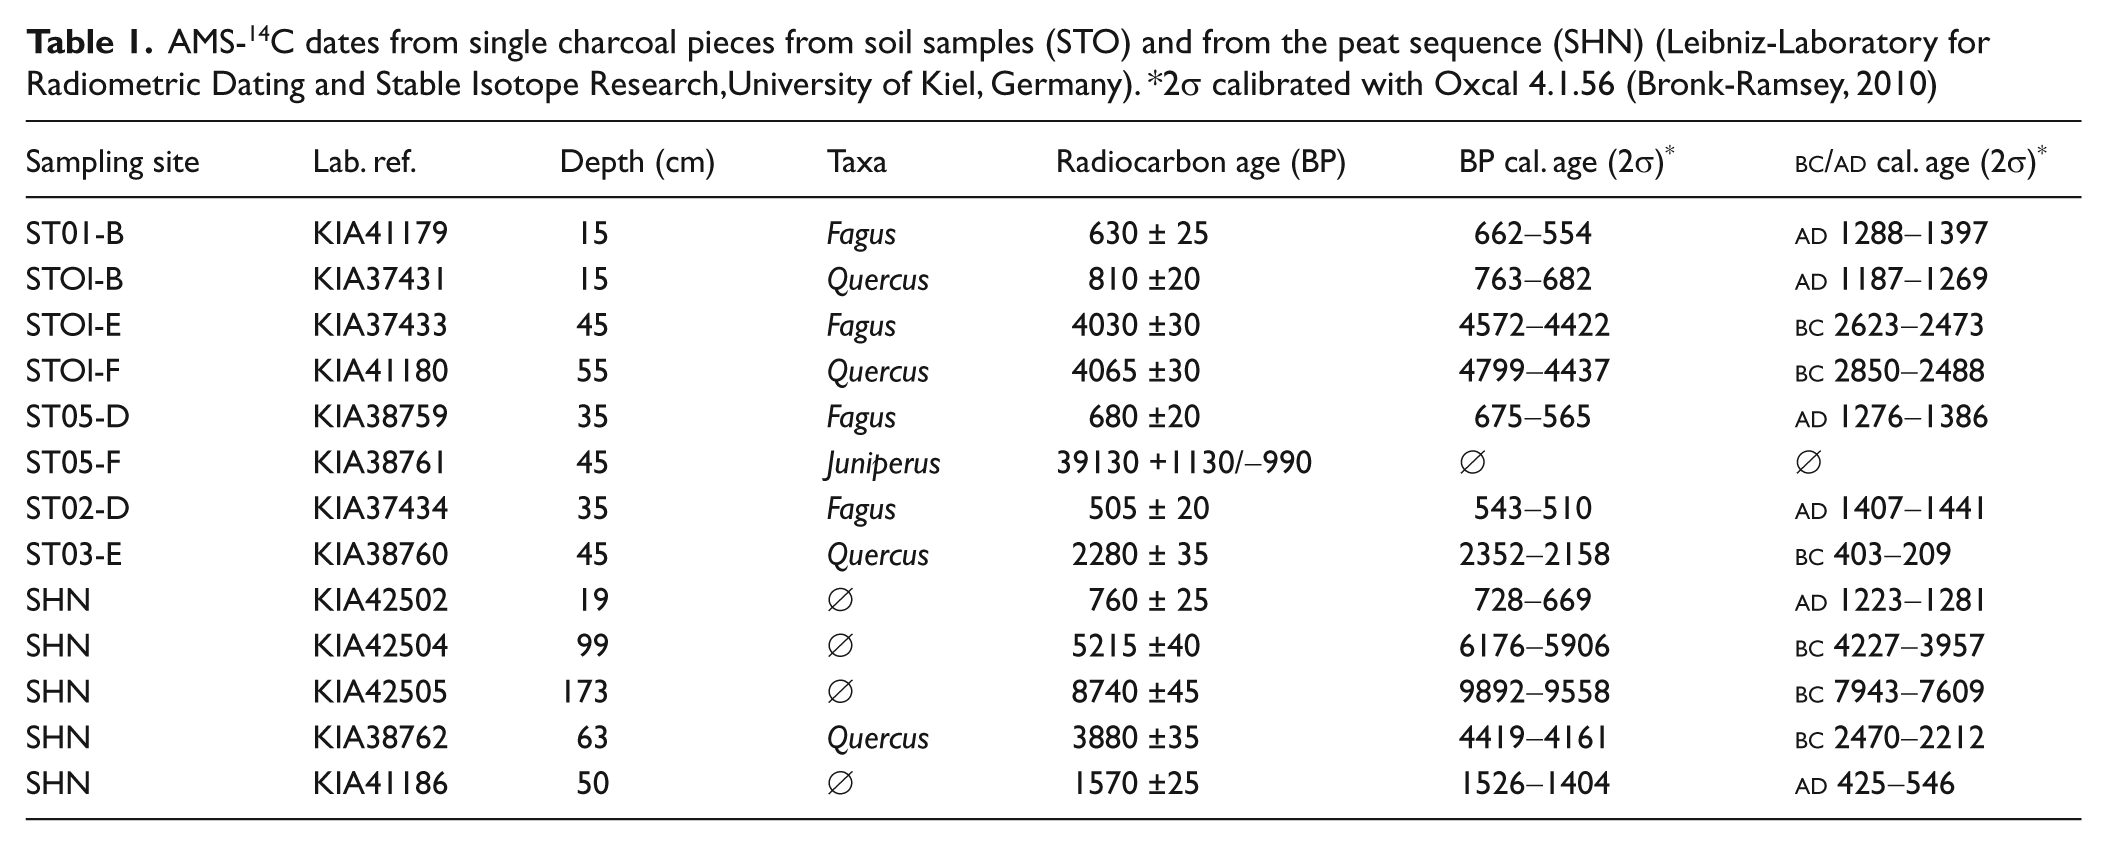
The radiocarbon ages were calibrated with a 2σ confidence interval, using the Oxcal 4.1.56 program (Bronk-Ramsey, 2010) and the IntCal09 data set (Reimer et al., 2009).
The relation age/depth of the peat sequence was modeled based on the five SHN calibrated AMS-14C dates, using the tool ‘deposition model’ of the Oxcal 4.1.56 program (P_sequence modeling with a ‘k’ value of 1 cm-1; Bronk-Ramsey, 2008).
Results
Pedoanthracology
In total, 38.8 g of wood charcoal was extracted from 236 kg of sampled soil. The profiles 1 and 2 are particularly rich in charcoal. Profiles 3 to 6 contained lower amounts. The Specific Anthracomass per Layer (SAL) of the different profiles shows a pronounced heterogeneity (Figure 2). However, the three profiles which were sampled in greater depth (P1, P3, P5) showed low SAL in the deeper layers.
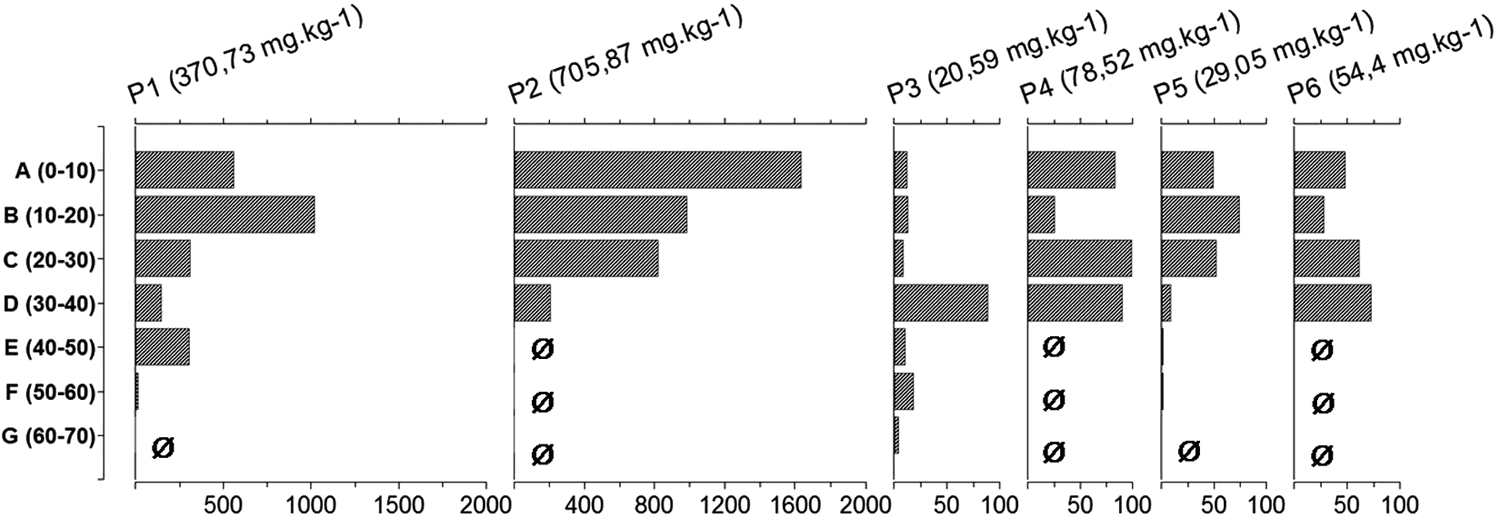
Wood charcoal total quantities per layer for the six soil profiles of Stodthagen Forest. x-axis: anthracomass in mg/kg; y-axis: layer name and depth in cm. Ø, no sample
From the total amount of extracted charcoal, 1922 pieces, or 18.9 g, have been taxonomically analysed. From this amount, 358 pieces were indeterminable (about 5% of the extracted charcoal weight), mainly because of their small size. The ratio ‘total weight of the wood charcoal pieces analyzed/total number of the wood charcoal pieces analyzed’ provides an average weight per fragment of c. 10 mg. Because of this small average weight/size some pieces have been identified to a limited taxonomical type (e.g. ‘cf. Carpinus’).
Nevertheless, 11 taxa were identified (Figure 3). In all the six profiles, the two clearly dominant taxa are Quercus and Fagus. Other taxa present a small amount and are irregularly distributed in the different profiles and at different depths (Acer, Alnus, Carpinus, Corylus, Tilia). Low SAT of conifer type was identified in P6. Only one piece of Juniperus was identified in P5. Fraxinus and Betula have more important SAT, but are also irregularly distributed among the profiles and the layers. Moreover, in the PCA (Figure 4) we principally observed that in both plotted data sets the Fagus record, with Alnus, is connected to the upper layers A, whereas Quercus and Corylus seems to be more connected to the layers B and C. The Betula layers richness distribution seems to be correlated to the upper layers (A, B and C), and the one for Acer seems to be connected to layer D and, when considering the deeper layers of sampling, to layer G.
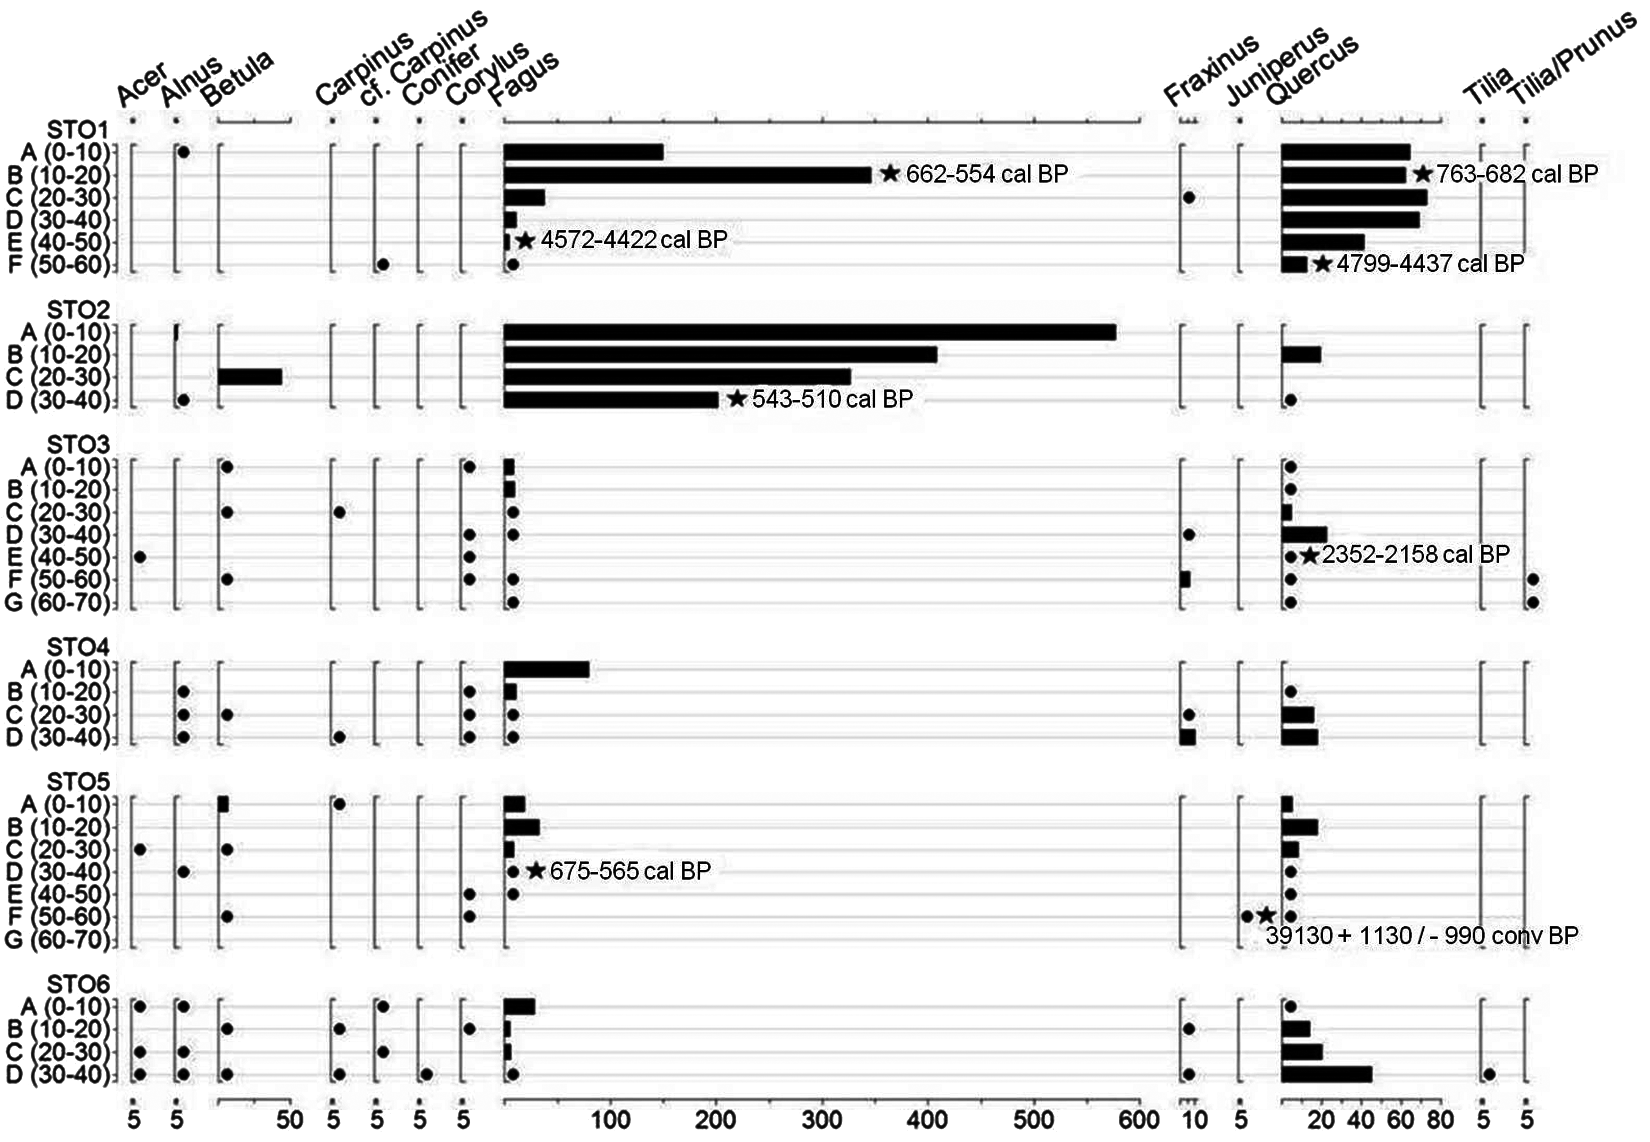
Wood charcoal total quantities identified per taxa (SAT), for the different layers of sampling of the six soil profiles of Stodthagen Forest. x-axis above: identified taxa; x-axis below: anthracomass in mg/kg; y-axis: profile name and layers of sampling in cm; dot: SAT < 5 mg/kg; star: radiocarbon dates in calibrated years BP

Principal Component Analysis of the identified taxa in soil charcoal assemblages of the Stodthagen Forest, compiled per layer of sampling: (A) from deep soil profiles (n=7 layers of sampling, A, 0–10 cm; B, 10–20 cm; C, 20–30 cm; D, 30–40 cm; E, 40–50 cm; F, 50–60 cm; G, 60–70 cm, and p=11 identified taxa all samples cumulatively); (B) from short soil profiles (n=4 layers of sampling, A, 0–10 cm; B, 10–20 cm; C, 20–30 cm; D, 30–40 cm, and p=11 identified taxa all samples cumulatively). The eigenvalues per components are presented in the upper-right corner. Plotted by PAlaeontological Statistics software, version 1.90 (Hammer, 2009)
Four of the radiocarbon dates correspond to the Middle Ages (three pieces of Fagus and one of Quercus), one piece of Quercus is from the Iron Age, and two pieces are from the Bronze Age (one Fagus and one Quercus piece). One piece of Juniperus dates from the Weichselian glacial time.
Macrocharcoal analysis
Macrocharcoal pieces were present in only 15 samples out of a total of 218 1-cm samples of the total length of the peat sequence. Macrocharcoal accumulation happened only rarely during the Holocene. The age/depth relation indicates different peat growth rate phases along the time span covered by the peat sequence (Figure 5). According to this age model, the macrocharcoal signal indicates weak charcoal accumulation during the Preboreal, the Atlantic, and the Sub-Aatlantic phases. A richer macrocharcoal accumulation is recorded during the Sub-Boreal at a depth of 63 cm (i.e. charcoal pieces dated at 4419–4161cal. BP).

Age/depth modeling of the second peat core ‘Stodthagen 2’ (SHN). x-axis: age in cal. yr BP, with the 2σ confidence interval plotted for all of the five dates. y-axis: depth in cm. Plotted by OxCal 4.1.56 program (Bronk-Ramsey, 2010)
Three macrocharcoal peaks have been identified (Figure 6): one during the Sub-Boreal, with an important macrocharcoal accumulation, and two others during the Sub-Atlantic (i.e. about 380 cal. BP and 544 cal. BP, based on the peat growth rate).
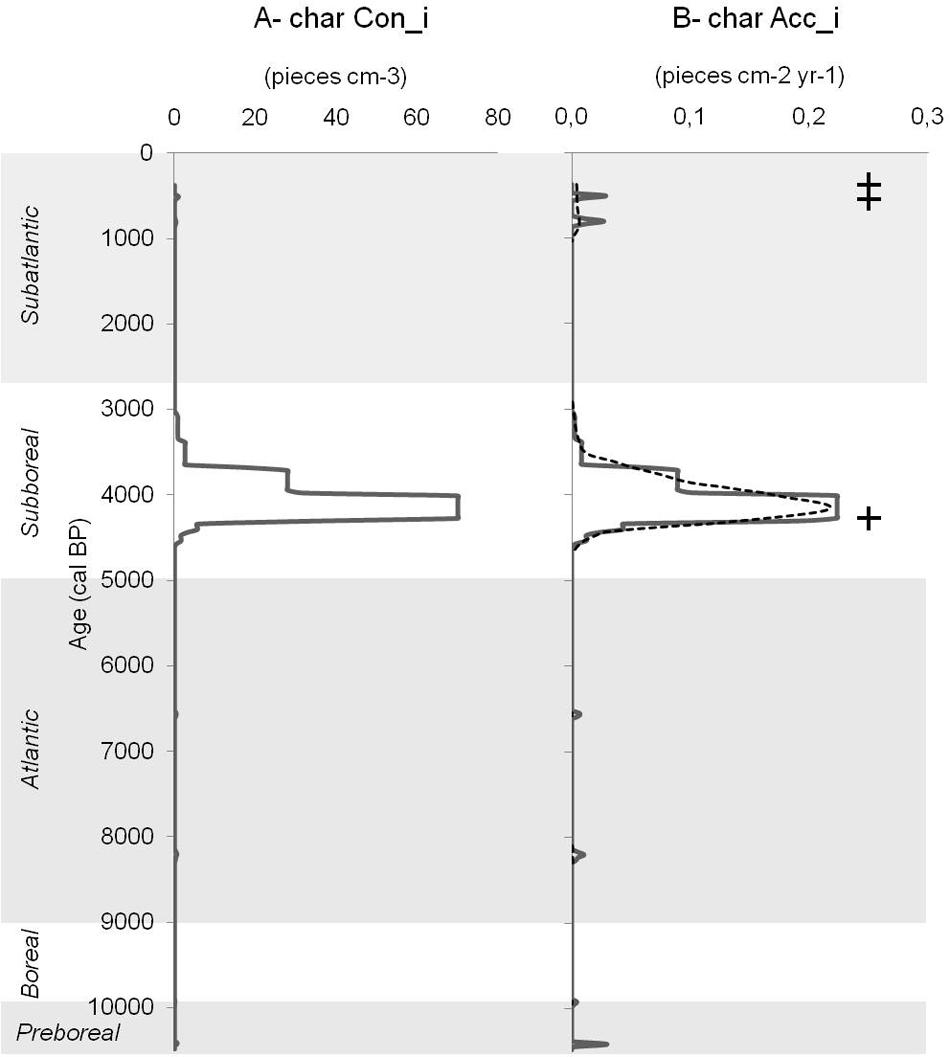
Macrocharcoal signal of the peat sequence SHN. A- char Con_i, macrocharcoal concentration (x-axis: number of pieces/cm3, ), along time in cal. yr BP (y-axis). B- char Acc_i, full line, macrocharcoal accumulation rate (x-axis), along time in cal. yr BP (y-axis); dotted line, macrocharcoal signal background; plus, fire event.
Pollen analysis and microcharcoal analysis
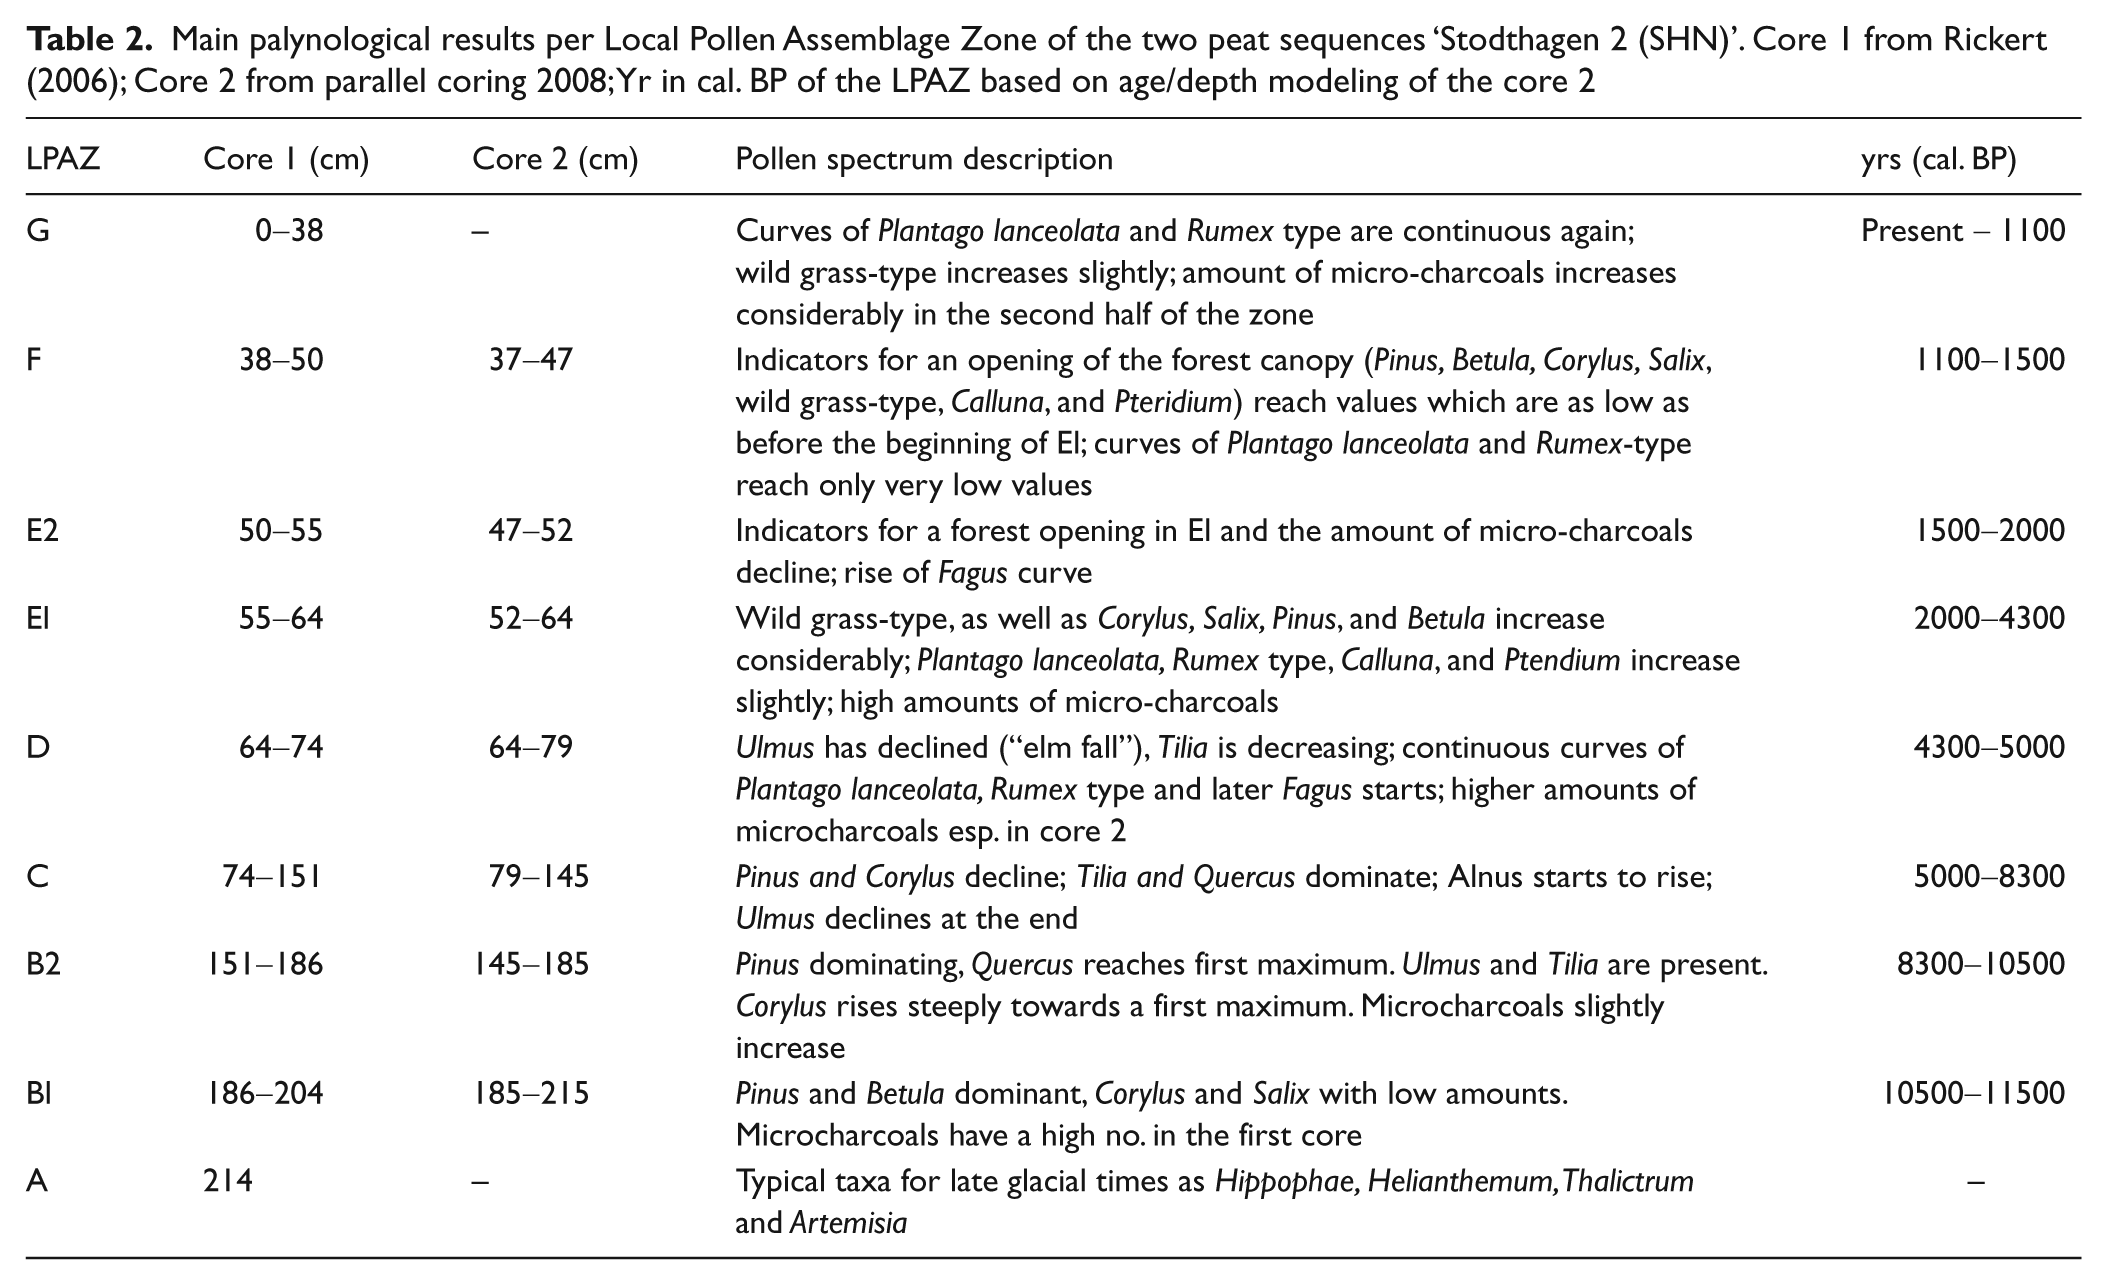
The main palynological information is summarized per local pollen assemblage zones (LPAZ) identified on the two peat sequences in Table 2. Since the age/depth model of the most recent peat sequence (Figure 5) fits to the chronological indication based on the identified Local Pollen Assemblages Zone of the first peat sequence (LPAZ; Overbeck, 1975), we use the LPAZ identified on the two peat sequences to make them fit chronologically (Figure 7).
Main palynological results per Local Pollen Assemblage Zone of the two peat sequences ‘Stodthagen 2 (SHN)’. Core 1 from Rickert (2006); Core 2 from parallel coring 2008; Yr in cal. BP of the LPAZ based on age/depth modeling of the core 2
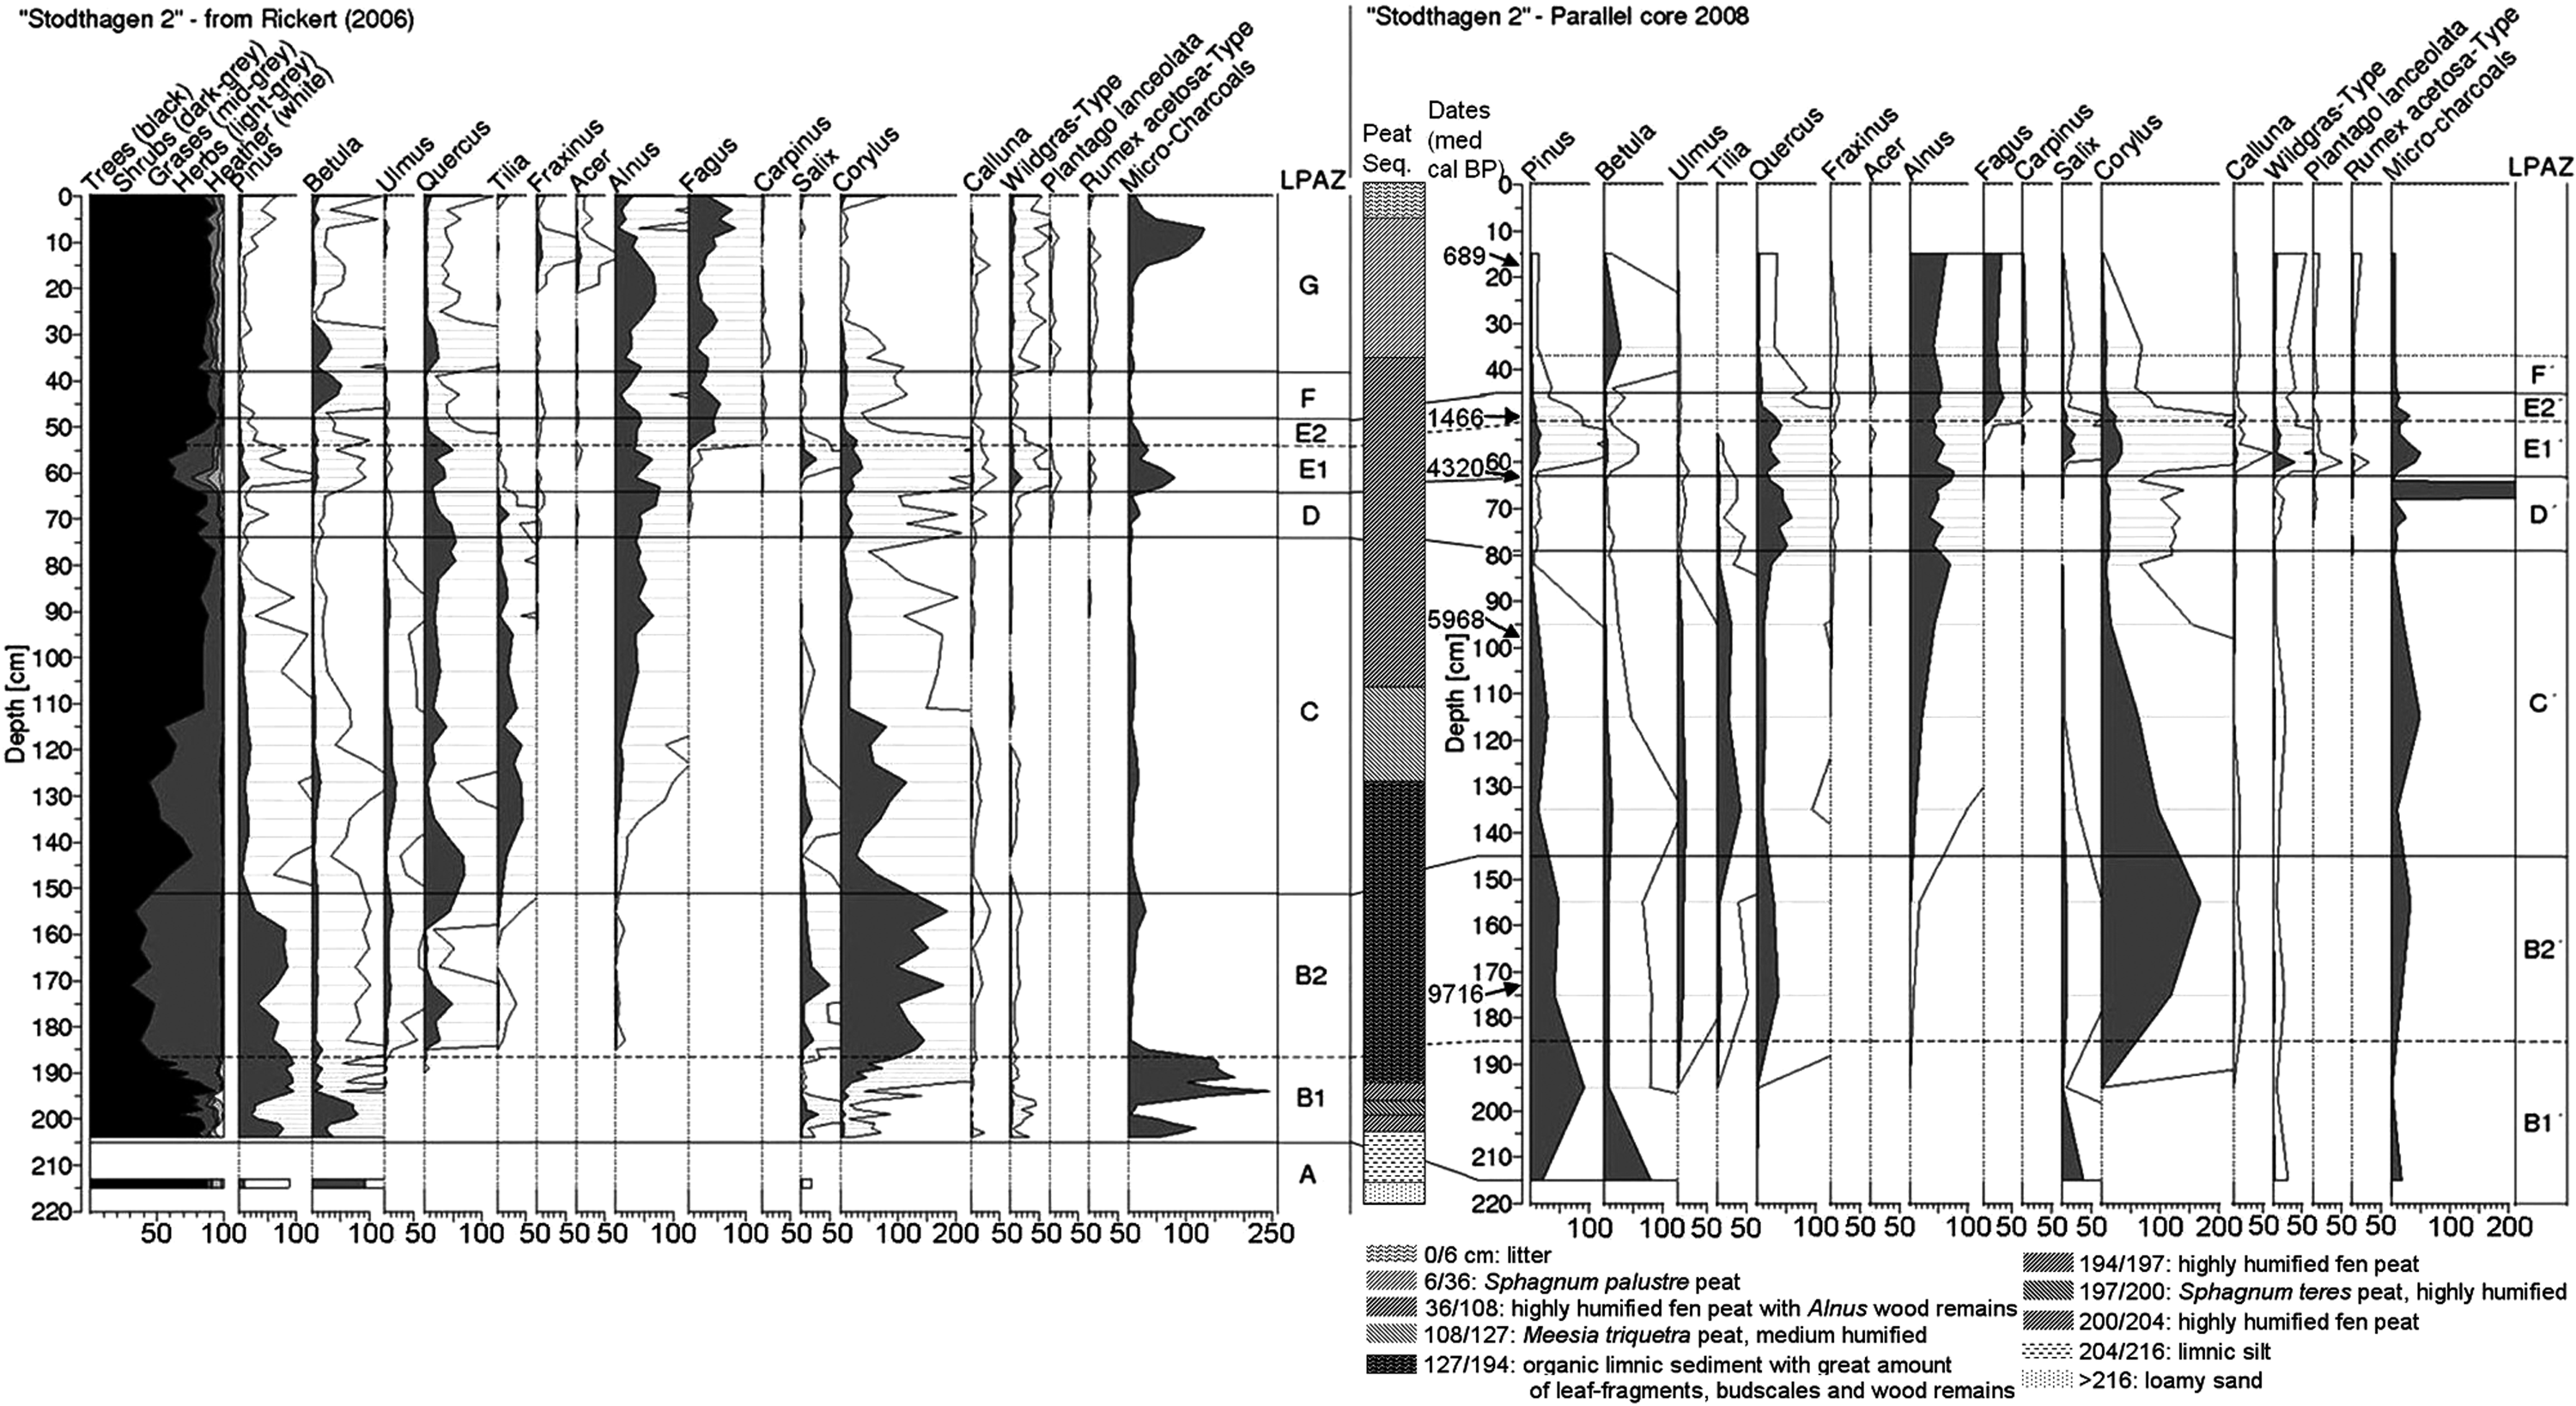
Palynological diagrams of selected taxa. The grey horizontal lines illustrate the connection of the two cores from the small mire SHN along the LPAZ. For the detailed diagram of the first core see Rickert (2006). Date in medium age BP of the calibrated range with 2σ interval
Discussion
Taphonomical considerations
It has been difficult to identify any correlation between soil stratigraphy and vertical distribution of charcoals, especially because the sampled soil profiles did not have clearly marked soil horizons, except for a richer content in organic matter in the upper part (i.e. from the current soil surface to 5/10 cm) and an increasing compactness with depth, from 40 cm (i.e. general soil sequence: O/Ah – Bv; Food and Agriculture Organization (FAO), 2006). However, based on the comparison of the pedoanthracological and the pollen spectra, we assume that vertical charcoal distribution in the soil is globally correlated to age (Figure 3). This is supported by principal component analysis (Figure 4), which principally has shown the correlation of the upper soil layer of sampling to Fagus charcoal richness, and the correlation of the underneath layers to Quercus charcoal richness. Nevertheless, the soil charcoal vertical distribution does not follow a strict age/depth deposition since the soil is a ‘dynamic archive’. Charcoal pieces might be mixed notably because of pedoturbation, bioturbation, and uprooting processes (Carcaillet, 2001; Yeates and Van der Meulen, 1995). Nevertheless, we identified clear patterns (i.e. trends) of the Holocene forest dynamic in the charcoal spectra along the depth, especially the change from oak-dominated to beech-dominated forest. This is why the Pleistocene age of the single identified Juniperus charcoal is unexpected. It does not fit the charcoal taxonomical assemblage of this soil layer. Its presence in the local charcoal record might be due to large-scale transport during ice withdrawal or soil movement connected to Weichselian ice cover fluctuations (Lagerlund et al., 1995; Siegert et al., 2001). This is supported by the rarity of other conifer taxa identified in all pedoanthracological assemblages (Figure 3) and the presence of charcoal pieces dated to the mid and early Holocene from a comparable sampling depth (Table 1). The occurrence of this taxon can also be the indication of the presence of a few Junipers, as pioneers. Juniperus might have grown on-site during a warmer phase of the Weichselian Glaciation (i.e. isotope stages three; Harrison and Sanchez Goñi, 2010; Hubberten et al., 2004).
The flat local relief, with small heterogeneity, and the minimum mesh size of sieving of 1 mm (providing ‘megacharcoals’) allows us to interpret the pedoanthracological assemblage as being relevant locally (i.e. stand-scale resolution; Carcaillet and Thinon, 1996; Touflan et al., 2010). It is very improbable that the charcoals were transported from further away. This is also the case for the macrocharcoals from the peat sequence (i.e. >200 µm; Clark et al., 1998; Scott et al., 2000; Whitlock and Millspaugh, 1996). Pollen and microcharcoal reflect predominantly stand-scale signals as well, because of the small size of the cored palaeoarchive (Bjune et al., 2009; Calcote, 1998; Higuera et al., 2005). However, we do not exclude the recording of regional signals in the peat sequence, especially during the early Holocene, when the surroundings of the mire were not yet densely forested allowing pollen transportation at greater distances.
As can be seen in Figure 5, peat grew more slowly during the Atlantic, with more than 220 yr/cm of peat from 50 to 63 cm depth. Because we did not observe a change in the lithology at this depth (Figure 7), and since the age/depth model fits well to the LPAZ, we assume that the peat cores are complete sequences covering the Holocene without any hiatus. The change in peat growth rate might be due to changes in the hydrological regime of the mire system but no clear data can elucidate this. The modeled ‘top’ and ‘bottom’ ages in Figure 5 have a large 2 sigma range because the layers from which 14C ages were measured are distant from the top and bottom of the core. However, since the indications from the biostratigraphy fit with the modeled peat growth rate, we use that record to give a precise chronology of these parts of the peat sequence. Thus, the beginning of the peat sequence is certainly close to the youngest part of the modeled temporal range (about 11 000 yr BP), and the end is certainly close to the present day, as indicated by the LAPZ.
Forest dynamic and fire history
Early and mid Holocene
According to the pollen data, chronologically referenced by the age/depth model, the area under study was covered by a pine and birch woodland during the early Holocene (LPAZ B). This fits with the global chronological and palaeobotanical regional knowledge (Litt et al., 2001; Overbeck, 1975). Micro- and macrocharcoal amounts are high, indicating relatively high fire activity. These early-Holocene fires should have occurred under climatic control (e.g. lightning and dry phase), as suggested by some studies (Goldammer and Page, 2000; Power et al., 2008).
The steep increase of Corylus pollen accompanied by the beginning of the Ulmus- and the Quercus-curves marks the early-Holocene vegetation change in northwestern European lowlands (LPAZ B1 to B2; Overbeck, 1975) when a still-open oak forest was established. The simultaneous occurrence of Tilia and Alnus around 9000–8500 cal. BP (end of LPAZ B2) seems to be the first manifestation of the immigrating species in the local woodland. From c. 8500 cal. BP onwards, Quercus and Tilia, together with Ulmus formed the arboreal vegetation, while Alnus grew on sites close to the groundwater-table and at the margin of the mire (LPAZ C). Low non-arboreal pollen percentages during the second half of LPAZ C (i.e. mid-Atlantic) indicate a dense forest with just a sparse herbal layer. Tilia and Ulmus are continually declining in the vicinity of the mire. The rarity of these taxa in the charcoal spectra fits well with the absence of any local fire event during the Atlantic according to the macrocharcoal record.
Late Holocene
Quercus and Alnus are the dominating trees since c. 5000 cal. BP (LPAZ D). Alnus is part of the mire vegetation, and Quercus, together with Corylus, is located on the mineral soil. Pollen and soil charcoal spectra both support this fact. Considering that the pollen productivity of hazel is promoted by a more open forest structure (Andersen, 1980), the small increase of the Corylus pollen, together with the first occurrence of Plantago lanceolata, indicates a moderate first human impact, possibly as a small opening. This impact must have been very weak since the tree pollen percentages are still high (80–90%). During the LPAZ E1 (c. 2000–4300 cal. BP), the forest was opened by human activity. Micro- and macrocharcoal records show high accumulation rates. At a depth of 60–66 cm, a layer of charcoal is clearly visible in the second core and is made entirely of Quercus charcoal. This local fire event was dated to 4419–4161 cal. BP (Figure 6). Owing to the restricted horizontal extension of this charcoal layer in the peat (i.e. this charcoal layer is not visible in the first coring sequence), we assume that a burning stem or branch fell onto the mire, and this fire event was probably not intensive since there is no indication at all in the first core (Rickert, 2006). This highlights the heterogeneity of the peat palaeodata archiving, correlated to local situations, even when analysing closely localized peat sequences from the same mire (De Klerk and Hölzer, 2009; Dietz, 2001; Rohrer, 2006). Two other soil charcoal pieces were dated within this time period (Table 1). Considering the possibility of an ‘old wood effect’ on the radiocarbon dating (Gavin, 2001), these dates might be the legacy of the same fire event. Local fires might have opened the canopy. Those fire events are probably connected to human activities since, as different to other biomes, fires in Central Europe are very likely ignited by humans, at least since the Neolithic (Carcaillet et al., 2002; Higuera et al., 2008; Huerta et al., 2009). Moreover, with an oceanic climate prevailing, Sub-Boreal broadleaf forest is very unlikely to burn without the action of humans (Wanner et al., 2008). Tree pollen values drop to a total of 60%. Corylus and wild Poaceae pollen records increase because of more open conditions, which is also supported by the increase of long-distance transported Pinus pollen. However, the opening must have remained local since the amounts of indicators for human impact stay low. There is no evidence for arable fields or clearance of the forest on a larger scale, so the forest continuity seems to remain uninterrupted in this part of the woodland. During the LPAZ E2, decreasing percentages of anthropogenic indicators, as well as those of indicators for forest grazing, and peat macrocharcoals reflect the decrease of human impact and its associated fire disturbances. As a possible consequence, Fagus spread rapidly (Björkman, 1999). This spread of Fagus indicated in the pollen record happened later than the Fagus soil charcoal date of 4572–4422 cal. BP, which is the oldest radiocarbon dated Fagus macroremain so far in Northern Germany. That demonstrates the ancient local presence of Fagus, earlier than expected from the local pollen record, but also from the general knowledge about Fagus immigration in the northern part of Central Europe (Bradshaw et al., 2010; Hannon, 2002; Tinner and Lotter, 2006). Since the pollen records show only a few grains of Fagus during this period, we assume that only a few beech trees were present in the oak-dominated forest, which were hardly recorded in the pollen archive. Moreover, based on pollen indication, the opening of the woodland seems to have, in the long term, favored Fagus development. We observe that, after the fire event of the Bronze Age, detected at a local scale (Figure 6), the woodland stayed at a low forest density, maybe maintained by human activites, for a possibly long period until the forest canopy closed again especially because of the development of Fagus (Figure 7). At a larger scale, the development of Fagus corresponds well to the early Sub-Atlantic transition from an oak forest to a beech forest generally found in Northern Germany (Nelle and Dörfler, 2008), in Denmark (Hannon et al., 2000), and in southern Sweden (Berglund et al., 2008), as well as in Central Europe (Berglund et al., 1996, Kalis et al., 2003), which is also clearly identified in the pollen record of this study. This transition is also clearly visible in the pedoanthracological assemblages (Figure 3). During LPAZ F, a dense forest prevailed, probably little, or not affected by human activities. The recovery of forests and the onset of beech-dominated forests is common for Northern Germany during the Migration Period. This reflects the decline of the human population during this time of deteriorating climate (Dressler et al., 2006; Wiethold, 1998). In contrast, the Middle Ages show an important increase in microcharcoal accumulation rates, two macrocharcoal peaks in the peat cores are identified as local fire events (LPAZ G). Four soil wood charcoal pieces were also dated to Medieval Times. There are no signs of an opening of the forest canopy in the pollen record; it must be assumed that the woodland in the vicinity of the small mire was not affected by the occurrence of these two recorded fire events. This is also the case for a local fire event which was identified by the dating of a wood charcoal piece from soil during the Iron Age, which was not observed in the peat sequence as neither micro- nor macrocharcoal. Though we have only one piece of chronological evidence for this fire event, the dating illustrates that a fire of whatever source produced this charcoal piece. Moreover, the general soil charcoal distribution over the study site and the similarities in terms of the charcoal taxonomic assemblages of the samples of the different profiles, allow us to rule out the possibility of a single ‘campsite fire’ as an explanation for the signal. The small charcoal signal, and the heterogeneity in the amount of charcoal and in the chronological indication, might also be due to the fact that the charcoal recording depends on the type of fire. Indeed, variability in fire regime potentially changes the charcoal formation (especially fire magnitude, surface extension, and frequency), and thus might change the charcoal accumulation and conservation (Scott and Damblon, 2010). One possibility is that the fire events which formed the charcoals conserved in the soil were limited in intensity and extent, and might have been driven by humans to manage the landscape as was done over most of the continent during the late Holocene (e.g. Carcaillet et al., 2002; Tinner et al., 2003; Valsecchi et al., 2010). Higuera et al. (2005) postulated that this type of fire does not have enough severity to be always clearly recorded, even in a small-hollow (Gardner and Whitlock, 2001; Niklasson et al., 2002). However, the reasons for the formation of the charcoal remain a matter of debate. This highlights the relevance and the importance of the use of a multiproxy approach at a stand scale.
Conclusion
The combined approach of this investigation provides complementary data at various spatial scales, showing a high potential for reconstructions of Holocene woodland history. It is especially interesting for the investigation of forest dynamics at the stand scale.
The pollen record indicates the continuity of forestation at the site studied. The soil charcoal spectra is not only in agreement with this indication but complements it by showing the on-site presence of beech earlier than expected from the pollen diagram ‘Stodthagen 2’, as well as from other regional diagrams. Moreover, this multiproxy approach is also valuable for the assessment of the fire history. This shows the identification of fire events based on the pedoanthracological data, which are not recorded in the sedimentary charcoal signal, and vice versa. This investigation provides many data that can be interpreted at a local spatial resolution (i.e. stand scale). These palaeoecological data could be linked to forest conservation action. Indeed, stand scale is the basic spatial unit for forest planning and management. Consequently, assessing the history of a site, it is important to provide data at the corresponding scale, which some proxies, e.g. pollen analysis can do only with some restrictions. In the case of the Stodthagen Forest, the major insights for forest conservation, mostly based on late-Holocene data, are the following. The current forest stand composition and structure (i.e. with undergrowing trees and scrub vegetation records in pollen and pedoanthracological records as well) are made of indigenous species with ancient presence on-site. The long-term forest dynamic is characterized by the ‘classical’ Holocene forest tree succession in northern Central Europe, with apparently a weak human disturbance. This information increases the biological and patrimonial value of the site, as an ancient and moderately disturbed woodland area and justifies the conservation management of the area by the ‘Stiftung Naturschutz’. The on-site identified ancient presence of Fagus, supports the interest and importance for the nature conservation of the Stodthagen Forest, as an ancient Fagus-dominated forest.
Concerning fire history, macro- and megacharcoal records proved that fire occurred on-site. During the early Holocene, the past fire regime seems to be natural, under climatic control. During the late Holocene, we postulate that the fire regime was human controlled, occurring at a fine spatial scale, maybe for specific human purpose such as forest canopy opening. This is supported by the on-site charcoal records, combined with the fact that late-Holocene temperate broadleaf forests are not easily inflammable forests without human ignition.
This multiproxy approach might be applied to other, potentially ancient forests to better understand their history, notably at local scale. The combination of several stand-scale investigations from a region might allow for regional and even supraregional conclusions in the future.
Footnotes
Acknowledgements
We are grateful to Kathleen Ryan and Doris Jansen for their technical help, to Hauke Drews (Stiftung Naturschutz Schleswig-Holstein) for permission to perform research in their forest, and finally to Fredrik Olsson and Marie-José Gaillard for their precious methodological contribution. We finally thank Thomas Ludemann and an anonymous reviewer for their valuable comments on the manuscript.
This research was financed by the German Research Foundation (DFG) through a stipend of the Graduate School ‘Human Development in Landscapes’ to Vincent Robin.