
Abstract
X-ray fluorescence (XRF) core scanning is a relatively new arrangement of a classic analytical technique which allows for non-destructive, in situ XRF analysis of sediment cores from submillimetre resolution upwards. In this contribution we explore the use of XRF core scanning for tephrochronology based on the analysis of three gyttja-rich sediment cores from the Faroe Islands. Using a combination of optical and radiographic images, analytical parameters and elemental profiles (Si, K, Ca, Ti, Mn, Fe, Sr and Zr), higher concentration basaltic tephra layers (>1000 shards/cm3) were positively identified. The XRF core scanning did not capture the lower concentration (<850 shards/cm3) rhyolitic layers found in the core. The elemental data generated for the detected tephra layers using XRF core scanning was not comparable to individual shard analysis by electron microprobe. We recommend using XRF core scanning for tephra screening in order to localize depths for high-resolution subsampling and to avoid depths where sediment mixing has caused tailing/mixing of the tephra signal. At the studied site the basaltic Saksunarvatn ash as well as a tephra belonging to the Askja-S/10 ka eruption were identified.
Introduction
Tephrochronology is an important tool for dating and correlating paleoclimatic records where glass shards emitted during volcanic eruptions act as isochronous markers. At sites proximal to volcanic centres tephra layers can be many millimetres to centimetres thick and are often easily identifiable in sedimentary sequences. Cryptotephra are the result of eruptions that can have occurred at distances over 1500 km from the point of deposition with resulting layers sometimes as little as one to two shards thick; the shards themselves can be smaller than 10 µm (Hunt and Hill, 2001).
Locating tephra in sediment cores is commonly achieved through a combination of methods such as sieving and point counting, magnetic susceptibility measurements, reflectance variations and density separation techniques (e.g. Blockley et al., 2005; Caseldine et al., 1999; Pilcher and Hall, 1992; Turney, 1998). The methods used to locate cryptotephra are often time-consuming. Efforts have been made towards developing a more efficient screening method for tephra using for example, x-ray diffraction (Andrews et al., 2006). Once found, the elemental composition of different tephras can then be established using conventional methods such as electron microprobe using WDS and EDS systems, x-ray fluorescence (XRF) or ICP-MS based methods (e.g. Eastwood et al., 1998; Knott et al., 2007; Pearce et al., 1999, 2004; Schmid et al., 2000).
XRF is a well-established analytical tool that has recently taken on a new configuration with the introduction of core scanning systems. These systems are non-destructive and can acquire continuous data from sediment cores for a broad range of elements in situ. Several publications have reported tephra layers as revealed by XRF core scanning and it is generally accepted that this type of data could be used in tephrochronology (e.g. Francus et al., 2009; Langdon et al., 2011; Moreno et al., 2007). In this contribution we study cores from the Faroe Islands in the North Atlantic and examine some of the prospects and pitfalls of XRF core scanning from a tephrochronological angle. The samples studied are gyttja-rich, thus the matrix is in strong contrast to the geochemical composition of tephra and provides a relatively simple case from which to test the detection of tephra using XRF core scanning. The objectives of this work are to: (i) assess the potential of XRF core scanning for locating visible and non-visible tephra layers; (ii) compare the elemental XRF core scanning data with electron microprobe analyses; and (iii) identify those tephra layers present in the sediment sequence.
Materials and methods
Palaeolake sediments were retrieved from Havnardalsmyren on the island of Streymoy (62°01′N, 06°84′W) on the Faroe Islands using a 100 cm long Russian corer (diameter 4 cm, with 30–40 cm overlap) (Figure 1). Three cores retrieved from this site are discussed including Cores 3A, 2D and 5A covering depths between 3.00–4.00 m, 3.13–4.13 m and 3.40–4.40 m, respectively (Table 1). The lithostratigraphies of Cores 3A and 2D are shown in Figure 2 while Core 5A is not shown.
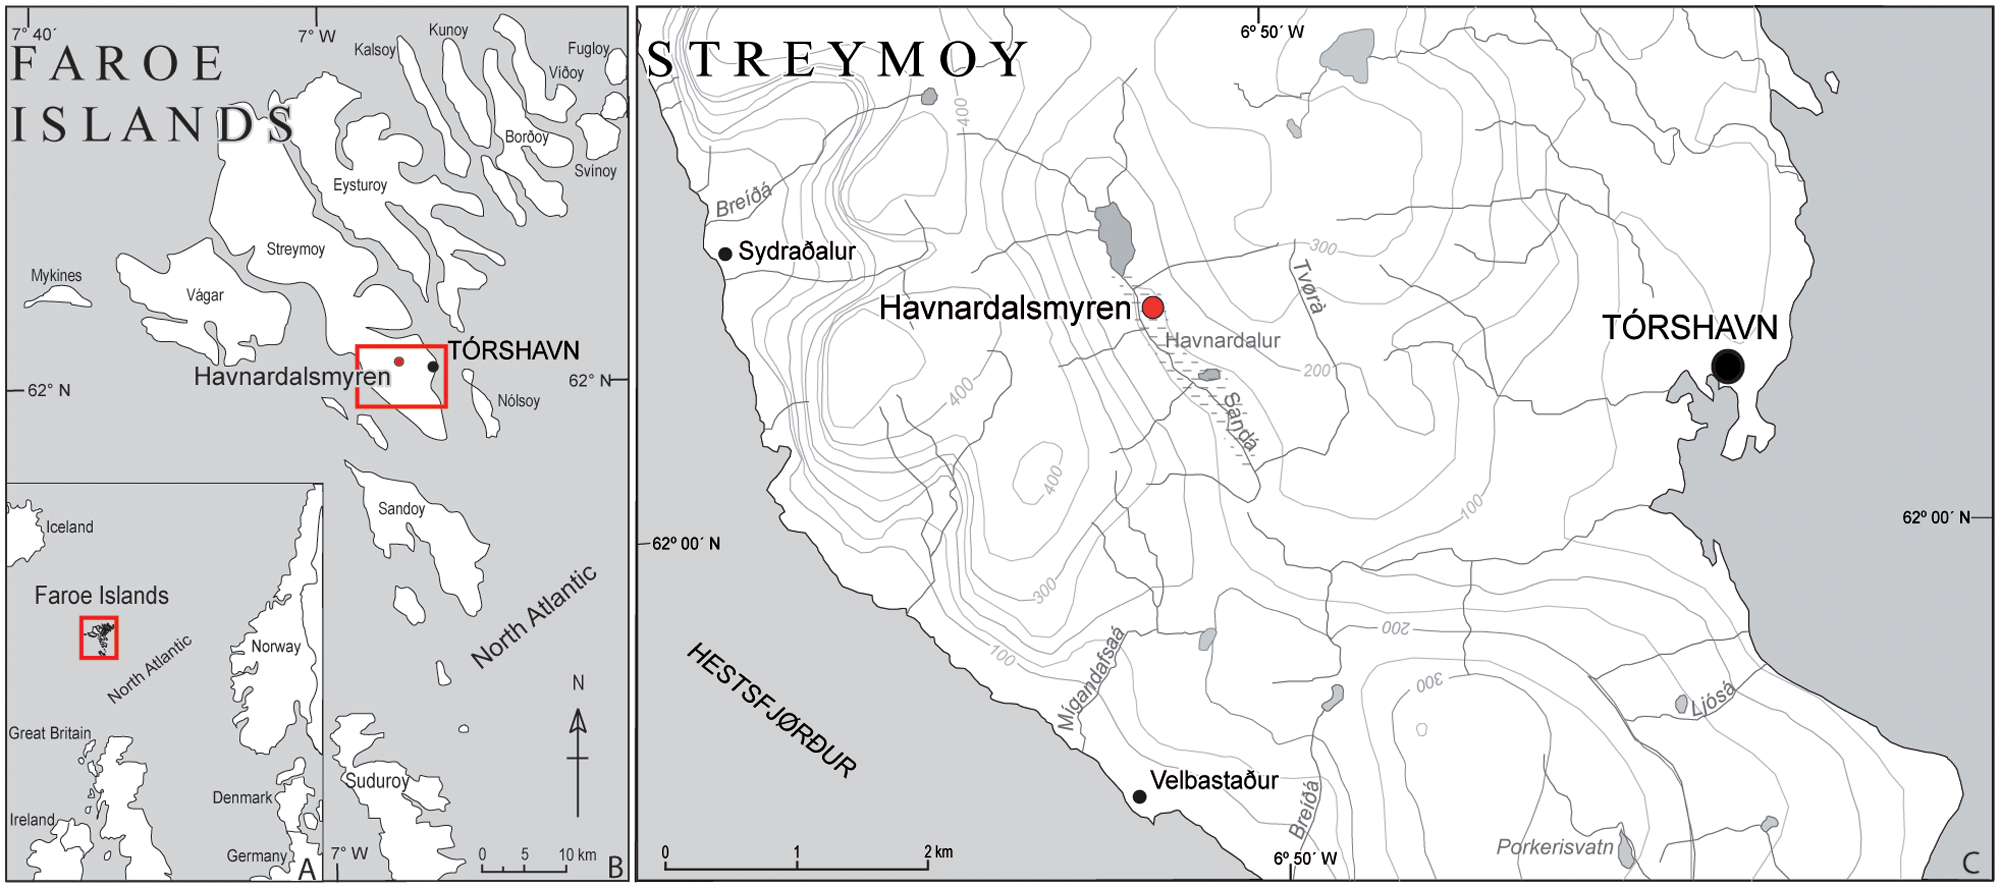
Map of the Faroe Islands and the island of Streymoy with the coring site Havnardalsmyren
Data for the three cores from Havnardalsmyren, confirmed depths of tephra, depths of visible tephras, ITRAX detection of tephra, tephra detected using the conventional method, type of tephra and maximum of shards at the level
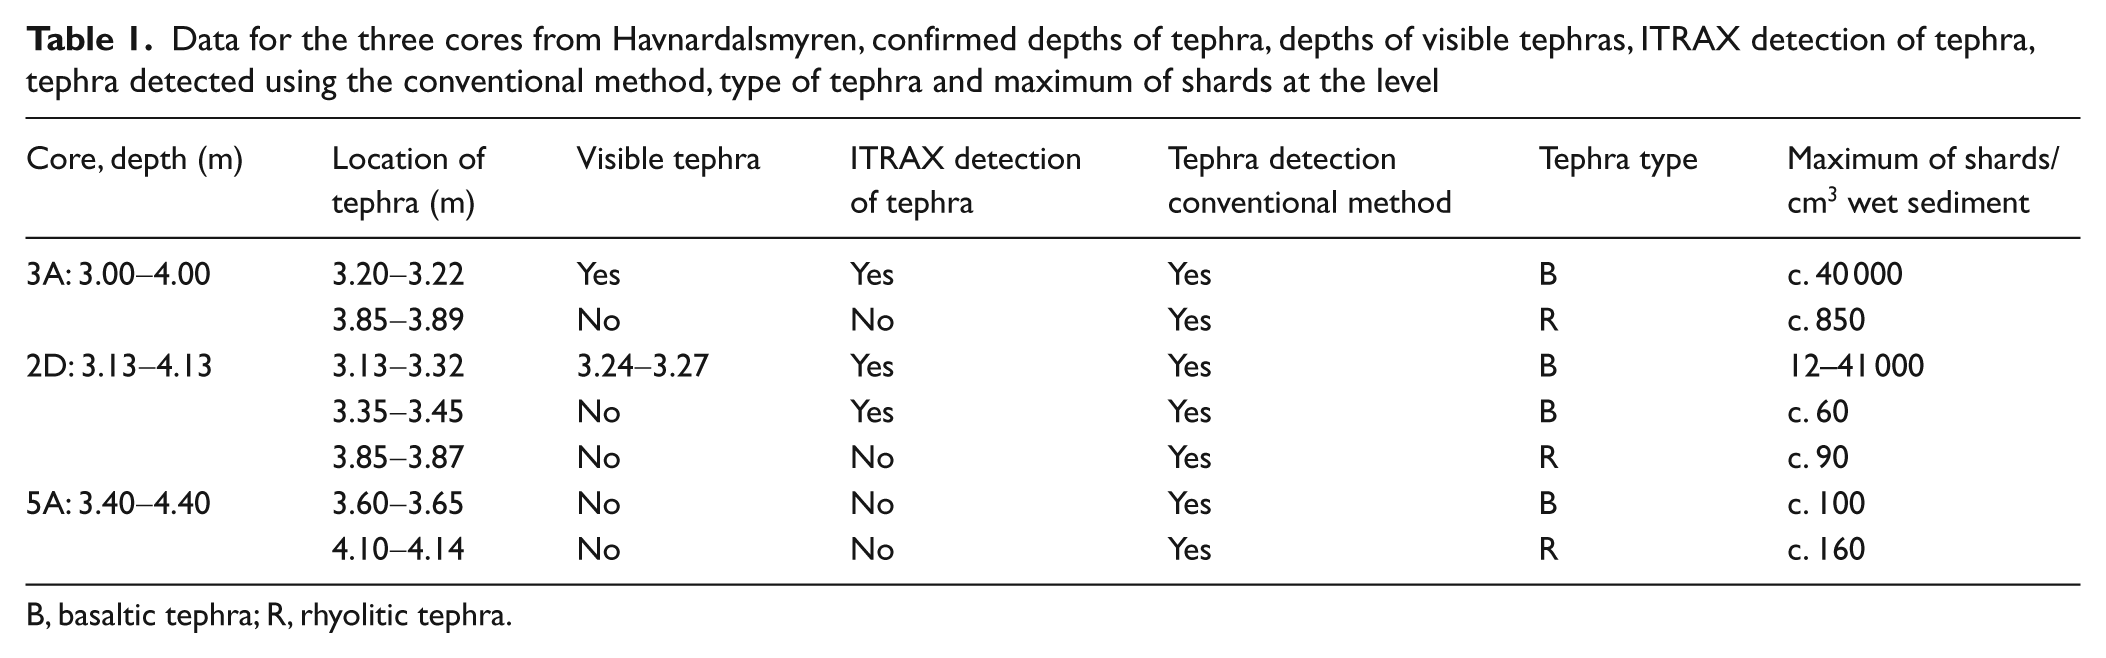
B, basaltic tephra; R, rhyolitic tephra.
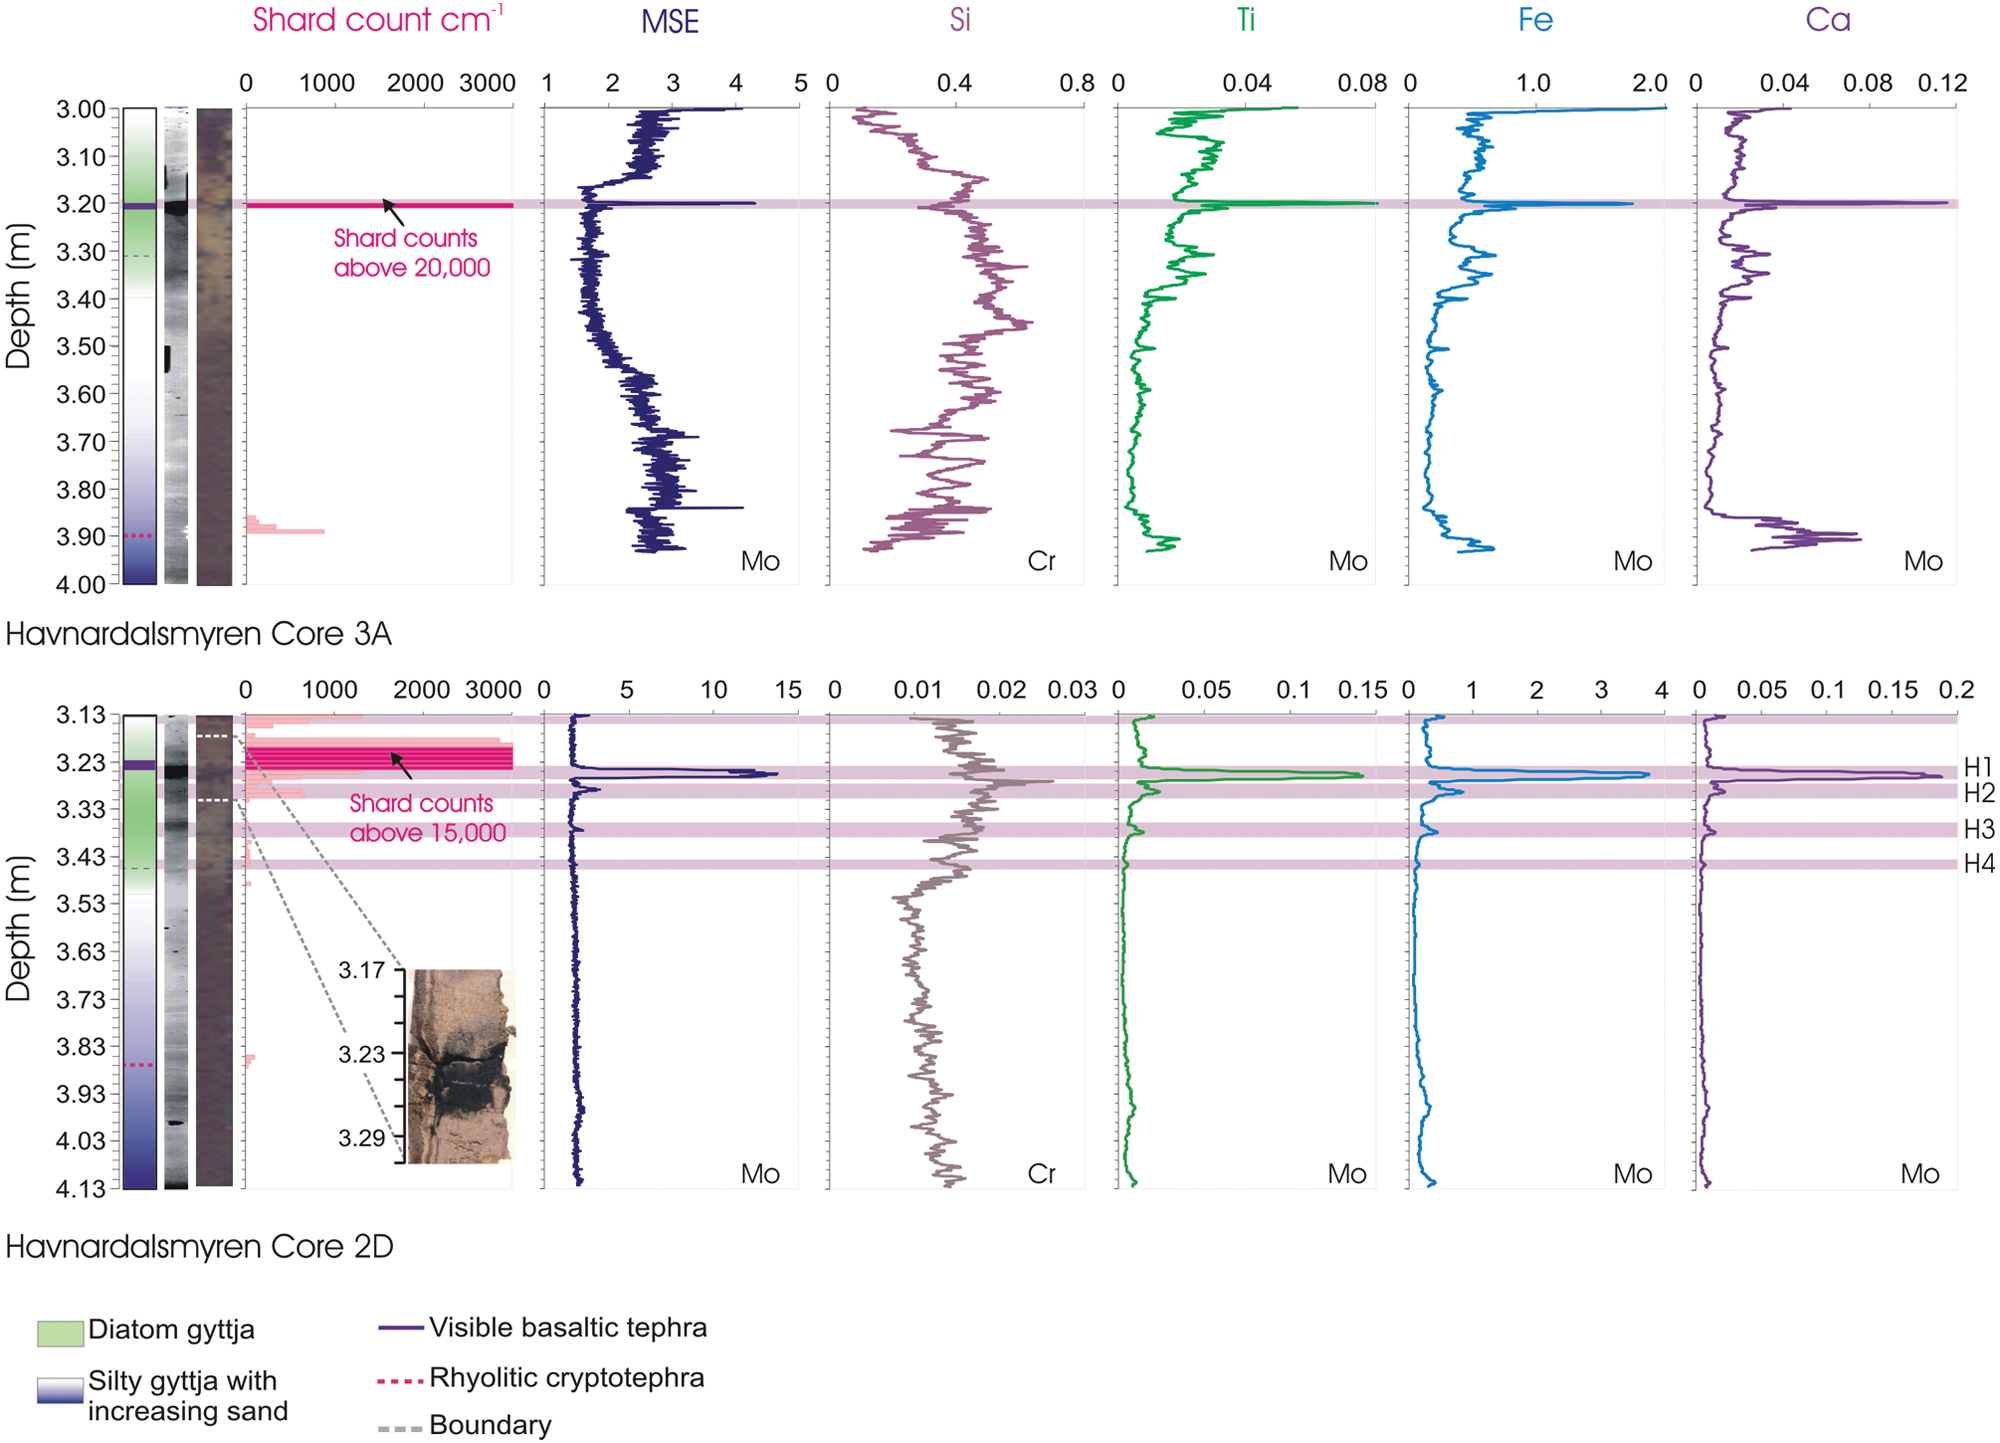
Data from Cores 3A and 2D which include the lithostratigraphy, radiographic and optical images, shard concentrations, the MSE and scattering normalized elemental profiles for Si (analysed using a Cr tube), Ti, Fe and Ca (analysed using a Mo tube). The shaded box represents depths identified as possibly having tephra using the XRF core scanner data. The dark areas on the left hand edge of the radiograph from Core 3A at 3.50 m to 3.54 m are a result of subsampling. The inset on the shard concentration profile for Core 2D shows the visible tephra which is slightly angled and diffuse around its edges. The radiograph also reveals the presence of gravel in this core
The cores were first scanned using an ITRAX XRF Core Scanner from Cox Analytical Systems (Gothenburg, Sweden) located at the Department of Geological Sciences at Stockholm University, Sweden. A single scan produces an optical RBG digital image, a radiographic digital image as well as µ-XRF elemental profiles. For more technical information on the ITRAX core scanner the reader is referred to Croudace et al. (2006) and Francus et al. (2009).
The cores from Havnardalsmyren were scanned using a Mo tube set at 30 kV and 25 mA with a step size of 600 µm and a dwell time of 50 s. This step size and dwell time were selected with consideration to the quality of the acquired data, the nature of the layers we were trying to detect as well as time constraints. Cores were also analysed using a Cr tube set at 30 kv and 40 mA with a step size of 600 µm and a dwell time of 50 s in order to improve the data for the lighter elements, particularly Si. In these sediments good quality data were acquired for Si, K, Ca, Ti, Mn, Fe, Sr and Zr.
The cores were then subsampled for tephra separation and analysis. After ashing at 550°C for 4.5 h and storage overnight in 10% HCl, samples were sieved through 25 and 80 µm mesh. The density separation technique described by Turney (1998) was used to collect the two fractions (2.3–2.5 g/cm3 and >2.5 g/cm3) which were mounted and tephra shards counted per 1 cm3 under a polarizing microscope. Preparation for microprobe analysis and analytical procedures followed Dugmore et al. (1995). EPMA data of ten main oxides were obtained on a microprobe by WDS with an accelerating voltage of 15 kV, a 2 nA beam current, and a diameter of 8.8 µm using a CAMECA SX100 scanning electron microprobe at the University in Edinburgh. The WDS system was calibrated using standard calibration blocks. Two secondary glass standards, BHVO2g and Lipari obsidian (Hunt and Hill, 1996), were analysed at regular intervals to monitor for and instrumental drift and to assess the precision and accuracy of the glass analyses.
Results and discussion
Core screening procedure for tephra
The ITRAX produces a single dispersive energy spectra for each point measured along the core surface. Unlike conventional XRF measurements, instrumental calibrations are not routinely made, rather calculated peak area integrals for each element are used. The goodness of fit of each measured spectra with the theoretical spectra is characterized by the mean standard error (MSE) and during processing peak fitting parameters are adjusted to optimise this fit for each measured spectra. Problems with elemental excitation and/or scattering can occur with wet and/or organic-rich sediments and with variations in density and grain size. To adjust for this as well as tube aging, different measurement currents and detector dead times, all data are normalized to the incoherent plus coherent (inc + coh) scattering.
The XRF core scanner was first used to screen the cores for those depths possibly containing tephra. This was done using the lithostratigraphy, the radiographic and optical images, the MSE, the inc/coh ratio and the available elemental profiles (Si, Ti, Fe and Ca are shown in Figure 2). The radiographic image gives information on changes in density; in the gyttja-rich sediments studied here tephra appear darker than the matrix. The MSE of the individual spectra can provide a qualitative indicator for changes in the matrix being scanned such that with a move from a gyttja-rich matrix to a glass-rich matrix the MSE would increase. Similarly, the inc/coh ratio will indicate changes in the matrix as lighter elemental compositions produce more incoherent scattering than matrices with heavier elemental compositions. In this case the inc/coh ratio is lower at those depths containing tephra (profiles not shown). Tephra are often identified using the major elements SiO2, TiO2, Al2O3, FeOtot, MnO, MgO, CaO, Na2O, K2O and P2O5. Rhyolitic tephra are higher in SiO2 (>~70%) than basaltic tephra while basaltic tephra have higher concentrations of TiO2, FeOtot, MgO and CaO than rhyolitic tephra. If there was a concurrent change in the abovementioned indicators (higher densities on the radiographic image, increased MSE, lower inc/coh ratio) and an increase in elemental peak areas of K, Mn, Fe, Ca, Ti and/or Si, these depths were subsampled at 1 cm resolution while the rest of the core was sampled at 5 cm. The XRF core scanner cannot acquire data for Na or Mg and the quality of the Al and P data were poor, even when using the Cr tube. Those layers first identified as possibly containing tephra are highlighted in the shaded boxes in Figure 2.
Comparison between shard counts and elemental profiles
Core 3A has one visible basaltic tephra at 3.20 m to 3.22 m (Figure 2). The shard concentration at this depth is ~40 000 shards/cm3 (Table 1). Rhyolitic shards were also found from 3.85 m to 3.89 m (31–865 shards/cm3). The basaltic layer is clearly seen in the radiograph. Slightly lower MSEs occur between 3.15 m and 3.56 m but the main feature is the peak at 3.20 m. This MSE peak is matched by increases in Ti, Fe and Ca. Peaks in these elements also occur at 3.00 m, 3.31 m, 3.35 m, 3.40 m and 3.50 m. The elemental variations in Si are independent of the other elements, which is explained by the presence of diatom gyttja. Only the basaltic tephra layer found at 3.20 m was identifiable when looking at the XRF core scanning data.
Core 2D has one thick visible tephra located at 3.24 m to 3.27 m which is slightly angled and diffuse, particularly at the edges (Figure 2, inset Core 2D). The radiograph suggests a higher density matrix in the top 34 cm of the core with two distinct layers at 3.24–3.27 m and 3.35–3.37 m. Shard counts reveal that this density change is linked to the presence of tephra where almost all of the top 40 cm contains basaltic tephra. Shard concentrations vary from as little as 12 shards/cm3 up to 41 000 shards/cm3 with the greatest shard concentrations found between 3.20 m and 3.24 m (15 339–40 038 shards/cm3) (Table 1). Some rhyolitic tephra is found between 3.85 m and 3.87 m (18–97 shards/cm3). The XRF data show increased MSEs at 3.13 m, 3.24–3.27 m (H1), 3.29–3.30 m (H2) and 3.38 m (H3). Titanium, Fe, Ca, K, Mn and Sr all have matching increases at these depths and generally higher peak areas in the top 20 cm; these increased values are interpreted as tephra signals. There is also a small Ti, Fe and Ca peak centred on 3.45 m (H4). Again, Si shows a distinctly different profile in comparison with the other elements because of the presence of diatom gyttja. In this core the XRF data capture signals from the basaltic tephra but there is an offset in these data compared with the shard concentrations as a result of differences in sampling tracks.
Core 5A (not shown) has no visible tephra. Shard counts in this core were low with basaltic shards found at 3.60 m to 3.65 m (16–104 shards/cm3) and rhyolitic shards (25–167 shards/cm3) found at 4.10 m to 4.14 m (Table 1). No evidence for the presence of tephra shards is seen in the XRF core scanning data.
The data presented above reveal some of the pitfalls associated with using XRF core scanning for locating tephra layers. It is common for shard distribution on the lake bottom to be patchy and signals can tail across multiple depths as a result of sedimentation processes, taphonomic processes or even multiple eruptions (e.g. Davies et al., 2001, 2007; Jóhannesdóttir et al., 2005; Pyne-O’Donnell, 2010; Wastegård et al., 1998). Indeed, as seen here, cores from the same basin commonly differ in shard concentrations and even tephra layers (e.g. Davies et al., 2001; Wohlfarth et al., 2006). This uneven deposition presents a challenge when scanning by XRF. On the particular instrument used here the x-ray beam is roughly 200 μm long by 20 mm wide. The XRF measured by the detector however, is only emitted from a central strip 8 mm in width and from the top millimetres of the sample surface, depending on the element in question (Fitton, 1997). Consequently, in order to be detected tephra must pass within the analysis volume of the beam. As seen in Core 2D (Figure 2), the visible tephra is not present across the entire depth of the core on the lower edge and it is disturbed and diffuse at the edges of the core. The high density tephra layer in the radiograph aligns with the H1 peaks in MSE, Ti, Fe and Ca. As is common practice, subsampling for tephra was made at the edge of the core while the XRF core scanning was made in the centre; this generated the observed offset in shard concentrations and core scanning parameters. Making several parallel scans or ‘mapping’ (as in Shanahan et al., 2008) solves this issue but with each additional scan the time-saving aspect of XRF core scanning for tephra screening is reduced. Parallel scans can, however, reveal where disturbances in the tephra occurred so that an optimal track for tephra subsampling can be chosen (i.e. to avoid areas of disturbance).
In addition to actually hitting the tephra shards with the x-ray beam the concentration of tephra shards must exceed some critical value for detection. This is a possible explanation as to why the lower concentration rhyolitic tephra in all three cores were missed. Based on the present data it is not possible to do more than speculate on what a threshold shard concentration for consistent detection in gyttja-rich sediments might be. The concentrations of rhyolitic tephra in Cores 3A, 2D and 5A were all <864 shards/cm3 and all went undetected by XRF core scanning. In Core 2D areas with basaltic shard concentrations above ~1000 shards/cm3 were detected as was the high concentration layer (41 000 shards/cm3) in Core 3A. This provides a very preliminary estimate for threshold shard concentrations for detection in the area of 1000 shards/cm3 although further testing of this is required. The Si-rich nature of rhyolitic tephras may also be a problem as quality Si data are more difficult to acquire using XRF core scanning systems.
Comparison between XRF core scanning and electron microprobe data
Several of the tephra layers (H1 to H4) in Core 2D (Figure 2) were analysed by electron microprobe in order to test if it was possible to use the XRF core scanning data for preliminary tephra identification and core alignment. We note however that XRF is not commonly used for tephra analysis. Figure 3 plots the FeOtot versus TiO2 data from the individual shard analysis made by microprobe (A) as well as the scattering normalized Fe and Ti XRF core scanning data (B) from the peaks corresponding to the H1–H4 tephra (peak tops are indicated by symbols having a black outline, symbols for peak sides do not). Samples from the matrix plot into a tight field as represented by the box on the x-axis.
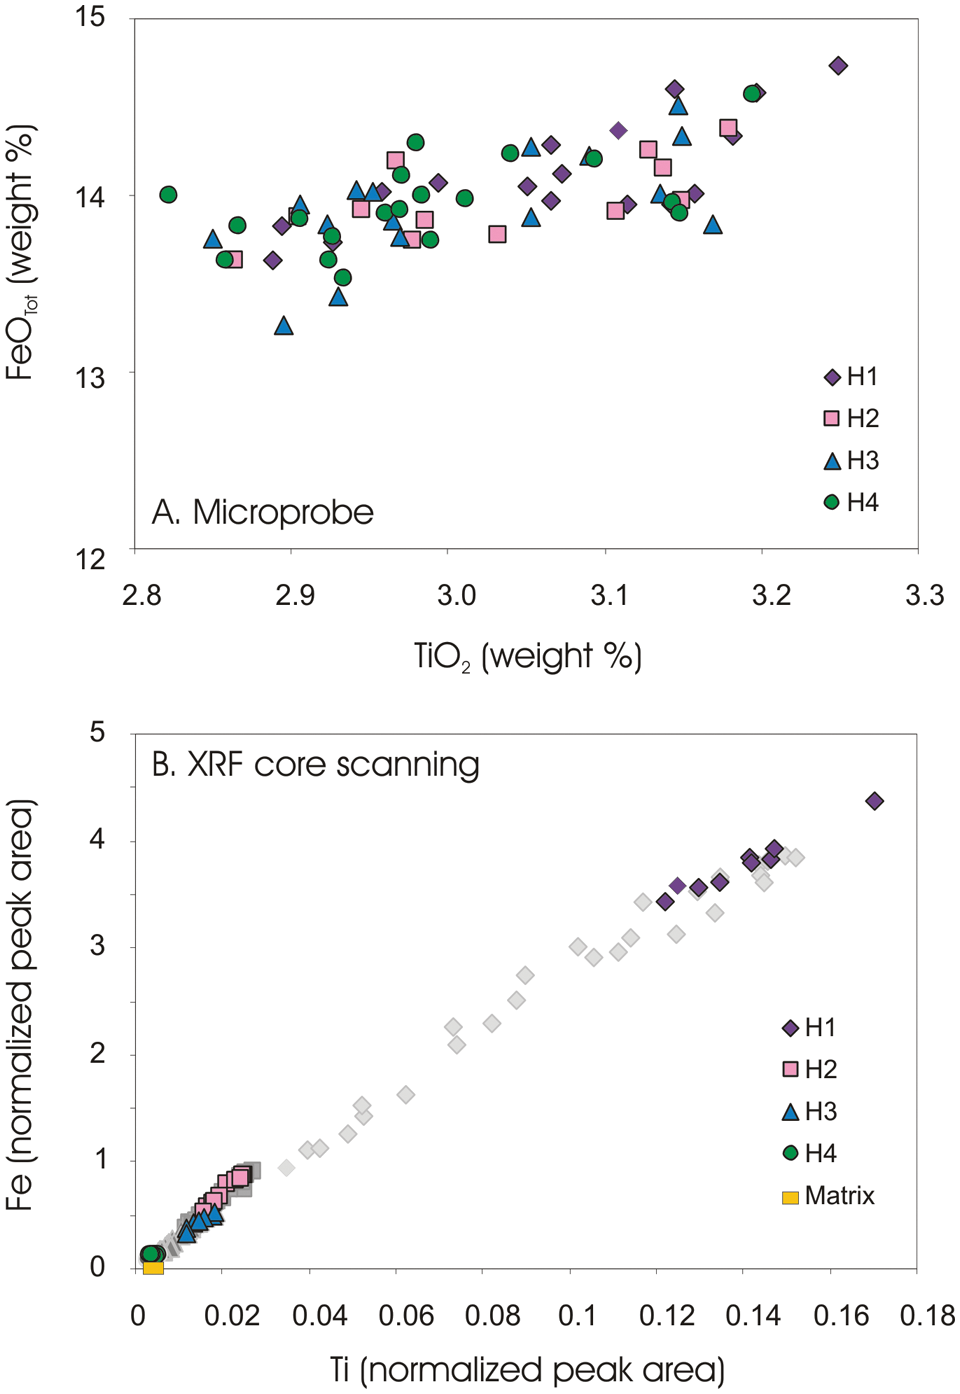
Bi-plot of normalized FeOtot versus TiO2 from tephra layers H1–H4 in Core 2D as analysed by electron microprobe on individual shards (A) and Fe and Ti scattering normalized peak areas from bulk sediments using the XRF core scanning data (B). In the latter plot, peak tops are indicated by symbols having a black outline, while symbols for peak sides do not
The individual fields for H1–H4 from the XRF core scanning are spatially distinct in Fe versus Ti space as well as in other bi-plots tested (K, Ca and Mn) and differ from the matrix (Figure 3B). There appears to be a smearing of signals between the different tephra layers when the entire peak is plotted. While the microprobe and XRF core scanning plots differ in measurement unit (weight % and normalized peak areas), the spatial relationship between the individual tephra layers should be similar. This is not the case however as the overlap and scatter between H1, H2, H3 and H4 in the microprobe data (Figure 3A) is not seen in the XRF core scanning data. This may be due to: (i) matrix effects during XRF core scanning that are not corrected by (inc + coh) scattering normalization; (ii) the discrepancies that arise when analysing individual shards versus bulk sediments/tephra; and (iii) the mixing/disturbance of the tephra during/after deposition on the lake bottom which weakens the elemental fingerprint of the bulk tephra.
Tephra identification
Based on the major oxide geochemistry of the deposited shards, the upper tephra horizons in Cores 3A and 2D are identified as belonging to the basaltic Saksunarvatn ash from the Grímsvötn volcanic system on southern Iceland. This eruption has been ice-core dated to 10 347±89 (10 436–10 258) cal. yr BP in GICC05 (Greenland Ice Core Chronology 2005) (Rasmussen et al., 2006). Results from Iceland suggest that the Saksunarvatn ash may actually involve three separate events which may explain the fact that this tephra covers some 40 cm in Core 3A (Davies et al., 2011; Jóhannesdóttir et al., 2005; Thordarson et al., 2010). The rhyolitic tephra layers found lower down in Cores 3A, 2D and 5A belong to the Askja-S/10 ka eruption (10 500–10 350 cal. yr BP), identified first on the Faroe Islands by Lind and Wastegård (2011). Correlations across the cores show that Saksunarvatn ash is present in all three cores but with variable concentrations and depth spread (from 1 cm to 40 cm) while Akja-S/10 ka is present in similar amounts in all three cores.
Recommendations based on our experience from Havnardalsmyren
We recommend using XRF core scanning to screen cores in order to identify depths where tephra is possibly present. This information can be used to plan subsampling where high-resolution sampling can be made at target depths and depths where sediment mixing has caused tailing/mixing of the tephra signal can be avoided. Owing to the uneven deposition of tephras on the lake bottom it is recommended that a buffer is added above and below high-resolution regions. In the gyttja-rich cores studied here the presence of tephra was signalled by higher density layers in the radiograph, higher MSEs, lower inc/coh ratio and increased elemental peak areas (K, Mn, Fe, Ca, Ti). These indicators will vary in response from site to site depending on the matrix composition vis-à-vis the tephra composition. The XRF core scanning data were able to detect those basaltic layers with higher tephra concentrations (≳1000 shards/cm3) but were only randomly successful in catching low concentration layers. The XRF core scanning data from the tephra layers at Havnardalsmyren were not comparable to the standard microprobe shard analyses.