



Abstract
A high-resolution multiproxy study of core MD99-2286 reveals a highly variable hydrographic environment in the Skagerrak from 9300 cal. yr BP to the present. The study includes foraminiferal faunas, stable isotopes and sedimentary parameters, as well as temperature and salinity reconstructions of a c. 29 m long radiocarbon-dated core record. The multivariate technique fuzzy c-means was applied to the foraminiferal counts, and it was extremely valuable in defining subtle heterogeneities in the foraminiferal faunal data corresponding to hydrographic changes. The major early-/mid-Holocene (Littorina) transgression led to flooding of large former land areas in the North Sea, the opening of the English Channel and Danish straits, and initiation of the modern circulation system. This is reflected by fluctuating C/N values and an explosive bloom of Hyalinea balthica. A slight indication of ameliorated conditions between 8000 and 5750 cal. yr BP is related to the Holocene Thermal Maximum. A subsequent increase in freshwater/Baltic water influence between 5750 and 4350 cal. yr BP is reflected by dominance of Bulimina marginata and depleted δ18O values. The Neoglacial cooling (after 4350 cal. yr BP) is seen in the Skagerrak as enhanced turbidity, increasing TOC values and short-term changes in an overall Cassidulina laevigata-dominated fauna suggesting a prevailing influence of Atlantic waters. This is in agreement with increased strength of westerly winds, as recorded for this period. The last 2000 years were also dominated by Atlantic Water conditions with generally abundant nutrient supply. However, during warm periods, particularly the ‘Medieval Warm Period’and the modern warming, the area was subject to a restriction in the supply of nutrients and/or the nutrient supply had a more refractory character.
Introduction
The embayment of Skagerrak and Kattegat is a thoroughly studied high-sedimentation area, which forms the transitional area between the North Atlantic/North Sea and the Baltic Sea estuary (Figure 1A). The connection from the deepest part of the Skagerrak in the Norwegian Trench (700 m) to the North Atlantic is restricted by a sill at 270 m (Rydberg et al., 1996).

(A) Location map showing the core site (MD99-2286), the bathymetry and the modern oceanographic circulation pattern. White arrows indicate subsurface currents, modified from Longva and Thorsnes (1997). (B) Modern faunal provinces in the Skagerrak and Kattegat (after Conradsen et al., 1994). The faunal provinces are denoted according to the most common species exposed by factor analysis of the faunas. Core MD99-2286 is situated in the present B. skagerrakensis province
The oceanography and marine environments in this area have been monitored for years (e.g. Aure and Dahl, 1994; Danielssen et al., 1997; Longva and Thorsnes, 1997; North Sea Task Force, 1993a, b; Rodhe, 1996; Svendsen et al., 1996), and as a background for palaeoecological interpretations, the modern distributions of benthic foraminifera have been intensively studied through the last few decades both in the Skagerrak and in adjacent areas (e.g. Alve and Murray, 1995, 1997; Bergsten et al., 1996; Conradsen, 1993; Conradsen et al., 1994; Corliss and van Weering, 1993; Höglund, 1947; Moodley et al., 1993; Qvale and Van Weering, 1985; Risdal, 1964; Thiede et al., 2009; Van Weering and Qvale, 1983).
The aim of this study is to contribute to the understanding of Holocene palaeoecological changes in the eastern Atlantic by high-resolution studies of benthic foraminifera and stable isotopes in core MD99-2286 from the Skagerrak, supplemented by available sedimentary parameters from the same core. The Holocene faunal changes are interpreted on the basis of comparison with the modern foraminiferal distribution patterns (Conradsen, 1993; Conradsen et al., 1994; Qvale and Van Weering, 1985; Van Weering and Qvale, 1983). The faunal distribution generally appears to follow the bathymetry of the Skagerrak (Figure 1B) and was interpreted by Conradsen et al. (1994) to be constrained by certain water masses in the area. The reconstructed palaeotemperature and salinity records in MD99-2286 are discussed in relation to similar marine studies in the eastern North Atlantic, as well as terrestrial records and atmospheric climatic data.
Oceanography
The present-day oceanographic circulation in the Skagerrak forms a cyclonic gyre (Rodhe and Holt, 1996) in the central part (Figure 1A). The inflowing water originates in the North Atlantic, and the central and southern North Sea. The main inflow is subsurface, following the contours of the southern slopes of the Norwegian Trench around 100 m water depth (Talpsepp et al., 1999). It turns westward before it reaches the Swedish coast and exits the Skagerrak along the Norwegian coast, still as a subsurface current (e.g. Danielssen et al., 1997; McClimans et al., 2000; Rodhe, 1996). This subsurface circulation, which follows the slopes of the Norwegian Trench around the Skagerrak, is extremely stable, and the incoming water has salinity close to or above 35 (Rodhe, 1996). It is rich in nutrients and is the main source for the primary production (Danielssen et al., 1997).
In the deep part of the Skagerrak, below 400–500 m, the water masses may remain stagnant for years at a time (Rodhe, 1996). They are renewed in winters by cascading cold North Sea water or dense Atlantic Water lowering the temperature to 4–5°C (Aure and Dahl, 1994; Ljøen and Svansson, 1972). Between renewals, the oxygen concentration becomes low, and the temperature increases to 6–7°C because of vertical turbulent diffusion (Aure and Dahl, 1994; Ljøen and Svansson, 1972).
The surface circulation in the Skagerrak is greatly variable and to a high degree affected by wind stress (Danielssen et al., 1997; Gustafsson and Stigebrandt, 1996). A thin surface current, rich in nutrients, flows into the Skagerrak along the west coast of Jutland (Jutland coastal water). Outflowing brackish water from the Baltic Sea flows along the Swedish west coast, following a counterclockwise circulation pattern in the Skagerrak and departing as the Norwegian Coastal Current (NCC) after further mixing with river runoff from Sweden and Norway, as well as with the underlying Atlantic Water by means of entrainment (Gustafsson and Stigebrandt, 1996).
An oceanic front, the Skagerrak-Kattegat front or the Skagen front, is created in the area where the incoming water from the North Sea meets the outflowing water from the Baltic Sea (e.g. Gustafsson and Stigebrandt, 1996; McClimans et al., 2000; Rodhe, 1996), and it stretches northeastwards from Skagen towards the Swedish coast. Gustafsson and Stigebrandt (1996) observed the front down to 75 m depth and found that at around 10 m depths it is almost parallel to the Swedish coast.
Material and methods
Core MD99-2286 is a 32 m long piston core, which was retrieved on the southern slope of the Norwegian Trench at 225 m of water depth (58°43.77’N, 10°12.31’E; Figure 1) during the MD114 IMAGES V cruise with R/V Marion Dufresne in 1999 (Labeyrie et al., 2003). The core was split and described visually in the onboard MST laboratory. It consists of nearly homogeneous silty clay with a coarsening upward trend and was sampled at every 1 cm (1 cm slices). Onboard microscopic analysis of smear slides showed that the carbonate material consists of mixed detrital carbonate particles, coccoliths and foraminifera. The upper 2889 cm of the core is included in this study. Results from the lower part of the core have been published in Erbs-Hansen et al. (2011).
The total carbon and nitrogen contents were measured at 5 cm intervals on a CE-Instruments NA 2500 NCS-analyzer at Stockholm University, Sweden. Carbonate contents were measured on a UIC Coulometrics coulometer at Stockholm University, at 10 cm intervals from 2889 to 1500 cm and at 5 cm intervals from 1500 cm to the top of the core, with the exception of the interval 250–100 cm, where 2 cm spacing was used. The total organic carbon (TOC) content was calculated on the basis of the carbonate, and total carbon and nitrogen measurements (see also Erbs-Hansen et al., 2011).
The age model for MD99-2286 is based on 30 AMS 14C age determinations on either mollusc shells of known species or mixed benthic foraminifera (Figure 2), measured at the Institute of Particle Physics, ETH, Zurich, Switzerland, and the AMS 14C Dating Centre, Aarhus University, Denmark (Erbs-Hansen et al., 2011; Gyllencreutz, 2005). The 14C ages have been calibrated with Oxcal 4.1 software (Ramsey, 2009) using the Marine09 calibration curve and a marine reservoir age of 400 years (Reimer et al., 2009). Our results are presented on a calibrated age scale before present (cal. yr BP) with present being
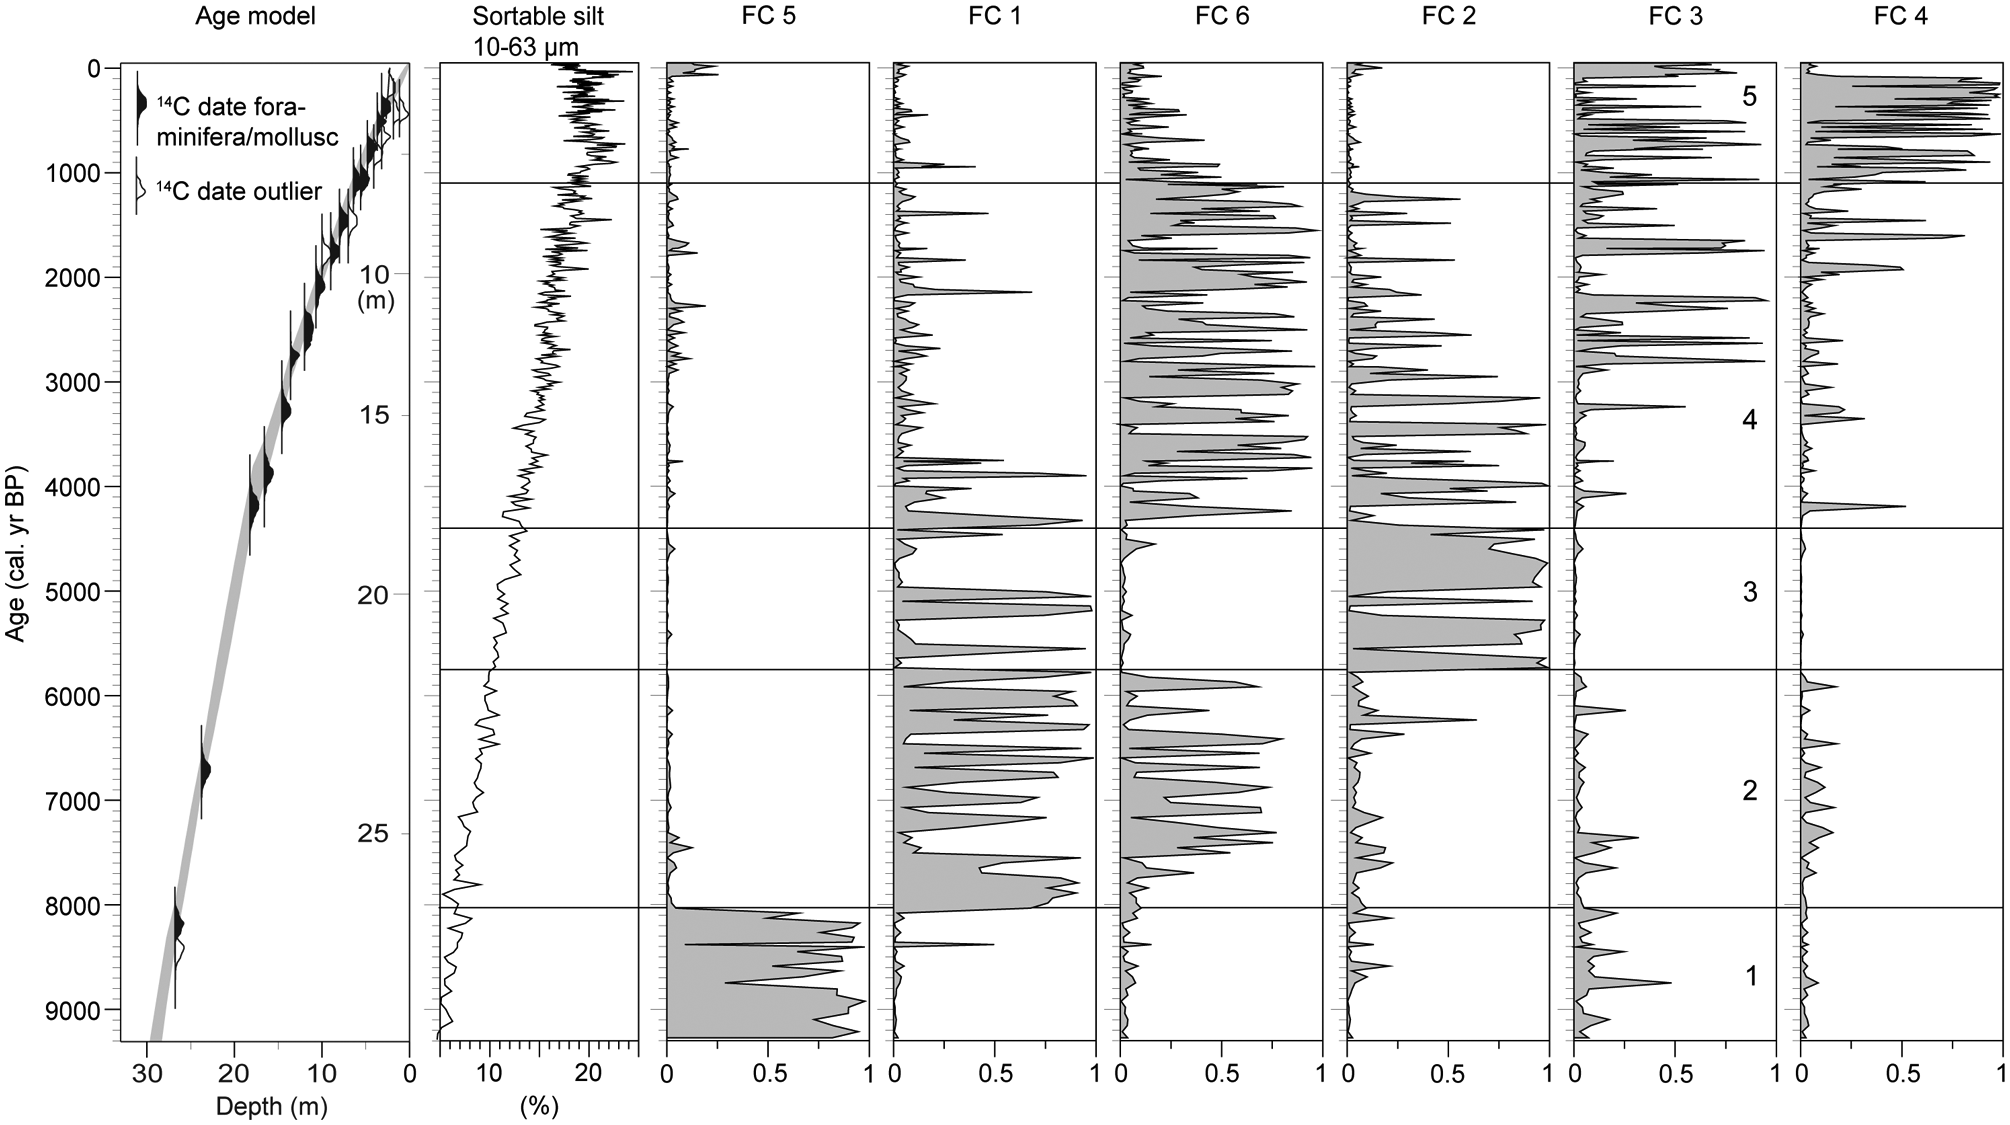
Age model for MD99-2286 based on calibrated 14C ages, using the Oxcal 4.1 software (Ramsey, 2009) and the Marine09 calibration data set (Reimer et al., 2009) with a reservoir age of 400 years. The depths shown on the vertical scale are mean values of the uncertainty intervals. In addition, sortable silt contents (Gyllencreutz, 2005) and membership values for each sample to the clusters recognized in the fuzzy c-means (FCM) clustering analysis are plotted. Cluster FC 5 is characterized by C. laevigata, C. neoteretis and P. osloensis; FC 1 by the dominance of H. balthica together with C. laevigata; FC 6 by the dominance of C. laevigata together with H. balthica; FC 2 by B. marginata, H, balthica and C. laevigata; FC 3 by C. laevigata together with P. osloensis and M. barleeanus and FC 4 by the dominance of C. laevigata. The record has been divided into five assemblage zones (zones 1–5) based on the FCM analysis
Core MD99-2286 spans the latest Younger Dryas and the entire Holocene (Erbs-Hansen et al., 2011), but for this study, we focus on the interval from c. 9300 cal. yr BP to the present (year of coring,
Foraminifera
Foraminiferal analyses have been carried out at every 10 cm (1 cm slices). The samples were wet-sieved through 1000, 100 and 63 µm sieves following standard methods (Feyling-Hanssen et al., 1971; Knudsen, 1998). In the 100–1000 µm size fraction, a minimum of 300 benthic foraminifera were identified and counted. A total of 75 benthic foraminiferal taxa were identified to species level, and additionally 30 to genus level. A few specimens of planktonic foraminifera were observed, and they have not been treated in this study.
The species diversity was evaluated using the SHE analysis technique (Buzas and Hayek, 1996, 1998; Hayek and Buzas, 1997), which decomposes the information function (the Shannon-Weiner index (H) (Shannon, 1948)) into a richness component (S) and an evenness component (E) (Buzas and Gibson, 1969). The SHE analysis technique allows H to be evaluated in terms of the number of species (S) and their relative proportions (E).
The benthic foraminiferal flux (number of specimens/cm2 per yr) has been calculated using a constant dry bulk density of 0.8 g/cm3, because the dry bulk density was not measured.
A foraminiferal zonation of the record was established using the clustering method fuzzy c-means (FCM) (Bezdek, 1987; Bezdek and Pal, 1991). Statistical methods traditionally used in micropalaeontology, such as factor analysis, correspondence analysis and hierarchical clustering, were tried on the data set, but they all produced ambiguous results. In FCM, each sample can belong or have membership to more than one cluster, making it suitable to determine the degree of intergradation that may have existed between the assemblages during life. This distinguishes FCM from ‘hard’hierarchical clustering methods, where samples can belong to only one cluster. A cluster membership is represented by a value that ranges between 0 and 1, such that for each sample all its cluster memberships will sum to one. The characteristic assemblage of a cluster is determined algorithmically by locating the center of gravity of samples that are grouped (i.e. clustered) together in the variable space, which in this study are the vectors defined by the benthic foraminiferal taxon abundances. Because the characteristic assemblage is located within the taxon abundance space the characteristic assemblage of each cluster will be represented as the relative abundances of benthic foraminiferal taxa (Figure 3) (for more details, see Erbs-Hansen et al., 2011).
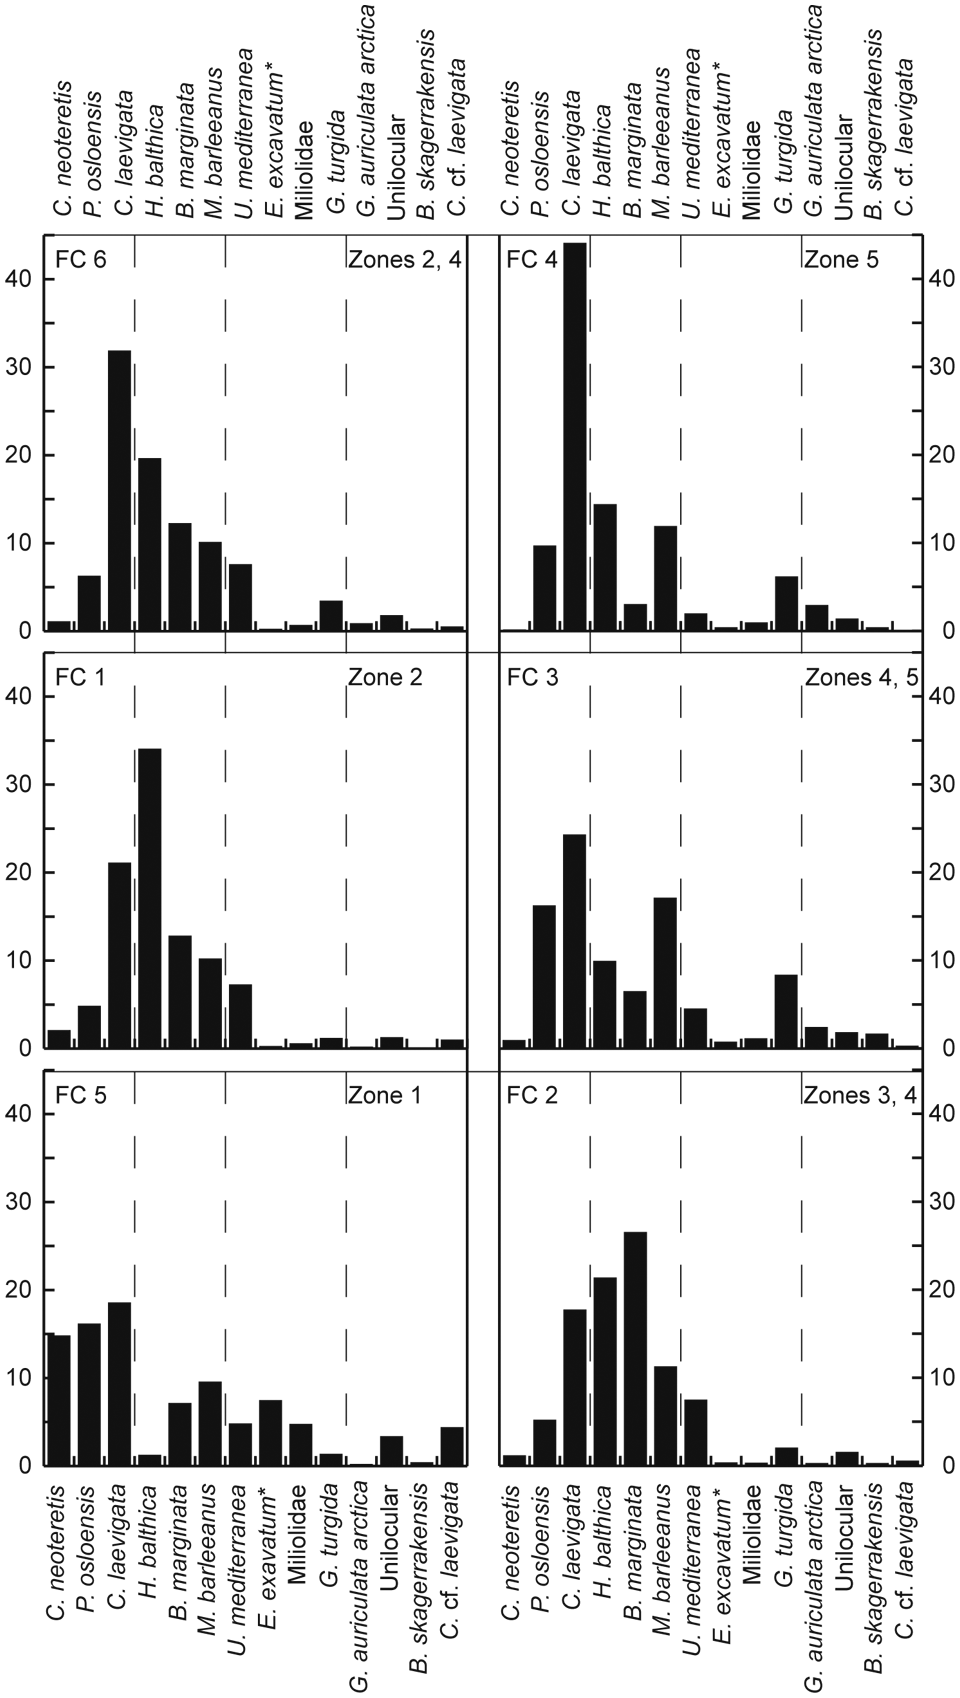
Characteristic assemblages for the six clusters obtained from the FCM analysis. Only the most abundant and important species are shown, but a full list of taxa included in the FCM analysis is given in Table 1. Asterisk denotes E. excavatum, excluding the clavata form
The program TACSWorks was applied for the FCM analysis (Gary et al., 2009), using a fuzzy exponent of 1.5 (cf. Erbs-Hansen et al., 2011). Before running the analysis, the data were filtered using a 95% confidence interval criterion to exclude rare taxa. All taxa belonging to Miliolidae were grouped, as well as Unilocular taxa (Fissurina spp., Lagena spp., Oolina spp. and Parafissurina spp., all s.l.). The filtering resulted in 28 remaining taxa for the analysis (Table 1), and a FCM solution with six clusters was chosen. The foraminiferal record was divided into five zones on the basis of the FCM clustering.
List of foraminiferal taxa used in the fuzzy c-means (FCM) analysis. The original references and description of the taxa are reported in Ellis and Messina (1949 and Supplements including 2009)

Stable isotopes and transfer function
Stable carbon and oxygen isotopes were measured at every 2 cm in the intervals 2889–2560 and 1102–0 cm, while 5 cm spacing was applied from 2558–1105 cm. Two different species, Melonis barleeanus and Uvigerina mediterranea, were analyzed, with 15 overlapping samples. The samples were run on a Finnigan MAT 252/253 mass spectrometer coupled to an automated Kiel device at the Bjerknes Centre for Climate Research, University of Bergen, Norway (U. mediterranea, 2889–1070 cm) and at Stockholm University (M. barleeanus, 1099–0 cm), respectively. Based on the long-term reproducibility of the internal standard Carrera Marble the long-term precision was better than 0.1‰ for both carbon and oxygen isotopes. The measurements were calibrated to the Vienna Pee Dee Belemnite IAEA-standard (VPDB) and converted to conventional delta notation (δ13C and δ18O).
Melonis barleeanus has a reported range of vital effects from −0.41to −0.65‰ (Fontanier et al., 2006, 2008; Ivanova et al., 2008; McCorkle et al., 1990) with an average of −0.52‰. This mean value was used for the correction of our δ18O values for M. barleeanus. Uvigerina mediterranea has been corrected by 0.22‰ as used in Erbs-Hansen et al. (2011) (cf. Fontanier et al., 2006).
A comparison of the isotopic values for M. barleeanus and U. mediterranea in the overlapping samples shows that U. mediterranea is enriched with an average of 0.56‰ compared with M. barleeanus after correction for vital effects. The offset between the vital effect-corrected values of the two species may be an artifact of the measurements being carried out at two different laboratories. Since it has not been possible to check that further, we have chosen to normalize the δ18O values for U. mediterranea to M. barleeanus with a correction of the mean offset value between the two species (0.56‰). The U. mediterranea δ18O record has been used below 1070 cm depth, and the M. barleeanus record was used above that level (1068 cm to the top).
Palaeotemperature estimates have been performed from the corrected δ18O record using the equation of Shackleton (1974) (cf. Erbs-Hansen et al., 2011). The δ18O for water was calculated using the salinity:δ18O mixing line representing Atlantic Water in the Skagerrak with salinities ≥35 (Austin et al., 2006); a salinity of 35 has been used.
In addition, palaeotemperature and palaeosalinity estimates were carried out using the transfer function for benthic foraminifera developed by Sejrup et al. (2004). The estimates were calculated on the basis of a reduced modern database with 209 samples, as described by Erbs-Hansen et al. (2011). In the program C2 (Juggins, 2007), a three-component Weighted Averaging Partial Least Squares (WA-PLS) transfer function with a bootstrapping cross validation was applied for the temperature calculation and a two-component WA-PLS with bootstrapping cross validation was used to estimate the palaeosalinity.
Results
In general, the MD99-2286 record is dominated by six species, C. laevigata, H. balthica, B. marginata, P. osloensis, U. mediterranea and M. barleeanus, which are all common in the Skagerrak and Norwegian Trench today, inhabiting different niches in an organic-rich environment (Alve and Murray, 1995; Bergsten et al., 1996; Conradsen et al., 1994; Qvale and Van Weering, 1985; Van Weering and Qvale, 1983) (Figure 1B).
The subdivision into zones is based on differences in the relative frequencies between the dominant species (FCM analysis). The FCM analysis shows that the lowermost part of the record is clearly defined by cluster FC 5 (Figure 2), but after 8000 cal. yr BP the assemblages show greater variability, as revealed by the flickering expression of the FCM memberships, and by the disappearance and reappearance of the five remaining clusters.
Zone 1; 9300–8000 cal. yr BP
Assemblage zone 1 is almost identical to assemblage zone D of Erbs-Hansen et al. (2011). The characteristic assemblage for this cluster (Figure 3) is co-dominated by the boreal species C. laevigata and P. osloensis, and other boreal species occur in lower percentages (M. barleeanus, B. marginata, E. excavatum, excl. forma clavata). The arctic species C. neoteretis is represented by a relatively high percentage in this cluster’s characteristic assemblage, even though it is considered to represent a full interglacial environment (Erbs-Hansen et al., 2011).
The faunal composition in zone 1 does not have any modern equivalent in the Skagerrak. Today, C. neoteretis is found further to the north and in relatively deep (500–1500 m) waters along the Norwegian coast, and it is common in the Barents Sea (Mackensen and Hald, 1988, as C. teretis). Cassidulina laevigata, on the other hand, dominates the living assemblages on the northern North Sea plateau, and it occurs on the Norwegian continental margin, mainly down to 500 m, in areas bathed by unaltered Atlantic Water (Mackensen and Hald, 1988). During the early Holocene, C. neoteretis and C. laevigata co-existed in areas with high meltwater influx on the northern Norwegian shelf, but the ameliorated temperature conditions after 7800 14C yr BP favoured C. laevigata and forced C. neoteretis down-slope (Mackensen and Hald, 1988).
Zone 1 is characterized by a diversity index ranging from 2.0 to 2.5, which is primarily the effect of species richness, and corresponds to low foraminiferal flux values, a high carbonate content and fluctuating TOC and C/N ratio (Figures 4 and 6). Fluctuations in δ13C values are small, although larger than in the remaining part of the record (Figure 5).
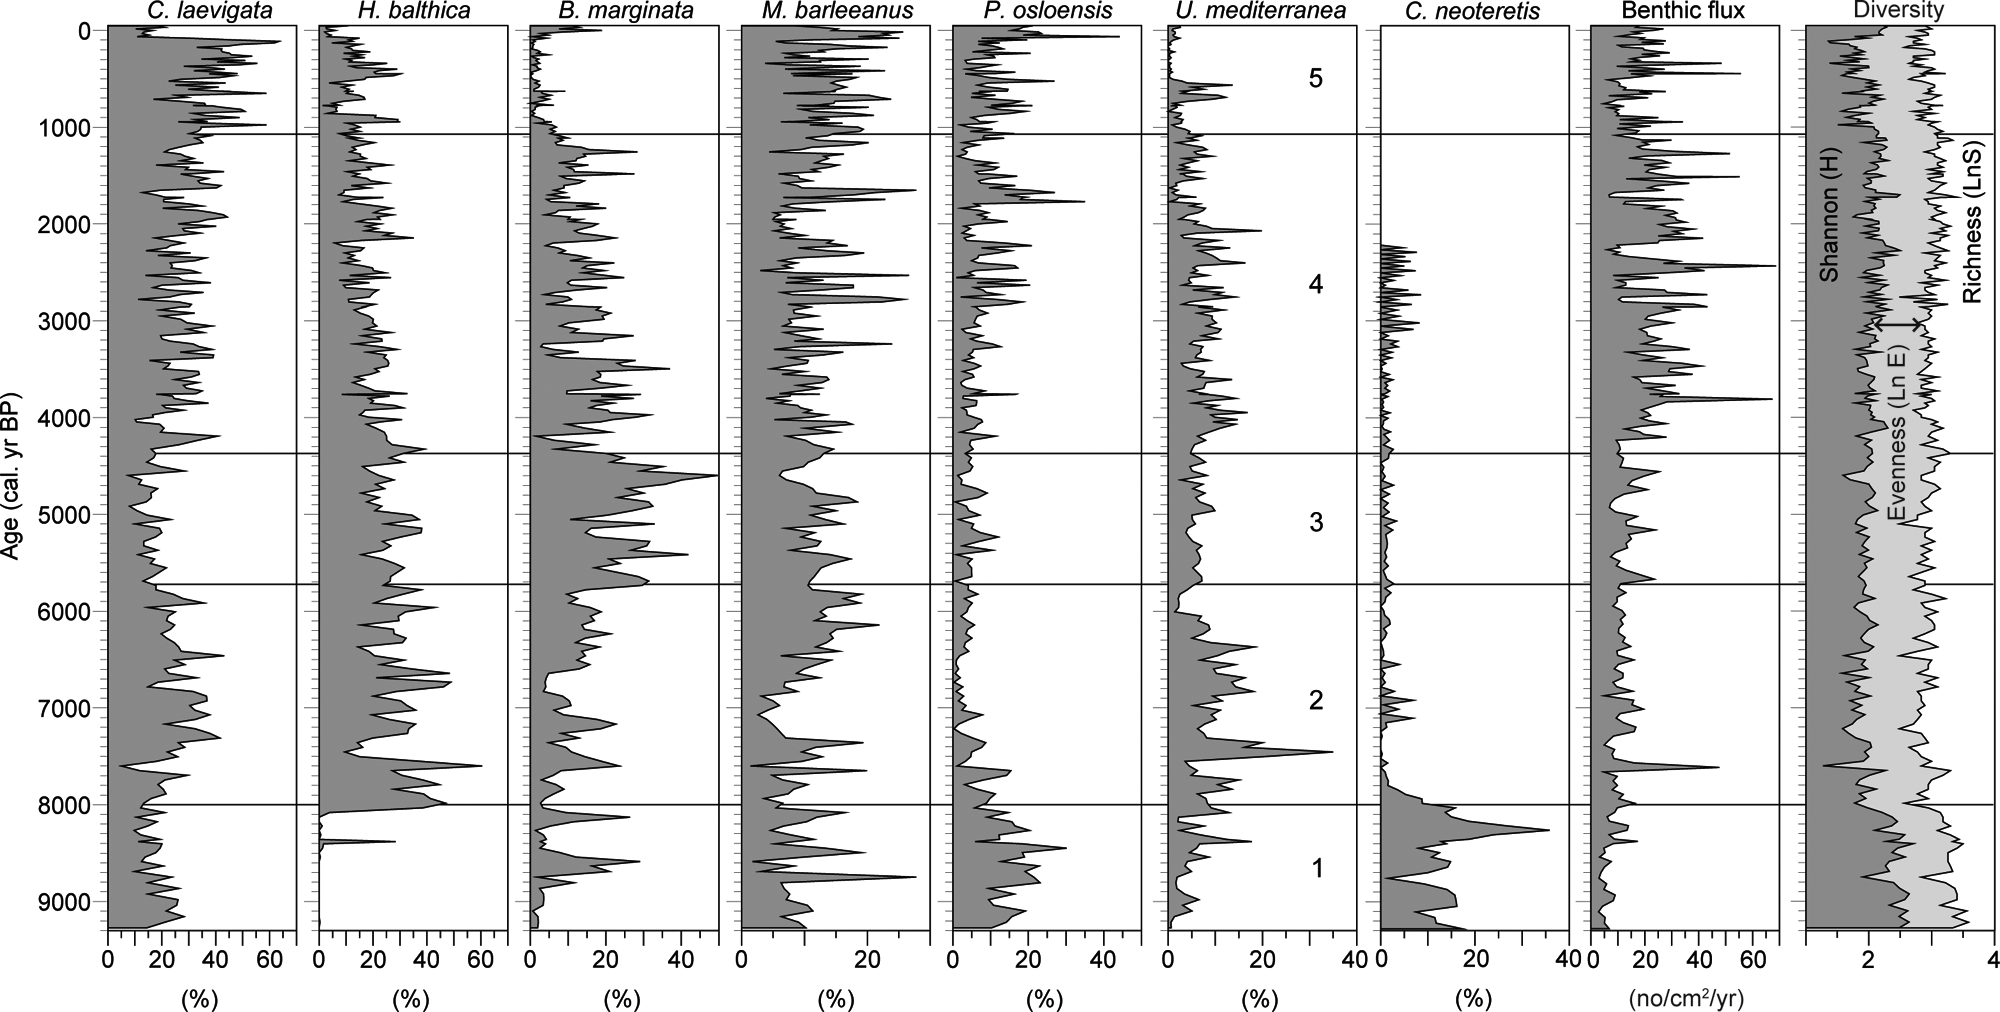
Percentage distribution of the most important taxa together with the benthic foraminiferal flux and the Shannon diversity index, which is separated into the species richness and evenness component (e.g. Hayek and Buzas, 1997)

Stable carbon and oxygen isotope data for the studied interval. The oxygen isotope values have been corrected for vital effect and normalized to M. barleeanus and hereafter corrected for the ice-volume effect using the Fairbanks (1989) sea-level curve, as dated by Bard et al. (1990) with a correction of 0.11‰ δ18O per 10 m sea-level change

Sedimentological parameters (carbonate content, TOC and C/N ratio) and summer bottom palaeotemperature (SBT) and palaeosalinity (SBS) estimates for core MD99-2286 compared with the NorthGRIP δ18O-record (Rasmussen et al., 2006), the annual mean air temperature reconstructions from Lake Flarken (Seppä et al., 2005) and the δ18O-record from Lake Igelsjön (Hammarlund et al., 2003) in central Sweden
The δ18O-based palaeotemperatures (Figure 6) are relatively high in zone 1, but decrease toward the end of the zone from c. 8.5 to 8.0°C. An opposite trend is seen for the transfer function-based temperatures, which show a generally increasing trend from 5° to around 7°C towards the end of zone 1. The diverging trend in these two independent temperature records could be caused by an increased freshwater inflow resulting in a high δ18O-derived palaeotemperature. Towards the end of the zone, the temperature level for the two different records is similar.
The palaeosalinity estimates show a short-term decrease at about 8200 cal. yr BP, which appears to be driven by an increase in C. neoteretis (Figure 4). A similar pattern is not seen in the other parameters, except for a minor decrease in the δ18O-based temperature.
Zone 2; 8000–5750 cal. yr BP
The transition from zone 1 to zone 2 (Figures 3, 4) is defined by a loss of FC 5, and alternating dominance of clusters FC 1 and FC 6 (Figure 2). In the lower part of zone 2 (8000–7500 cal. yr BP), samples are generally dominated by cluster FC 1, which is characterized by high abundance of H. balthica and C. laevigata, with B. marginata, M. barleeanus and U. mediterranea as minor components. During the following 200–300 years, the samples mainly have the highest memberships to cluster FC 6, which is dominated by C. laevigata with abundant H. balthica. The abundances of the accessory species are almost similar in clusters FC 6 and FC 1. For the remaining part of zone 2, the membership alternates between the two clusters.
Hyalinea balthica and C. laevigata are both common species in the Skagerrak today. Cassidulina laevigata is dominant on the slopes of the Norwegian Trench bordering the deepest parts of the Skagerrak, at 80–300 m depth, where it inhabits the transitional zone between the variable surface water and more stable deep water (Conradsen et al., 1994; Qvale and Van Weering, 1985; Van Weering and Qvale, 1983). It is a cosmopolitan species with a wide geographical distribution in the North Atlantic, to 70–72°N (Klitgaard-Kristensen and Buhl-Mortensen, 1999; Mackensen and Hald, 1988). Cassidulina laevigata prefers areas with continuous replacement of water masses with oceanic characteristics, and it tolerates high amounts of organic matter (Bergsten et al., 1996; Corliss and van Weering, 1993; Klitgaard-Kristensen and Buhl-Mortensen, 1999; Klitgaard-Kristensen and Sejrup, 1996; Klitgaard-Kristensen et al., 2002).
Hyalinea balthica is a Boreal–Lusitanian species (Nørvang, 1945), which does not dominate any specific faunal province in the modern Skagerrak. It is, however, common in the relatively deep parts of the Skagerrak in both the C. laevigata and B. skagerrakensis faunal provinces (Conradsen et al., 1994; Qvale and Van Weering, 1985) (Figure 1B). It is also common in the outer Oslo Fjord (Risdal, 1964; Thiede et al., 2009), where it inhabits the transitional layer of the water column (Alve and Nagy, 1990). Hyalinea balthica has often been found to correlate positively with organic matter and/or to be related to lowered oxygen levels (e.g. Fontanier et al., 2002; Klitgaard-Kristensen and Buhl-Mortensen, 1999; Klitgaard-Kristensen et al., 2002; Qvale and Van Weering, 1985).
Zone 2 can be interpreted as a temperate interval, possible slightly warmer than at present, as indicated by the partial dominance of H. balthica. In addition, U. mediterranea, a species which is generally found abundant at lower latitudes (e.g. Lutze, 1986; Schönfeld, 2006) and confined to warmer waters (Sejrup et al., 2004), has its maximum abundances in this zone. The faunal interpretation of a relatively warm climate in zone 2 is supported by the transfer function-based palaeotemperatures, which are the highest for the entire record, although decreasing towards the top of the zone. The δ18O-derived temperatures for zone 2 show a similar pattern.
The benthic foraminiferal flux values and the diversity index show only minor variations in zone 2, except for a large peak in flux around 7600 cal. yr BP that coincides with a drop in diversity driven by dominance of a single taxon, H. balthica (i.e. less evenness, Figure 4).
The carbonate content decreases throughout the zone, and the TOC content and C/N values show large variations with C/N values that indicate terrestrial influence until 7500 cal. yr BP. This is followed by more stable C/N values indicating marine sedimentation (e.g. Lamb et al., 2006; Redfield, 1934).
Zone 3; 5750–4350 cal. yr BP
Zone 3 is dominated by cluster FC 2 with a short-term appearance of FC 1 around 5000 cal. yr BP. The characteristic assemblage for FC 2 is dominated by B. marginata with abundant H. balthica and C. laevigata. Today, B. marginata dominates along the Swedish coast, where it is associated with stratified and seasonally variable water masses with high amounts of organic matter (e.g. Conradsen, 1995; Corliss and van Weering, 1993; Klitgaard-Kristensen and Buhl-Mortensen, 1999; Klitgaard-Kristensen et al., 2002). Bulimina marginata tolerates slightly reduced salinity (30–35) and has a temperature range of 0–16°C (Conradsen et al., 1994; Van Weering and Qvale, 1983). It can be associated with variations in the current flows, which are indirectly related to the outflowing water from the Baltic Sea (i.e. the Baltic Current) (Conradsen et al., 1994).
In the modern Skagerrak, the most important accessory species in the B. marginata faunal province is Nonionellina labradorica (Conradsen et al., 1994), whereas a B. marginata-H. balthica co-dominated assemblage is found in the stratified waters of the Fladen Ground in the North Sea (Klitgaard-Kristensen and Sejrup, 1996; Klitgaard-Kristensen et al., 2002). This suggests that a similar environment with stratification and possibly reduced oxygen contents may have prevailed in the Skagerrak during deposition of zone 3.
The transfer function-based palaeotemperature and palaeosalinity estimates are stable in zone 3, approximately 7°C and 35.15, respectively. The δ18O-based palaeotemperatures show an increase from around 7° to 8°C between 5500 and 5200 cal. yr BP, followed by a decrease to a stable level of around 7°C after c. 4900 cal. yr BP, which corresponds to the estimated transfer function-based temperature.
Zone 4; 4350–1100 cal. yr BP
Zone 4 is mainly dominated by FC 6, but alternating with FC 2 in the beginning of the zone and then with FC 3 towards the end of the zone. The dominance of C. laevigata with abundant H. balthica in FC 6 is similar to modern faunas in the Skagerrak, even though H. balthica is less abundant today than in zone 4. Time intervals dominated by cluster FC 2 in the early part of zone 4 suggest a migration of the B. marginata faunal province to the core location and/or more pronounced stratification favouring a B. marginata-H. balthica dominated fauna.
After c. 3000 cal. yr BP, however, the influence of FC 2 diminishes and is replaced by short periods with dominance of cluster FC 3, which also is dominated by C. laevigata, but with P. osloensis and M. barleeanus as abundant accessory species. Both accessory species are abundant in organic-rich environments, and they have been shown to thrive in environments rich in refractory carbon (i.e. low-quality nutrients) (Alve, 2010; Fontanier et al., 2002). Laboratory experiments by Alve (2010) showed that M. barleeanus and P. osloensis became more abundant during a period of 2 years, during which no fresh phytodetritus was added to the tanks. Thus, the peaks in FC 3, and hereby M. barleeanus and P. osloensis, could indicate periods with low-quality nutrient supply. The fact that the FC 3 cluster coincides with minima in the benthic foraminiferal flux (Figures 2, 4) in a generally high-flux interval, supports this interpretation.
The carbonate content is slightly higher in zone 4 than in zone 3, and the curve pattern appears to be similar to that for the flux curve, suggesting that productivity was generally relatively high in zone 4, as also suggested by the marked increase in TOC after 4000 cal. yr BP. The stable C/N ratio of around 7–8 suggests marine organic productivity (see above).
Just before 2000 cal. yr BP, an increase in the δ18O values occurs within, but close to the beginning of the M. barleeanus record. This change has, however, been disregarded in the environmental interpretation because of the measurement uncertainty connected to the change from one laboratory to another at around that level (see above).
Zone 5; 1100 to −49 cal. yr BP
In zone 5, the samples largely belong to cluster FC 4 with short intervals of membership to FC 3. The characteristic assemblage for FC 4 is strongly dominated by C. laevigata with H. balthica, M. barleeanus and P. osloensis as accessory species. Zone 5 appears to be a time interval with continuous replacement of oceanic water and with abundant fresh phytodetritus, which mostly favoured C. laevigata, interrupted by short periods of limited phytodetritus supply (cf. Alve, 2010; Klitgaard-Kristensen and Sejrup, 1996; Klitgaard-Kristensen et al., 2002).
The expanded diagram for the last 2000 years (end of zone 4 and zone 5; Figure 7) shows how peaks in FC 3 (less dominance of C. laevigata) correlate to minima in foraminiferal flux, particularly during the time interval 1100–500 cal. yr BP (

Expanded diagram for selected proxies during the last 2000 years compared to the reconstructed winter NAO index (Trouet et al., 2009) and the informal historical periods RWP (‘Roman Warm Period’), DACP (‘Dark Ages Cold Period’), MWP (‘Medieval Warm Period’) and LIA (‘Little Ice Age’) (e.g. Hass, 1996; Soon and Baliunas, 2003). Periods with indication of cold conditions are highlighted with grey. The horizontal line at 1100 cal. BP indicates the boundary between foraminiferal zones 4 and 5
Discussion
In accordance with the results of Conradsen et al. (1994) for modern foraminiferal distribution patterns in the Skagerrak, the foraminiferal distribution in core MD99-2286 appears to be largely controlled by temporal changes in the distribution of certain water masses in the area. It should be mentioned, however, that Jorissen et al. (1995) and Fontanier et al. (2002) found that the main controlling factors for the distribution, density and microhabitat of foraminifera were the organic flux and trophic conditions at the sea floor (and to a smaller extent the oxygen availability), rather than water masses. However, for fossil foraminiferal records in cores such as MD99-2286, the microhabitat differences are blurred, i.e. by bioturbation and re-suspension, and the nutrient availability, which is a major controlling factor for the foraminiferal distributions, is closely connected to the water masses in the area.
Early to mid Holocene (9300–4350 cal. yr BP)
The early- to mid-Holocene interval of MD99-2286 comprises three foraminiferal assemblage zones. The environment between 9300 and 8000 cal. yr BP (zone 1) was characterized by Erbs-Hansen et al. (2011) as full interglacial with a cold interval around 8300–8200 cal. yr BP, corresponding to the cold 8.2 ka event (Alley and Ágústsdóttir, 2005).
The time interval 9000–8000 cal. yr BP was a period of significant changes in the marine environment in the Skagerrak and North Sea, which was partly caused by the relative sea-level rise, termed the Littorina transgression (e.g. Behre, 2007; Knudsen et al., 1996; Lambeck, 1999; Leth, 1996; Nagy and Qvale, 1985; Nordberg, 1991). The variable C/N values between 9000 and 7500 cal. yr BP indicate a terrestrial influence at MD99-2286, which could be explained by flooding of former land areas resulting in transport of terrestrial organic material to the sea floor.
The transgression led to the opening of the Danish straits around 9000–8200 cal. yr BP, as well as the opening of the English Channel between 9000 and 7700 cal. yr BP (cf. Björklund et al., 1985; Conradsen, 1995; Conradsen and Heier-Nielsen, 1995; Jiang et al., 1997; Lambeck, 1999; Nordberg, 1991) or 9150–7950 cal. yr BP (cf. Behre, 2007).
The opening of the Danish straits terminated the Ancylus freshwater stage in the Baltic Sea area (Björck, 1995) and initiated the outflow of fresh water, and later brackish water from the Baltic Sea into the Kattegat and Skagerrak. Slightly elevated δ18O-based palaeotemperature estimates for zone 1 (Figure 7) could be caused by this increase in the freshwater supply to the area.
The opening of the English Channel created a direct route for inflow of the warmer Atlantic waters off northern France into the North Sea. According to Behre (2007), the opening was initially rather narrow, but by 7950 cal. yr BP it had obtained its present width, and the Dogger Bank area of the North Sea had been flooded.
These major environmental changes in the North Sea and Kattegat must have affected the hydrography and the oceanic circulation in the Skagerrak considerably, and marked changes in foraminiferal fauna and sedimentological parameters in that area have been ascribed to the transgression (e.g. Conradsen, 1995; Conradsen and Heier-Nielsen, 1995; Gyllencreutz, 2005; Gyllencreutz and Kissel, 2006; Jiang et al., 1997; Klitgaard-Kristensen et al., 2001; Knudsen et al., 1996; Nagy and Qvale, 1985).
However, the exact timing of these events has not been established, and neither is the environmental response fully understood. Even within the studied core record, the major changes in the different environmental proxies are not coordinated. Gyllencreutz (2005) and Gyllencreutz and Kissel (2006) found the largest change in grain size and magnetic properties at around 8500 cal. yr BP, whereas the most important shift in the foraminiferal fauna occurred at around 8000 cal. yr BP (this study), but both changes are being related the opening of the English Channel and the Danish straits. These differences in the timing of environmental response for different proxies within the same core indicate that a series of changes presumably occurred over a long time period, and that specific parameters have different thresholds in response to changes in the hydrographic environment.
The opening of the English Channel and the Danish straits is suggested to have initiated the modern current system (e.g. Conradsen and Heier-Nielsen, 1995; Leth, 1996; Nordberg, 1991). An increase in the sortable silt fraction in MD99-2286 (Figure 2) further suggests that this resulted in enhanced current speed in the area. A decrease in δ13C around 8800 cal. yr BP (Figure 5), followed by increase and rather fluctuating values after 8500 cal. yr BP, indicates a coincidental change in the water masses.
The slight dominance of C. laevigata (together with P. osloensis and C. neoteretis) before 8000 cal. yr BP shows that the core locality was situated at the transitional zone between two water masses (Klitgaard-Kristensen et al., 2001). At 8000 cal. yr BP, H. balthica appears and dominates instantaneously, a change which is also seen in the GIK 15530-4 core (Nagy and Qvale, 1985) and in Voldafjorden, southwest Norway (Sejrup et al., 2001). It is likely that the outflowing water from the Baltic enhanced the stratification in the Skagerrak, creating favorable living conditions for H. balthica, and that this, combined with the opening of a migration route through the English Channel, provided the explosive bloom of this species. The short-term peak in H. balthica at 8400 cal. yr BP suggests that such conditions were actually established even earlier, but the bloom was interrupted by the 8.2 ka cold event.
Between c. 8000 and 6000 cal. yr BP, there is a weak indication of ameliorated temperature conditions, which is particularly seen in the transfer function-based palaeotemperatures and in the abundance of U. mediterranea. This could reflect the Holocene Thermal Maximum (HTM) in our record, but, as also described for other marine records in the area such as Skagen 3 and GIK 15530-4 (Conradsen and Heier-Nielsen, 1995; Nagy and Qvale, 1985), the HTM is not distinct in the study area. The HTM was recorded as a period with warm and dry summers in lake records from southern Sweden (8000–4300 cal. yr BP; Figure 7), which were presumably governed by stable summertime anticyclonic circulation that reduced the influence of the westerlies (Hammarlund et al., 2003; Heikkilä and Seppä, 2010; Seppä et al., 2005, 2009; St. Amour et al., 2010; Weckström et al., 2010).
The assemblages between 5750 and 4350 cal. yr BP (zone 3) in MD99-2286 indicate that there was a pronounced stratification at the core locality, and the B. marginata faunal province appears to have occupied relatively large areas off the Swedish coast. This could indicate an increase in the freshwater outflow from the Baltic, as also indicated by the depleted δ18O values at 5500–5000 cal. yr BP. These observations are in accordance with the results of a study of salinity changes in the Baltic Sea by Emeis et al. (2003), who found evidence of increased precipitation in the Baltic area between c. 6000 and 4000 cal. yr BP and concluded that this time period had warm summers and wet winters.
The magnetic properties in core MD99-2286, on the other hand, suggest a Danish/Atlantic sediment source at MD99-2286 between 6300 and 4700 cal. yr BP (Gyllencreutz and Kissel, 2006), and Jiang et al. (1997, 1998) interpreted a major change in diatom assemblages in the Skagen 3 core (northern Denmark) to be caused by a strengthening of the Jutland Current during the same time interval. An increase in the strength of the Danish/Atlantic magnetic signal could be caused by the final flooding of the Jutland Bank area in the North Sea, which occurred around 6400–6200 cal. yr BP (cf. Leth, 1996). This final flooding presumably resulted in the initiation of the flow of Jutland coastal water, which is transporting erosion products from the Danish west coast into the Skagerrak.
The formation of the South Jutland Current, combined with possible increase in outflow of Baltic water, could have led to the creation of the Skagen front, which is parallel to the Swedish coast below c. 10 m (Gustafsson and Stigebrandt, 1996). It is possible that the geographical distribution of the B. marginata faunal province is determined by this front, and that the enhancement of the currents in this time period pushed the B. marginata province further into the basin. A relationship between B. marginata and the Skagen front is, however, for future studies to determine.
Late Holocene (4350 cal. BP to the present)
The flickering pattern of the FCM clusters after 4350 cal. yr BP, with subtle changes in the foraminiferal fauna, indicates a highly variable environment comparable to the modern-type circulation influenced both by Atlantic and Baltic waters. The rapid shifts between clusters FC 6 and FC 2 between 4350 and 3000 cal. yr BP suggest periods of enhanced Baltic water influence (FC 2), as also supported by the magnetic properties of the sediment that indicate the Baltic area as the source region between 4000 and 1200 cal. yr BP (Gyllencreutz and Kissel, 2006). The general increase in sortable silt after 4350 cal. yr BP suggests enhanced turbidity, and the increasing TOC values and stable C/N ratio, together with a high benthic foraminiferal flux, suggest increased productivity. There were, however, periods of limited nutrient supply to the sea floor, as indicated by peaks in FC 3, which is negatively correlated to flux and C. laevigata.
The transition from zone 3 to 4 in MD99-2286 at 4350 cal. yr BP coincides with the onset of the Neoglacial cooling, which is recorded in numerous proxies in the region as a shift to cold, moist conditions with enhanced westerly airflow (e.g. Andersson and Schoning, 2010; Emeis et al., 2003; Hammarlund et al., 2003; Heikkilä and Seppä, 2010; Jiang et al., 1997, 1998; Seppä et al., 2005, 2009; St. Amour et al., 2010; Weckström et al., 2010). A similar shift to the modern-type circulation pattern is also recorded in the Norwegian Trench around 4000 cal. yr BP (Klitgaard-Kristensen et al., 2001).
At around 1100 cal. yr BP (the transition from zone 4 to 5), there is a change to a totally C. laevigata-dominated assemblage (FC 4) (Figures 2 and 3) and almost disappearance of B. marginata from the core locality (Figure 4), which indicates enhanced Atlantic Water influence. This coincides with an indication in the magnetic properties of a shift to a Danish source area (Gyllencreutz and Kissel, 2006). Periods with low-quality nutrients seem to correlate to enhanced turbidity (increase in sortable silt) and increasing TOC content (Figure 7).
The assemblages and isotopes in MD88-2286 indicate a slight rise in temperature in the time interval 1100–500 cal. yr BP (
The environmental change at c. 500 cal. yr BP (
The disappearance of U. mediterranea and the overall cooling at the sea floor after
The period
Conclusion
A high-resolution multidisciplinary study of the last 9300 cal. yr BP in the Skagerrak (MD99-2286) reveals a dynamic hydrographic environment manifested as subtle faunal changes. Minor temporal variations in the foraminiferal faunal composition have been extracted by using the multivariate technique fuzzy c-means, which has also served as a key to understand other parameters in the core and to link changes in the record to the hydrographic environment.
The 9300–5750 cal. yr BP interval was a period of relatively large changes in the hydrographic environment due to the Littorina transgression and the opening of the English Channel and Danish straits, as well as the initiation of the modern circulation system. Slightly ameliorated temperature conditions between 8000 and 5750 cal. yr BP is related to the Holocene Thermal Maximum.
The period 5750–4350 cal. yr BP was characterized by an increase in the Baltic water influence, as revealed by depleted oxygen isotope values, as well as an expansion of the B. marginata faunal province in the Skagerrak, presumably a result of enhanced stratification caused by increased winter precipitation in the Baltic area.
A shift to cold, moist conditions with strong westerly airflow at the transition to the Neoglacial cooling, 4350 cal. yr BP, is indicated by enhanced turbidity coinciding with an increase in total organic carbon and subtle changes in the foraminiferal assemblages. A detailed study of the structures in the foraminiferal assemblages during the last 2000-year record has shown that a high supply of low-quality nutrients correlates positively with warm periods, i.e. the ‘Roman Warm Period’, ‘Medieval Warm Period’ and modern warming.
Footnotes
Acknowledgements
The core material was obtained from the MD114 IMAGES V cruise in 1999. We are grateful to the Institut Paul-Emile Victor (IPEV) for the IMAGES coring operations onboard R/V Marion Dufresne. The late Svend Meldgaard Christiansen, Aarhus University, Denmark, is thanked for the laboratory processing for the foraminiferal analysis as are Ulysses S. Ninnemann and Rune E. Søraas, University of Bergen, Norway, for the stable isotope measurements. The total carbon and nitrogen measurements were performed by Heike Siegmund and Paul Frogner Kockum and the coulometric carbonate measurements by Åsa Wallin and Klara Hajnal, all at Stockholm University, Sweden. We thank Heikki Seppä, University of Helsinki, Finland, for providing lake data, Jesper Olsen, Queen’s University Belfast, United Kingdom, for age modelling and Glenn W. Johnson, University of Utah, USA, for fruitful statistical discussions.
The work has been funded as a PhD project (for DREH) by the Faculty of Science and SOAS (International School of Aquatic Sciences), Aarhus University, and it is a contribution to the Danish Natural Science Research Council projects 272-06-0566 (SKAGIS) and 09-072321 (GREEN-ICE). Original data can be found at: doi:10.1594/PANGAEA.761152