



Abstract
In order to calibrate radiocarbon ages based on samples with a marine carbon component it is important to know the marine carbon reservoir correction or ΔR value. This study measured the ΔR on both known-age pre-bomb marine shells and paired marine and terrestrial samples from two regions on the west coast of South Africa: the southwestern Cape and Namaqualand. Pooling the data by region produces ΔR values that are similar enough to use a west coast weighted mean ΔR of 146 ± 85 14C years to correctly calibrate marine shell or mixed marine and terrestrial 14C ages. There are however temporal differences in ΔR throughout the Holocene, which we compare with proxy data for upwelling and sea surface temperatures.
Introduction
Many of the world’s archaeological sites are located along coastlines and consist primarily of marine shell middens. Since shells are bulky, middens typically accumulate rapidly and therefore have the potential to yield finely resolved sequences of observations about past economic and settlement strategies. Many middens lack abundant bone or charcoal that can be used to determine the radiocarbon age of the occupation but it has long been known that marine organisms which lived contemporaneously in different water masses have different apparent ages relative to terrestrial organisms (Mangerud and Gulliksen, 1975). This marine radiocarbon offset is most pronounced in upwelling regions such as the west coasts of continents (Figure 1). Fortunately, methods have been developed to correct for this regional radiocarbon offset and better calibrate radiocarbon ages obtained directly from marine shellfish or consumers of a marine or mixed marine/terrestrial diet (cf. Dewar and Pfeiffer, 2010; Reimer et al., 2009; Stuiver and Braziunas, 1993; Stuiver et al., 1986).

Simplified schematic of radiocarbon contents of the atmosphere and ocean. Globally, the shallow ocean has an apparent radiocarbon age of approximately 400 years, the deep ocean up to 1000 years owing to 14C decay in deep water with long turnover times. The difference in radiocarbon age between the atmosphere and surface ocean is the marine reservoir offset R(t). Ekman forcing induced by longshore trade winds displaces water westwards and leads to deep water welling up along the western margins of the continents, increasing the apparent age of the surface water. The difference between the actual radiocarbon age of the surface ocean in any particular region and the modelled global average is designated ΔR(t). In this example ΔR(t) = 200 14C years.
When calibrating a radiocarbon age measured from a marine sample, both the global marine reservoir effect R(t) and the regional or local marine reservoir correction ΔR must be incorporated in order to correctly estimate the corresponding calendrical age range. ΔR, the difference between the regional surface ocean 14C and the global surface ocean 14C may also vary with time (Stuiver et al., 1986).
The Marine09 calibration curve was constructed from an ocean–atmosphere box diffusion model using the atmospheric 14C record of IntCal09 as input for the period from 0 to 10.5 ka cal. BP and from coral and foraminifera measurements from 10.5 to 50 ka cal. BP (Reimer et al., 2009). The curve accounts for the time-dependent difference between the global surface ocean and the global atmospheric 14C ages, but requires an input of the ΔR value.
Oceanographic conditions off the west coast of southern Africa represent a very complex interaction between different oceanic water bodies. The dominant water is the cold Benguela Current that derives much of its water from the South Atlantic Current. Inshore the prevailing southeast trade winds drive one of the most prolific coastal upwelling systems in the world. The water supply to the upwelled system derives mainly from the South Atlantic Central Water (Shannon, 1985). From the perspective of the influence of these different water bodies on ΔR it is reasonable to assume that the surface mixed layer of the Benguela Current is in radiocarbon equilibrium with the atmosphere. In contrast upwelled water has a residence time between subduction and upwelling and will have a distinct and older radiocarbon signal. The relative contribution of upwelled versus Benguela Current water in the near coastal zone will determine the value of ΔR. Accordingly changes in the seasonality and intensity of upwelling will result in temporal and spatial variability in the value of ΔR. Under present oceanographic conditions the upwelling system is divided at approximately 27°S and upwelling to the south of this is typically seasonally pronounced in the austral summer months, while to the north the upwelling is more consistent throughout the year with peaks in winter. Within the southern Benguela upwelling region there are three low intensity, seasonal upwelling cells (Lutjeharms and Meeuwis, 1987; Nelson and Hutchings, 1983; Shannon and Nelson, 1996). The Namaqua cell is located at roughly 31°S, the Columbine cell at 33°S and the Peninsular cell at 34°S.
The upwelling system is made more complicated by other water sources that are entrained in the surface and upwelled water systems. The northern boundary of the upwelling system is called the Angola Benguela Front (ABF) where warm, south-flowing water in the Angola Current meets the inshore expression of the Benguela Current, located at about 17°S (Shannon et al., 1987). The position of this front appears to shift but it has never moved as far south as our study area (Jansen et al., 1996; West et al., 2004). However water from the Angola Current north of the ABF does occasionally flow southwards along the coast of Namibia in a condition known at Benguela Niño (Shannon et al., 1987). This warm surface water displaces the upwelled water and has been recorded as far south as 25°S. Palaeo-records suggest that during glacial times the prevalence of Benguela Niño may have been higher and may have been a seasonal occurrence as far south as 23°S (Kirst et al., 1999). Although the modern Benguela Niño phenomenon occurs to the north of our study area, its past dynamics could influence our northernmost sampling site because of the profound impact of this phenomenon on upwelling.
There are also complex oceanographic influences from the south. The shedding of warm Agulhas Current water from the Indian to the Atlantic Ocean is a part of the global thermohaline circulation (Gordon, 1996, 2003), and up to 25% of the water in the southern Benguela current may derive from the Agulhas Current (Garzoli and Gordon, 1996). As long as both Agulhas and Benguela surface waters are well mixed, this will make little difference to the 14C content, but the dynamic is complicated by the fact that Agulhas eddies can entrain water from south of the subtropical front (the boundary between subpolar water and subtropical water that is typically located near 40°S) and in this process water known as Antarctic Intermediate Water can be incorporated into the southern upwelling system on the west coast (Shannon et al., 1989). The northern upwelling cells are likely to contain exclusively South Atlantic Central Water (Shannon, 1985).
There are many palaeo-oceanographic records from the Benguela System, particularly from the northern system, but few have sufficient temporal resolution during the Holocene to allow detailed comparison with data presented in this study. It is not clear to what extent the upwelling forcing in the northern and southern Benguela upwelling system are coupled. A comparison between an offshore palaeotemperature record from the northern Benguela System (Farmer et al., 2005) and an inshore record from the southern Benguela System (Cohen et al., 1992) shows similar trends through the Holocene. This suggests some common forcing on the scale of global climate change events (such as the ‘Little Ice Age’ and Younger Dryas).
The southeast trade winds that force the northern Benguela upwelling system are controlled by the zonal position of the South Atlantic Atmospheric High Pressure (SAAHP) system and the African Low Pressure system. In the southern Benguela upwelling system the intensity of the southeast wind is controlled by the effect of the westerly wind belt that intensifies the pressure gradient in the SAAHP as it ridges between the westerlies and the south of the African continent. Furthermore the effect of changing upwelling intensity and seasonality, as well as the effect of variable water sources in the upwelling plumes, leads us to anticipate a gradient in ΔR when measured as a function of the distance from the coast. This challenges the use of offshore proxy data through time. The commonly cited high resolution proxy for sea surface temperature from Hole 1084B (Farmer et al., 2005) is derived from approximately 180 km offshore. Where spatial comparisons have been undertaken for sea surface temperature and upwelling proxies it has been shown that there is a great deal of variability (Kirst et al., 1999). Offshore manifestations of upwelling are reliant on offshore transport of upwelled water and accordingly are appropriate indications of the strength of upwelling plumes; the inshore manifestation will be less sensitive to the strength of upwelling plumes.
The coastline of South Africa is particularly rich in Holocene period shell middens. In 2002, Southon et al. measured two known-age pre-bomb marine shells and published two ΔR values from this region: 212 14C years from the ‘Cape of Good Hope’ and 197 14C years from the east coast over 600 km away. Both were based on single shells (Southon et al., 2002). Lewis et al. (2008a, 2008b) predicted a significantly larger value of ΔR for the west coast of South Africa/Namibia for the period
The radiocarbon ages 14C, sample material, and δ13C values of the known-age pre-bomb samples from the west coast of South Africa. The uncertainty in ΔR is the error in 14C age.
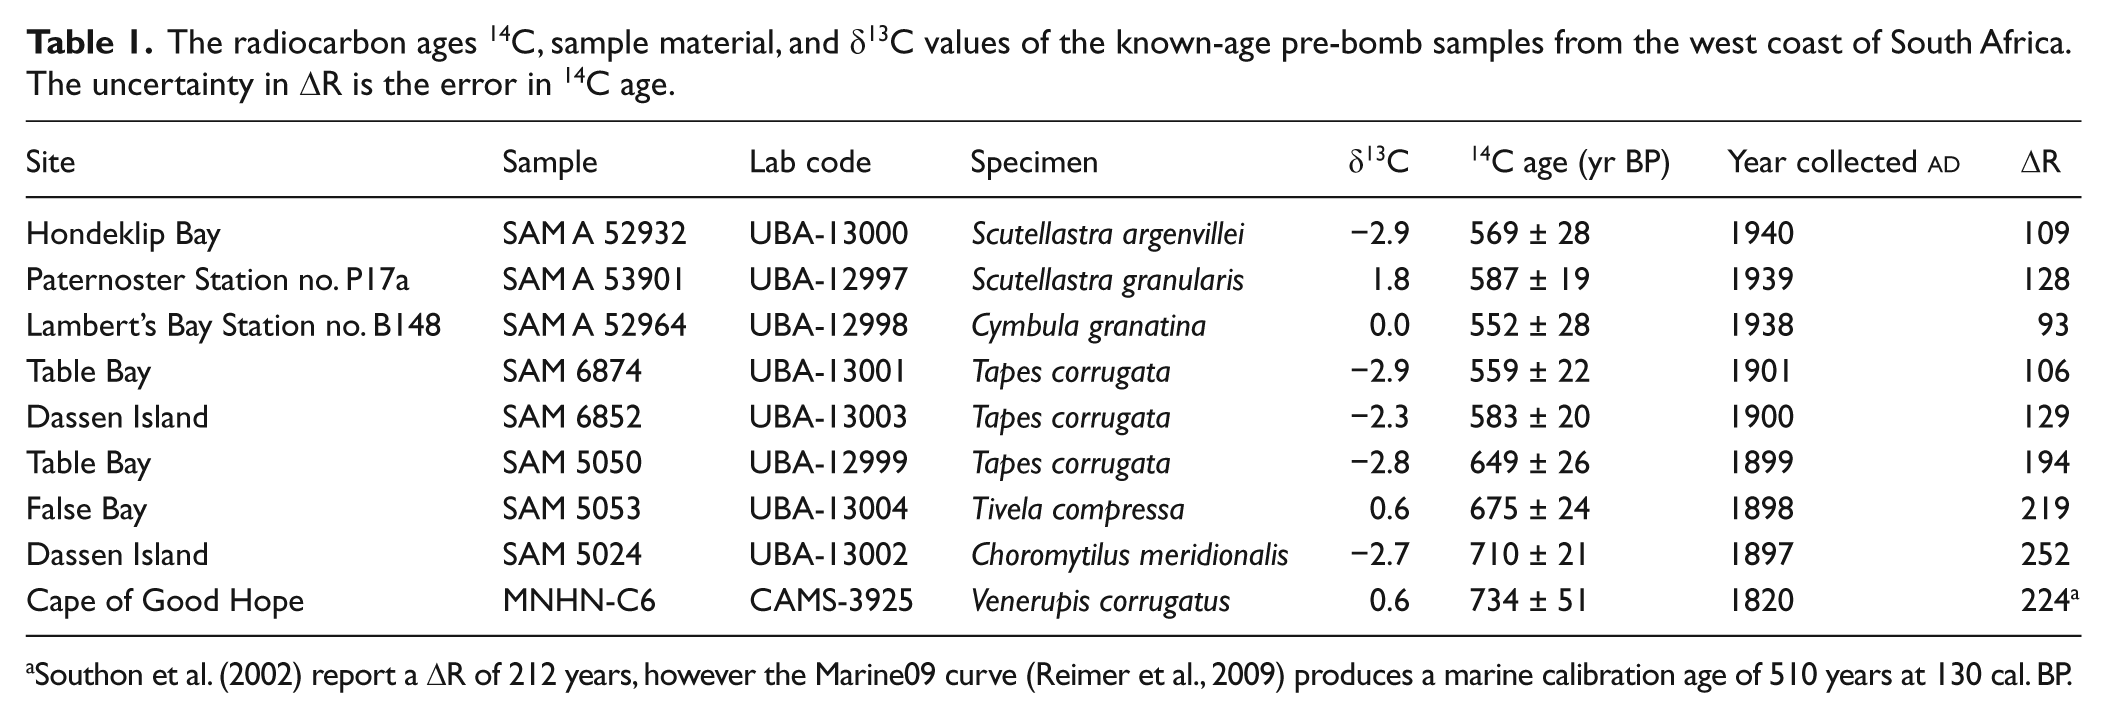
Southon et al. (2002) report a ΔR of 212 years, however the Marine09 curve (Reimer et al., 2009) produces a marine calibration age of 510 years at 130 cal. BP.
Radiocarbon dates on marine shells from the west coast that were run at the Pretoria laboratory were reported as uncalibrated ages (14C years BP) and calibrated ages (
Samples
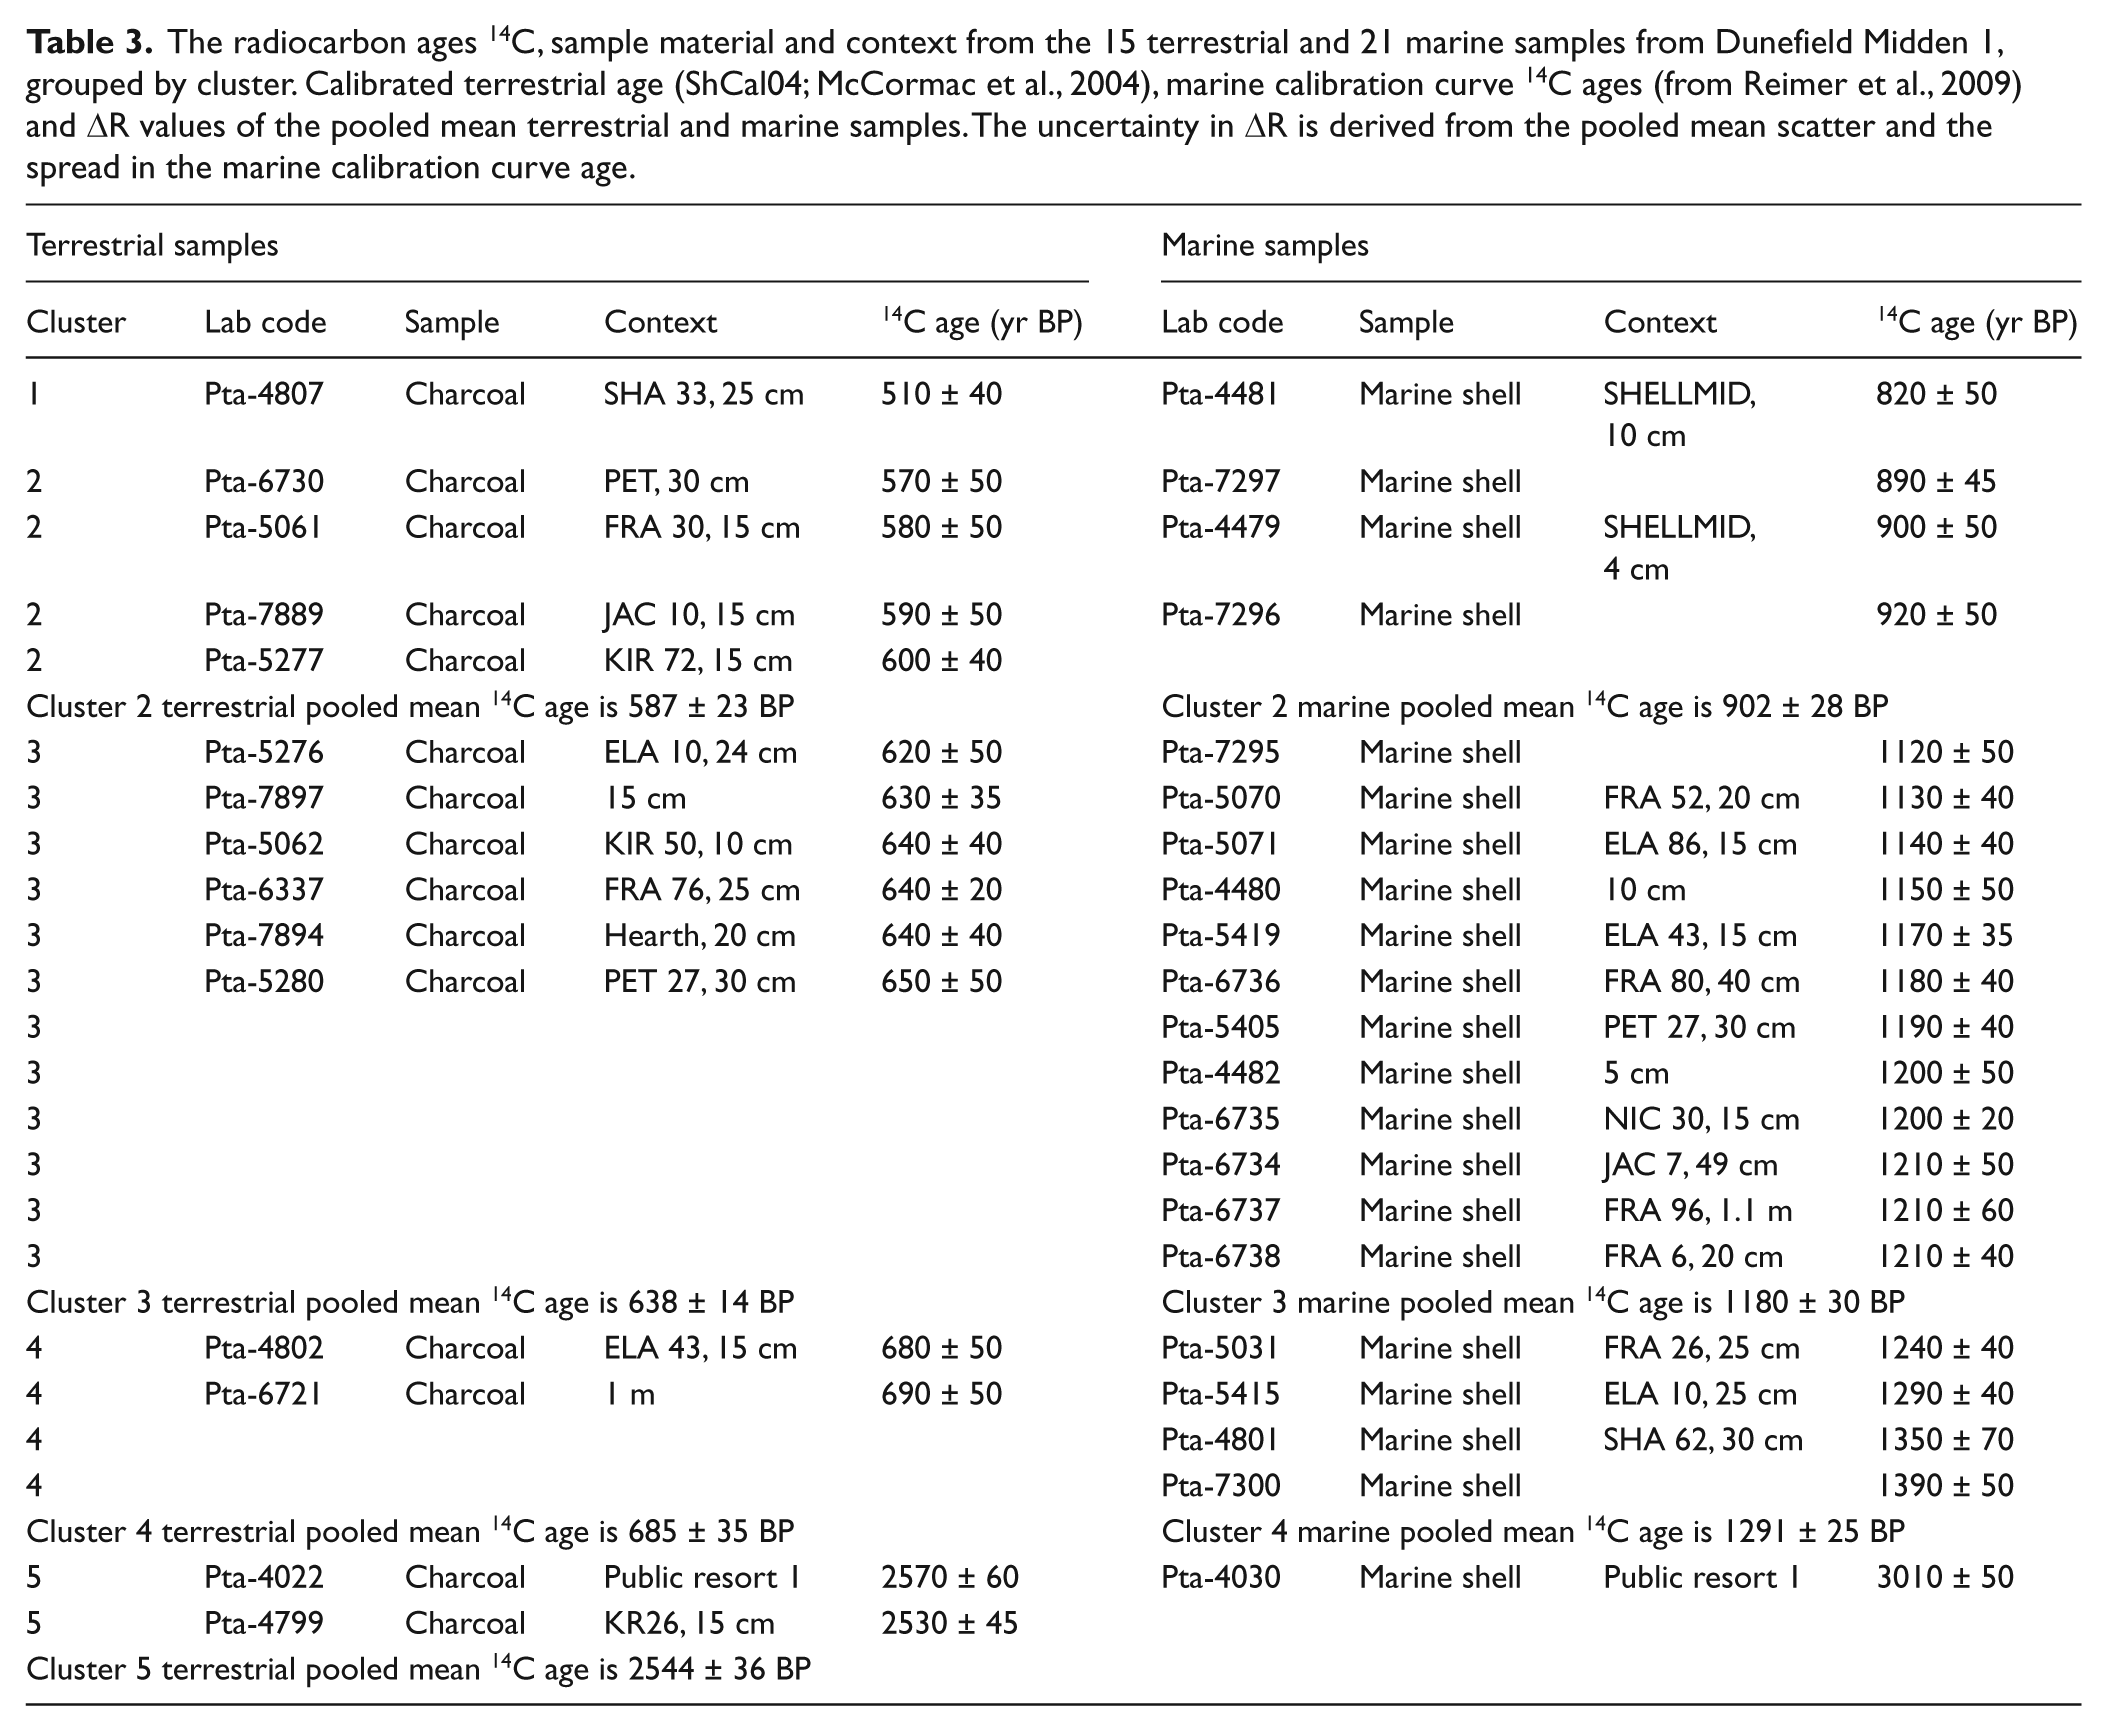
The known-age pre-bomb shells were obtained from the Iziko South African Museum, Cape Town and derive from two locales, the southwestern Cape in the south and Namaqualand in the north (Figure 2). The results from 36 unpaired and seven paired (n = 14) samples from the southwestern Cape region are provided by one of the authors (SW). The 34 unpaired radiocarbon ages on marine and terrestrial materials (14 terrestrial and 20 marine samples) come from the open-air coastal archaeological site Dunefield Midden 1 (DFM) (Figure 2 and Table 3). Across most of its extent, DFM comprises a number of occupations that are archaeologically discrete from one another (Parkington et al., 1992). Each site probably represents not more than a few weeks of occupation and can be treated as an instant in time for the purpose of this analysis. Lithic analysis and analysis of the radiocarbon ages suggests at least two temporally discrete occupations (Orton, 2002; Tonner, 2005) but we include the ages from the nearby Elands Bay Public Resort site 1 and suggest that there are five clusters in the radiocarbon ages with statistical means of 510 BP, 587 BP, 638 BP, 685 BP and 2544 BP (uncalibrated terrestrial samples). These five clusters are apparent in both the charcoal ages and the marine shell ages, but in the latter there are three shell ages (not shown) that appear to be intermediate between the clusters (Pta-4487, Pta-6732, and Pta-9396). Since the DFM occupations had areas of physical overlap, and since the radiocarbon ages were derived from multishell samples, there is a possibility that these three ages represent mixed samples. In terms of the archaeology this has been irrelevant but for the purpose of this analysis the samples are rejected and the remaining radiocarbon ages in each cluster are pooled (before calibration) on the assumption that they all date the same discrete event in time.

The west coast of South Africa showing locations mentioned in the text. Sampling localities for known-age pre-bomb shells are shown as grey circles, and those for paired terrestrial and marine samples as white circles. Positions of upwelling cells based on SST (modified from Nelson and Hutchings, 1983: figure 10, based on aerial radiation thermometry). Circle for Elands Bay encompasses Elands Bay Cave, Elands Bay Public Resort 1, Grootrif & Soutkloof 5.
In the Namaqualand region, five paired marine and terrestrial samples (n=10) were collected from coastal sites by one of the authors (GD).
The majority of archaeological samples were taken from single occupation units with good stratigraphic control. Paired samples were accepted if the provenience for both the marine and terrestrial materials were identical. Large trees are rare along the west coast of South Africa, but in order to avoid the old wood problem, bone samples were chosen over charcoal whenever possible. Herbivore bone was preferentially selected in order to avoid marine carbon input to the diet. However, one sample is from a probable bat-eared fox (Otocyon megalotis), primarily an insectivore (Skinner and Smithers, 1990). The marine shell samples consist of limpets (Scutellastra argenvillei, Scutellastra granularis, Cymbula granatina) and bivalves (Choromytilus meridionalis, Tapes corrugata, Tivela compressa, Venerupis corrugatus). As there are no carboniferous rocks or large inputs of freshwater in the vicinity (Ascough et al., 2005) and the molluscs do not burrow deeply into the sediments and feed on detritus there (Forman and Polyak, 1997), the species of mollusc should not affect the 14C value.
Radiocarbon methods
The samples collected specifically for this study were analyzed at the 14CHRONO Centre at Queen’s University Belfast. The shells were etched with 1% HCl to remove approximately 25% of the initial mass then hydrolyzed to CO2 with phosphoric acid. Charcoal samples were pretreated with acid-base-acid extraction (De Vries and Barendson, 1952). Collagen was extracted from the bone samples based on the method of Brown et al. (1988) using a Vivaspin® filter cleaning method introduced by Ramsey et al. (2004). The collagen was then freeze-dried. The organic samples were weighed into a quartz tube with an excess of copper oxide (CuO), sealed under vacuum and combusted to carbon dioxide (CO2). The CO2 samples were converted to graphite on an iron catalyst using the zinc reduction method (Hua et al., 2001; Mueller and Muzikar, 2002; Slota et al., 1987). The 14C/12C and 13C/12C ratios were measured by accelerator mass spectrometry (AMS) at the 14CHRONO Centre, Queen’s University Belfast. The sample 14C/12C ratio was background corrected and normalised to the HOXII standard (SRM 4990C; National Institute of Standards and Technology). The 14C age and 1 sigma were calculated using the Libby half-life of 5568 yr following the conventions of Stuiver and Polach (1977). The ages were corrected for isotope fractionation using the AMS-measured δ13C (not given), which accounts for both natural and machine fractionation. The uncertainty was taken as the larger of the counting statistics and the standard deviation of 7–8 measurements of 200 seconds each. No additional variance or laboratory multiplier was applied but we note that for known-age secondary standards the laboratory error multiplier was 1.04 during the measurement period of the samples. Samples for radiocarbon ages with Pta-prefixes were pretreated using the same protocol as the AMS samples, but measurements were made on proportional gas counters and δ13C values were determined by light isotope mass spectrometry. For the known-age pre-bomb samples, the ΔR value is the difference between the 14C age and the marine calibration curve age for the calendar year of collection (Reimer et al., 2009). The uncertainty is assumed to be the same as the age determination (Table 1) because the error on the calibration curve is included in calibration. When using the paired samples method, the ΔR value for each paired sample was calculated using the marine calibration curve radiocarbon age versus the atmospheric calibration data as outlined in Stuiver and Braziunas (1993) but using the SHCal04 (McCormac et al., 2004) and Marine09 calibration curves (Reimer et al., 2009). First the intersection of the terrestrial radiocarbon age at one standard deviation was determined. The difference between the measured shell age and the midpoint of these intersections yields the ΔR value (Table 2). The uncertainty in ΔR was determined from propagation of errors assuming no covariance (Reimer et al., 2002). The uncertainty of the pooled means was determined by the larger of the variance in the ΔR values and the empirical standard variation.
The radiocarbon ages 14C, sample material, calibrated terrestrial ages (ShCal04; McCormac et al., 2004), marine calibration curve 14C ages (from Reimer et al., 2009) and ΔR values of the paired terrestrial and marine samples from the west coast of South Africa. The uncertainty in ΔR is derived from the reported error in the shell age or pooled mean scatter and the spread in the model marine age.

Probable insectivore.
Gemsbok.
Pooled mean of both marine 14C ages.
Tortoise.
Bovid/tortoise.
Also published in Jerardino (2010).
Because of the inability of using ShCal04 at this time depth, 56 ± 24 years were subtracted from the 14C date (in order to be consistent with ShCal04) and IntCal09 was used to calibrate the terrestrial dates.
Results and discussion
West coast of South Africa
The results are presented in Tables 1 to 3 based on the method used to calculate the ΔR value. Integrating the known-age pre-bomb shell data, including the value for the Cape of Good Hope published by Southon et al. (2002) with the paired and unpaired results produce a weighted mean ΔR of 146 ± 85 14C years. This is low compared with the values predicted in previous studies. In order to test for spatial and temporal variation, the results are also presented by region and period.
Regional settings: southwestern Cape
Looking at regional variation, the data for the southwestern Cape consists of results from eight known-age pre-bomb shells, seven paired marine and terrestrial samples, and the five DFM clusters (Tables 1 to 3). Calculating the pooled mean 14C ages for both the marine and terrestrial components at DFM effectively produces a more robust ΔR value than single paired samples could provide for each cluster. Combining the ΔR values from all southwestern Cape data sources, including the Southon et al. (2002) value, produces a pooled mean ΔR of 147 ± 84 14C years, which is similar to the result based on all available data.
The radiocarbon ages 14C, sample material and context from the 15 terrestrial and 21 marine samples from Dunefield Midden 1, grouped by cluster. Calibrated terrestrial age (ShCal04; McCormac et al., 2004), marine calibration curve 14C ages (from Reimer et al., 2009) and ΔR values of the pooled mean terrestrial and marine samples. The uncertainty in ΔR is derived from the pooled mean scatter and the spread in the marine calibration curve age.
Regional setting: Namaqualand
The Namaqualand data set consists of the results from one known-age pre-bomb shell and five paired samples (Tables 1 and 2). Pooling the data produces a weighted mean ΔR of 138 ± 98 14C years for the region, also similar to the weighted mean for the entire west coast of South Africa.
Temporal variation
The samples used in this study span the Holocene and are presented based on the midpoint of the calibrated terrestrial age. The data are clustered rather than continuous with a large gap between 10,900 and 2600 cal. BP; nevertheless there are differences in ΔR values through time. There are six time periods represented by the current data set: the recent past 152 to 10 cal. BP, the ‘Little Ice Age’ 600 to 500 cal. BP, the Neoglacial period 1350 cal. BP and 2600 to 2000 cal. BP, the Younger Dryas 10,900 cal. BP, and 12,400 cal. BP.
These data are compared with the estimated ΔR values determined by previous research and both offshore and inshore proxy data for upwelling and sea surface temperatures (SST) (Figure 3). The offshore data were obtained from a marine sediment core (Ocean Drilling Program Leg 175 Hole 1084B) collected off the southern coast of Namibia (Farmer et al., 2005). Sea surface temperatures from this sample are based on Mg/Ca ratios of Globigerina bulloides shells while the relative abundance of the polar (left-coiling) foraminiferal species Neogloboquadrina pachyderma (NPS%) is used as an indicator of upwelling (Farmer et al., 2005). The interpolated linear age model for the offshore data set is based on 15 radiocarbon dates spanning the past 21,000 years with only three dates representing the past 5000 years. This means we can comment on trends rather than specific temperature values. The inshore proxy data for SSTs is based on the ratio of aragonite to calcite (% aragonite) and the δ18O values of two limpet species from archaeological deposits at Elands Bay Cave (Cohen et al., 1992). The age model for the inshore data set is more robust as it consists of 25 radiocarbon dates spanning the past 12,500 years with 18 dates representing the past 5000 years.
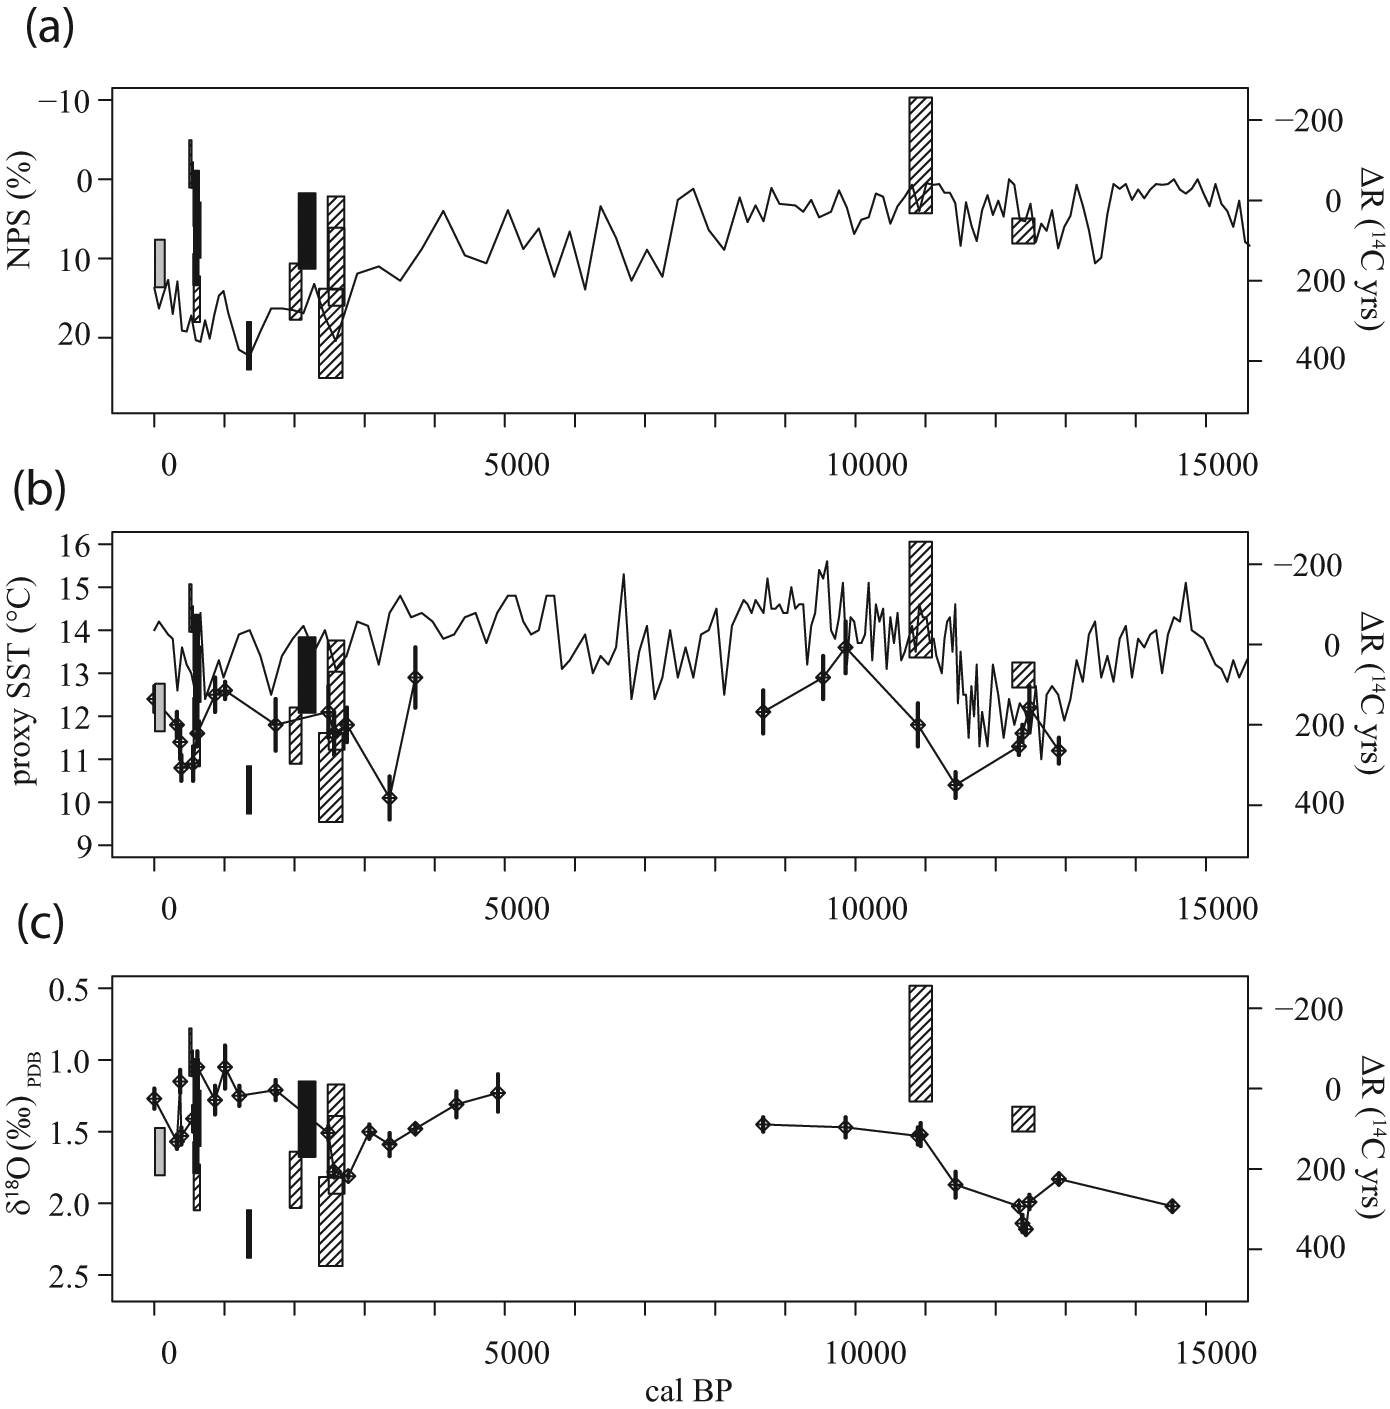
ΔR values compared with proxy records for upwelling intensity through time along the west coast of southern Africa (Cohen et al., 1992; Farmer et al., 2005). The right axes are the ΔR values (hashed boxes: southwestern Cape; solid boxes: Namaqualand; solid triangles: known-age samples) compared with (a) relative abundance of Neogloboquadrina pachyderma (left coiling) forams. Higher values reflect greater upwelling (axis reversed for ease of comparison). (b) Sea surface temperatures estimated from Mg/Ca ratios of Globigerina bulloides foraminifera (solid lines) and % aragonite (diamonds) in two species of Patella from Elands Bay Cave. Low temperatures are used as a proxy for increased upwelling intensity. (c) Oxygen isotope measurements on the same archaeological Patella specimens.
Recent past: 152 to 10 cal. BP
All nine known-age pre-bomb shells date to the recent past because of the collection requirements: they must have been collected prior to the advent of nuclear weapons testing, while having a known collection date. The pooled mean ΔR value for this time period is 157 ± 59 14C years. Evaluating these data by region, the eight southwestern Cape shells produce a ΔR value of 162 ± 60 14C years. One sample from Namaqualand yields a value of 109 ± 10 14C years, but since this falls within the range of variation of the southwestern Cape specimens, we do not wish to argue for regional variation on the basis of this single result. The ΔR results for the west coast of South Africa during this time period indicate considerably less upwelling than the value of 311 ± 18 14C years suggested on the basis of the known-age shells from St Helena (Lewis et al., 2008b). This discrepancy might be due to upwelling caused by the effect of eddies in the lee of St Helena Island (c.f., Hawaii; Petchey et al., 2008) rather than the influence of the Benguela Current. Regardless, the results suggest that very different processes or ocean dynamics were affecting these two regions.
The temporal trend of decreasing ΔR values from
The ‘Little Ice Age’: 600 to 500 cal. BP
There are three paired marine/terrestrial samples from Namaqualand and four clusters of pooled ages from DFM (n = 33) where the midpoint of the calibrated ages on terrestrial material is between 600 and 500 cal. BP (Tables 2 and 3). The pooled mean ΔR value for the entire west coast for this period is 79 ± 128 14C years. The Namaqualand weighted average ΔR is 118 ± 89 14C years and the value for the southwestern Cape value based on the pooled results from DFM is 62 ± 150 14C years. Overall we are seeing greater variability in the ΔR values during this period with decreasing ΔR through time at DFM from 246 ± 57 14C years to −91 ± 59 14C years. The NPS% data suggest that there was an abundance of polar forams around 600 cal. BP, but the data are trending towards reduced upwelling. The SST data do not correlate well with evidence for reduced upwelling; instead they suggest that this was a period of rapid cooling, which is the expected result for the ‘Little Ice Age’.
Neoglacial: 1350 cal. BP
In this time period, we have only one paired marine and terrestrial sample from Namaqualand, yielding a relatively high ΔR value of 362 ± 59 14C years. One possible explanation is that the marine shell component from this sample was reworked or an old shell was collected in the past. However, this high ΔR could also reflect a localized upwelling period, which is suggested by the corresponding peak in the NPS% data (Figure 3). Yet, the SST data contradict the upwelling proxies with all three methods indicating warm temperatures at this time.
Neoglacial: 2600 to 2000 cal. BP
Four paired samples and cluster 5 from DFM yield a pooled mean ΔR for the west coast at 185 ± 92 14C years. The southwestern Cape samples produce a value of 211 ± 81 14C years, while the single pair from Namaqualand yields a lower value at 76 ± 94 14C years. The ΔR value of ~350 14C years at 2300 cal. BP predicted by Dewar and Pfeiffer (2010) for the southwestern Cape is close to the maximum value of 297 14C years for the southwestern Cape. During this time, the ΔR values fluctuate with a high mean value. This suggests that the upwelling plumes were operational but the large error values make it difficult to infer a trend. The NPS% data also fluctuates between figures consistent with high to low levels of upwelling. High ΔR values and abundant NPS% numbers indicate strong periods of upwelling, which is expected during the cold Neoglacial period. The SST data fluctuate but overall suggest the opposite, a warming trend most clearly depicted in the oxygen isotope data.
End of the Younger Dryas: 10,900 cal. BP
We have only one paired sample from this period, from Layer 12 at Elands Bay Cave in the southwestern Cape. It produces a ΔR value of −112 ± 144 14C years, the lowest value in this study. This signals reduced upwelling that correlates well with the very low NPS% values The SST data support this inference with a warming trend following the end of the Younger Dryas period. An explanation for the negative ΔR value could be based on the assumption of a 55 year interhemispheric offset. This would be within the uncertainty of the ΔR measurement, which could indicate no offset from the Marine09 curve. As this interpretation is based on a single paired sample we clearly need more data.
Younger Dryas: 12,400 cal. BP
Three paired samples from Layer 14 at Elands Bay Cave in the southwestern Cape date to this period. The pooled calibrated terrestrial date range is from 12,555 to 12,236 cal. BP (Table 2). Using the pooled dates to calculate the ΔR returns a value of 76 ± 31 14C years. The NPS% data also suggest low levels of upwelling activity while the SST proxies suggest that the Benguela was cold during the Younger Dryas.
In this case, colder sea surface temperatures are associated with a low value for ΔR. This pattern was also seen during the ‘Little Ice Age’. Cold sea surface temperatures should indicate increased upwelling and hence the increased contribution of deeper water to the inshore zone. In order to reconcile these observations it is necessary to invoke a source of cold water with a low ΔR value.
The reason for the cooling is partially a global cooling of the oceans but also increased upwelling as a result of the intensification of the atmospheric forcing (wind strength) (Kim et al., 2002). Faunal analysis from the southern Benguela upwelling system (Chen et al., 2002) and from the Agulhas leakage zone (Martinez-Mendez et al., 2008; Peeters et al., 2004; Rau et al., 2002) show intensification of Agulhas leakage into the Benguela system during glacial terminations. We suggest that oceanographic conditions during the ‘Little Ice Age’ and the Younger Dryas approximated those during the glacial terminations, with intensified upwelling in the southern Benguela upwelling region and higher proportions of Agulhas leakage water and possible entrainment of AAIW in the plumes leading to decreased ΔR values. This hypothesis is subject to verification, but is aligned with the interpretation of Ufkes et al. (2000), Chen et al. (2002) and West et al. (2004) who suggest that tropical planktonic fauna in the Benguela System may have their origin in Agulhas leakage.
The high ΔR values and overall abundance of polar forams during the Neoglacial period are expected, but contradict the trend indicated by the warm SST values. Our data suggest that this was a period of flux and perhaps the results are not sufficiently temporally resolved to identify rapid short-term changes. One other possibility is that we are seeing a different type or stage of Benguela Niño. In this instance we have evidence for strong upwelling cells, but we don’t know how different source water could affect the data: Angolan Current rather than the Agulhas Current?
We could also be measuring ΔR values from different stages in the mechanics of mixing between the upwelled and warm leakage water. This pattern will also require further research into ocean dynamics to verify.
Conclusion
The results of this study indicate that the pooled mean ΔR value for the west coast of South Africa for the Holocene is 146 ± 85 14C years regardless of region. There is very little difference in the data from the two regions. When there are differences, shellfish from Namaqualand appear to be less exposed to 14C depleted waters. This could be due to leakage from the warm Angolan Current from the northern Benguela system. Alternatively, the additive effects of two upwelling cells, the Columbine and Peninsula in the southwestern Cape, as opposed to one in Namaqualand, may have exposed shellfish to a higher proportion of 14C depleted water in the south.
Temporal variations in ΔR were identified and they compare well with the NPS% proxy data for upwelling. Together the upwelling proxies tend to agree with the SST data for the recent past and at the end of the Younger Dryas: both warming periods. The upwelling and SST data contradict each other during cold periods: Neoglacial, ‘Little Ice Age’ and middle Younger Dryas. The ‘Little Ice Age’ and Younger Dryas data produced low ΔR and NPS% values in association with data for cold water. This was interpreted as a system behaving like a glacial termination with the potential for Agulhas Current leakage into the system. The Neoglacial period seems to have been a time when ocean dynamics were in flux and included high ΔR and NPS% values associated with warm SSTs. This pattern is more difficult to explain but might reflect a different manifestation or stage of a Benguela Niño.
In future work, we hope to expand the data set for the west coast in order to fill the gap between the early and late Holocene, and to increase the number of samples during the Neoglacial period. We also hope to undertake a similar study of the south coast of South Africa.
Footnotes
Acknowledgements
First, we would like to thank John Parkington for allowing us to use the radiocarbon ages on marine and terrestrial materials from Dunefield Midden 1 and Elands Bay Cave. We are grateful to Wayne Florence at the Iziko South African Museum for access to the known-age pre-bomb shells, and to Liz Hoenson for help in identifying and locating suitable specimens for sampling. This paper arose out of Susan Pfeiffer’s attempts to calibrate radiocarbon ages on human skeletons from this region. We thank her for stimulating this work, and for providing support and encouragement.
Funding
This research received no specific grant from any funding agency in the public, commercial, or not-for-profit sectors.