



Abstract
The Artemisia/Chenopodiaceae (A/C) ratio is assumed to be a useful index for reconstructing moisture changes in arid and semi-arid regions. Thorough modern pollen studies are still lacking to understand the reliability and limitation of A/C ratio as a moisture indicator, however. Here we review how well this ratio can be applied in arid and semi-arid China on the basis of new surface pollen data, previous data synthesis and other publications. Results indicate that variance in the A/C ratio can permit identification of modern vegetation types and that the A/C ratio generally has a positive relationship with annual precipitation. However, soil salinity, vegetation community composition, human activity and sample provenance (e.g. soil and lake sediments) will affect the values of the A/C ratio in different vegetation zones and therefore the A/C ratio is not comparable in different regions. We argue that the A/C ratio can only be used to reconstruct vegetation types and climate change in regions with precipitation <450–500 mm, and in steppe, steppe desert and desert areas. Careful studies should be undertaken to understand the modern pollen–vegetation–climate relationships in various regions before using the A/C ratio to interpret vegetation and climate.
Introduction
Arid and semi-arid China is influenced by the climate system of Westerlies or the interplay between monsoon and Westerlies, and has been an important region for the observation of global change because of its sensitivity. Pollen data have frequently been used in vegetation and climate reconstructions, as they tend to reflect vegetation and climate changes at a regional scale. In arid and semi-arid regions, vegetation density and productivity are limited by water availablity to plants and plant diversity is quite low. Artemisia and Chenopodiaceae are the most common plant taxa in this region. They are characteristic of a highly continental climate with cold winters and dry summers (El-Moslimany, 1990). As Artemisia (A) requires more water than Chenopodiaceae (C) during the growing season, the A/C ratio has been used as a moisture indicator to infer palaeovegetation and palaeoclimatic information from fossil pollen assemblages in arid and semi-arid regions across the world (e.g. Coetzee, 1976; El-Moslimany, 1990; Herzschuh, 2007; Huang et al., 2009; Sun et al., 1994; Van Campo et al., 1996; Wong et al., 1993; Yan et al., 1991; Zhao et al., 2007). The reliability and limitation of the A/C ratio as an indicator of moisture in arid and semi-arid China are still poorly understood, however. This has restricted the interpretation of fossil pollen data and climate reconstruction for many sites in this region.
This study uses a modern pollen data set for synthesis, based on 260 new pollen assemblages and 348 other pollen assemblages derived from our previous work and various sources (Cheng, 2006; Li et al., 2010, 2011; Liu et al., 1999; Luo et al., 2010; Zhao and Herzschuh, 2009; Zhao et al., 2007). In addtion, we review the studies on the limitation of A/C ratios from previous publications. Our objectives are to: (1) investigate the relationship between A/C ratio and vegetation types and climate variables in arid and semi-arid China; and (2) assess the applicable range and limitations of using this ratio.
Study region and methods
Our study region is situated in arid and semi-arid China, primarily including Inner Mongolia, Hexi Corridor, Loess Plateau, the northeastern Qinghai-Tibetan Plateau, and Xinjiang (Figure 1a). Mean annual precipitation varies from 750 mm (in some mountain regions) to <20 mm from east to west (Figure 1b). The area has warm summers (up to 25°C) and cold winters (down to −8°C). Five major vegetation types are forest, alpine meadow, steppe, steppe desert and desert (Figure 1a; Hou, 2001). Forest is confined to mountains in this region, and mainly consists of Quercus spp. and Pinus spp. in lower elevations, and Betula spp. and Picea spp. in higher elevations. Alpine meadows on the Qinghai-Tibetan Plateau are mainly comprised of Cyperaceae (e.g. Kobresia pygmaea) and Poaceae (e.g. Achnatherum splendens). Steppe vegetation is distributed under different climate conditions. In temperate Inner Mongolia, it is dominated by Stipa spp., and Leymus chinensis, in the Loess Plateau by S. bungeana, and in the Qinghai-Tibetan Plateau by S. purpurea and Achnatherum splendens. Artemisia frigida is distributed in all the above regions. Steppe desert is characterized by Stipa breviflora and S. gobica in the Inner Mongolian Plateau and Artemisia dalailamae, Achnatherum splendens, Stipa gobica, Kalidium gracile and Ceratoides lateens in the Qinghai-Tibetan Plateau, with Ephedra przewalskii, Nitraria spp., Brassicaceae and other Asteraceae taxa. Desert vegetation mainly consists of Salsola passerina, Salsola abrotanoides, Reaumuria soongorica, Ceratoides latens, Haloxylon ammodendron, Sympegma regelii, with some Ephedra przewaskii, Nitraria tangutorum, Seriphidium (formerly a subgenus of Artemisia) spp., Ajania fruticulosa and Asterothamnus centrali-asiaticus (Hou, 2001). There is considerable variation within each of these five zones. The desert zone in northwest China, for example, is completely ringed with high mountains and the Tianshan and Qilianshan run almost completely through the middle of the zone. However, the coarse classification above is adequate for our discussion, as we recorded the vegetation types for each sites in the field as indicated below. Although both the local micro-environment and human disturbances can affect the distribution and composition of vegetation, on a broad scale vegetation types in this region are associated with climate variables (especially precipitation).

(a) Location map of the reviewed study sites. Green dots: this study; red dots: other studies (colour figure available online); (b) precipitation map of China; (c) vegetation types in China.
In our study, we included new pollen data from 260 sites combined with previous data from 348 other sites derived from various sources, including multiple contributors and data digitizing from publications (Table S1, available online). The samples were mostly from the surface soil and moss polsters, but also some lake surface sediments.
For the new pollen samples, our fieldwork was carried out along six transects in north Xinjiang, the Zoige Basin on the eastern Tibetan Plateau, the Loess Plateau and around the lakes of Sugan Lake, Bosten Lake and Qingtu Lake in 2008 and 2010. The surface samples were treated with a modified acetolysis procedure (Fægri and Iversen, 1989), including HCl, NaOH, HF and acetolysis treatments, and fine-sieving to remove clay-sized particles. About 500 terrestrial pollen grains per sample were counted and used as the pollen sum for pollen percentage calculations. A/C ratio was cacluated as Artemisia%/Chenopodiaceae%.
Thirty-year climate normals (1971–2000) were available from 85 climate stations in the study region. Mean annual temperature (MAT) and mean annual precipitation (MAP) for each sampling site were obtained from the nearby climate station, or estimated from the nearest three climate stations in the absence of a climate station in the vicinity. In that case, temperature and precipitation correction was made based on local lapse rates, if needed.
SPSS 11.5 software was used to calculate the median, mean and standard deviation and make boxplots for A/C ratio values for the samples from various vegetation types. Matlab7.0 was used to develop the relationship between A/C ratio and precipitation, based on Gaussian unimodel fitted as a log y=a+bx+cx2 polynomial model and quantile regression analysis. Furthermore, boosted regression tree analysis was applied in order to infer those variables (climate, vegetation type, region and sample type) and their interactions that best explain the changes in the A/C ratios. This method is particularly suitable for our data set because according to Elith et al. (2008) it can handle different types of predictor variables, have no need for prior data transformation or elimination of outliers, can fit complex nonlinear relationships, and automatically handle interaction effects between predictors. We employed boosted regression tree analysis using the free statistical software R version 2.9.1 (packages bgm, extended by further functions of Elith et al., 2008). We used a default bag fraction of 0.5, a Gaussian error distribution, a very slow learning rate (0.0005) and a tree complexity of 3 to model A/C ratio along variable gradients. Data transformations (square-root, log(x+1)) did not heavily alter the results and therefore untransformed A/C ratios were used. Increasing tree complexity beyond 3 did not give improvements in model performance, i.e. did not reduce the predicted deviance. Finally, the model was fitted with a total number 6550 trees.
Results and discussion
Representation of A/C ratio to different vegetation types
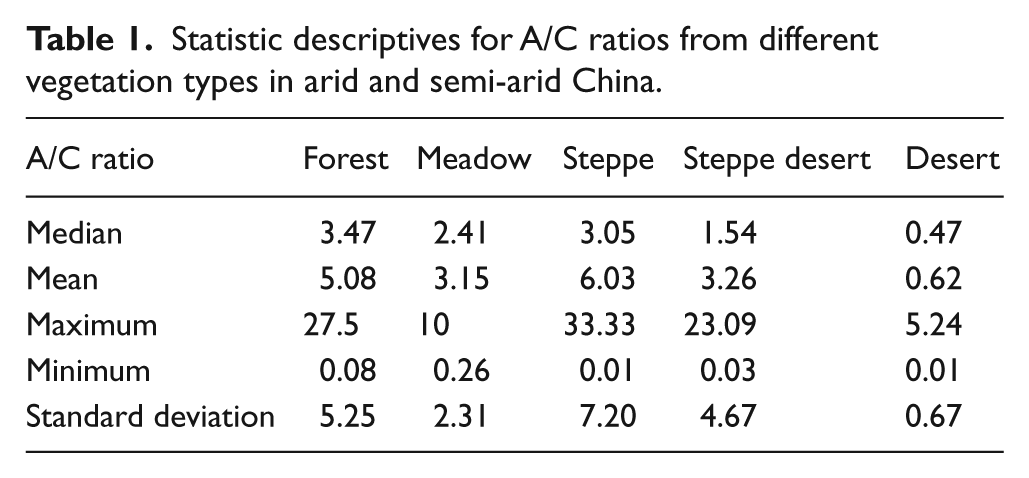
The A/C ratio from surface samples in arid and semi-arid China varies in five major vegetation types: forest, alpine meadow, steppe, steppe desert and desert (Figure 2). Both median and mean values of A/C ratio decrease from 3.05 (median), 6.03 (mean) in the steppe, to 1.54, 3.26 in the steppe desert and to 0.47, 0.62 in the desert respectively (Table 1). However, mean A/C ratio in the forest and alpine meadow sites are not the highest (3.46 for forest and 2.41 for meadow). Our results suggest that A/C ratio can be used to reconstruct the change of vegetation types in the regions of steppe, steppe desert and desert; however, these lower percentages indicate that it does not apply to forests and alpine meadows as discussed below.
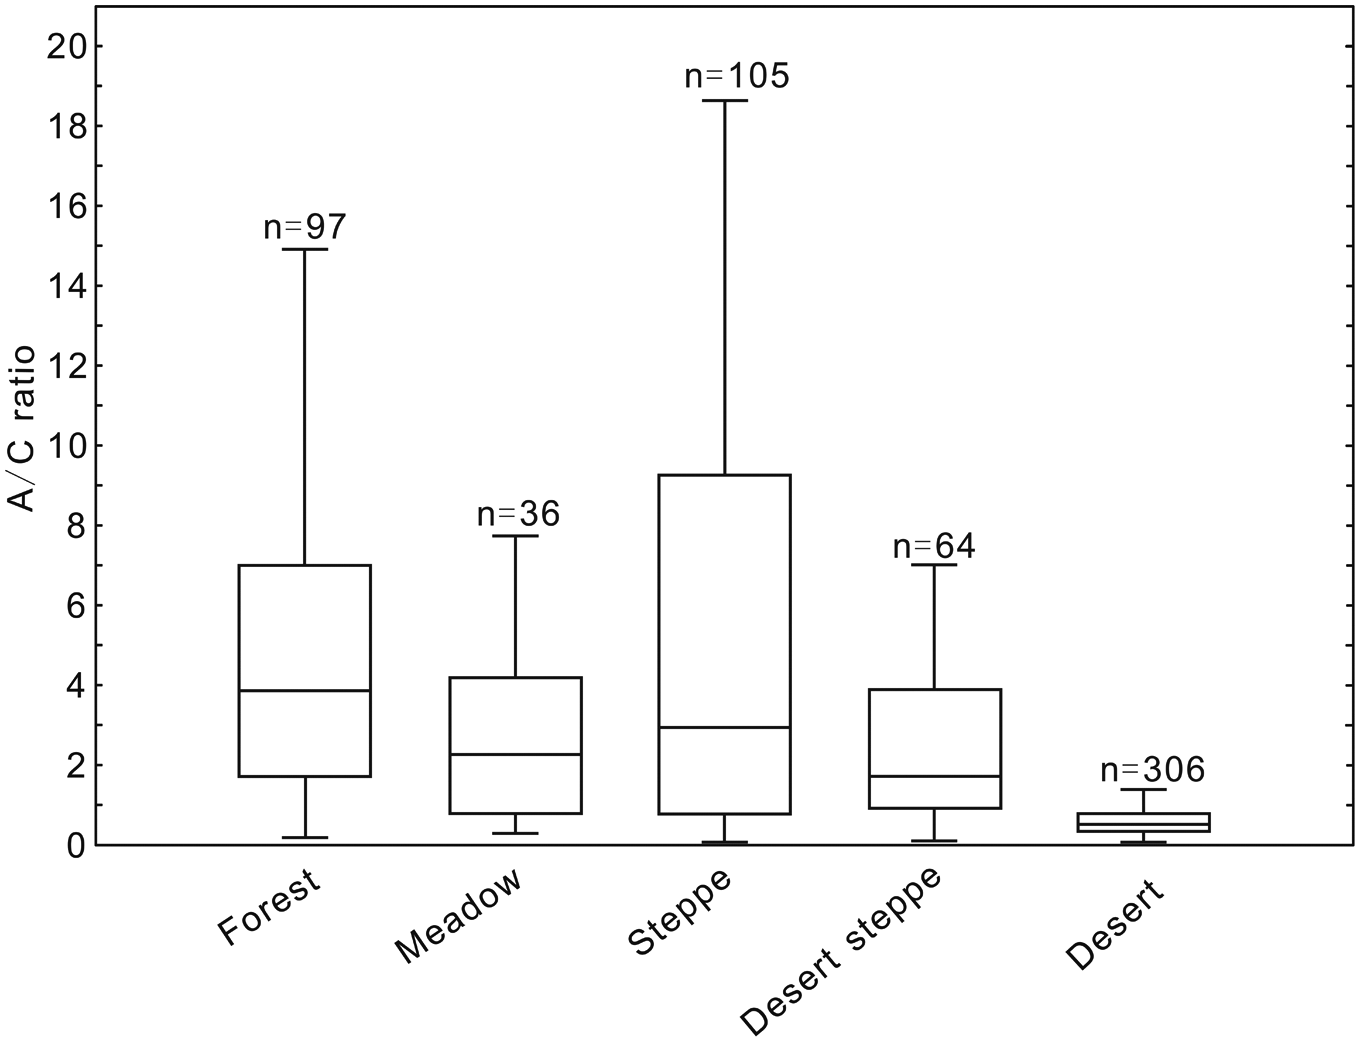
Median and boxplots of A/C ratio from surface samples in different vegetation types in arid and semi-arid China, showing medians (central lines), inner quantile ranges (boxes), and 25th and 75th centiles plus and minus 1.5 times the inner quartile range, respectively (whiskers).
Statistic descriptives for A/C ratios from different vegetation types in arid and semi-arid China.
In the Xinjiang region, Yan (1991) reported that Artemisia/Chenopodiaceae (A/C) ratios are typically <0.5 in desert areas, >1 in typical steppe areas, and range from 0.5 to 1.2 in desert-steppe areas and Herzschuh et al. (2004) found that in the Alashan Desert A/C ratio are mostly <1 while they are above this threshold in the nearby steppe-deserts and steppes of the Hexi corridor. Cour et al. (1999) indicated that the saline desert (western Taklimakan), montane desert (Kunlun), and montane steppe or sub-desert (Karakorum) were represented by A/C ratios of <1, 1–2 and >2, respectively. Li et al. (2005) reported that in typical desert communities, A/C ratios are <0.5, while in steppe-desert A/C ratios are 0.5–2. In the Middle East, arid desert sites had A/C values < 0.3, while values between 0.2 and 0.6 were found for semi-arid steppe sites (El-Moslimany, 1990). Sub-mesic and mesic sites covered by savannas, forest-steppes and forests yielded values between 0.5 and 1.7 (El-Moslimany, 1990). The change in A/C ratio with vegetation type also applies in mountains where vertical vegetation zones are present (Ji and Liu, 2009; Zhao et al., 2009). On the northern slope of Tianshan, A/C ratio was <0.5 at the elevation of <700 m in the desert zone, but >1.5 at the elevation of 700–1100 m in the desert steppe zone (Ji and Liu, 2009), suggesting that the A/C ratio can be used to differentiate desert from desert steppe. Zhao et al. (2009) also show that the A/C ratio changes from >3, 1–3 to <1 with decreasing elevation when vegetation changes from desert, desert steppe and steppe on the Baisu Mountains north to the Qaidam Basin.
Our results and other previous studies in arid and semi-arid regions show that the absolute values dividing vegetation types differ from region to region, depending on the vegetation species composition and other local factors, as discussed in Section Vegetation composition. Nonetheless, it is a very promising index for biome reconstructions when modern pollen studies are taken into account prior to the interpretation of fossil pollen data.
Relationship between A/C ratio and climate variables
A/C ratios from the surface samples from our study area and other sites included in supplement Table S1 (available online) do not show linear relationships with annual temperature, but exhibit a positive relationship with annual precipitation (Figure 3). This is also corroborated by results from boosted regression tree analysis which indicate that precipitation is the most important factor that influence A/C ratio, i.e. MAP contributed 53% to the developed model but temperature only 20% (Table S2, available online, and Figure 5). However, the precipitation–A/C relationship becomes weaker when the precipitation is >400–500 mm. Accordingly, the modeled interactions using Boosted Regression Tress between MAP and MAT highlight that A/C ratios are particularly complex in habitats with intermediate temperatures and high precipitation (Figure 6). When precipitation is <200 mm, A/C ratio is mostly <1; when precipitation is 200–350 mm, A/C ratio is generally <2 and for precipitation of 350–450 mm, A/C ratio is <5. When precipitation is >450–500 mm, the change in A/C ratio is complicated, and no clear relationship exists. Within the same vegetation type, the relationship between A/C ratio and MAP is not linear in many cases, as the A/C ratios might be incomparable because of different community composition and local environments in various regions. Local environmental factors could interact to reduce the positive relationship below the upper bound, as shown by Sankaran et al. (2005). Using data from 854 sites across Africa, Sankaran et al. (2005) showed that maximum woody cover in savannas receiving a mean annual precipitation of <650 mm is constrained by and increases with MAP. However, local environmental factors interact to reduce woody cover below the MAP-controlled upper bound. If this effect also holds for A/C ratio change in arid and semi-arid regions, it could account for the good relationship between A/C ratio and precipitation in the upper bound for the different vegetation types (Figure 4), but weaker relationship within certain vegetation types and precipitation range.

Polynomial model relationship between A/C ratio and precipitation in arid and semi-arid China.
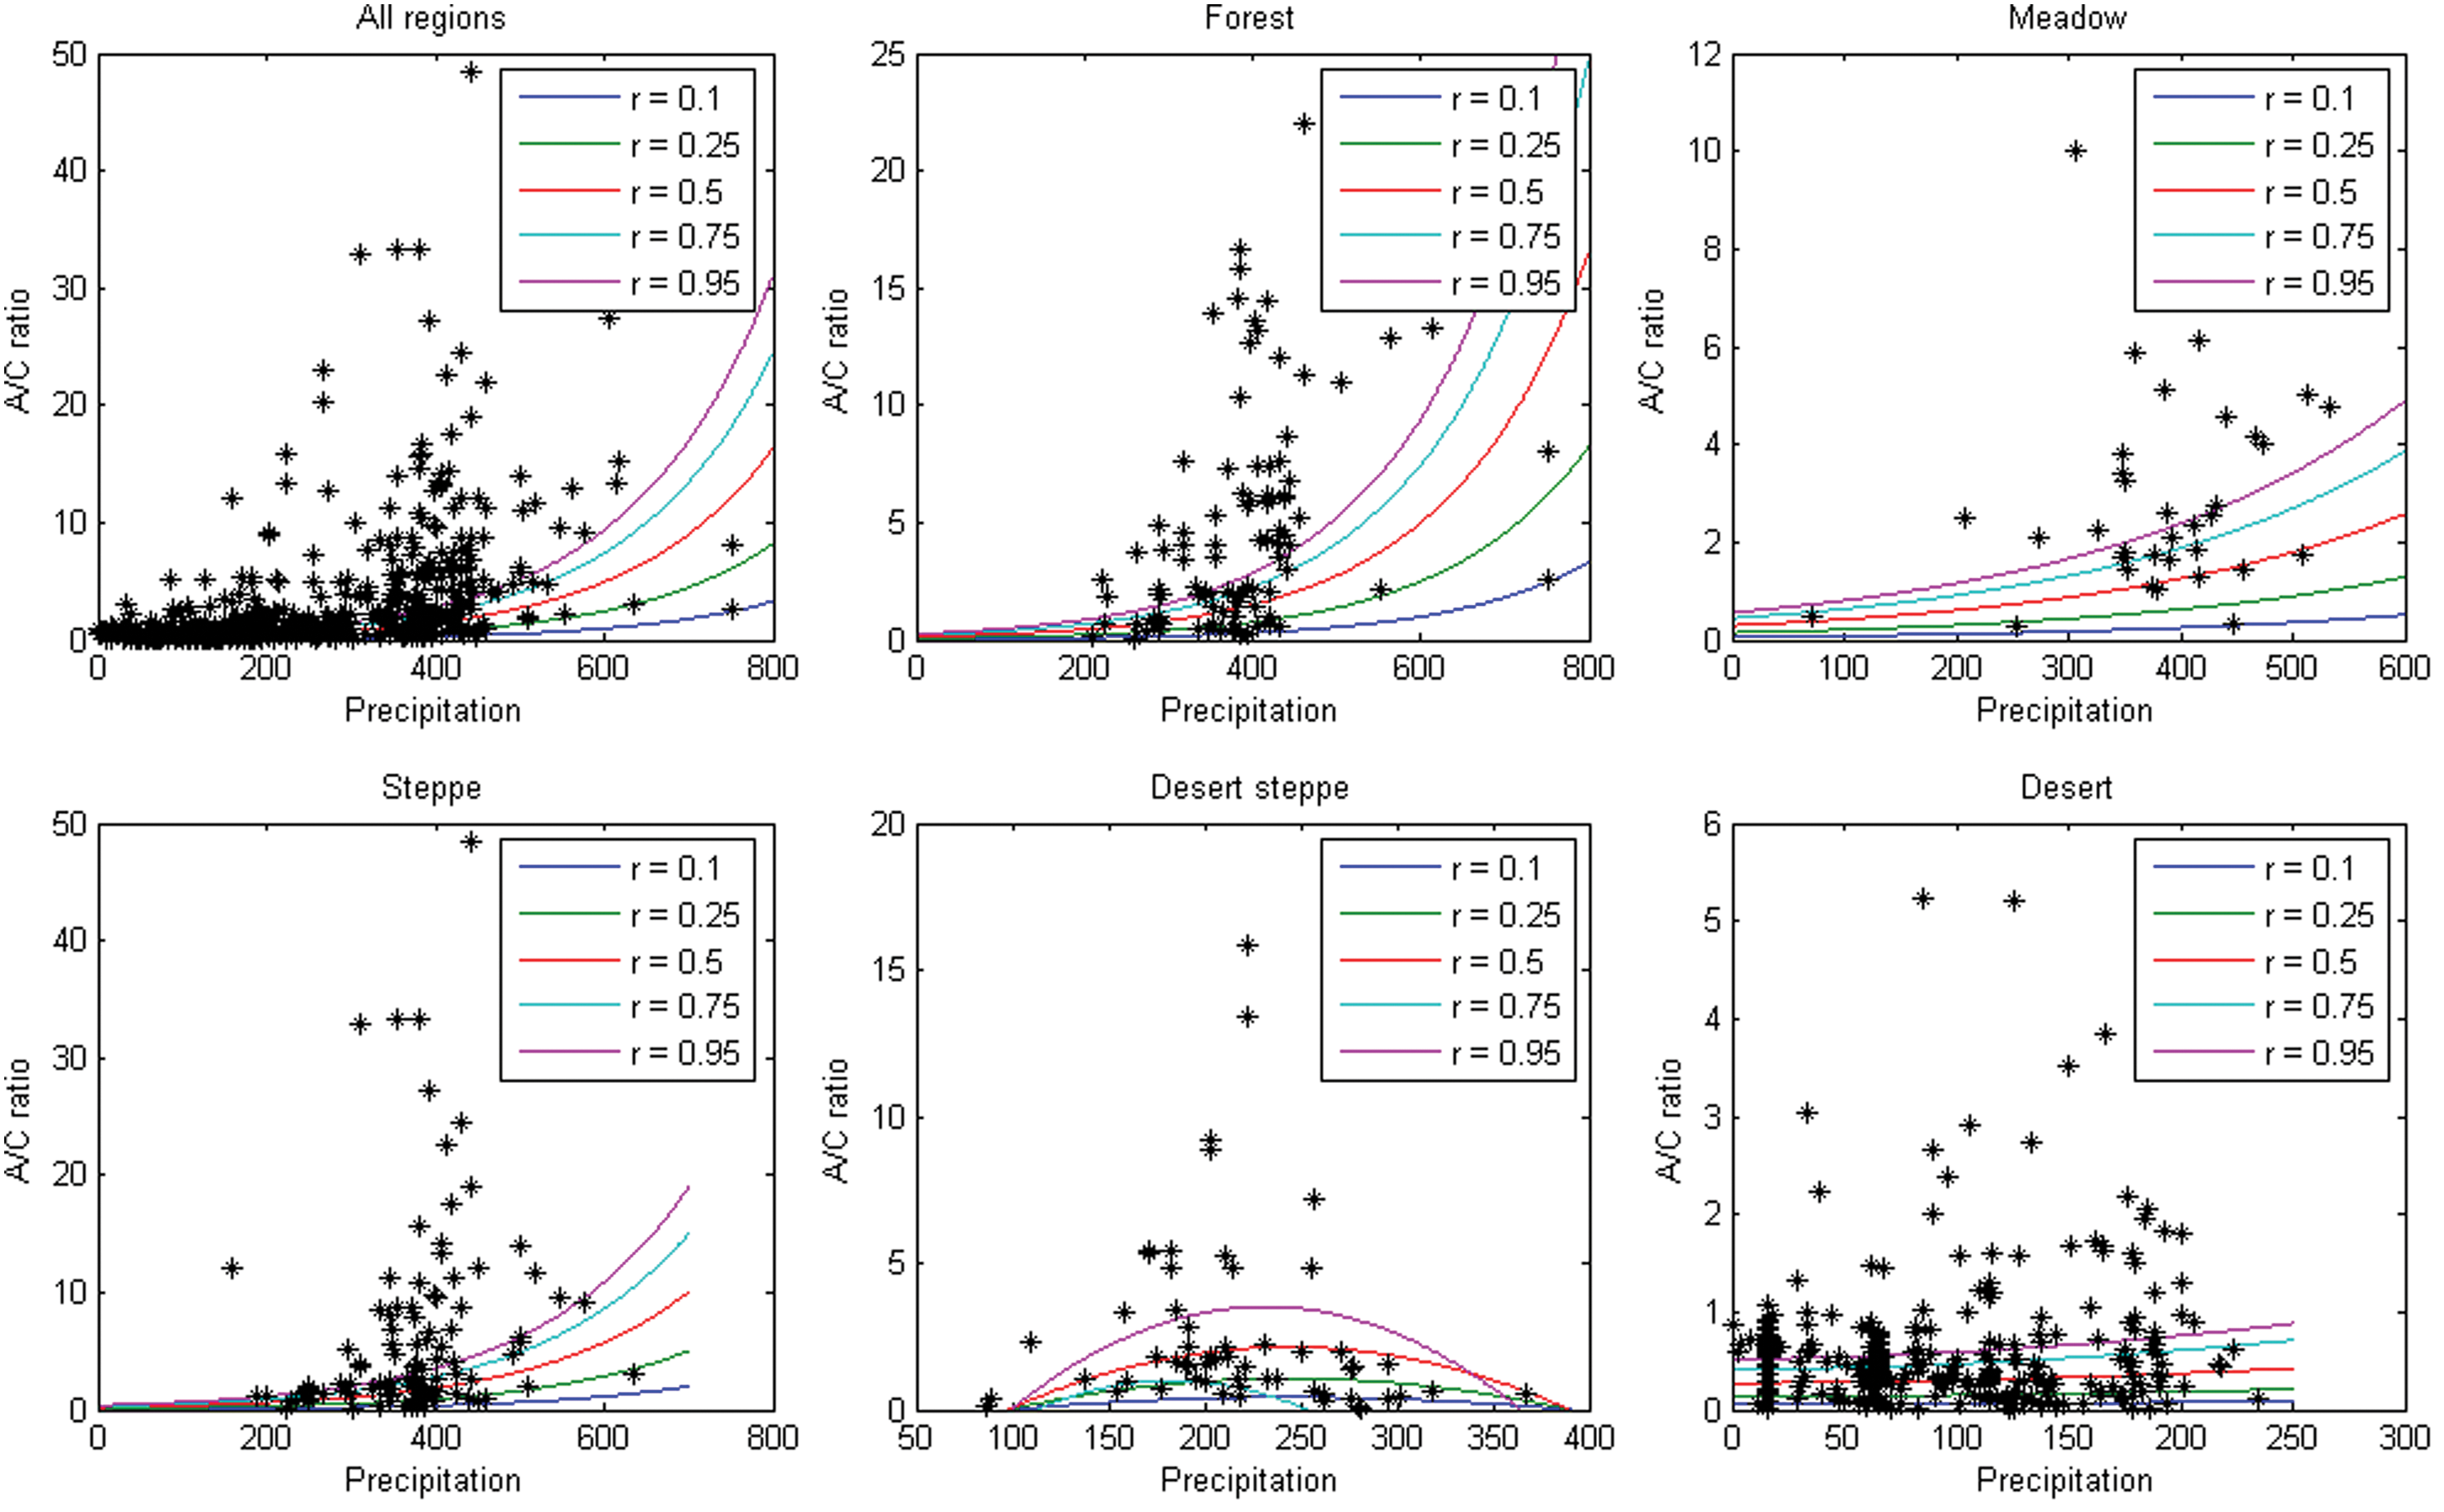
Quantile regression (with Gaussian unimodel) relationship between A/C ratio and precipitation, with 0.95, 0.75, 0.75, 0.50, 0.25 and 0.10 quatile (solid lines) (colour figure available online).

Partial dependence plots for the four most influential variables in the model for A/C ratios including all variable concerning climate, vegetation region and sample type. Y axes are centred to have zero mean over the data distribution. Rug plots at inside top of plots show distribution of sites across that variable in deciles.
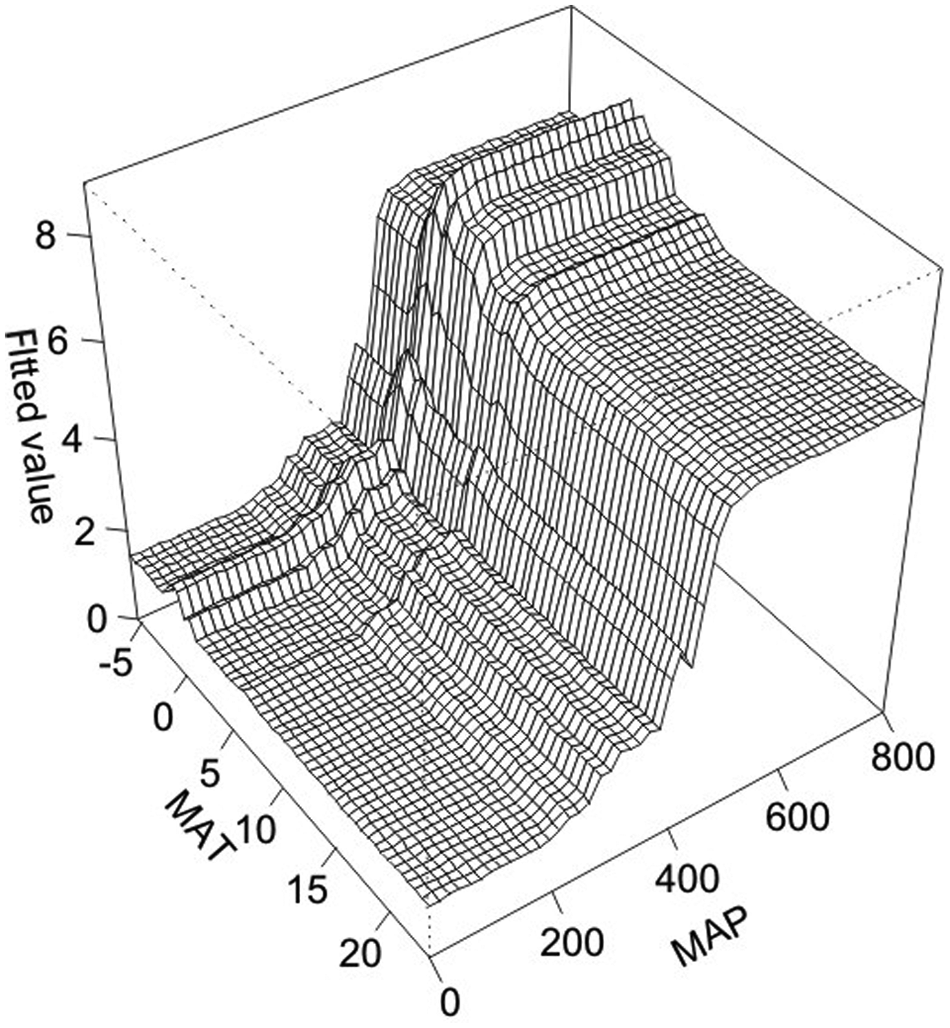
Three-dimensional partial dependence plots for the interaction between MAP and MAT, indicating that interactions are highest at high precipitation and intermediate to low temperatures.
Very few studies on A/C ratio have investigated the quantitative relationship between A/C ratio and precipitation. Herzschuh (2007) used a data set of 113 lake-surface sediments from the eastern Tibetan Plateau to test the reliability of several pollen ratios, and found A/C ratios were lowest in desert areas and positively correlated with annual precipitation (r2 = 0.25). Our near-annual resolution pollen data for the last 50 years from Gahai Lake in the Qaidam Basin show that the changes in A/C ratio correlate well with relative moisture based on instrumented climate data (Zhao et al., 2008). High (low) A/C ratios are associated with increase (decrease) in steppe pollen production, which corresponds to high (low) relative humidity observed at the nearby Delingha weather station. The results indicate that the relationship between A/C ratio and climate variables on spatial scale also applies on temporal scale. A/C ratio can be extremely sensitive to moisture change and is a reliable pollen index for moisture reconstruction in arid regions. Further work is needed to examine the quantitative or semi-quantitative relatioship between A/C ratio and relative humidity, however.
Application and limitation
Our data and other studies support that the A/C ratio can be used to identify changes in vegetation types, and is an indicator of moisture qualitatively or semi-quantitatively in arid and semi-arid regions of China. Many factors may affect the reliability of the application of A/C ratio in reconstructing vegetation and climate, however.
Vegetation composition
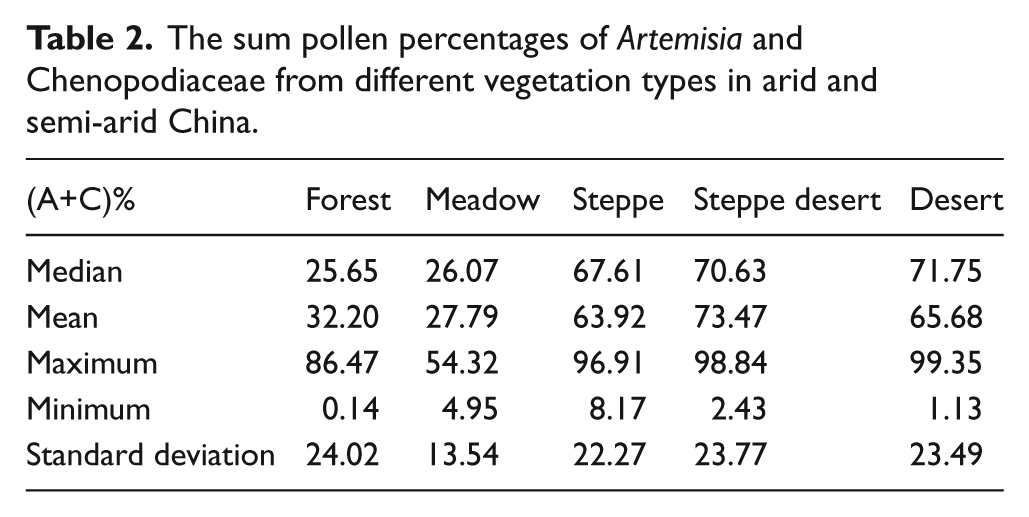
Our study shows that the linear relationship between A/C ratio and vegetation types and precipitation becomes very weak when precipitation is > c. 500 mm (Figure 3). Vegetation composition could have contributed to the complication. The sum pollen percentages of Artemisia and Chenopodiaceae decreased from steppe (median value 67.61%), steppe desert (median 70.63%), and desert (median 71.75%) to forest (median 25.65%) and meadow (median 26.05%) (Table 2) . However, steppe, steppe desert and desert do not show different sum pollen percentages for Artemisia+Chenopodiaceae, though the A/C ratio shows varying values because of the different proportions of Artemisia and Chenopodiaceae, respectively. Our study shows that A/C ratios applies to the region with precipitation <500 mm and with (Artemisia+Chenopodiaceae)%>45–50%. Caution is needed when it is used in forest and meadow regions.
The sum pollen percentages of Artemisia and Chenopodiaceae from different vegetation types in arid and semi-arid China.
Yang and Scuderi (2010) questioned the reliability of the A/C ratio as an indicator of effective moisture in the hyper-arid Badain Jaran Desert and Taklamsakan Desert because Artemisia grows well on dunes. A/C ratio may underestimate the degree of desertification and not be suitable for use in the hyper-arid region in western China. Li et al. (2011) show that A/C ratio correlates significantly with vegetation composition, and argue that A/C ratio is insufficient when reconstructing past vegetation and climate, meaning that more complex approaches are needed. El-Moslimany (1990) stated that the general trend of increasing A/C values should remain valid, though the absolute values differ from region to region depending on the species composition in the vegetation. For arid areas in China, nevertheless, the overall A/C ration relationship with vegetation type and climate is not disturbed when data from various origins are pooled, as indicated by our Boosted Regression Tree analysis (i.e. variables indicating the sample regions were only seldom developed for model development).
Different sample types
A/C ratios may vary in different sample provenance at the same site. Results of modern pollen assembalges from 21 pairs of samples from lake sediments and surface soils across north and northwest China show that the main vegetation types can be distinguished by their modern pollen assemblages from both lake sediments and surface soils (Zhao et al., 2009). However, lake sediments have higher Artemisia, while surface soils contain more Chenopodiaceae. For example, in the samples from desert, Artemisia pollen is up to 35% (mostly >20%), but it is only 2–26% in the soil samples. The soil samples have higher standard deviations for Chenopodiaceae (std. 60%), Artemisia (std. 15%) in desert, suggesting larger variations of these taxa. Similarly large variations of pollen percentages of these major taxa were also found in the surface soils from other regions in the Alashan Plateau and eastern Qaidam Basin in northwestern China (Herzschuh et al., 2003 ; Li et al., 2005). This results in the standard deviation of A/C ratio in topsoils (8.96) being higher than in the lake sediments (3.9). Therefore we recommend avoiding deriving A/C ratios from soil samples in modern pollen training data sets for interpreting biome change for the lake sediment cores.
In addition, in China A/C ratios are used primarily for interpreting pollen cores from lakes. However, the water in lakes in the hyper-arid desert areas of western China is mainly derived from the surrounding high mountains. Therefore A/C ratio from lake cores may underestimate the degree of desertification because of the input of Artemisia transported by water from surrounding mountains, which further complicates the representation of Artemisia.
Differences in pollen productivity and transportability between Artemisia and Chenopodiaceae
Artemisia and Chenopodiaceae tend to be over-represented because their pollen is produced in abundance, and because many of the other dominant vegetation types are poor pollen-producers in arid and semi-arid environments (El-Moslimany, 1990; Herzschuh et al., 2003; Li et al., 2005) . Our previous studies on the Relative Representation Values (Rrel) in the arid and semi-arid northeastern Tibetan Plateau show that Artemisia and Chenopodiaceae both have a high Rrel (median 7.24, 2.11, respectively) relative to Poaceae and are therefore over-represented. Even though they the study of Wang and Herzschuh (2011) for the upper eastern Tibetan Plateau also found over-representation for both taxa in comparison to Poaceae the inferred pollen productivity estimates for the single taxa are markedly different, i.e. 2.0 for Artemisia and 5.4 for Chenopodiaceae. Chenopodiaceae in our study does not have as high Rrel as in other studies, for example in Alashan Plateau and Hexi corridor (Herzschuh et al., 2003). The different representation of Artemisia and Chenopodiaceae in various regions could complicate the ratios of Artemisia to Chenopodiaceae.
Soil salinity
The vast majority of Chenopodiaceas are weeds, and many are salt- and drought-tolerant. In some cases, local saline conditions can affect Chenopodiaceae percentage. Our research results show that the samples from the lakeside of Hurleg Lake, Toson Lake and DaQaidam Lake, all of which are rather salty, show very high Chenopodiaceae percentages of >97%, much higher than other soil samples in the region with percentages of 60–80%, leading to lower A/C ratios (Zhao and Herzschuh, 2009). El-Moslimany (1990) pointed out that the Chenopodiaceae as a group are noted as halophytes and in more mesic regions are assumed to be indicators of salinity. Halophytic chenopods (e.g. Hammada-type) can account for a large portion of Chenopodiaceae plants in the saline conditions in the Middle East. It is important to tell halophytic from desert Chenopodiceae pollen using modern pollen studies. Therefore, the local depositional environment should be taken into account when using A/C ratio to interpret moisture change.
Human activity
Human activity can also affect Chenopodiaceae and Artemisia percentages in pollen assemblages and therfore A/C ratios. Liu et al. (2006) collected and analyzed surface pollen samples along moisture and human impact gradients in the steppe zone in East Asia, and found that vegetation degradation in semi-arid areas caused by human activities is indicated by expansion of Chenopodiaceae plants (Liu et al., 2006). They used a human disturbance index to define the degree of strength of human activity. Their results show that the difference of A/C ratios for sample pairs of low and high human disturbance index can reach up to 50%, suggesting the increase of Chenopodiaceae could be mainly caused by human activity. High percentages of Chenopodiaceae pollen in human-disturbed sites led to great variation of pollen assemblages in each of the steppe types. Ren (1999) inferred from pollen diagrams from northeastern China that Chenopodiaceae pollen following an increase of Artemisia pollen and a decrease of Quercus pollen indicated human-caused vegetation degradation. When human-induced vegetation degradation caused an increase in both Artemisia and Chenopodiaceae percentages, the situation is more complicated. Yang and Scuderi (2010) questioned the reliability of A/C ratio as an indicator of effective moisture in the hyper-arid Badain Jaran Desert and Taklamsakan Desert, partly as Artemisia is not a favorite food source for animals and its growth is relatively less impacted by animal grazing. If the A/C ratio also changes in these circumstances, we could not absolutely attribute the change to either precipitation or human impact. Therefore, when human disturbance is involved in interpreting pollen data from sediment sequences, A/C ratio should be used with care.
Conclusions
Variance in A/C ratio from the surface pollen samples in arid and semi-arid China can permit the identification of modern vegetation types. Both median and mean A/C ratios decrease with the vegetation change from steppe to steppe desert and desert. The A/C ratios from samples in forest (median 3.46, mean 5.08) and meadow (median 2.41, mean 3.15) are not the highest, however. In addition, the threshold A/C values for different vegetation types may vary in different regions.
A/C ratio has a positive relationship with annual precipitation in arid and semi-arid China, though not in a linear way. When precipitation is <200 mm, A/C ratio is mostly <1 ; precipitation 200–350 mm, A/C ratio mostly <2; precipitation 350–450 mm, A/C ratio <5. However, when precipitation is >450–500 mm, the change in A/C ratio change is complicated, and no fixed relationship exists.
Environmental variables, such as soil salinity, vegetation community composition, and human activity can affect the values of the A/C ratio. One should take such factors into account when using A/C ratio as a moisture index. For example, for the pollen assemblages with a total sum of <40–50% of Artemisia and Chenopodiaceae, A/C ratio is not necessarily an indicator of moisture.
A/C ratios from surface lake sediments and top soils are different, as lake sediments have a larger source area and Artemisia usually shows higher percentages. Caution is needed when using A/C ratios from soils to reconstruct vegetation types and precipitation based on lake cores.
A/C ratio is best suited to reconstruct vegetation type changes and semi-quantitative climate variables in regions with precipitation <c. 450–500 mm. However, modern pollen studies should be undertaken in various regions prior to interpreting fossil pollen data.
Footnotes
Acknowledgements
Thanks to Yuecong Li and Qinghai Xu for providing us with original data. We also thank Zicheng Yu and two anonymous reviewers for their helpful comments and Gordon Grant for linguistic corrections.
Funding
This research was supported by National Basic Research Program of China (973 Programs, grants #2012CB956102 and 2010CB950202), the National Natural Science Foundation of China (Grants #41071126 and 41125006), 100 Talents Programme of the Chinese Academy of Sciences, and Humboldt Fellowship funded to the first author.
References
Supplementary Material
Please find the following supplemental material available below.
For Open Access articles published under a Creative Commons License, all supplemental material carries the same license as the article it is associated with.
For non-Open Access articles published, all supplemental material carries a non-exclusive license, and permission requests for re-use of supplemental material or any part of supplemental material shall be sent directly to the copyright owner as specified in the copyright notice associated with the article.
