
Abstract
Palaeoenvironmental and 14C reservoir age variability in the Limfjord, a sound through northern Jutland, Denmark, was investigated for the period 7300 to 1300 cal yr BP. Shells and bulk sediment samples from a core from a former inlet, Kilen, were analysed by radiocarbon dating and stable isotope (C/N) measurements. A strong correlation between the C/N ratios and δ13C values verifies that these are good carbon source indicators and thus allow environmental reconstructions. Furthermore, δ13C values are correlated with salinity in the photic zone, inferred quantitatively from diatom assemblages. They are therefore used to differentiate between brackish and marine palaeo-conditions. 14C reservoir ages of shells vary from Δ
Keywords
Introduction
Estuaries generally sustain high organic productivity and biological diversity, making them attractive habitation areas for humans in prehistoric, as well as historic time (Andersen, 2007). The Limfjord in northern Jutland, Denmark, is an example of such an environment (Baudou, 1985; Davidsen, 1985; Hedeager, 1985; Kristiansen, 1985; Rasmussen, 1968; Vandkilde, 1990). Settlements along the Limfjord coast had easy access to rich resources such as marine and freshwater fish, shellfish and marine mammals and birds.
From c. 7500 cal. yr BP, the eustatic sea-level rise slowed. Relative sea-level changes in terms of regressions or standstills occasionally occurred as a result of the isostatic uplift of northern Denmark (Christensen et al., 2004). These fluctuations in relative sea level caused the Limfjord to vary between a marine archipelago and a brackish estuary. The timing and positioning of openings from the Limfjord to the open sea has been debated over the last 150 years (cf. Christensen et al., 2004). However, there has been a lack of long records with good chronological control of the environmental development of the Limfjord (Andersen, 1992; Petersen, 1985).
Accurate and precise 14C dating resulting in robust chronologies is vital for studies of past cultures and palaeoenvironments. A particular challenge is posed by fjords and estuaries, where radiocarbon dating of material of marine and brackish origin can be highly complicated because of site- and time-specific radiocarbon reservoir ages (e.g. Heier-Nielsen et al., 1995; Olsen et al., 2009).
The 14C content of oceans is depleted relative to the atmosphere, and the difference in 14C age is known as the reservoir-age R (Reimer et al., 2009; Stuiver and Braziunas, 1993). The contemporary global mean, and typical value for open marine Danish waters, is R≈400 14C years (Heier-Nielsen et al., 1995). The local reservoir-age deviation from the global model ocean is expressed as ΔR and may depend on numerous factors such as oceanic influence, terrestrial runoff, changes in current systems, sea level or tidal range, as well as amounts of freshwater discharge (Olsen et al., 2009). In estuarine environments, the admixture of freshwater may influence the local radiocarbon reservoir age, as dissolved fossil (14C-free) carbonate can cause reservoir ages of several thousand years (the so-called hard-water effect, e.g. Philippsen et al., 2010), whereas mineralisation of contemporaneous terrestrial organic matter or exchange with atmospheric CO2 may result in lower reservoir ages. Freshwater influence on the 14C reservoir age is therefore complex. Because of these site-specific reservoir effects, it is of paramount importance to estimate the 14C reservoir age in estuarine environments such as the Limfjord for more accurate chronologies for both archaeological and palaeoenvironmental studies. The multiple causes for varying reservoir ages in an estuary may be disentangled using a multiproxy approach.
Here the 14C reservoir-age variability and environmental history of the southwestern Limfjord is presented. The multiproxy approach includes study of sedimentary micro-and macrofossils, geochemistry (organic matter content, C/N ratios), stable isotopes of sediment organic matter (δ13C, δ15N) and radiocarbon dating in order to contribute to an improved understanding of past changes in organic matter origin, nutrient source, salinity and 14C reservoir ages in the context of archaeological evidence.
Location
The Limfjord is a branched sound through northern Jutland, Denmark, connecting the North Sea with the Kattegat (Figure 1). It has an average depth of 4.9 m and a salinity of c. 30‰. Close to the eastward main current, the salinity varies by 2–4‰ from week to week (Grooss et al., 1996).
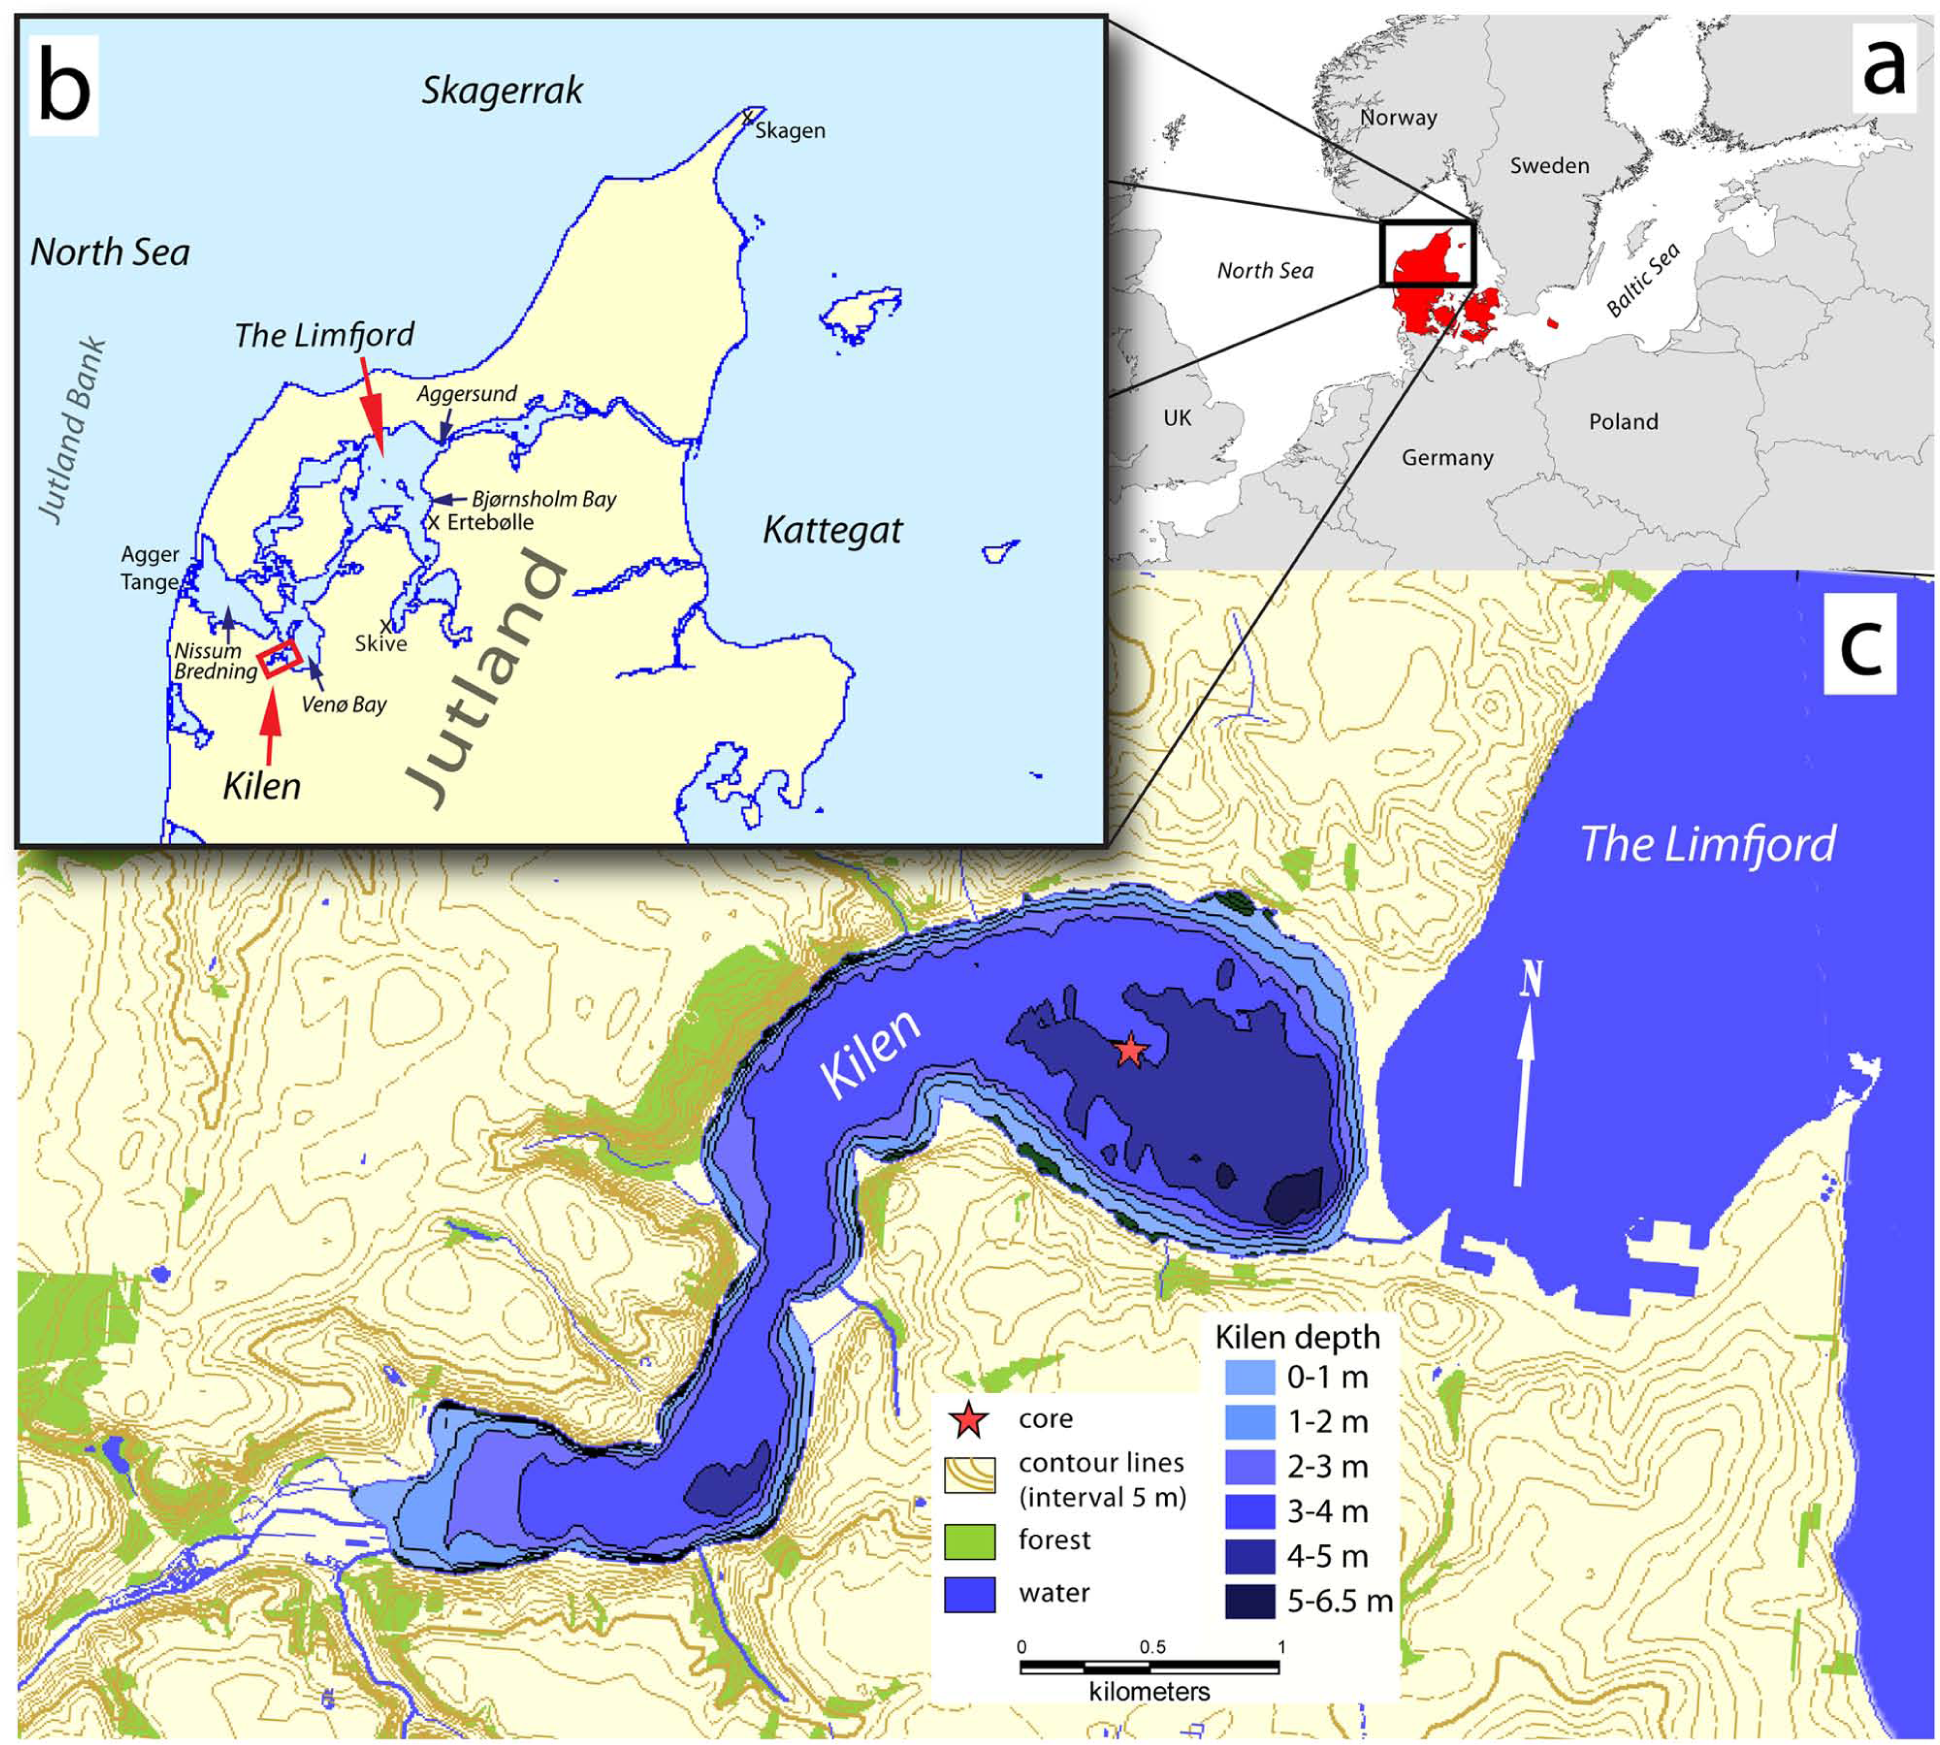
Map of the Limfjord and Kilen regions. (a) Overview, (b) the Limfjord region. Localities mentioned in the text are labelled. (c) Detailed map of the Kilen core site (colour figure available online).
Kilen is a former inlet of the Limfjord (56°30.005′N, 08°34.089′E, Figure 1), located in a tunnel valley (Smed, 1981). It is surrounded by 25–35 m high slopes, has a mean water depth of 2.9 m and a surface area of 3.34 km2. The catchment area of 35.3 km2 includes two brooks, Bredkær bæk and Vasens bæk (Jensen et al., 2006). Today, Kilen is a brackish embayment with salinity around 6‰, as sand spit formation and the construction of a dam in 1856 isolated Kilen from the main Limfjord (Ringkjøbing Amtskommune and Teknik- og Miljøforvaltningen, 1991). Kilen is believed to have been naturally protected from strong currents, storms and wave action in the past, and hence a continuous sediment sequence has been preserved.
Materials and methods
In 2007, a c. 1560 cm long sediment sequence was obtained from Kilen. The coring was made with a Russian peat sampler (chamber length 100 cm; Jowsey, 1966) in two parallel boreholes at a water depth of 390 cm below present sea level (b.p.s.l.). The sediments consist of homogenous grey-brown marine clay gyttja. Our analyses focus on the part between 467 and 1935 cm b.p.s.l. which was subsampled at 1–2 cm depth intervals.
Loss on ignition (LOI) at 550°C and 925°C allowed estimation of organic matter and CaCO3 (Bengtsson and Enell, 1986; Dean, 1974). The total organic carbon content (TOC) was determined by the elemental analyser used for stable isotope measurements. Accumulation rates (mg/cm2 per yr) of organic matter, TOC, CaCO3 and minerogenic matter were calculated using the sediment dry density (mg/cm3) and the accumulation rate (cm/yr) derived from the constructed age model.
Material for AMS 14C dating was retrieved by wet sieving. Plant remains were pre-treated with 1M HCl at 80°C for 1 h, 1M NaOH at 80°C for at least 3 h, and lastly 1M HCl at 20°C overnight. The samples were combusted to CO2 in sealed evacuated quartz tubes containing CuO. Shells were cleaned with ultrasound in demineralised water. Depending on size, the outer 10–25% of each shell was dissolved with 1M HCl. For sample sizes below 8 mg, no HCl treatment was performed. Possible organic remains were removed with KMnO4 at 80°C.
A total of 13–14 mg of pre-treated shell material was dissolved in 100% H3PO4 to produce CO2 for radiocarbon dating and measurement of δ13Cshell and δ18Oshell. For radiocarbon dating, the CO2 was converted to graphite with the H2 reduction method (Vogel et al., 1984). It was measured at the AMS 14C Dating Centre at Aarhus University (AAR-numbers) or at the 14CHRONO Centre, Queen’s University Belfast (UBA-numbers). The dating results (Table 1) are reported as conventional 14C dates in 14C yr BP (Stuiver and Polach, 1977). Calibrated dates have been obtained using OxCal version 4 with IntCal09 (Bronk Ramsey, 2008; Reimer et al., 2009) and are quoted as cal. yr BP (before
Radiocarbon dating of terrestrial samples for the age model and of mollusc shells. Mollusc samples are shaded.
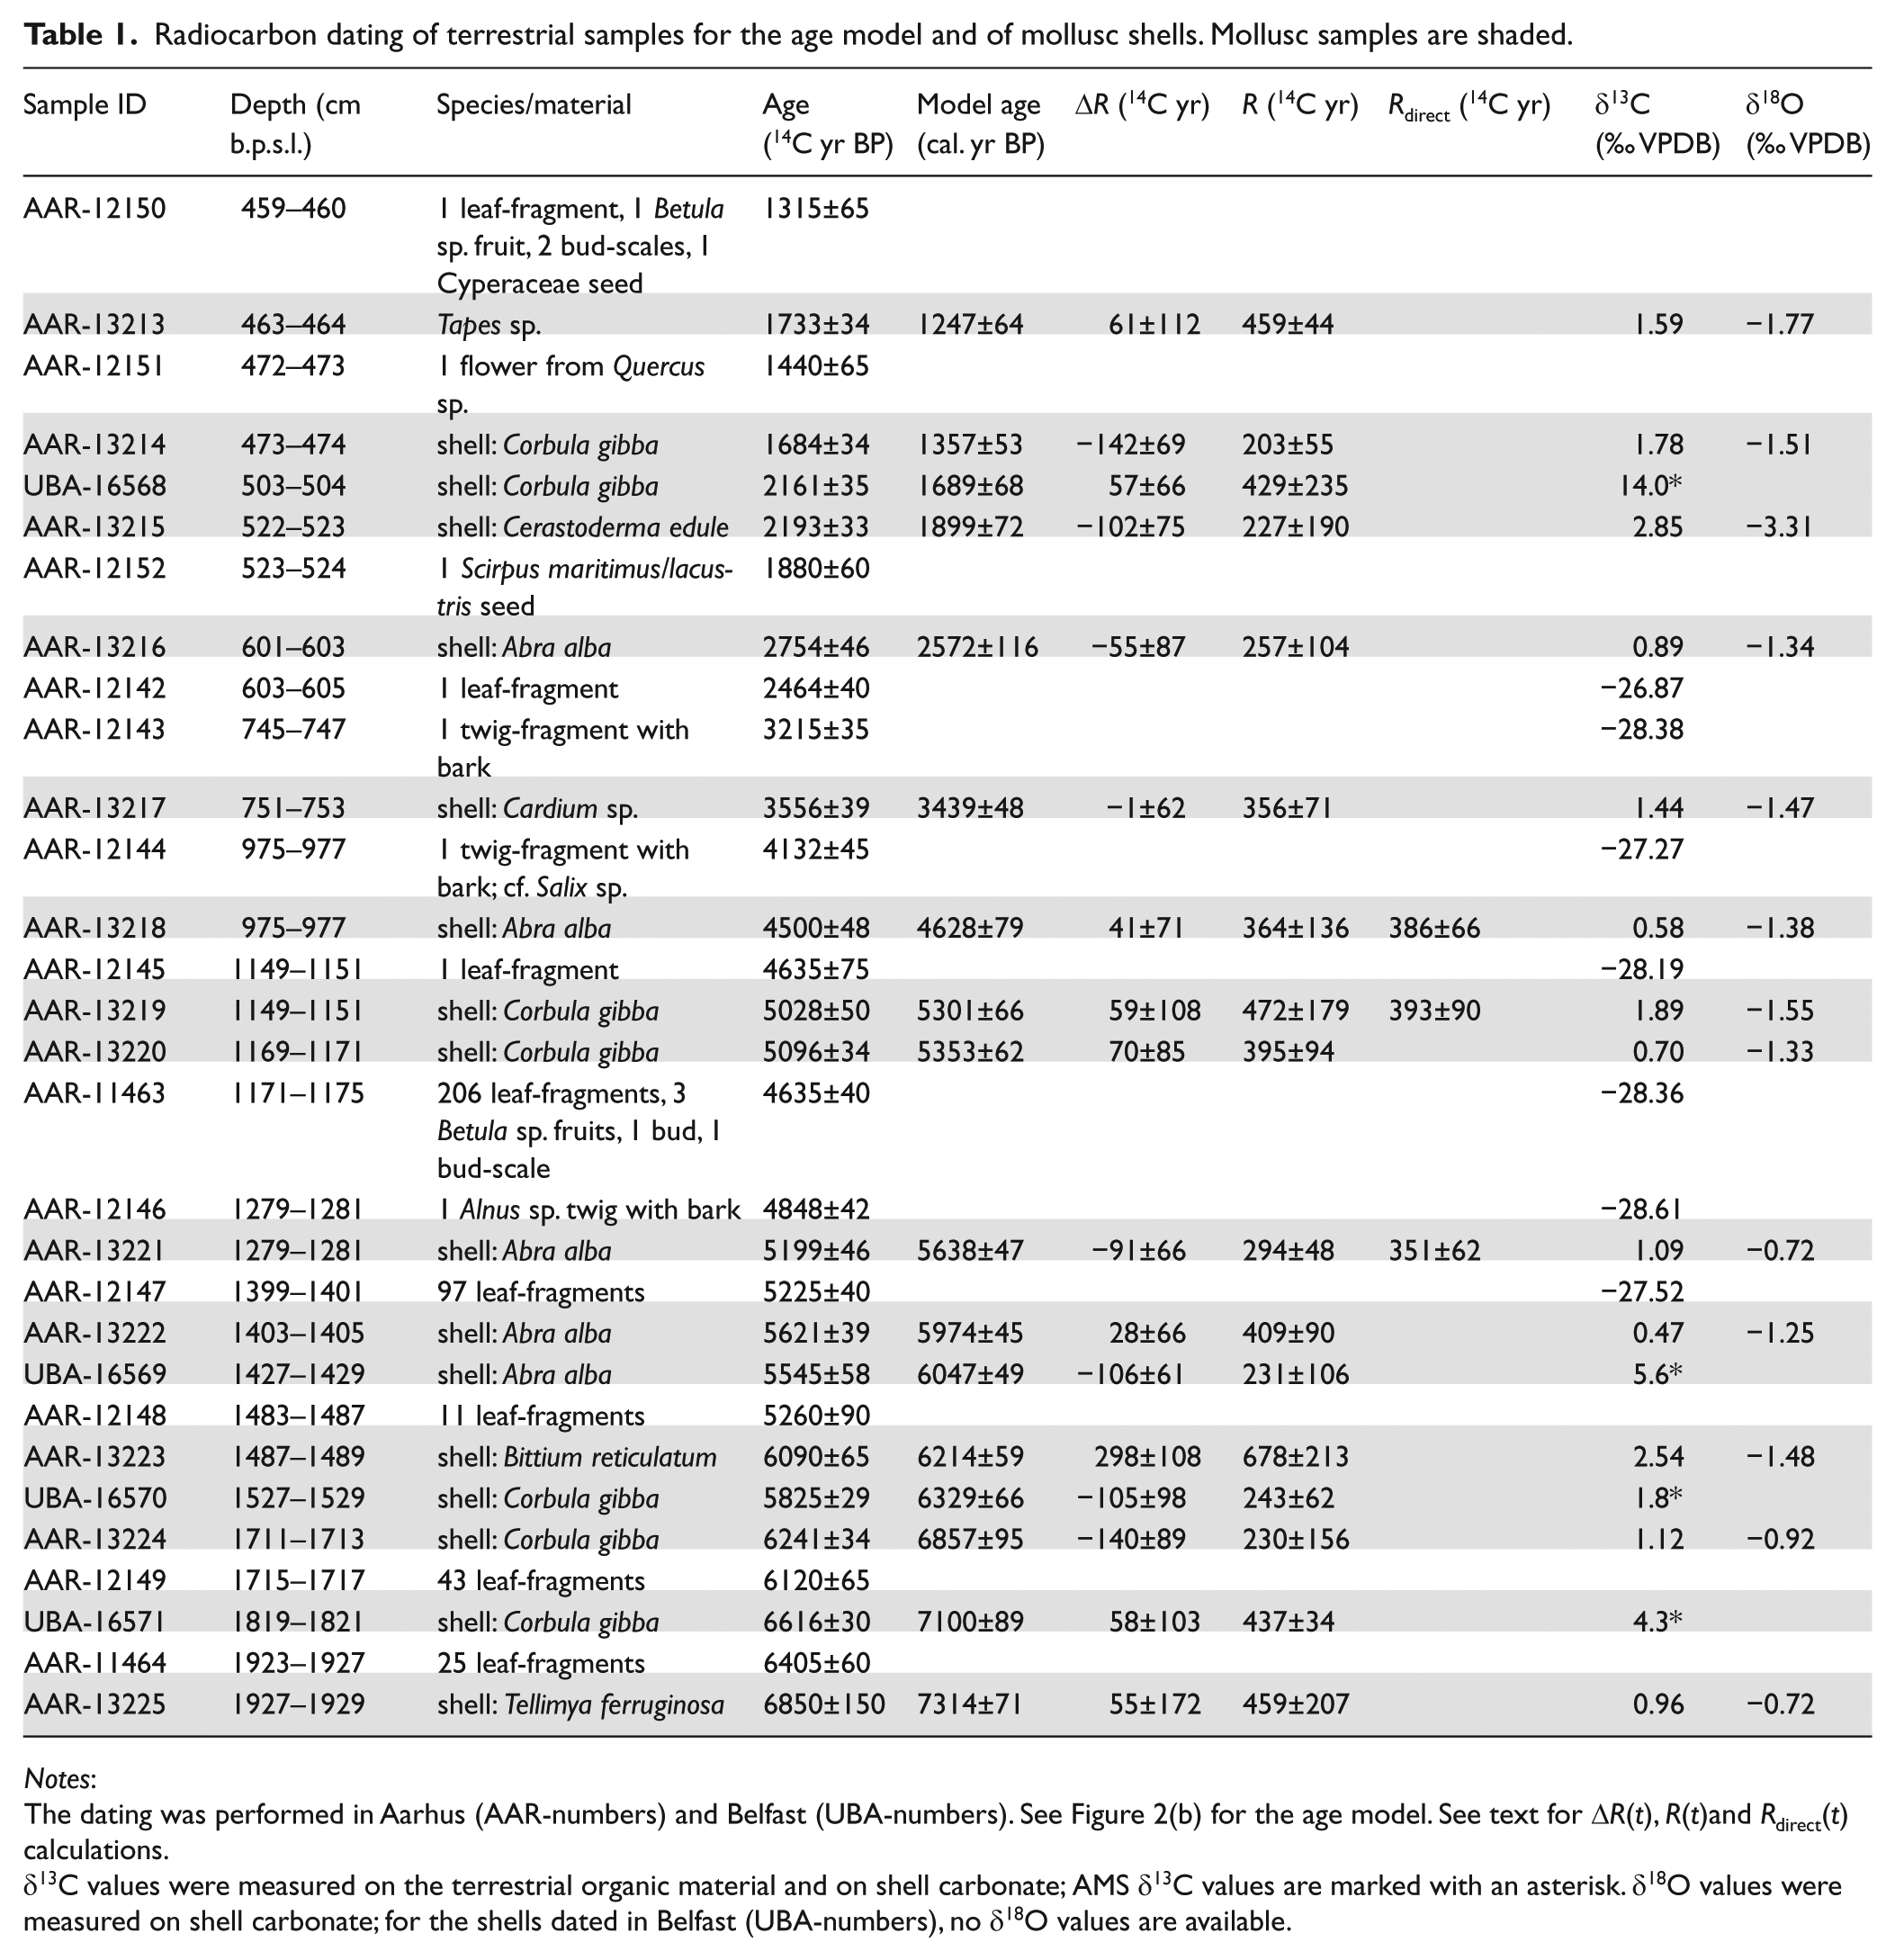
Notes:
The dating was performed in Aarhus (AAR-numbers) and Belfast (UBA-numbers). See Figure 2(b) for the age model. See text for ΔR(t), R(t)and Rdirect(t) calculations.
δ13C values were measured on the terrestrial organic material and on shell carbonate; AMS δ13C values are marked with an asterisk. δ18O values were measured on shell carbonate; for the shells dated in Belfast (UBA-numbers), no δ18O values are available.
Bulk sediment samples for total organic carbon (TOC), total nitrogen (TN), 13C/12C and 15N/14N ratios were pre-treated with 1M HCl at 60°C to remove carbonate, washed with deionised water and freeze dried. The analyses were performed by combustion in a EuroVector elemental analyser coupled to an IsoPrime stable isotope ratio mass spectrometer at the AMS 14C Dating Centre at Aarhus University. Most samples yielded enough material for replicate measurements. δ13C values are reported as ‰ VPDB, δ15N values as ‰ AIR. C/N ratios were derived from TOC and TN measurements and are presented in atomic units.
δ13Cshell and δ18Oshell were measured on a CO2 aliquot from the radiocarbon preparation using a Dual Inlet IsoPrime stable isotope mass spectrometer at the AMS 14C Dating Centre at Aarhus University. δ13C and δ18O values are reported as ‰ VPDB, and the standard deviation of 0.05‰ was determined using internal laboratory standards.
Other analyses on the same sediment sequence, including diatoms, foraminifera, molluscs, terrestrial macrofossils and sedimentary pigments, are described in detail in Lewis (2011) and Lewis et al. (2013).
Chronology
The age–depth model is based on 13 14C dated macrofossil samples of unequivocally terrestrial origin (Table 1). It was constructed using the P_sequence deposition model in OxCal 4.1 (Bronk Ramsey, 2008). To account for changes in accumulation rate, boundaries are inserted at 447, 552, 1055 and 1748 cm, based on major changes in the CaCO3 content (Figure 2). The depositional model was calculated with k values between 10 and 200. The final k value of 150 yielded an agreement index (Amodel) of 73.3%.
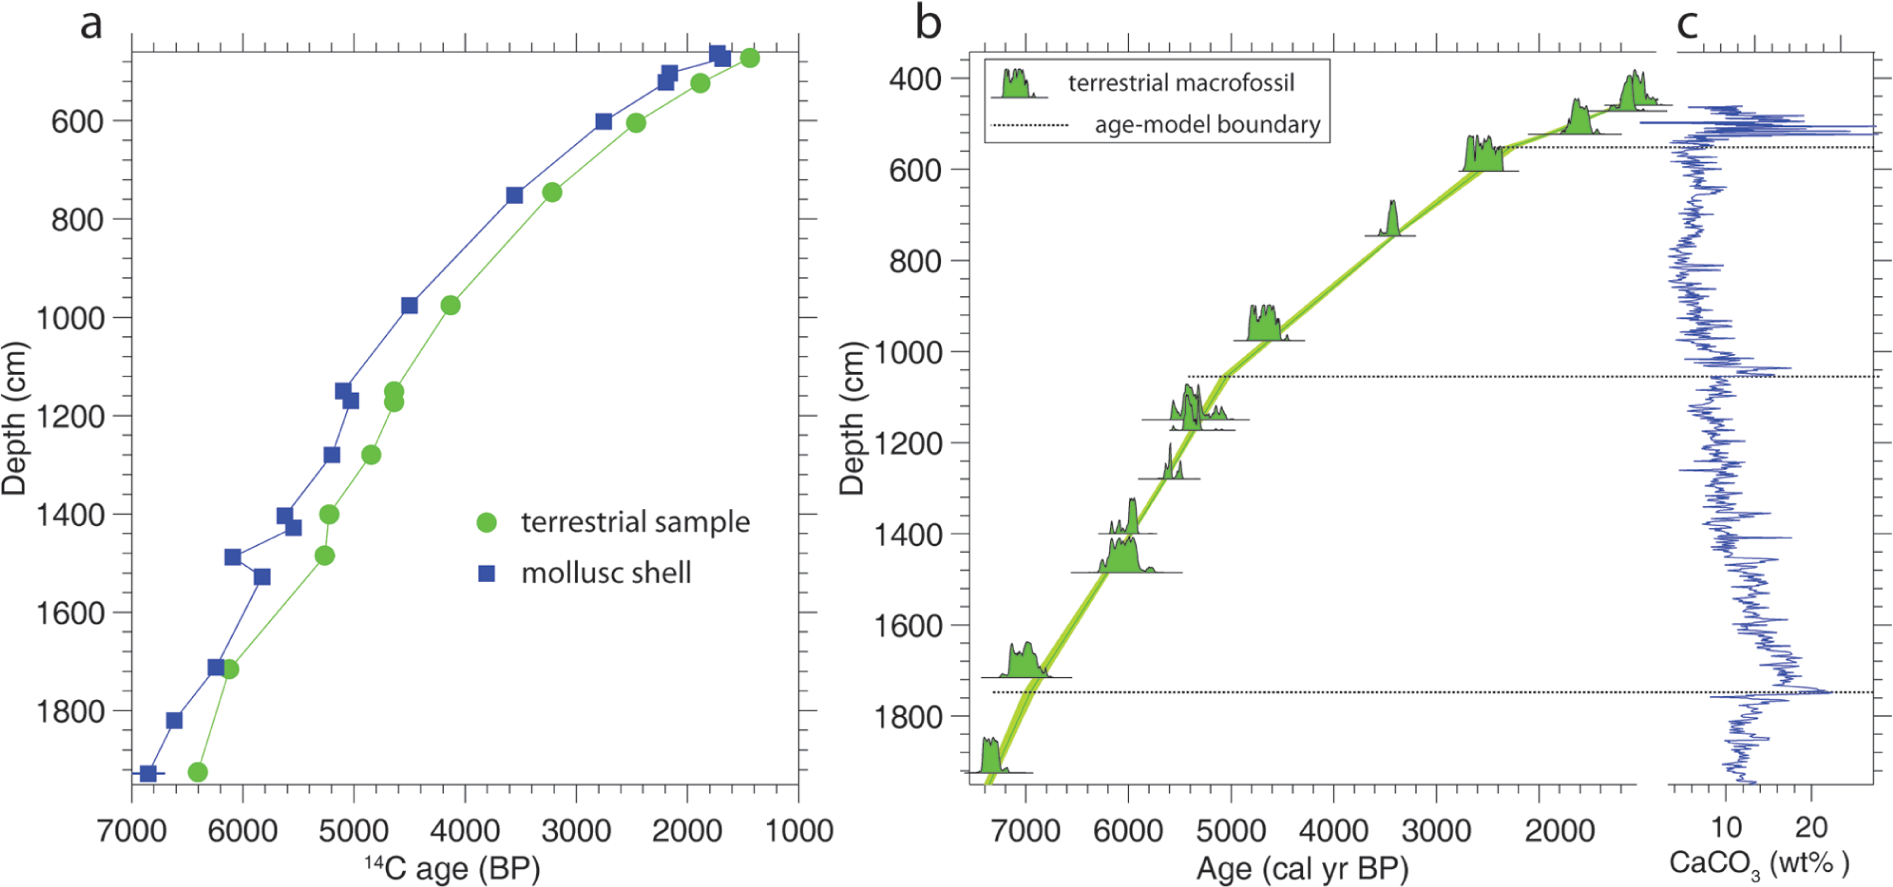
(a) Radiocarbon ages of terrestrial and shell samples; (b) the terrestrial age model with the calibrated age probability distributions of the terrestrial samples; (c) boundaries in the age model (depth levels where the accumulation rate is allowed change substantially) used for construction of the age model are based on CaCO3 (wt %).
Reservoir ages
The reservoir-age R is the difference between the 14C age of a marine sample, 14CM, and the 14C age of the contemporaneous atmosphere, as determined by the 14C age of a terrestrial sample, 14CT. Hence, when shell and terrestrial material from the same depth are available, the reservoir-age Rdirect is calculated as:

where t represents the calendar age as determined by the terrestrial age–depth model. When the contemporaneous 14C age of the atmosphere cannot be assessed directly, i.e. terrestrial material is not available at the same depth, 14CT(t) is determined using the age model (to estimate t, Figure 2) in conjunction with the atmospheric calibration curve IntCal09 (Reimer et al., 2009) to calculate the reservoir-age R(t) as:

Similarly, the local 14C reservoir-age deviation from the global ‘model’ ocean, ΔR(t), can be estimated as the difference between a measured marine 14C age, 14CM(t) and the contemporaneous marine 14C age of the global ‘model’ ocean, 14CMAR(t):

In this case, the calibrated age t of each mollusc sample is converted into a marine 14C age, 14CMAR(t), by applying the global marine calibration curve Marine09 (Reimer et al., 2009). Errors on the calculated ΔR(t) values are estimated using 95% confidence intervals on the calibrated terrestrial age of each mollusc sample together with the measurement uncertainty on 14CM, i.e. the error on the mollusc 14C date.
In total, 17 shell samples have been 14C dated to provide 14C reservoir-age estimates (Table 1). The scarcity of molluscs did not permit the use of one single species throughout the core.
Results
Based on the temporal variability of the 14C reservoir-age R(t), the core has been visually divided into four time intervals, denoted zones 1–4 (Figure 3). The division between zones 1 and 2 is supported by fluctuations in CaCO3, minerogenic and organic matter accumulation rates and δ13C, C/N and δ15N peaks. The boundary between zones 2 and 3 immediately precedes a decrease in the minerogenic mass accumulation rate. A sharp decrease in δ15N values marks the transition from zone 3 to zone 4.
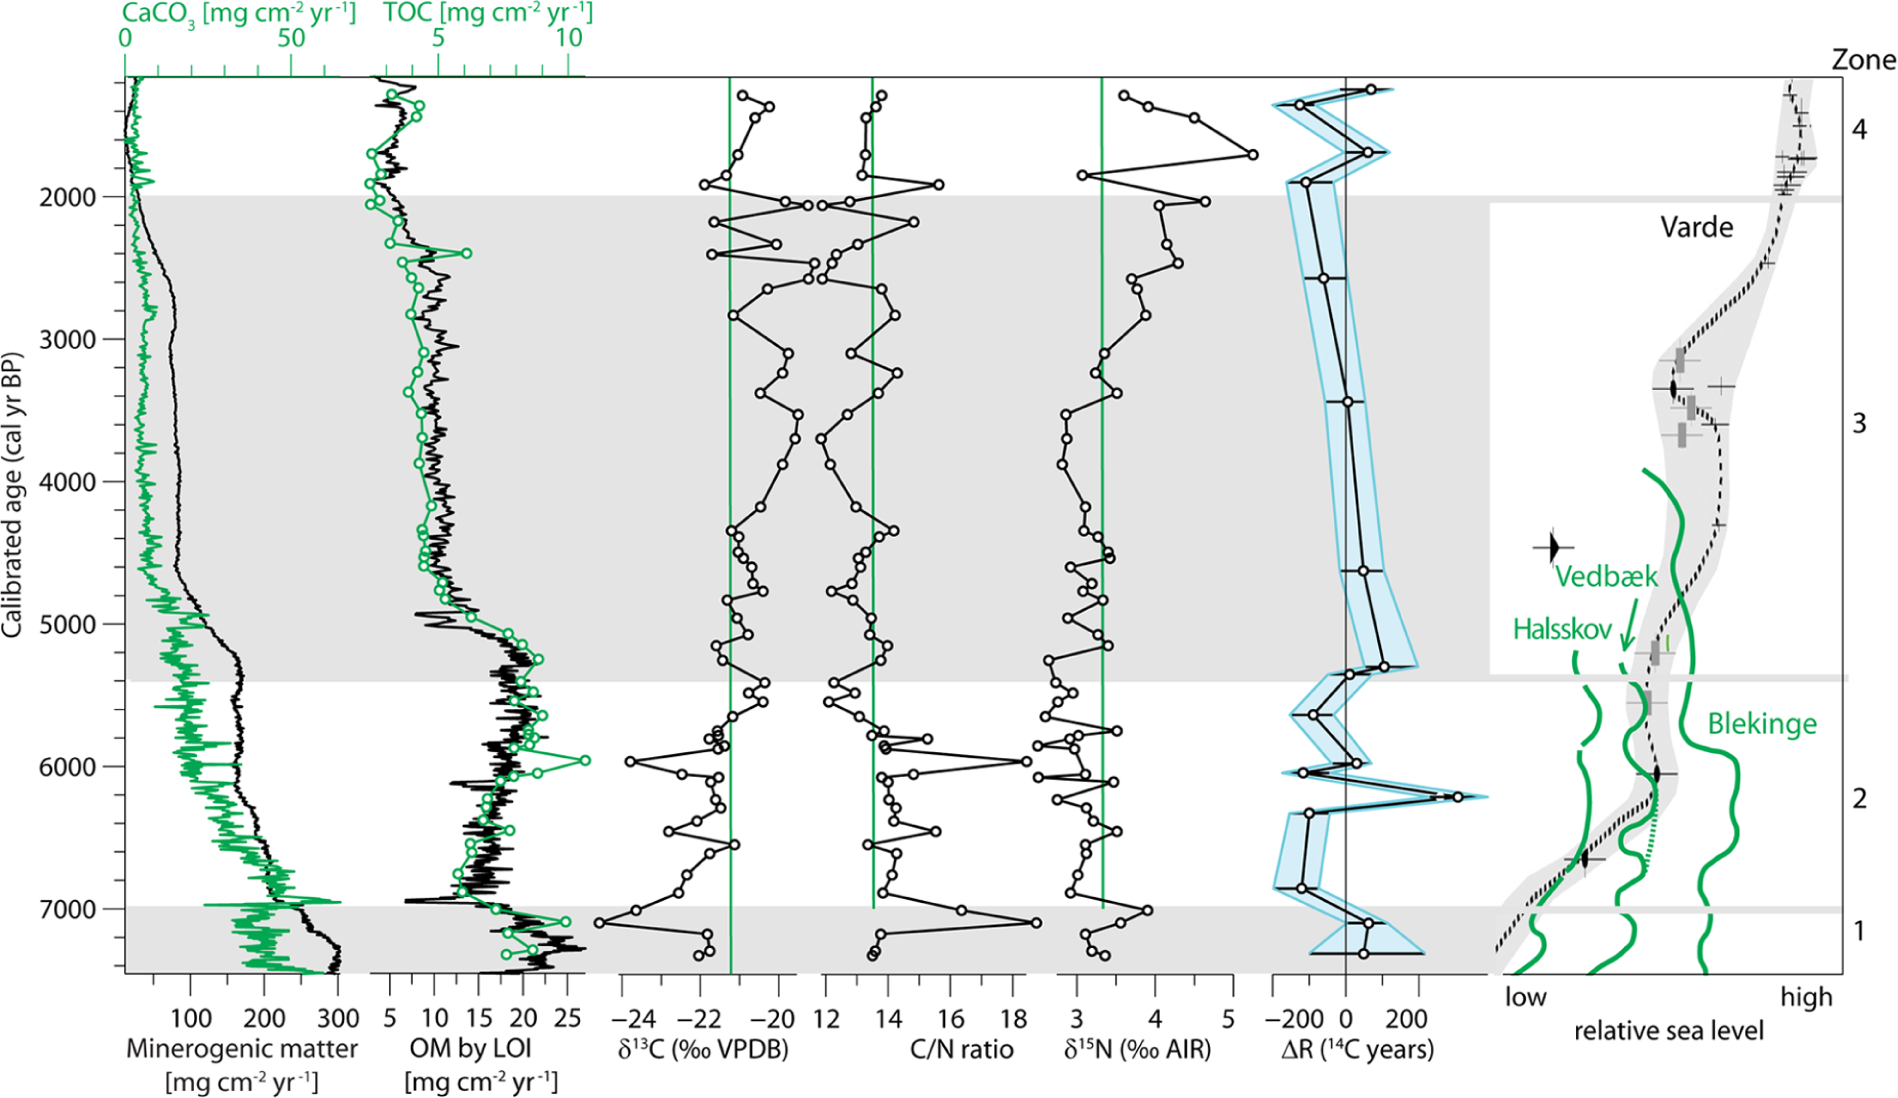
Geophysical and geochemical data from the Kilen sediment core. CaCO3, minerogenic, TOC and LOI mass accumulation rates, as well as δ13C, C/N, δ15N and ΔR are shown. Average δ13C, C/N and δ15N of the complete record are indicated with green vertical lines and ΔR = 0 years with a vertical black line. For comparison, sea-level curves are given for the North Sea at Varde (Pedersen et al., 2009) and for the Baltic, Storebælt and Øresund (Berglund, 1971; Christensen, 1982, 1993, 1995; Christensen and Andreasen, 1999; Hede, 2003).
Zone 1: 7300–7000 cal. yr BP
The shells from this zone yield ΔR values of ≈55 years. δ13C values are around −22‰ and decrease to −24.6‰ at c. 7100 cal. yr BP, the lowest value of the profile. This δ13C minimum is accompanied by a C/N ratio maximum of up to 18. δ15N values are between 3 and 3.5‰ and increase to about 4‰ at the top of the zone.
Zone 2: 7000–5400 cal. yr BP
This zone exhibits the largest variations in ΔR. The shell with the highest ΔR of 300 years occurs in this zone at c. 6200 cal. yr BP. Two shells adjacent to this one have ΔR values of −105 and −106 years.
Two δ13C minima, approximately −23 and −24‰, coincide with the two highest C/N values of the core, C/N>18. In general, δ13C values are slightly increasing, and C/N ratios decreasing, particularly towards the top of this zone. In the lower half of the zone, δ15N values are relatively stable at around 3‰, but vary by c. 1‰ in the upper half.
Zone 3: 5400–2000 cal. yr BP
ΔR decreases gradually from 70 to −55 years throughout this zone. The general trend towards less negative δ13C values continues to −20‰. At the end of the zone, variation increases and δ13C and C/N ratio ranges from −21.7 to −19.1‰ and from 11 to 15, respectively. Initially, δ15N values vary between 2.5 and 3.5‰. They increase after 4000 cal. yr BP.
Zone 4: 2000–1300 cal. yr BP
ΔR ranges between −142 and 61 years. The highest δ13Cshell and lowest δ18Oshell of the profile occur at the bottom of this zone. δ13C values are around −21‰ and increase slightly. δ15N is highly variable in this interval. The maximum value for δ15N, 5.3‰, occurs at 1700 cal. yr BP. After a C/N ratio peak of 16 at 1900 cal. yr BP, the values remain quite stable at ≈13 and only increase to 14 at the top of the zone.
Discussion
δ13C, δ15N and C/N
Variations in δ13C and C/N values are commonly caused by changes in organic matter origin or primary organic productivity. In isolation basins, δ13C and C/N ratios have been used to distinguish marine and terrestrial organic matter (Mackie et al., 2007; Olsen et al., 2011). C/N ratios below 10 primarily reflect algae, whereas C/N ratios above 20 indicate terrestrial organic matter (Meyers and Teranes, 2001). Kilen C/N ratios range between 12 and 19 and span almost the entire range from algae to terrestrial organic matter (Figures 3, 4).

Scatter plots of selected geochemical proxies. Zones used in the text are indicated by different symbols and colours. (a) δ13C – C/N scatter plot. Shown are also the global δ13C and C/N fields from Meyers and Teranes (2001). (b) δ15N – TOC scatter plot. (c) Scatter plot of δ13C versus diatom inferred (DI) salinities (Lewis et al., 2013). The solid black line indicates a straight line fit for zones 1–3 (R2=0.47). (d) δ13C – TOC scatter plot (colour figure available online).
Marine organic matter typically has δ13C values between −16 and −22‰ (e.g. Mackie et al., 2007), freshwater organic matter between −35 and −25‰ and terrestrial organic matter between −30 and −25‰ (Meyers and Teranes, 2001). The δ13C values from Kilen range from −24.6 to −19.1‰, i.e. between terrestrial and marine δ13C values. The low δ13C values (around −22‰) and high C/N ratios (around 14) from the core base to c. 5700 cal. yr BP indicate that the organic matter content is dominated by a mixture of autochthonous and allochthonous sources. After 5700 cal. yr BP, δ13C values higher than −22‰ and C/N ratios lower than 15 signify an increasing dominance of autochthonous organic matter (Figure 3).
A strong correlation of the C/N ratios and δ13C values (ρ=−0.83, Figure 4) indicates a linear mixing between terrestrial and marine organic matter. Hence, the δ13C values and C/N ratios distinguish marine from terrestrial organic matter. The correlation is strongest in zones 1 (ρ=−0.99) and 2 (ρ= −0.89).
Correlations between δ13C and TOC would indicate that productivity controls the δ13C values. This can generally not be observed in the Kilen sediments. A few exceptions occur, though, particularly in zone 4 (ρ=0.74, Figure 4).
The salinity of the photic zone has been quantitatively reconstructed from diatom assemblages (Lewis, 2011; Lewis et al., 2013) and is shown in Figure 5. Interestingly, there is a strong correlation between the δ13C values and the diatom-inferred (DI)-salinity (ρ=0.69, excluding zone 4), indicating that the δ13C differentiation between marine and terrestrial organic matter furthermore reflects salinity variations (Figure 4).
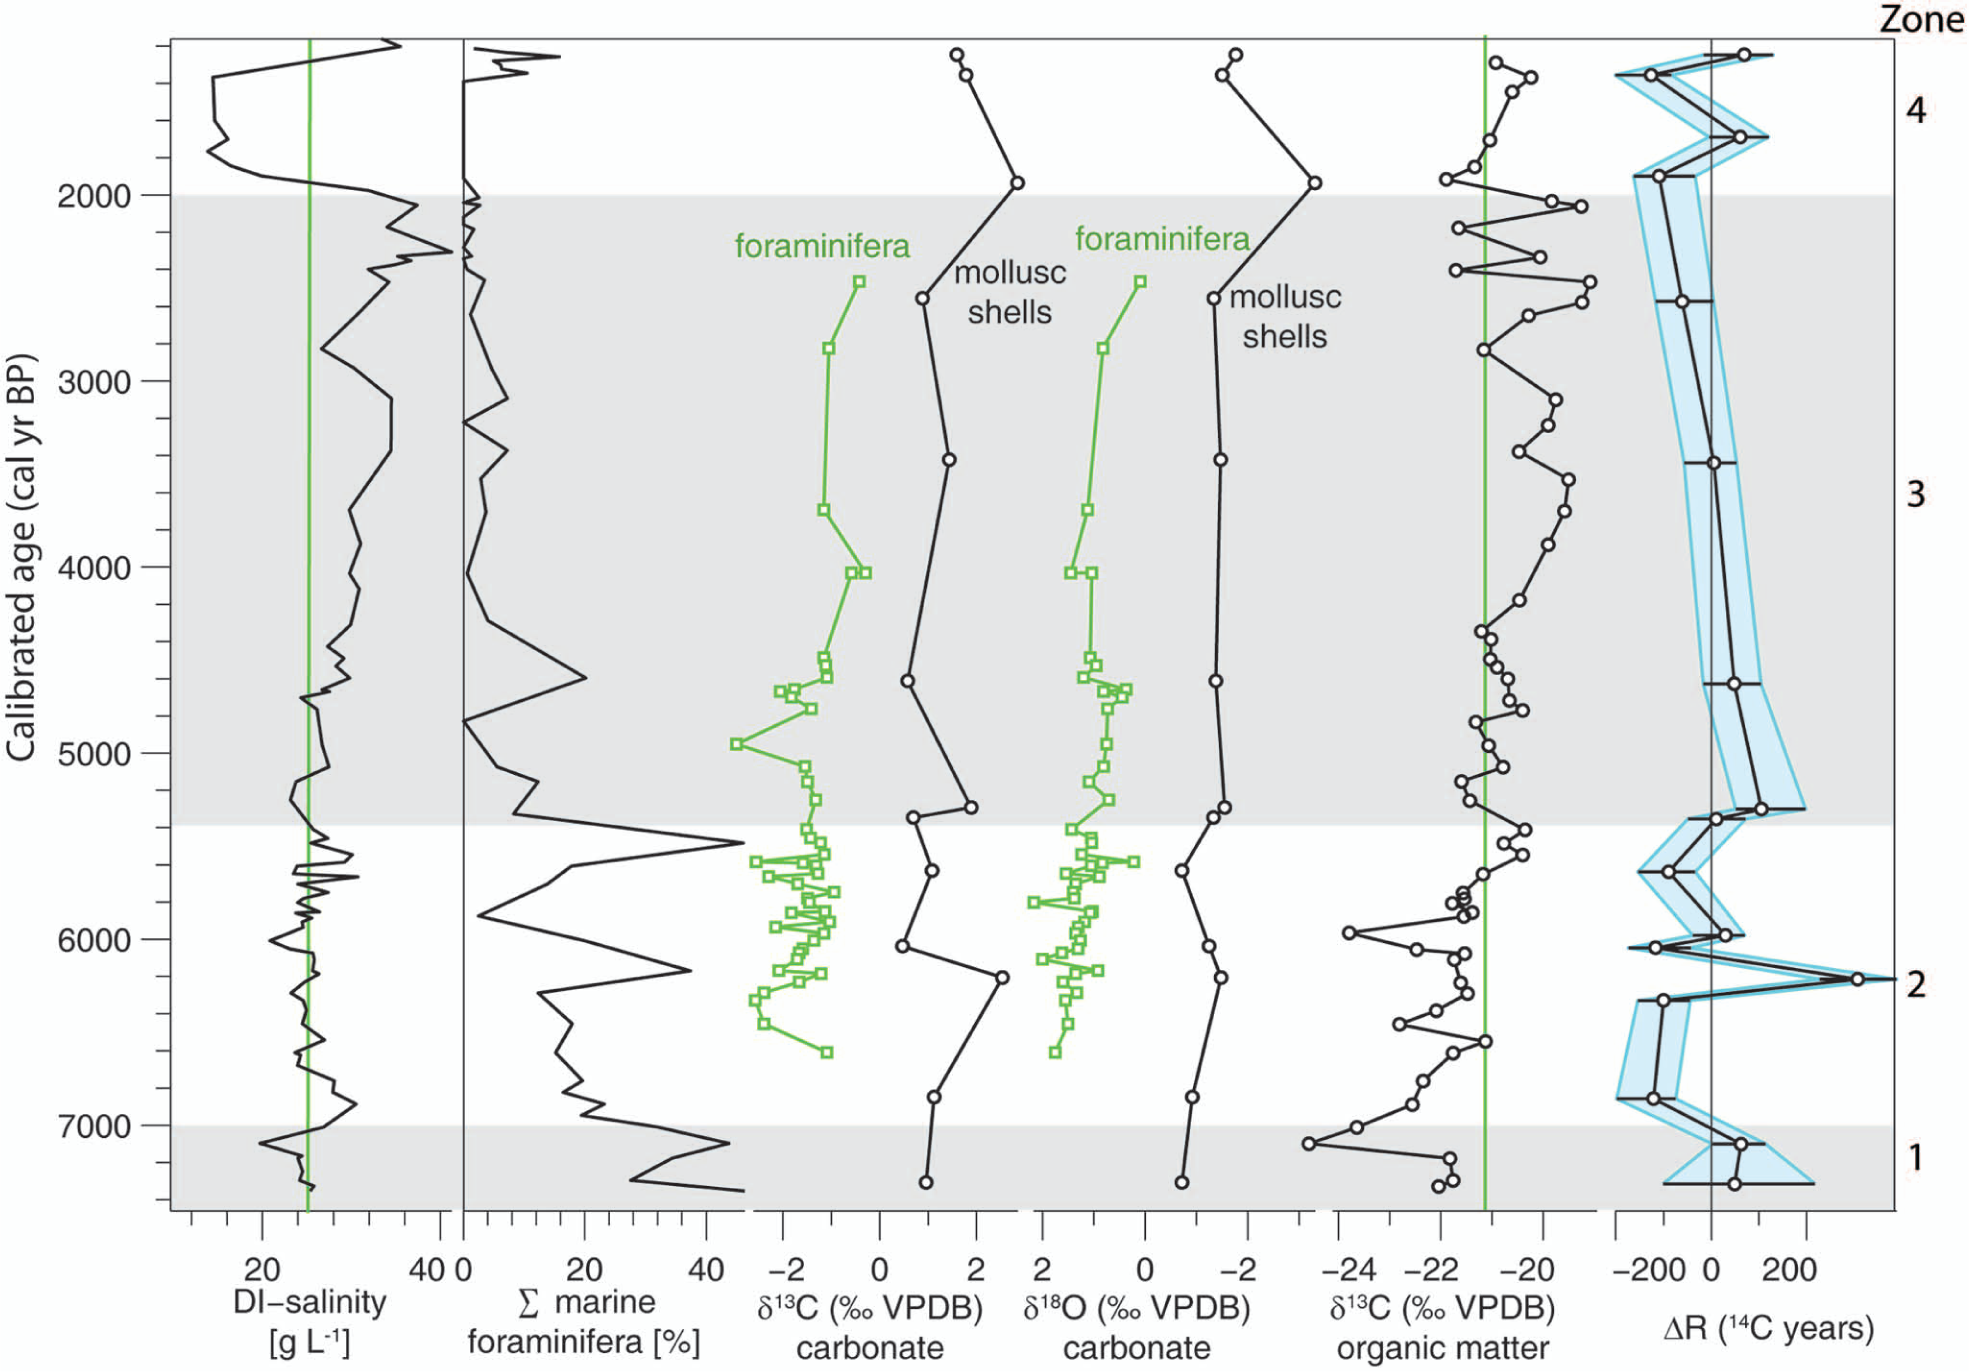
Micro- and macrofossil data (Lewis et al., 2013) shown along with selected geochemical data. The diatom inferred salinities (DI-salinity), the summed abundance of marine foraminifera species (>25‰, including the taxa Elphidium incertum, Elphidium magellanicum, Elphidium margaritaceum, Haynesina depressula, Bulimina marginata and Stainforthia spp. (Alve and Murray, 1999; Conradsen et al., 1994; Haake, 1962; Lutze, 1965, 1974; Murray, 1991)), δ13Cshell, δ18Oshell are shown, as well as δ13Cforams and δ18Oforams (Elphidium excavatum f. selseyensis), organic matter δ13C and the radiocarbon reservoir age (ΔR).
High DI-salinities concur with high δ13C and low C/N values, reflecting autochthonous marine organic matter. Low DI-salinities concur with low δ13C values and high C/N ratios, i.e. a higher proportion of terrestrial organic matter. This suggests that marine conditions enhance autochthonous organic productivity in contrast to brackish conditions, during which the fraction of terrestrial organic matter is high.
Major and rapid increases in C/N ratios, associated with significant decreases in δ13C values around 7100 and 6000 cal. yr BP are probably caused by a large transfer of terrestrial organic matter into the sediments (Figure 3). They may indicate transgression events, i.e. increases of the relative sea level, where coastal areas are inundated and terrestrial organic material is transported into the water. Such local sea-level fluctuations have been reported for both North Sea and Baltic Sea (Figure 3; Behre, 2007; Harff et al., 2005). During the first centuries after each transgression event, δ13C values increase to values higher than before the transgressions. The higher sea level had possibly caused an increased distance from the shore to the coring location, thus limiting the input of terrestrial material and increasing the relative importance of marine organic matter.
Organic matter nitrogen stable isotope values can be challenging to interpret because δ15N may depend on source organic matter, primary organic productivity and anaerobic processes of ammonification and denitrification (Talbot, 2001). Land plants have typical δ15N values from 2 to 10‰, lacustrine sediments from −2 to 20‰, and marine phytoplankton from 3 to 12‰ (Owens, 1987; Talbot, 2001). The Kilen δ15N values range from 2.5 to 5.3‰ and fall within the normal range of marine and terrestrial δ15N values. The δ15N values are uncorrelated with δ13C (ρ=0.17) and C/N (ρ=−0.01). Contrary to δ13C, δ15N can therefore not resolve the origin of the source organic matter. Ammonification and denitrification are also deemed unlikely as an explanation of the increasing δ15N values because of the lack of supporting evidence from diatoms, foraminifera and pigment analysis (Lewis, 2011; Lewis et al., 2013). The weak correlation between δ15N and TOC (ρ=0.51) suggests that the δ15N values are partly controlled by primary organic productivity (Figure 4). In zone 3, this correlation is stronger (ρ=0.68). Combined with the generally low C/N values (around 13, i.e. autochthonous organic matter), this suggests a stronger coupling with organic productivity.
In most environments, nitrogen is a limiting nutrient for the production of organic matter. Therefore, an alternative explanation for the Kilen δ15N values is complete utilisation of dissolved inorganic nitrogen (DIN) during nitrogen assimilation by plankton and higher plants, leading to limited isotopic fractionation between organic matter and DIN (i.e. the organic matter δ15N will reflect δ15NDIN). Because of the close proximity of the core location to land, δ15N values likely reflect terrestrial δ15NDIN.
ΔR, δ13Cshell and δ18Oshell variability
The ΔR values range from −140 to 300 years (Figure 3, Table 1), which is within the same order of magnitude as the values measured on 19th- and 20th-century (pre-bomb) shells from the Limfjord (Heier-Nielsen et al., 1995).
In three cases, Rdirect can be calculated by comparing the 14C ages of a shell sample and a terrestrial sample from the same depth. The differences between Rdirect and R(t) values are 8±151, −79±200 and 57±78 14C years. The values thus agree within errors.
There is no correlation between shell species and the 14C reservoir age, suggesting that species effects resulting from different feeding habits or burrowing depths have no significant influence on the 14C reservoir age. A similar conclusion was reached by studies of three other Danish fjords (Olsen et al., 2009) and the North Icelandic shelf (Eiríksson et al., 2004).
During inferred marine conditions, it can be expected that the Kilen 14C reservoir-age R is c. 400 years (ΔR~0). More variable reservoir ages may be expected during inferred brackish conditions. Very high reservoir ages (ΔR>0) most likely indicate influence of 14C free carbonates, i.e. the hard-water effect, from groundwater or river discharge of dissolved carbonates. In contrast, low reservoir ages (ΔR<0) can be caused by increased CO2 exchange at the water–atmosphere boundary, or by surface-water runoff or mineralisation of contemporaneous terrestrial organic matter. Lastly, variations in the marine reservoir age itself should be kept in mind. Small fluctuations in the Kilen reservoir age might be result of these variations.
Foraminifera indicate relatively high-salinity bottom-water conditions during zone 1. This coincides with diatom-inferred brackish sea-surface conditions and ΔR values around 55 14C years. This may reflect a mixing of marine water masses with ΔR values around 0 at the sea floor and 14C-free dissolved carbonates, i.e. hard water, at the surface, or, alternatively, that the marine 14C reservoir age during this period was higher with ΔR c. 450 14C years. During the inferred brackish conditions in zones 2 and 4, ΔR values of ≈−100 years indicate a strong atmospheric or terrestrial influence. In zone 3, ΔR values around 0 years and DI salinities signify marine conditions (Figure 5).
The δ18Oshell values range from −3.3 to −0.7‰, and δ13Cshell values from 0.4 to 2.9‰, corresponding to modern marine shell values (Keith et al., 1964), with a δ18Oshell – δ13Cshell correlation of ρ=−0.69.
Low δ13Cshell and δ18Oshell values generally indicate terrestrially derived DIC (Olsen et al., 2009) as decaying terrestrial plants release CO2 depleted in 13C, resulting in low δ13Cshell values, and δ18O in precipitation is depleted in 18O relative to the ocean resulting in low δ18Oshell values (Araguas-Araguas et al., 2000).
High δ13Cshell and δ18Oshell values generally suggest a marine origin of the shell carbonate (Mook, 1971). Additionally, particulate or dissolved carbonates from surrounding tills may also result in high δ13Cshell and δ18Oshell values, because the till carbonates originate from Cretaceous calcite with δ13C and δ18O values similar to ocean isotope values (Kolstrup and Buchhardt, 1982; Noe-Nygaard and Heiberg, 2001). As a consequence, the Kilen δ13Cshell and δ18Oshell values are complicated to interpret in terms of relative contributions of marine and freshwater carbonates as furthermore indicated by the uncorrelated δ18O, DI-salinity or R(t) values.
However, the unusually high ΔR value around 6200 cal. yr BP (zone 2) is associated with a relatively high δ13Cshell value and probably influenced by 14C-free dissolved carbonates. The high ΔR value is followed by a series of negative ΔR values in concert with depleted δ13Cshell values, indicating terrestrial derived DIC which has younger radiocarbon ages and lower δ13C values than ocean DIC (Figure 5).
Zone 1: 7300–7000 cal. yr BP
In the lower part of the core, δ13C, C/N, diatoms and foraminifera indicate a highly productive environment with stratified, relatively deep water with brackish-marine surface salinities and high-salinity conditions at the bottom (Figure 5). This would correspond to the present-day stratification, with salinity differences of up to 6‰ between surface and bottom waters, as found in deeper parts of the Limfjord (Grooss et al., 1996). As we were able to retrieve about 15 m of sediment from a water depth of 4 m, we estimate that the water depth in Kilen was over 20 m at the time of deposition (corrected for c. 3 m of isostatic land rise).
Low δ13C values and high C/N ratios indicate a transgression around 7100 cal. yr BP (Figures 3, 4), which coincides with a minimum in sea-surface DI-salinity and a maximum in bottom-water salinity, as reflected in the foraminiferal record (Figure 5). Mineralisation of terrestrial organic matter and leaching of nutrients from inundated soils likely resulted in an increased nutrient supply and probably increased productivity, which may be reflected in the increased δ15N values just after the transgression event. Furthermore, the relatively high ΔR values may reflect a hard-water influence on the DIC (Figure 3). Transgression maxima or rising sea level around 7100 cal. yr BP were also demonstrated in the southern North Sea, on Sjælland (eastern Denmark) and in the southern Baltic (Behre, 2007; Christensen, 1982; Harff et al., 2005; Hede, 2003). However, when comparing sea-level curves, it must be kept in mind that transgression maxima generally occur later in southwestern than in northeastern Denmark (Christensen, 2001; Hede, 2003).
The presence of the bivalve Tellimya ferruginosa in zone 1 suggests a bottom salinity of at least 30‰ (Sorgenfrei, 1958), in agreement with a salinity of 31‰ reconstructed from δ13C and δ18O values of periwinkles from the Ertebølle shell midden (eponymous site of the Ertebølle culture) in the central Limfjord (Burman and Schmitz, 2005). The highest relative sea level in the southwestern part of the Limfjord was about 2–3 m higher than today, and in the northern Limfjord, 5–6 m higher than today (Mertz, 1924). The high sea level is concomitant with temperatures slightly higher than today (Brown et al., 2011). This resulted in an abundance of fish and the first occurrence of shell middens in Denmark. The majority of these are from 6550–6350 cal. yr BP (Andersen, 2007; Enghoff et al., 2007). Many settlements of the Ertebølle culture (c. 7400–5900 cal. yr BP) in the Limfjord region were inhabited for 1000–1500 years, and they were larger and closer to each other than in other parts of Denmark (Andersen, 1998), most likely as a consequence of a highly productive environment. The dominance of the salinity-demanding oyster (80–90%) in shell middens and natural shell banks between 7600 and 5700 cal. yr BP indicates salinities of at least 23–25‰ (Andersen, 2007; Jensen and Spärck, 1934; Yonge, 1960).
Zone 2: 7000–5400 cal. yr BP
In zone 2, δ13C and C/N signify a brackish marine environment (Figures 3, 4). From c. 6900 to 5400 cal. yr BP, foraminifera and diatoms suggest periodic water-column stratification. The concentration of high-salinity (>25‰) demanding foraminifera at the bottom is high, but variable, while diatoms indicate brackish-marine surface waters with salinities occasionally as low as 20‰ (Figure 5). δ18O and δ13C values of foraminifera (Elphidium excavatum f. selseyensis) are available from about 6600 cal. yr BP and are proxies for bottom-water salinity. High δ18Oforams values after 6600 cal. yr BP, and thus high bottom salinity, agree with the inferred weak stratification of the water column. δ13Cforams are negative which indicates greater utilisation of terrestrially derived carbon under stratified conditions (Lewis et al., 2013). δ18Oforams indicate a gradual freshening of the bottom waters until 4650 cal. yr BP (Figure 5).
A transgression event at c. 6000 cal. yr BP (δ13C minimum, C/N maximum, Figure 3) is associated with decreased ΔR, δ13Cshell and surface DI-salinity (stratification). The plant macrofossil concentration increases (Lewis et al., 2013) and supports an increased terrestrial influence on DIC (Figures 3, 5). In other regions of Denmark and the Baltic, transgression maxima or rising sea levels can be found at this time, though less pronounced than at 7100 cal. yr BP (Christensen, 1982; Harff et al., 2005). After c. 6000 cal. yr BP, foraminifera and diatoms indicate some salinity fluctuations (Figure 5). Furthermore, numerous Bittium reticulatum and occasional T. ferruginosa bivalves suggest relatively high salinity (Lewis, 2011).
At the time of the mid-Holocene elm decline, around 5900 cal. yr BP, plant macrofossil and sedimentary pigment analyses indicate a reduction in forest density and increased inputs of terrestrial organic matter, which most likely is associated with anthropogenic catchment disturbances (Lewis, 2011). At Kilen, the first evidence of agriculture is witnessed by the appearance of Plantago lanceolata pollen around 5600 cal. yr BP (Lewis, 2011; Lewis et al., 2013; cf. Iversen, 1941). In the western Limfjord region, P. lanceolata pollen occur at 5750 cal. yr BP (Andersen, 1992–1993). However, the minerogenic flux, reflecting catchment soil erosion, does not increase in this period. This indicates only limited catchment disturbance.
Elevated δ13C, decreasing C/N values and a rise in surface DI-salinity and in marine foraminifera percentage show increased marine influence after 5600 cal. yr BP. This may be associated with a strengthening of the Jutland Current and increased inflow of North Sea water into the Kattegat (Conradsen and Heier-Nielsen, 1995; Gyllencreutz and Kissel, 2006). The Jutland Current erodes and re-deposits sediments along the western and northern coast of Jutland, and may therefore have impacted the opening or closing of connections between the Limfjord and the North Sea or Skagerrak. Another possible explanation is reduced terrestrial precipitation runoff in Scandinavia after the Holocene thermal maximum.
Zone 3: 5400–2000 cal. yr BP
This interval is characterised by a decreasing degree of water-column stratification, particularly after 4600 cal. yr BP, when foraminifera and diatoms indicate approximately similar bottom- and surface-water salinities, suggesting a well-mixed water column (Lewis et al., 2013). The δ18Oforams values also reflect the overall water-column salinity (Lewis et al., 2013).
The increased δ13C and low C/N ratios, as well as relatively high surface DI-salinities, show an enhanced marine influence, probably caused by greater exposure to the North Sea in the western Limfjord. This coincides with a transgression in the Limfjord from around 4800 to 4240 cal. yr BP and high sea level around 4700 cal. yr BP at Skagen, northern Jutland (Clemmensen et al., 2001b; Petersen, 1976).
Isostatic uplift, in combination with the lower rate of the eustatic sea-level rise, reduced the depth of Kilen and may have contributed to the transition from strong water-column stratification to a well-mixed water column. Furthermore, the foraminiferal assemblage compositions, as well as a decrease in the faunal diversity (cf. Lewis et al., 2013), indicate unstable environmental conditions from 3650 cal. yr BP. Most likely, stronger wave action further weakened the water-column stratification.
Between 4000 and 3500 cal. yr BP, δ13C values, C/N ratios and DI-salinity indicate almost fully marine, mixed water-column conditions and high autochthonous productivity. This agrees well with archaeological finds and δ13C values of human bones from the Limfjord region, which indicate the persisting importance of fishing and shellfish gathering (Andersen, 2007).
In zone 3, δ15N and TOC are correlated (ρ=0.68), suggesting that the δ15N values are governed by primary organic productivity or δ15N enriched DIN from the catchment. The δ15N values of crops can increase by up to 3.5‰ as a result of manuring (Fraser et al., 2011). Interestingly, the increasing δ15N values from c. 3500 cal. yr BP concur with a shift of focus in agricultural practice from farming to cattle husbandry in the western Limfjord region and with increasing evidence for the systematic collection and usage of manuring (Kanstrup, 2012; and. SH Andersen, personal communication, 2012). An increase in the number of cattle around Kilen would have had a manuring effect on the pasture and increased the δ15N values of the DIN in the Kilen catchment.
The change in agriculture may have been forced by climate, and several studies show a climate deterioration with lower temperatures in southern Scandinavia after c. 4500 cal. yr BP, increased storminess at c. 4200 cal. yr BP and increasing precipitation in Denmark during the period 3700–4300 cal. yr BP (Brown et al., 2011; Clemmensen et al., 2001a, 2006; Olsen et al., 2010). Cereal yields may have decreased because of this climate deterioration. Hence we speculate that cattle were the better option, particularly on the relatively poor soils around Kilen. This is supported by pollen diagrams from the western Limfjord area, which indicate an expansion of pasture at the same time as the δ15N increase in Kilen (Andersen, 1992–1993).
Between 2800 and c. 2000 cal. yr BP, the δ13C values and C/N ratios suggest marine, unstable conditions with variable input of terrestrial organic matter, perhaps caused by variable amounts of freshwater inflow to the now relatively shallow Kilen (Figure 3). A possible freshwater event is also recorded in the δ18Oforams values (Lewis et al., 2013). A strong marine influence is supported by the increasing surface DI-salinity (Figure 5), which is consistent with micro- and macrofauna records from Bjørnsholm Bay and continuous marine sedimentation until c. 2200 cal. yr BP at Agger Tange (Christensen et al., 2004; Kristensen et al., 1995; Petersen, 1985). Around 2400 cal. yr BP, a high relative sea level persisted in the Skagen region, and a marine transgression phase began in the southern North Sea (Behre, 2007; Clemmensen et al., 2001b).
The ΔR values around 0 suggest marine conditions, which is supported by the archaeological record from the Limfjord in the period 2500–2000 cal. yr BP, which includes fish bones and molluscs, indicating that marine resources were available and important (Andersen, 1998).
Zone 4: 2000–1300 cal. yr BP
Around 2000 cal. yr BP, a dramatic environmental change is recorded in the Kilen sediments. Low DI-salinity and the disappearance of marine foraminifera indicate brackish conditions. Initially, δ15N has a minimum, succeeded by the highest values of the entire core (Figure 3).
Negative ΔR values at 1900 and 1700 cal. yr BP can be caused by a reduced connection of Kilen with the Limfjord, resulting in a higher degree of equilibrium of its water with the atmosphere. This is in agreement with the low salinity and the general decrease in water depth. Alternatively, this could signify an increased exposure to surface runoff. The indication of a shift from open marine to brackish conditions by the δ13C and C/N values is supported by micro- and macrofossil assemblages at Bjørnsholm Bay (Christensen et al., 2004; Kristensen et al., 1995). Therefore, this shift in the marine environment appears to include the entire Limfjord, which most likely was cut off from the North Sea and Skagerrak during this period.
The archaeological record in the Limfjord region and δ13C measurements on human bones from c. 1550 to 900 cal. yr BP show a reduced utilisation of marine resources (Andersen, 1998). It is unclear whether this change is caused by the less marine conditions, or whether the change in human diet has a cultural background.
The period around 1500 cal. yr BP, with high δ15N values, concurs with low C/N ratios indicating autochthonous organic matter. Between 1360 and 1200 cal. yr BP, there is a short-term re-appearance of marine (>25‰) foraminifera, and at 1250 cal. BP, ΔR=60 years may indicate a higher marine influence, suggesting that the isolation of Kilen was only of short duration (Figures 3, 5).
Conclusions
In a sediment record from Kilen in the Limfjord, northern Denmark, δ13C values and C/N ratios of sediment organic matter are strongly correlated and reflect source organic matter. A linear mixing of marine and terrestrial organic matter can be observed. The δ13C values also correlate with a diatom-inferred (DI) quantitative reconstruction of surface salinity and can thus be used as a proxy for salinity estimation in the photic zone. During brackish conditions, sediment organic matter is dominated by terrestrial input, whereas marine conditions enhance autochthonous production.
In the interval 7300–7000 cal. yr BP (zone 1), the water is relatively deep and stratified with brackish surface conditions and high-salinity bottom waters. A transgression event occurs around 7100 cal. yr BP. A subsequent δ15N maximum reflects increased organic productivity caused by mineralisation of terrestrial organic matter entering Kilen during the transgression. ΔR values around +55 years may be influenced by mixing of high-salinity bottom waters and 14C-free fresh water with a high content of dissolved fossil carbonate, further supporting the interpretation of relatively brackish surface waters. The high bottom-water salinity indicates an unimpeded connection between the Limfjord and the open ocean. However, as many proxies indicate a low-energy environment, the connection(s) to the ocean must have been at some distance from Kilen, and we suggest that the northern Limfjord was substantially exposed to the Skagerrak during this time interval, rather than to the west, as is presently the case.
In the interval 7000–5400 cal. yr BP (zone 2), δ13C, C/N and DI-salinity indicate another transgression around 6000 cal. yr BP. This zone is characterised by negative ΔR values, presumably caused by a freshwater influence with terrestrial derived DIC. A ΔR value around 300 years at c. 6300 cal. yr BP can only be a result of the hardwater effect, implying a large contribution of carbonate-rich freshwater. TOC and TN increase through zone 2 and reach stable values in the subsequent interval, 5400–2000 cal. yr BP (zone 3).
Zone 3 is furthermore characterised by increasing marine conditions, as shown by increasing δ13C values and DI-salinity, decreasing C/N and ΔR around zero. Surface salinity increases, while bottom salinity decreases, indicating that the previously stratified water column now became mixed, because of progressive shallowing.
The interval 2000–1300 cal. yr BP (zone 4) represents a highly productive brackish environment with relatively low water depth and varying ΔR, which alternately shows an increased exchange with the atmosphere (negative ΔR) and a small influence from the hardwater effect (positive ΔR). The DI-salinity reaches a minimum of about 15‰, but is no longer correlated with δ13C. The δ13C and C/N values only show a limited terrestrial influence and are dominated by autochthonous production, which is in agreement with indications of high productivity such as high δ15N values.
We suggest that the salinity changes observed in zones 3 to 4 show increased marine influence in the western part of the Limfjord (through the western opening of the fjord towards the North Sea), whereas the northern openings diminished as a result of isostatic uplift, aeolian sand transport and redeposition of sediment by ocean currents, mainly the Jutland Current. Additionally, reduced connection of Kilen to the Limfjord should be considered. Further work from sites in the northern Limfjord is needed, however, to explore this.
Generally, δ15N values do not follow the development in the brackish/marine environment. The values appear to reflect changes in the catchment of Kilen and vary only slightly until a major increase occurs after c. 3500 cal. yr BP, which may reflect a change in agriculture as a response to a cooler climate. In general, the Kilen record shows a gradual increase in anthropogenic influence, from the first catchment disturbances at around the time of the elm decline (c. 5900 cal. yr BP), over the first substantial traces of agriculture (c. 5600 cal. yr BP) to possibly heavier dependence on cattle after 3500 cal. yr BP.
Footnotes
Acknowledgements
Thanks to Søren H Andersen for an inspiring discussion regarding the archaeological implications of this study. We thank two anonymous reviewers who provided useful suggestions for improving this paper.
Funding
The Faculty of Science and Technology and the AMS 14C Dating Centre at Aarhus University are thanked for funding BP during her PhD at Aarhus University. Collection of the core material from Kilen plus a series of 14C dates from the site was funded by The Danish Council for Independent Research – Humanities and The Danish Council for Independent Research – Natural Sciences, respectively, through grants to PR (nos. 25-03-0462 and 21-03-0510). Foraminiferal analysis is a contribution to the Natural Environment Research Council grant number 09-072321 (GREEN-ICE) to KLK. The PhD funding for JPL was provided by the Loughborough University Development Fund. NERC Isotope Geosciences Facilities Steering Committee (NIGFSC; award no. IP/1080/1108) provided funds for isotope analysis to DBR and JPL.