



Abstract
In recent years, Nguène Lake and Kamalété Lake (Gabon, West Central Africa) have been studied repeatedly, providing comprehensive reconstructions of environmental changes over the last millennia. Both lakes are in different geomorphological and environmental settings. They are therefore excellent sites to test new methodological approaches. Indeed, the sedimentary cores provide various facies, and the previous studies provide references for calibrating the results of new methods. In this methodological issue, the present study aims to evaluate the potential of spectrophotometric and Rock-Eval coupled analysis to describe the Holocene lake and marsh deposits from tropical moist forests. This assessment is carried out on samples taken from two well-documented reference cores. The spectrophotometric analysis provides reproducible colour measurements, which inform about the nature of the main colour-bearing constituents. Coupled with Rock-Eval pyrolysis, this technique can be used to describe lithological changes and identify the probable source of sedimentary organic matter. In the studied cases, this approach identified the facies dominated by detrital terrigenous inputs (‘iron bearing’ signature and high OI values) and those associated with a more abundant primary production (‘chlorophyll’ signature, low OI and high HI), providing a distinction between palustrine and lacustrine dynamics. However, although the facies are comparable, sedimentary dynamics and sediment sources may vary depending on geomorphological and climatic contexts.
Introduction
Numerous studies in West Central Africa help to draw a clearpicture of the evolution of tropical rainforests during the Quaternary and Holocene (e.g. Bonnefille, 2011; Marchant and Hooghiemstra, 2004), especially from marine records (Dupontet al., 2000; Kim et al., 2010; Lézine et al., 2005; Weldeab et al., 2007). However, continental reference sites and continuous series from Central Africa (Maley and Brenac, 1998; Marret et al., 2006) are too scattered to assess the palaeohydrological models recently developed for higher-resolution studies (e.g. Ward et al., 2007). Therefore, recent works have focused on several complementary approaches to study some lacustrine key sites of West Central Africa, such as Ossa (Kossoni and Giresse, 2010; Nguetsop et al., 2010), Nyabessan (Ngomanda et al., 2009; Sangen, 2010), and Kamalété and Nguène (Giresse and Makaya M’voubou, 2010; Ngomanda et al., 2005). In these studies, the analytic methodologies are based on a combination of sedimentological (e.g. grain size, x-ray diffraction), palaeoecological (e.g. pollens, diatoms), and geochemical techniques (e.g. C/N, 13C, 15N) to reconstruct palaeoenvironments and palaeoclimates. However, the routine application of this multidisciplinary approach is limited by the time-consuming procedures of pre-treatments and non-continuous measurements. On the other hand, non-destructive methods exist such as x-ray fluorescence core scanner or Scopix techniques. Such approaches have been proved useful for assessing potential palaeoclimatic records by continuous measurements from sedimentary sequences. Yet, they often require large and expensive equipment.
Spectrophotometric analysis offers probably a good compromise: portable and easy to use, quick high-resolution data acquisition from chromatic properties of sediments. Mainly used for marine and lacustrine investigations (e.g. Debret et al., 2010, 2011; Mix et al., 1995), this method has recently been used to study changes in the composition of Quaternary sediments off the Gabon coasts in order to reconstruct millennial-scale precipitation changes (Itambi et al., 2010).
The present study aims to evaluate the potential of sediment colour to describe the late-Holocene lake and marsh deposits from West Central Africa moist forests. Combined with Rock-Eval analysis of sedimentary organic matter (OM), this assessment is carried out on samples taken from two well-documented reference cores (KAM1 and NGUE1; e.g. Giresse et al., 2009; Ngomanda et al., 2007). Indeed, the studied sites (Kamalété and Nguène Lakes, Gabon) present sufficiently contrasting characteristics to provide reference terms for future studies using the same methodology. In this methodological issue, the results will be compared with conclusions from previous studies, which they may supplement about sources of sedimentary constituents.
Geographical settings and studied cores
Kamalété Lake
Kamalété Lake is a closed and small marshy basin (50–100 m wide, 500–700 m long, ~2 m deep). The basin covers ~0.1 km2 with a water depth that falls to 1 m during the dry season. It is located southeast of Lopé National Park (Ogooué-Ivindo, Gabon; 0°43′S, 11°46′E; 350 m a.s.l.; Figure 1) in a narrow structural depression in the early-Proterozoic formations (Francevillian) composed of mudstones, micaceous and clayey sandstones, feldspathic sandstones, cherts, dolomites and shales (Weber, 1968). The yellow ferrallitic soils have a clay texture to sandy clay and are composed of kaolinite, illite, quartz, goethite, gibbsite, and feldspars (Chatelin, 1966; Collinet and Forget, 1976). Coarse particles (i.e. pebbles) and traces of gullies show that the catchment suffered an intense erosion by runoff. Either side of the lake, steep slopes are marked by landslides of tens of cubic meters and by outcrops of ferruginous crusts. Some hydromorphic soils (gley or pseudo-gley) are visible on the marshy banks of the lake. In the surrounding area, vegetation is characterized by a colonizingforest/savanna mosaic. The lake is surrounded by a heterogeneous vegetation (savannah and colonizing forest) that combines grassy species (Pobeguinea arrecta) and pioneer species (Uapacca guineensis, Aucoumea klaineana). Pioneer species reflect the long-term transition from savannah toward a forest environment. On the banks, a ring of ferns (Gleichenia) and sedges grow randomly in shallow waters. Annual precipitation oscillates around 1500 mm, a low value for Gabon because of the rain shadow effect of the Cristal Mounts and Massif of Chaillu on the western side. However, present-day meteorological values show great inter-annual variability related to variable timing and duration of the dry summer season: minimum rainfall is recorded from mid June to mid September and from mid December to mid January, while the highest is in the other months of the year. Average temperatures are between 20.6 and 30.8°C. They are highest in the rainy season (February–April) and lowest in the dry season (June–August) because the cloud cover reduces insolation.

Map of Gabon showing dominant vegetation, isohyets, and site locations.
The 375 cm long core KAM1 (Figure 2) was taken in the central part of Kamalété Lake (e.g. Giresse et al., 2009; Ngomandaet al., 2007). From the base to 149 cm, sedimentation began with beige mud. Abundant siderite aggregates and organic and silty laminae several millimetres thick were noted in this lithological unit. The upper 149 cm thick interval is a grey to grey-green mud with lower abundance of sand and a darker colour. Lamination frequency changes in different sections of the core: numerous laminations were observed in the beige mud, while only few laminations were observed in the grey-green mud.
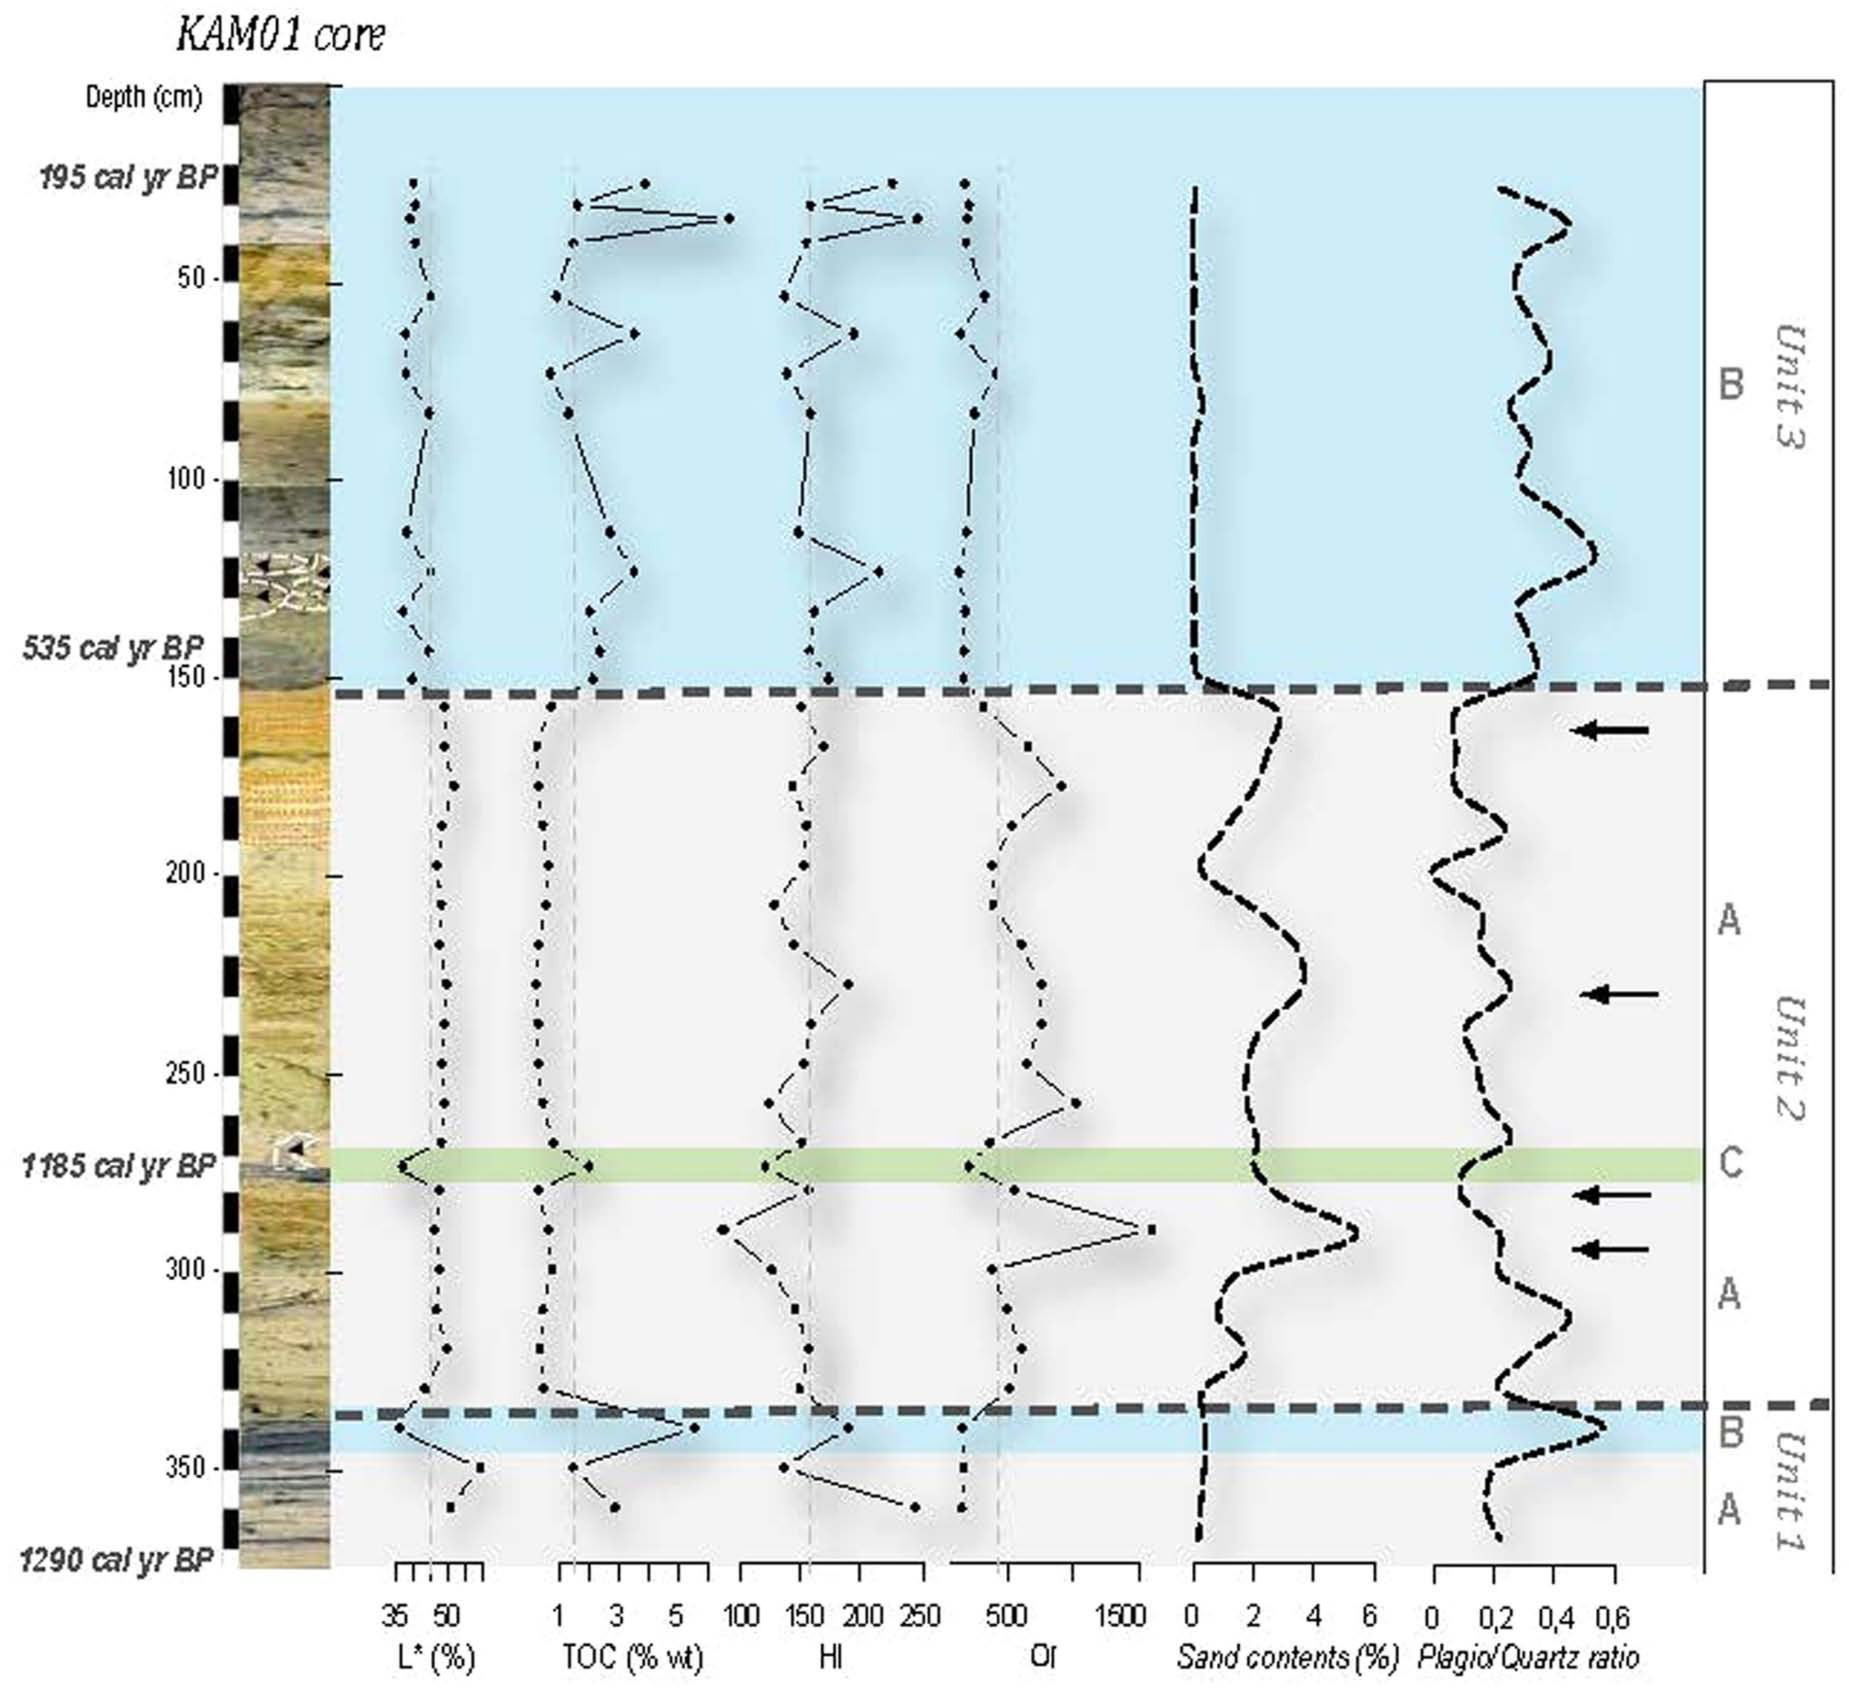
Downcore variations of reflectance and classical PyRE parameters showing main lithological units and some compositional changes in the KAM1 core. Coloured bands correspond to spectral signatures (A, B, and C) defined from FDS (see text and Figure 5).
Nguène Lake
Nguène Lake is located on the southern slopes of the Cristal Mounts (Moyen-Ogooué, Gabon; 0°12′S, 10°28′E; 20 m a.s.l.; Figure 1). It was primarily a fluvial depression, today partly isolated from the Abanga River. The shallow lake (~3–5 m deep) covers c. 3 km2 during the dry season (< 2 m deep). The swampy shore is largely flooded during the rainy season. In the southeastern part there is a seasonal communication with the river as a water supply or drain.
The basin is located in the clayey Permian–Carboniferous formations between the Lambaréné horst and the Precambrian basement. Most rocks that outcrop along the Abanga River are part of sandy-clayey Permo-Carboniferous series of N’khom and Agula (Bassot, 1988). Common soils are ferrallitic soils developed on sandstones, providing a sandy clayey texture and composed of kaolinite, illite (scarce), quartz, goethite and feldspars (Collinet and Martin, 1973). The area is covered by a dense evergreen rainforest characteristic of the regional climate. The catchment area (~6 km2) is colonized by a swamp forest dominated by Anthostema aubryanum (Euphorbiaceae), Uapacca spp. (with highly developed aerial roots) and Alstonia congensis (Apocynaceae). Near the banks (especially in the northwest part), an abundance of Cyperus papyrus (Cyperaceae) shows the recent evolution of this swampy area. Average rainfall is ~2150 mm (Collinet and Martin, 1973) with a maximum between March and May (long rainy season) and minimum between June and August (long dry season). Temperatures (around 26°C) are highest during the rainy season and lowest during the dry season.
The 415 cm long core NGUE1 (Figure 3) was taken from the southern part, 200 m from the western bank (e.g. Giresse et al., 2009; Ngomanda et al., 2007). From the base to 152 cm, sediments began with light to dark grey hydromorphic deposits, including some sandy layers and bioturbation structures. This grey mud is similar to gley forming on the current banks. The upper 152 cm show a dark clayey mud with conspicuous dark and light grey alternations. Crystals of siderite and vivianite accompany the clayey and organic accumulations. However, these iron concretions are more abundant in the lowermost deposits.

Downcore variations of reflectance and classical PyRE parameters showing main lithological units and some compositional changes in the NGUE1 core. Coloured bands correspond to spectral signatures (A, B, C and D) defined from FDS (see text and Figure 6).
Methodology
The present work aims to highlight the complementarity of two techniques often used separately: spectrophotometry, which provides continuous measurements of the sediment colour, and Rock-Eval pyrolysis, which provides qualitative and quantitative data on the sedimentary organic matter. Both techniques are detailed below. In the discussion section, we show the interest of these two methods by comparing the results obtained here with previously published results including mineralogical and palynological data. For details of these conventional methods, lithological description and chronological discussion, we refer to these previous articles (Giresse and Makaya M’voubou, 2010; Giresse et al., 2009; Ngomanda et al., 2005, 2007).
Spectrophometry: Visible reflectance measurements
Analyses were carried out using a Minolta CM 2600d, commonly used for quantitative measurements of soil and sediment colour (e.g. Croft and Pye, 2004). This instrument provides reflectance measurements in the visible wavelengths (400 and 700 nm). We used specular component excluded (SCE) reflectance to eliminate any bias induced by specular reflection. The illuminant was D65, corresponding to the average daylight at a temperature of 6504 K. Measurements were taken with a 8 mm aperture.
For binary mixtures of contrasted components (i.e. dark/light), CIELab standard parameters (i.e. L*, a*, and b*) can eventually be used for palaeoenvironmental or palaeoclimatic implications (Debret et al., 2006; Mix et al., 1992). For more complex mixtures, however, other parameters have to be used and various approaches have been proposed (e.g. first derivative methods, frequencies gathering, factor analyses) to characterize the sedimentary facies (Balsam and Beeson, 2003; Ji et al., 2005) or quantify constituents such as carbonates, goethite, hematite, or chlorite (e.g. Damuth and Balsam, 2003; Ortiz et al., 2009; Zhang et al., 2007; see Debret et al., 2011, for a review).
In this work, we used two complementary tools (1) L* as a measure of lightness ranging from 0 (black) to 100 (white) to establish a lithological division, and (2) and the first derivative spectra (FDS) to analyse the composition of sediments, and to describe the changes in sedimentary dynamics.
Bulk geochemical analyses: Rock-Eval pyrolysis
The Rock-Eval pyrolysis technique was designed to screen automatically, without any preliminary treatment, large sets of rock and sediment samples (Espitalié et al., 1985). Initially designed for petroleum applications, this routine method is now used for a large variety of materials, e.g. soils and recent sediments(e.g. Di-Giovanni et al., 1998; Disnar et al., 2003; Hetényi et al., 2005; Marchand et al., 2003; Meyers and Lallier-Vergès, 1999; Patience et al., 1996; Sanei et al., 2005; Sebag et al., 2006;Sifeddine et al., 1995).
The sampling interval was approximately 10 cm for lithologic logging for the KAM1 and NGUE1 cores, but the intervals were shortened depending on facies thickness. Analysis was carried out with 100 mg of powder sample using a ‘Turbo’ Rock-Eval 6 pyrolyzer manufactured by Vinci Technologies. Standard parameters, namely, total organic carbon (TOC), hydrogen index (HI), and oxygen index (OI), were calculated by integrating the amounts of hydrocarbon compounds (HC), CO, and CO2 produced during thermal cracking of the OM, between well-defined temperature limits (Behar et al., 2001; Espitalié et al., 1985; Lafargue et al., 1998). TOC (in wt%) is the sum of all the organic carbon moieties (HC, CO, and CO2). TpS2 (in °C) is the corrected temperature of the oven, which corresponds to the optimum HC release. HI(in mg HC/g TOC) corresponds to the quantity of HC released relative to TOC, and is correlated to the H/C ratio. OI (in mg O2/g TOC) corresponds to the quantity of oxygen released as CO and CO2, relative to TOC, and is correlated to the O/C ratio. These parameters were defined to study mature OM from sedimentary rocks (e.g. Disnar, 1994), but previous works have shownthat they could be used to characterize immature OM(e.g. Disnar et al., 2003).
The previous works (Giresse and Makaya M’voubou, 2010; Giresse et al., 2009) mention the presence of siderite in studied cores. The analysis of deposits rich in siderite by Rock-Eval has some problems principally in the evaluation of the Oxygen Index because this mineral starts to decompose during the pyrolysis when the temperature approaches 485–520°C (Lafargue et al., 1998). For this reason, we checked the possible influence of this mineral through (1) a study of S3 signals that measure the fluxes of CO2 and CO during pyrolysis and (2) a comparison between the total C contents and the TOC. In addition, Figure 4 presents a comparison of S2 (i.e. hydrocarbon compounds produced by thermal cracking of OM) and S3CO2 (i.e. CO2 produced by thermal cracking of OM and siderite) for Kamalete samples. The correlation between the two parameters underlines the dominance of OM-derived compared with mineral-derived signal. In addition, the similarities with free-siderite soil samples collected in the studied region shows the very weak possible influence of this mineral on the parameters and S3CO S3CO2 measured (and hence the IO). We conclude that major changes in the IO are primarily related to sedimentary organic matter and not to the mineralogical composition (i.e. relative abundance of siderite).

Correlation between S2 (i.e. hydrocarbon compounds released during thermal cracking of OM) and S3CO2 (i.e. CO2 released during thermal cracking of OM and mineral constituents as siderite) measurements from KAM1 core and soil samples.
Results
Reflectance (L*) and first derivated spectra (FDS)
Coupling L* measurements and FDS analyses can be used to draw quantitative limits within the various lithological units, which were determined visually at the core opening.
KAM1 core
The L* variations are used to define three units (Figure 2), which correspond to the main lithologic units described by Giresse et al. (2009). Unit 1 (from the base of clayey beige deposits to 350 cm) presents the highest L* values (>50%), followed by a decrease around 335 cm (<35%) reflecting a darker colour in this organic-rich lithological boundary. Unit 2 (upper part of clayey beige deposits from 335 to 150 cm) is characterized by very stable L* values (around 48%). Only the dark layer located at 270 cm is highlighted by very low values (<35%). Unit 3 is characterised by lower and more variable values (from 44 to 40%), following a general decreasing trend reflecting a gradual darkening of the upper silty grey deposits (from 150 to the top).
As shown by Balsam et al. (Balsam and Beeson 2003; Balsam and Deaton, 1991, 1996), FDS analysis can distinguish characteristic spectral signatures. This approach identifies three distinct signatures in core KAM1 (Figure 5). Two very sharp peaks, centred respectively at 435 and 545 nm, characterize the first spectral signature A (Figure 5A). The second signature B mainly differs from the previous one by (1) a close amplitude of the two peaks at 435 and 545 nm and (2) the presence of an additional broad peak centred around 675 nm (Figure 5B). Peaks at 435 and 545 nm are also present on the third spectral signature C, which differs from the previous signatures by an ascending trend in seesaw pattern above 600 nm (Figure 5C). Finally, the in-depth representation of FDS defines the lithological units previously established by Makaya M’voubou (2005). The lower clayed beige deposits (units 1 and 2) have a dominant signature A, except the darkest layers around 335 and 270 cm, which respectively have the signatures B and C; the upper silty grey deposits (unit 3) present a spectral signature B (Figure 5).

In-depth variations of first derivated spectra showing some compositional changes by spectrocolorimetric analysis of the KAM1 core. A, B, and C: characteristic FDS of each spectral signature (see text).
NGUE1 core
Here also L* variations (Figure 3) delineate the lithological limits described by Giresse et al. (2009). Unit 1 (from the bottom of the lower gley to 370 cm) is marked by a gradual decline of L* values (from 50 to 46%) until the darker layer highlighted by very low L* values (35 to 23%) between 370 and 340 cm. Unit 2 (upper part of dark gley from 330 to 140 cm) is characterized by a variable lightness ranging from 30 to 52%, which identifies four subunits: 330 to 290 cm (40–43%), 280 to 230 cm (31–40%), 230 to 190 cm (40–45%), and 190 to 155 cm (>50%). The bioturbated layer (150–140 cm) ending unit 2 is marked by an L* decrease (~40%). Unit 3, which corresponds to the upper dark deposits (from 135 cm to the top of the core), is characterized by low L* values between 33 and 39%.
The FDS analysis identifies four distinct spectral signatures in core NGUE1 (Figure 6). Two very sharp peaks, respectively centred at 425 and 535 nm, characterize the spectral signature A (Figure 6A). The second signature B is mainly characterized by a sharp peak around 675 nm (Figure 6B). In some spectra, this peak is combined with two other weak peaks more or less visible to 435 and 545 nm. The third signature C is characterized by a flat spectrum, marked by a strong increase after 600 nm (Figure 6C). The fourth signature D (Figure 6D) differs from signature A by (1) the presence of twin peaks at 435 and 535 nm but with rather close height and (2) a declining trend from 360 nm to 700 nm. Finally, each lithological unit is dominated by one of these four signatures (Figure 6) and is not a result of a complex mixture of the four end-members: D is dominant in the bottom of the core (unit 1), C in the boundary dark layer, A and B in the intermediate light gley (unit 2), and B in the upper dark deposits (unit 3).
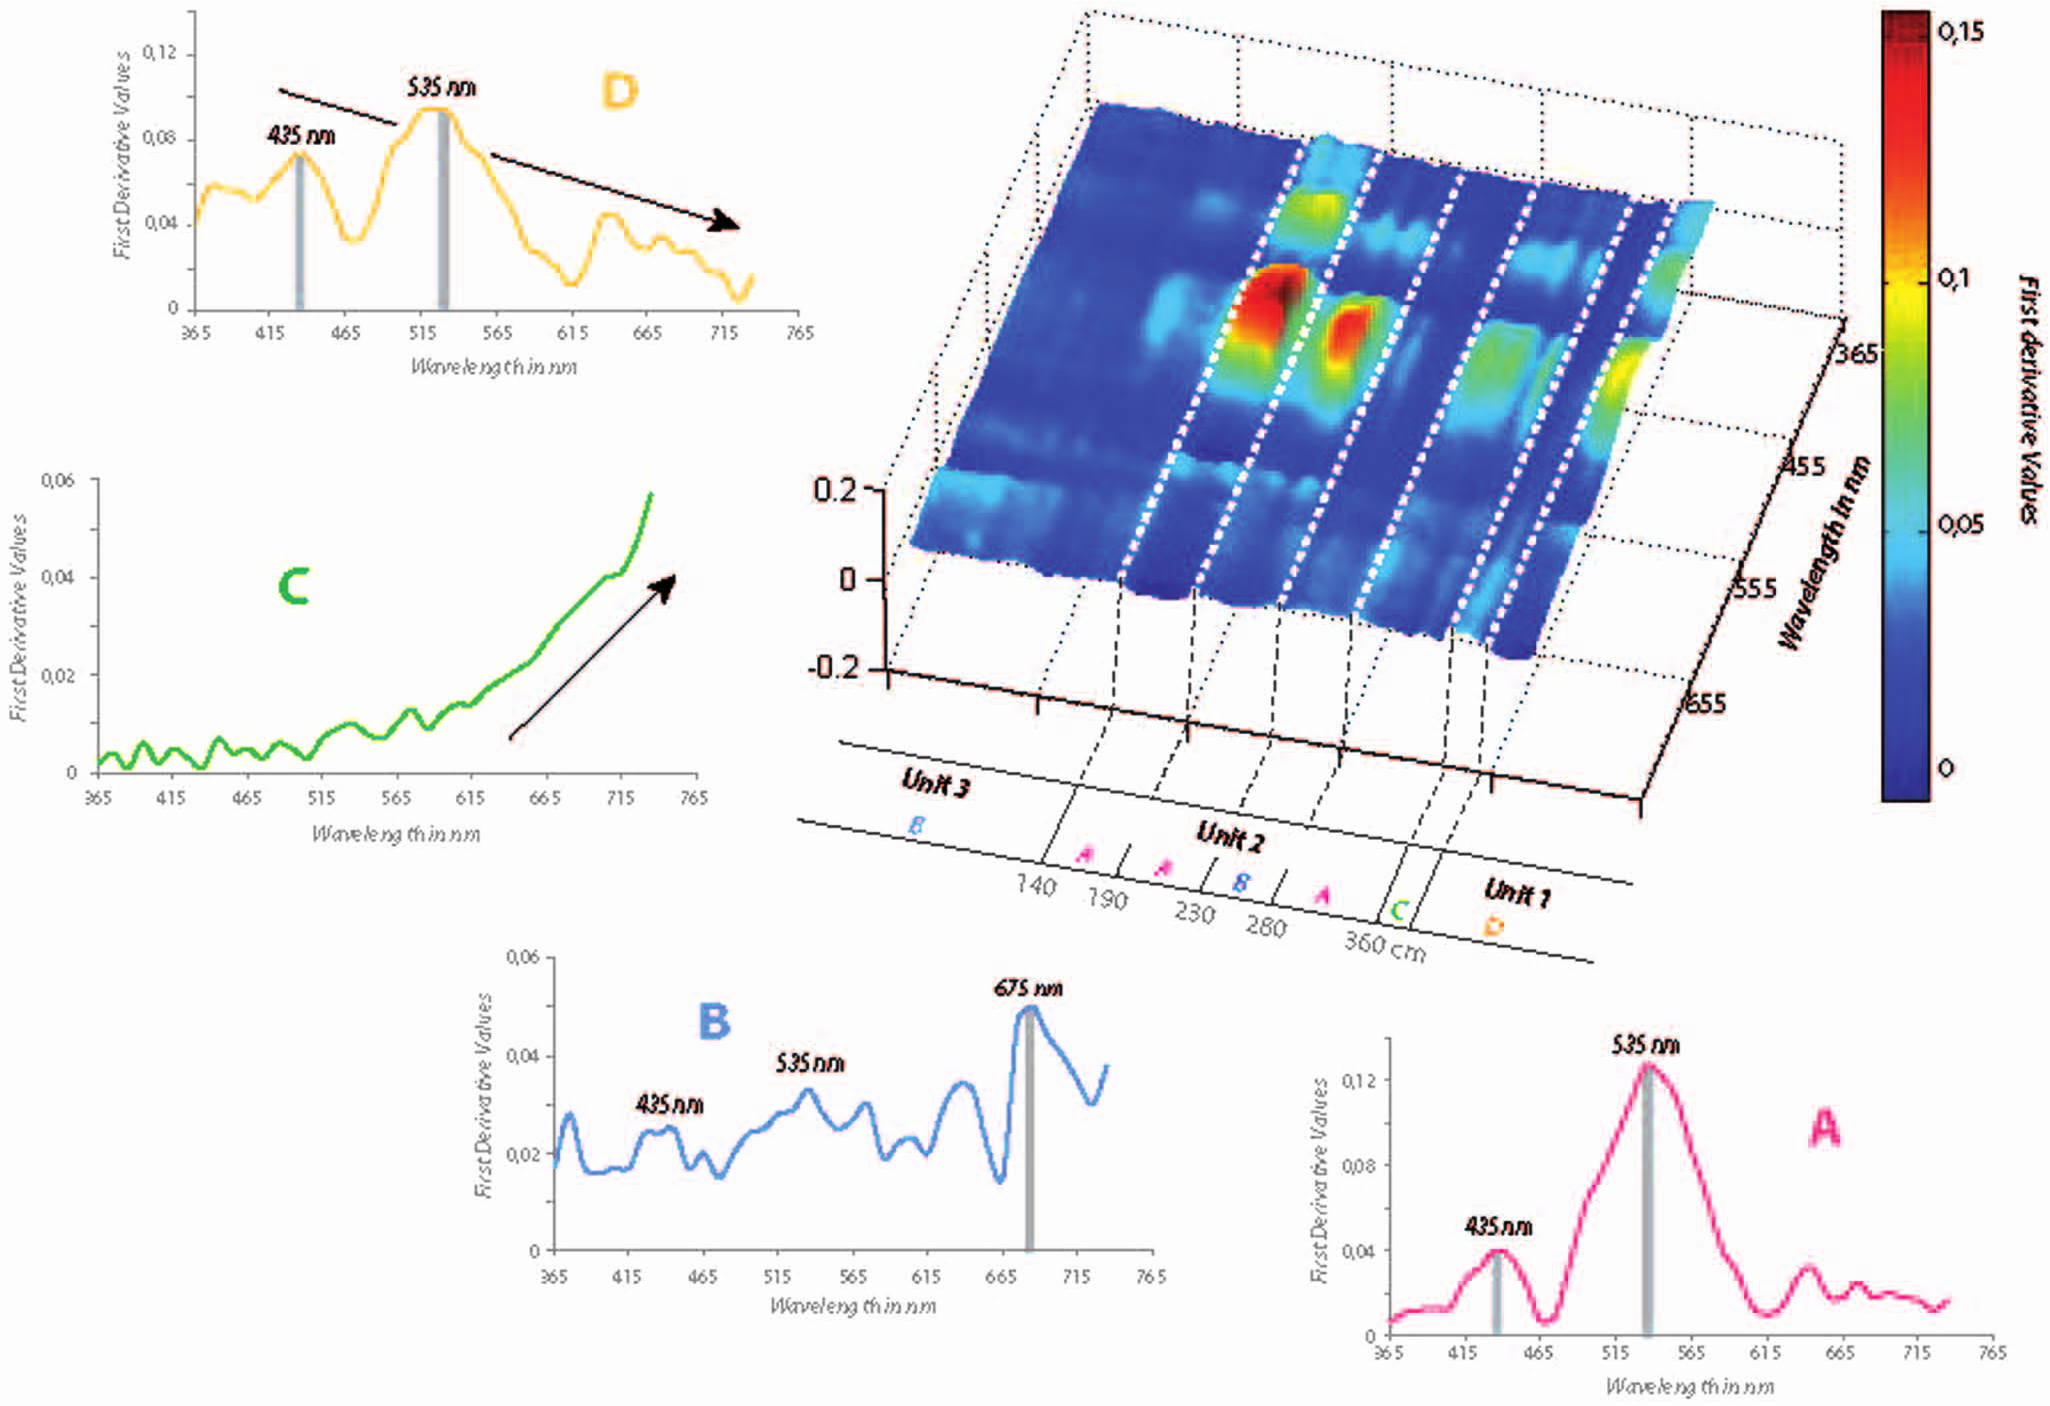
In-depth variations of first derivated spectra showing some compositional changes by spectrocolorimetric analysis of the NGUE1 core. A, B, C and D: characteristic FDS of each spectral signature (see text).
Characterization of sedimentary OM
By combining the classical Rock-Eval parameters (TOC, Tmax, HI, OI), it is possible to distinguish OM geochemical signatures (Figure 7) related to main lithological changes and to established subdivisions (Figures 2 and 3).
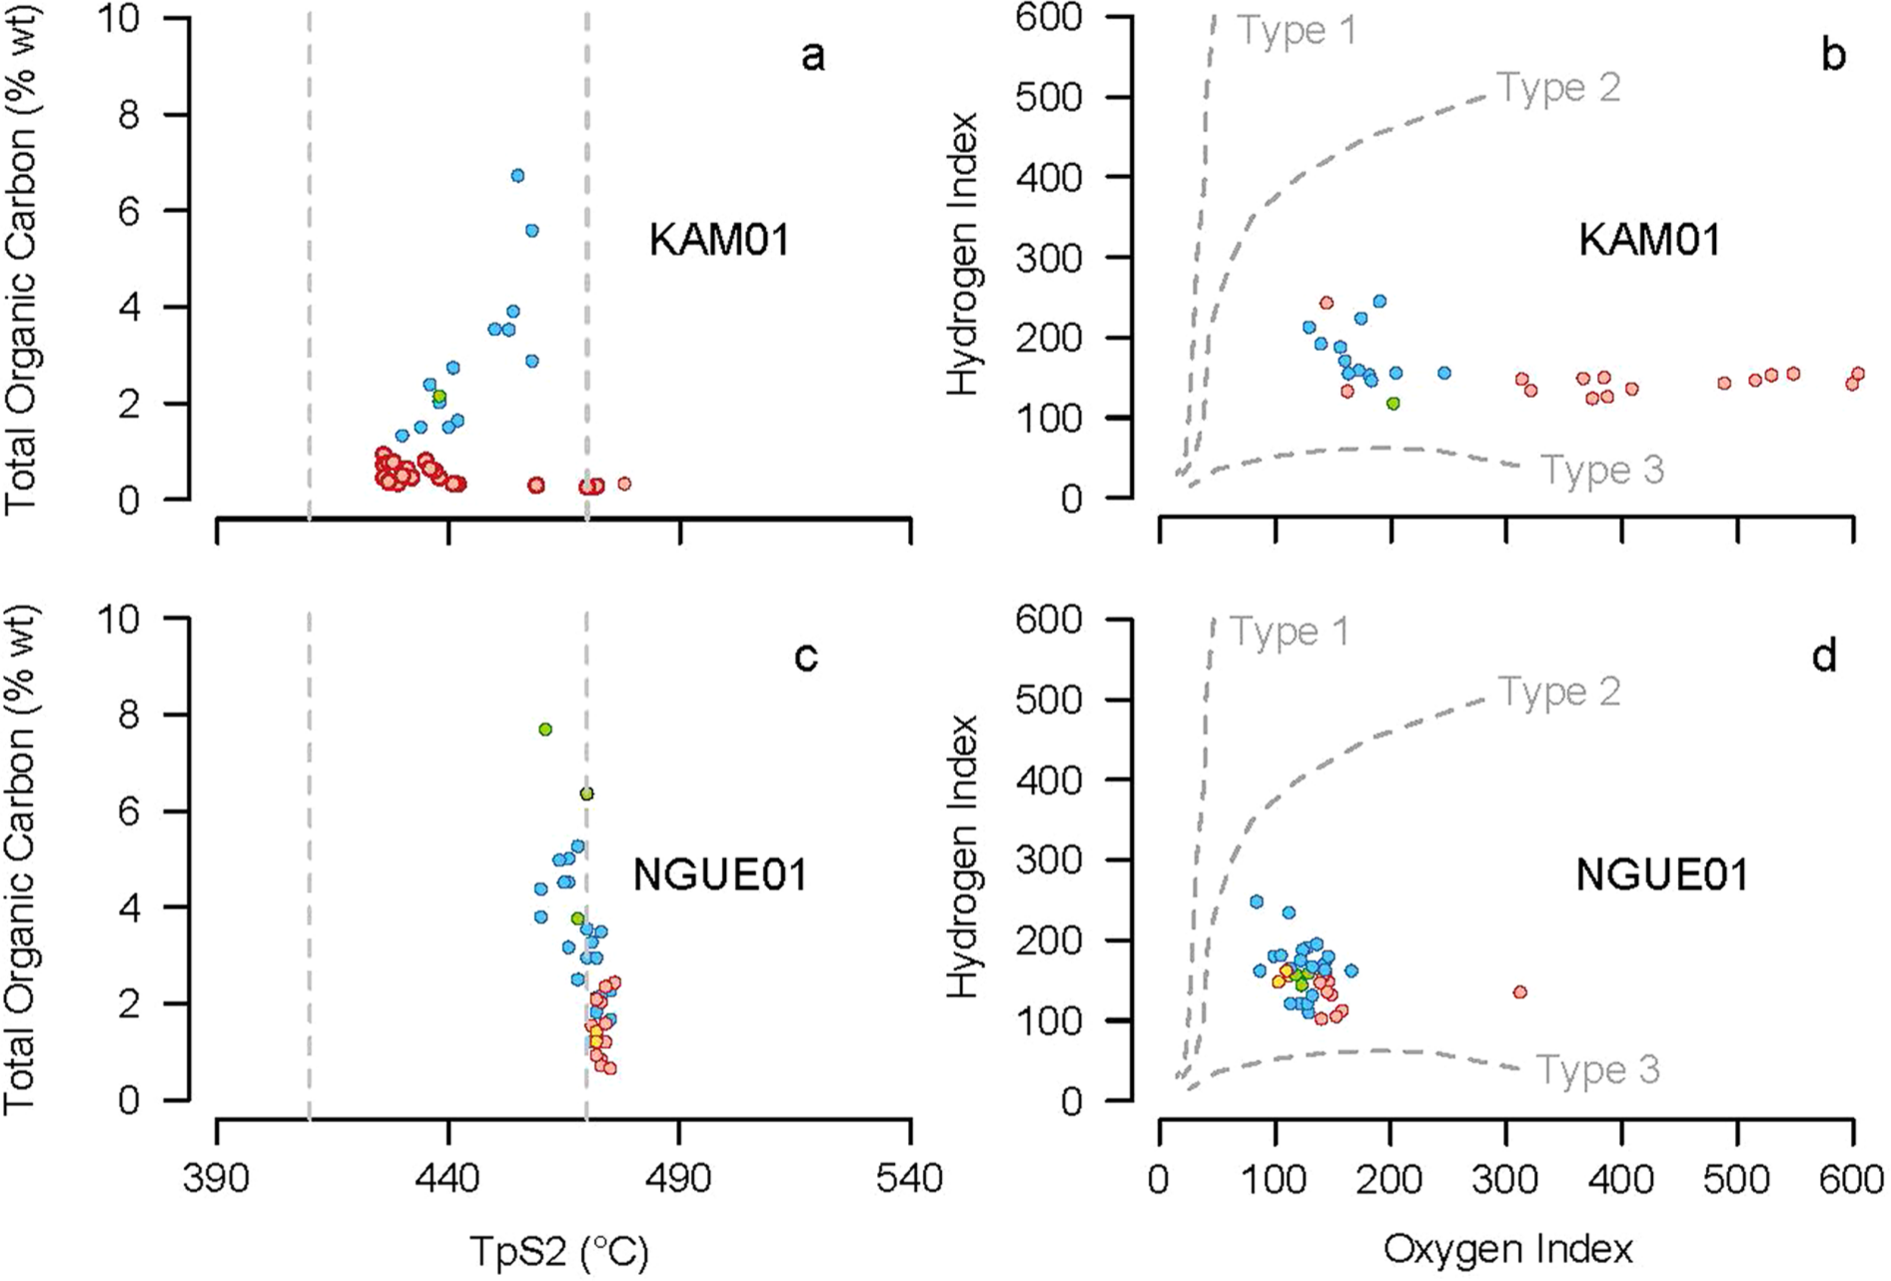
Characterization of sedimentary OM from Rock-Eval parameters using two diagrams (a and c: TOCvsTpS2; b and d: HIvsOI) for comparisons between lithological units of the KAM1 and NGUE1 cores. Colours of points correspond to spectral signatures defined from FDS.
KAM1 core
As a whole TOC and Tmax, whose values range respectively from 0.3 to 6.7%, and from 386 to 438°C, respectively (Figure 7a), allow us to distinguish (1) mineral OM-poor (TOC <1%, low or high Tmax), (2) mineral OM-rich (2% < TOC < 4%, with higher Tmax), and (3) organic facies (TOC >5%, high Tmax). This OM-base typology corresponds to lithological subdivision: e.g. lower clayey deposits (unit 2) present OM-poor facies, whereas bottom layers (unit 1) and upper silty deposits (unit 3) are dominated by OM-rich facies. Organic facies are related to two layers located around 330 and 30 cm (Figure 2).
Two sample groups can be distinguished through HI and OI values (Figure 7b). The first group corresponds to units 1 and 3, which presents a homogeneous OM signature typified by low HI values (from 133 to 245 HC/g Corg), and very low OI values (from 128 to 230 mg O2/g Corg). The second group, which corresponds to unit 2, presents a distinct signature marked by very low HI values (from 118 to 187 mg HC /g Corg), and variable OI values (from 200 to 1500 mg O2/g Corg).
NGUE1 core
TOC and Tmax values, which range from 0.6 to 6.4%, and from 420 to 435°C, respectively (Figure 7c), distinguish OM-poor (TOC <2.5%, constant Tmax up to 430°C), OM-rich (2.5% < TOC < 6%, Tmax around 430 or 425°C), and organic facies (TOC >5%, Tmax around 425°C). This typology corresponds to lithological subdivisions (Figure 3).
Low HI and OI values (from 102 to 195 mg HC/g Corg, and from 84 to 166 mg O2/g Corg, respectively) define a homogenous signature in the HI versus OI diagram (Figure 7d). Three samples present different signatures: two of these ones (at 135 and 125 cm) have a higher HI values (c. 240 mg HC/g Corg), and the third one (at 227 cm) a higher OI value (311 mg O2/g Corg). In-depth HI variations allow us the identification of significant differences related to some lithological changes (Figure 3). Briefly, HI values are (1) stable around 155 mg HC/g Corg below 300 cm; (2) comprised from 102 to 132 mg HC/g Corg between 300 and 230 cm; (3) vary from 105 to 162 mg HC/g Corg, between 230 and 150 cm; and finally (4) remain comprised between 149 and 248 mg HC/g Corg in the unit 3 above 150 cm.
Interpretation
Previous studies have highlighted the possibility of using spectrophotometric measurements to determine qualitative changes in sediment composition (e.g. Balsam and Deaton, 1996; Debretet al., 2011; Itambi et al., 2010). In this way, the FDS are often used to determine some main sedimentary constituents (Balsam and Deaton, 1991; Barranco et al., 1989; Deaton and Balsam, 1991). Indeed, various studies have shown that some sedimentary constituents have distinctive spectral signatures identified by the position of first derivative peaks, e.g. 445 and 525 nm for iron oxyhydroxides such as goethite, and 555, 565, and 575 nm for iron oxides such as hematite (Barranco et al., 1989), or from 605 to 695 nm for organic compounds, and more precisely at 675 nm for α-chlorophyll and some byproducts (Wolfe et al., 2006). Here, we used these characteristic FDS peaks to determine the nature of main sedimentary constituents, and thus to define distinct spectrophotometric facies related to changes in sedimentary dynamics.
In the same way, numerous works use Rock-Eval pyrolysis to analyse the bulk composition of soil and sedimentary OM (e.g. Meyers and Lallier-Vergès, 1999; Sebag et al., 2006). Usually, the standard parameters (TOC, HI, OI) can be used to evaluate major stages of the OM transformations in soils and sediments (mineralization, humification: Disnar et al., 2003). In addition to distinguishing terrestrial and aquatic OM, HI and OI can be used to determine the characteristic signatures of plant litter, humic horizons, and deepest organo-mineral layers(Disnar et al., 2003). Here, we use these previous studies to analyse the compositional changes of sedimentary OM in each spectrophotometric facies.
Kamalété Lake
The results from KAM1 samples show that some changes recorded by L* and FDS document changes in sedimentary dynamics. Spectra analyses (Figures 5 and 6) show that typical markers of iron oxides (i.e. 435–545 twin peaks) are present on all spectra. This feature reflects the ubiquity of iron-bearing constituents in the KAM1 deposits, which can be related to mineral terrigenous supplies from the catchment area. This first point is consistent with the steep slopes and colluvium mechanisms that characterize the lake watershed. In addition, our results are consistent with previous palaeoenvironmental reconstructions proposed by Ngomanda et al., (2005). For example, the base of the sediment core corresponds to a savannah-dominated environment dated around 1300 yr BP. In this context, the terrigenous detrital contributions are logically produced from the soil surficial layers, rich in iron oxides (A signature) and containing a moderately degraded OM (low OI). Between 370 and 335 cm, the pollen assemblages show an expansion of forest environments, probably in connection with wetter conditions (near the present) between 1300 and 1200 yr BP (Ngomanda et al., 2005). In this context, the first dark layer (around 335 cm) corresponds to a Cyperaceae peak (Ngomanda et al., 2005), which can be related to a greater contribution of autochthonous primary production highlighted by the ‘chorophyll’ specific marker (i.e. 675 peak in signature B; Debret et al., 2006; Michelluti et al., 2010; Wolfe et al., 2006). Above this organic level, an abrupt increase in the Pteridophytes percentage (c. 70%) suggests significant lake-level decline(Ngomanda et al., 2005). This change is marked at the base of unit 2 by an OM-poor facies dominated by ‘iron oxides’ markers(signature A). This back-to-a-terrigenous-clastic sedimentation coincided with a period with maximum opening of the forest canopy (Ngomanda et al., 2005). The canopy opening combined with greater seasonal contrasts could then explain more intense erosion and transfer processes in the watershed. Geochemical data will complete this picture by providing information on the sources of sedimentary OM (Figures 2, 3 and 7). Indeed, high OI values (>300 mg O2/g Corg) indicate a strongly altered OM (Copard et al., 2006), quite comparable with samples from deep soil horizons (Disnar et al., 2003). Note that the incoherent OI value (>1500 g O2/g Corg at 280 cm) corresponds to a maximum contribution of sands and a peak in charcoal abundance (Giresse et al., 2009). It also coincides with a peak of Cyperaceae pollens (Ngomandaet al., 2005). This level can be related to a paroxysm of detritism, and may result from a seasonal high contrast, favouring runoff and mass wasting on the slopes covered with savanna. The second dark layer (around 270 cm) presents a combination between ‘iron oxides’ markers and a specific feature of altered OM (increasing trend in signature C), which can be related to terrestrial peaty deposits and some oxidized coal samples probably linked to humic substance (Debret et al., 2011). In addition, low HI and OI values confirm the terrestrial OM origin. This peat layer could result from the partial filling or from a temporary drying up of the basin, around 1200 yr BP. Ngomanda et al., (2005) note that the regression of mature forest suggests longer and/or recurring episodes of aridity from c. 1240 until 550 cal. BP. They suggest that the dry season was more prolonged and more severe than it is today. The top of unit 2 corresponds to the installation of seasonal contrasts in a drier general context. Ngomanda et al., (2005) point to a high abundance of Pteridophyte spores, which may indicate low lake-level stabilization. In addition, Giresse et al., (2009) note that the occurrence of siderite concretions in these layers denotes anoxic conditions caused by the reduction of the water input into the basin. These climatic changes are documented across equatorial Africa; they are characterized by a succession of fluctuations in the regional rainfall regime, which may be explained by shifts in the mean latitude of the intertropical convergence zone, as proposed by Nguetsop et al., (2004).
About 150 cm, the transition to unit 3 is marked by a typical combination of ‘iron oxides’ and ‘chlorophyll’ markers (signature B), with very low OI values (<200 mg O2/g Corg), comparable with those from surface samples of savanna soils, but with some significantly higher HI (>200 mg HC/g Corg), which are quite consistent with greater autochthonous contributions (Figure 7). As revealed by Ngomanda et al., (2005), the darker units 3 is an OM-rich facies that may be related to a more humid climate, entailing a lake-level rise and progressive expansion of semi-evergreen rainforest after 550 yr BP.
Thus, sedimentological and palaeoecological proxies (Giresse et al., 2009; Ngomanda et al., 2005) confirm our new results. Notably, Ngomanda et al., (2007) observe that, when the lake level is high, the δ13C signal records the local vegetation, often dominated by C3 Cyperaceae, as well as the C3 plants colonizing the lake basin. Conversely, when the lake level shallows, the δ13C signal records the isotopic composition of the local C4 plants (Pteridophytes and Poaceae).
Nguène Lake
It is important to note that the sedimentation in Nguène Lake is very different from that in the Kamalété basin. Indeed, the sedimentary dynamics in Nguène Lake are directly controlled by hydrodynamic changes of River Abanga (Giresse et al., 2009), and are therefore only little influenced by the vegetation surrounding the lake. In addition, the morphology of the watershed is not conducive to runoff and erosion as it is in Kamalété.
FDS analysis shows facies changes that we can try to relate to changes in sediment dynamics. It should be noted that the ‘iron oxides’ twin peaks are present through the whole of the core, except in the organic layer (about 360 cm, signature C; Figure 6).
The bottom deposits (unit 1; from 413 to 375 cm) present FDS characterized by a combination of ‘iron oxide’ markers and a specific feature of limestones (decreasing trend in signature D; Debret et al., 2011; Itambi et al., 2010). These iron deposits could be related to the presence of siderite and vivianite crystals already described by mineralogical analyses (Giresse et al., 2009). These minerals result from anoxic conditions induced by a gradual confinement of the basin around 4600 yr BP. These pieces of information are consistent with the reconstructions proposed by Ngomanda et al., (2007) who noted that dense stands of mature rainforest occupied the catchment area during the mid Holocene. The increase and progressive closing of forest cover would have caused a drastic decrease in runoff, reducing water flows from the lake watershed and thus, terrigenous proximal supplies. Accordingly, Giresse et al., (2009) pointed out that the detrital sedimentation was limited to contributions of the river Abanga between 4600 and 2460 cal. yr BP. This confinement trend is highlighted by increasing TOC (Figure 3), which prefigures the installation of a ‘peaty marsh’ (signature C of the organic layer around 360 cm). This episode coincides with a regional environmental change as revealed by Ngomanda et al. (2007), who noted that from 4100 yr BP surrounding evergreen rainforest was progressively replaced by semi-deciduous rainforest.
The base of unit 2 (from 350 to 280 cm) presents a spectral signature dominated by ‘iron oxides’ twin peaks (signature A) and OM-poor facies. This new facies reflects major changes that occurred in both the marsh and rainforest pollen signal. Indeed, Ngomanda et al., (2007) noted that pioneering plants progressively replaced mature rainforests between 3200 and 2400 yr BP. This trend indicates openings in the closed canopy forest surrounding the lake basin. That might explain an accentuation of runoff and a more detrital sedimentation, and the higher sand contents measured by Giresse et al. (2009; Figure 3). Nevertheless, the absence of changes in geochemical properties (i.e. HI and OI) shows that the OM sources (surfical soil layers) have not strongly varied during these times suggesting that the river is still the main contributor.
The overlying layers (from 280 to 230 cm) seem to reflect a more radical change marked by the presence of the ‘chlorophyll’ fingerprint (peak around 675 nm in signature B; Figure 6). This spectrophotometric fingerprint shows an autochthonous primary production, but this aquatic contribution can hide an allochthonous altered OM signature because of the low detection level of the ‘chlorophyll’ fingerprint by spectrophotometry (<0.01%, Wolfe et al., 2006). Indeed, Rock-Eval analyses (i.e. significant low HI, <150 mg HC/g Corg; Figure 3) shows the terrestrial origin of dominant OM fraction. Ngomanda et al. (2007) suggested that lake levels were lower after 2400 yr BP, which would explain the higher contribution of terrestrial plants, the decrease in terrigenous detrital sedimentation, and the gradual increase of sand contents (Giresse et al., 2009; Figure 3).
A change in spectrophometric facies (around 240 cm) is highlighted by the highest OI value (>300 mg O2/g Corg), which is consistent with more intense weathering and erosion processes in the catchment area. This layer marks the change toward the upper unit 2 (from 230 to 150 cm), and presents the same colour properties as the lower part (‘iron oxides’ signature A). These detrital facies, however, are distinguished by the lack of sand, which may indicate that the sources have changed, or that the lake basin is protected by coarser inputs. Ngomanda et al. (2007) note that maximal regression of the mature evergreen rainforest occurred between 2000 and 1450 yr BP.
Unit 3 corresponds to the installation of lacustrine conditions, with significant autochthonous primary production (‘chlorophyll’ in signature B, high HI values). This hypothesis is confirmed by pollen analyses, which indicate that the basin became a proper lake, but was marked by recurring seasonal fluctuations. Thus, the pollen assemblages suggest that an open forest occupied the catchment and the mean water level of the lake was lower prior to 1450 yr BP (Ngomanda et al., 2007). The same authors indicate that the marsh expanded in response to the increasingly long duration of lower lake levels from c. 1450 to 1250 cal. yr BP. Ngomanda et al. (2007) note the renewed spread of dense closed canopy rainforest in the catchment and an expansion of swamp forest and probably higher water levels in the lake basin after 950 yr BP.
From 950 yr BP, lacustrine conditions result not only from rainfall (with a consequential increase of canopy), but also from changes in the Abanga hydrodynamics, which then feeds the lake with a suspended sedimentary load. Note here that Abanga is very high compared with the lake. There is therefore no possible drain for the lake into the Abanga river (Giresse et al., 2009).
FDS analysis, OM properties, and palaeoenvironmental proxies
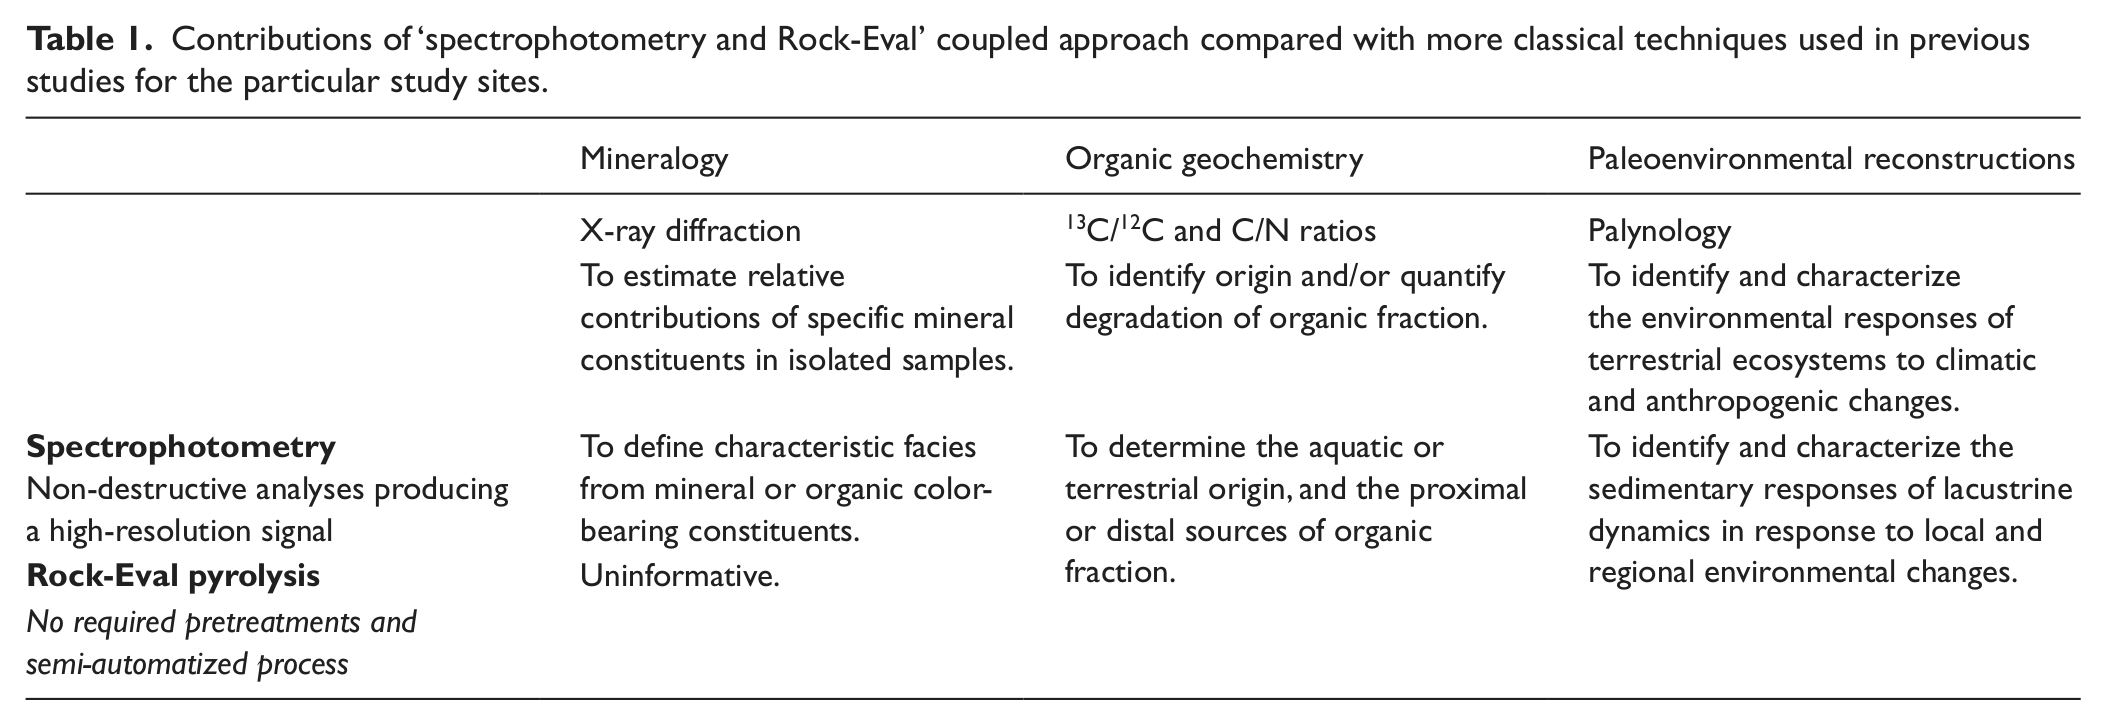
In recent years, Nguène Lake and Kamalété Lake have been studied repeatedly, providing comprehensive reconstructions of environmental changes over the last millennia (Giresse and Makaya M’voubou, 2010; Giresse et al., 2009; Ngomanda et al., 2005, 2007). Thus, we do not dwell on probable or even proven causes of these changes, referring to the previous studies. In this way, Table 1 synthesises additional information gained for the particular study sites. However, this work is the first combination of Rock-Eval pyrolysis and spectrophotometry applied to the study the Holocene lake deposits from tropical moist forests. In this methodological perspective, the two lakes considered have sufficient commonalities and differences to provide a controlled assessment of the methods used and the various reference terms for future studies.
Contributions of ‘spectrophotometry and Rock-Eval’ coupled approach compared with more classical techniques used in previous studies for the particular study sites.
In the studied cases, this double approach allowed us identifing the facies dominated by detrital terrigenous inputs (‘iron oxides’ signature and high OI values) and those associated with a more abundant primary OM production (‘chlorophyll’ signature, low OI and high HI), providing a distinction between palustrine and lacustrine dynamics. However, although the facies are comparable, sedimentary dynamics and sediment sources may vary depending on geomorphological and climatic contexts. Thus, the lower detrital sequence of Kamalété Lake corresponds to the intense processes of erosion and colluviation on the slopes of the very narrow watershed (Giresse et al., 2009). On the other hand, Nguène Lake is located in a different context, surrounded by forested lowlands but frequently supplied by Abanga River waters. Here, the detrital sequence is interpreted as resulting from fluvial inputs derived from the upstream part of the Abanga River. During these times, lake-level fluctuations could be related to regional climate changes. Thus, the first OM change (‘chlorophyll’ signature but low HI), dated around 2400 cal. yr BP, could have been caused by a diminution in the mean rainfall and, mainly in the sedimentary inputs from river overflow, inducing a relative increase of terrigenous supplies. Inversely, the upper lacustrine sequence (‘chlorophyll’ signature, high HI) would be related to increasing rainfall and more frequent Abanga River floods since 1900 cal. yr BP.
In addition, this comprehensive approach also distinguishes between OM-rich facies from terrestrial origin and those related to accumulation of aquatic OM, providing general information about the sources of sedimentary OM. Thus, a specific signature of altered terrestrial OM (‘oxidized OM’ in signature C, low HI and OI) should reflect the installation of swamp and/or anoxic conditions before 2700 cal. yr BP in the Nguène basin, and around 1180 cal. yr BP in the Kamalété basin. On the other hand, for more details about this sedimentary OM, Rock-Eval pyrolysis provides bulk geochemical indices, which can be used to track the soil horizon sources of terrigenous OM in detrital swamp (e.g. OI variations in KAM1 core), or to draw water-level variations in a more lacustrine system (e.g. HI variations in NGUE1 core).
Conclusion
Previous works have shown that FDS features may be related to some sedimentary constituents. Here, we show that these features may be used to establish spectrophotometric facies reflecting major lithological changes. Coupled with these comprehensive measurements, the Rock-Eval parameters can be used to determine the sources of sedimentary OM, to analyse the changes in sedimentary dynamics, and to track the evolution of depositional environments.
In summary, the combination of spectrophotometric and Rock-Eval measurements of the Kamalété core highlights a drastic change in sedimentary dynamics around 500 yr BP. The first part of the record (>150 cm) is dominated by detrital terrigenous inputs (signature A, high OI) in the swampy environment, probably consequential to intense erosional processes in the watershed. The second part (<150 cm) is marked by an apparent increase of local primary production (signature B, low OI), which can be induced by an attenuation of detrital terrigenous fluxes in a lacustrine basin.
In Nguène core, the combination of FDS analysis and Rock Eval pyrolysis allowed us to identify two separate episodes: signature A (‘iron oxides’) and low HI values (<150 mg HC/g Corg) in basal deposits (units 1 and 2), as a result of erosion of soil surface layers; and signature B (‘chlorophyll’) and high HI values (>150 mg HC/g Corg) in the upper deposits (unit 3), consistent with higher autochthonous contribution. These drastic changes are coherent with previous works concluding on the replacement of swamp conditions, marked by changes in water level and/or fluctuations in fluvial flooding, by permanent lacustrine conditions. In addition, small variations in FDS and HI (and OI) values could be related to minor changes in sedimentary dynamics, OM sources, or terrigenous input frequencies, as documented from palynological and geochemical data.
From a methodological perspective, this work is similar to a calibration on well-documented reference cores, which validates matching techniques, and provides elements of comparison for future studies. The spectrophotometric analysis can be performed quickly after the coring, and it produces a high-resolution signal (up to 0.5 cm), which assesses the quality of the sedimentary records and guides the sampling strategy. Rock-Eval pyrolysis does not require pretreatments, and it can provide comprehensive information on the quality and nature of sedimentary OM. The combined use of both techniques seems to be an appropriate response to a preliminary analysis of lake deposits of humid tropical forests.
Footnotes
Funding
This study was conducted under the OMARD action (Organic Markers Dynamics in Tropical Terrestrial Environments) funded by the FED 4116 SCALE with support from the Institut de Recherche pour le Développement (IRD), the University of Masuku (USTM, Gabon), and the University of Rouen (France).