



Abstract
This paper aims to evaluate the possible relationships between erosion intensity and changes in climate and land use during the past 5.5 cal. k years at Lake Lehmilampi, eastern Finland. In this study we compare a detailed geochemical sediment record with (1) forest and land use history inferred from the first pollen and charcoal records from Lake Lehmilampi, and (2) existing archaeological surveys and independent proxy-records of climate change in the study region. The physical and geochemical sediment parameters examined include grain size analysis data and 23 chemical elements, determined with four selective extractions and ICP-MS. There are indications of possible human impact in the lake catchment as early as the Neolithic period, c. 3000–2550
Introduction
Varved lake sediments may provide very detailed records of past environmental conditions, both in the lake itself and in its catchment area, providing key information about how the environment responds to natural or human disturbances. Among possible responses, alterations in the flow of elements in the environment, including erosion of surface soils, may be of interest. Erosion, here defined as the physical removal of topsoil particles with surface water runoff, may be affected by climate through changes in water runoff intensity following, for example, altered precipitation patterns. Erosion may also be affected by forest fires (natural or human-induced), and by other human activities such as deforestation, cultivation or grazing (e.g. Dotterweich, 2008; Enters et al., 2008; Ojala and Alenius, 2005; Tiljander et al., 2003; Zolitschka, 2003).
Element concentrations and sediment accumulation rates in Lake Lehmilampi (eastern Finland) during the mid and late Holocene have been described by Augustsson et al. (2010). The aims of this follow-up paper are to:
Evaluate the possible relationship between erosion intensity and changes in climate and land use during the mid and late Holocene.
Address the effect of erosion intensity on the fraction of potentially mobile element species in the eroded material, inferred from four selective extractions and ICP-MS analysis.
In order to achieve the first objective, we conducted the very first pollen and charcoal analyses at Lake Lehmilampi with the purpose of reconstructing the vegetation and land use history around the site. Moreover, we consulted the existing archaeological record in the study area in order to compare it with the interpretation of the pollen and charcoal records, and we evaluated our multiproxy records in light of published, independent proxy data of regional climate change. A conceptual model of the processes discussed in this study is shown in Figure 1.
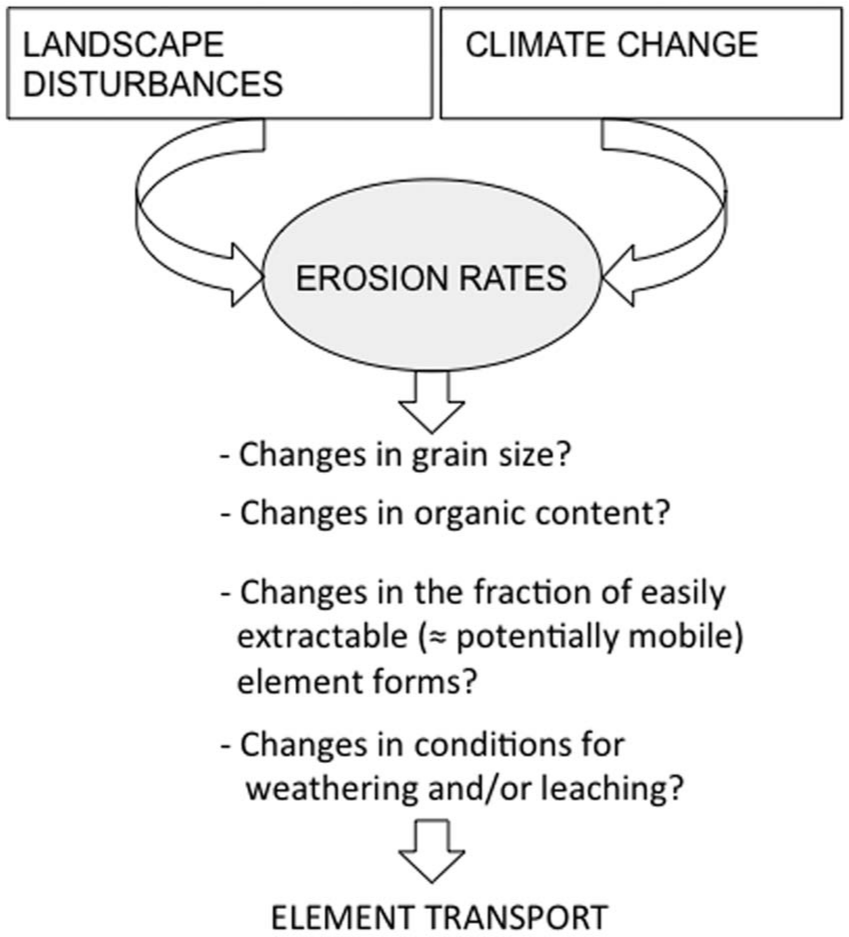
Schematic overview of the problem addressed in the paper, see text for explanation.
The study site
Lake Lehmilampi is a small lake in northern Karelia, eastern Finland (63°63′N, 29°10′E) (Figure 2a). It is located in the boreal zone, where many lakes are found to have been sensitive to climate change (Hammarlund et al., 2003; Heikkilä and Seppä, 2003; Itkonen and Salonen, 1994; Seppä et al., 2005). The lake size and catchment are c. 0.15 km2 and 1.5 km2, respectively. Two 11 m deep basins are located in the southern part of the lake. The dominant tree species in the catchment area are pine and spruce, and the bedrock, consisting of acidic Archaean rocks, is often exposed (Luukkonen, 2003). The soil overburden is composed of thin Quaternary tills and fine-grained sediments may occur in depressions, originating from the time when Lake Lehmilampi was part of Lake Pielinen, one of the largest lakes in Finland, from which it was isolated c. 3100
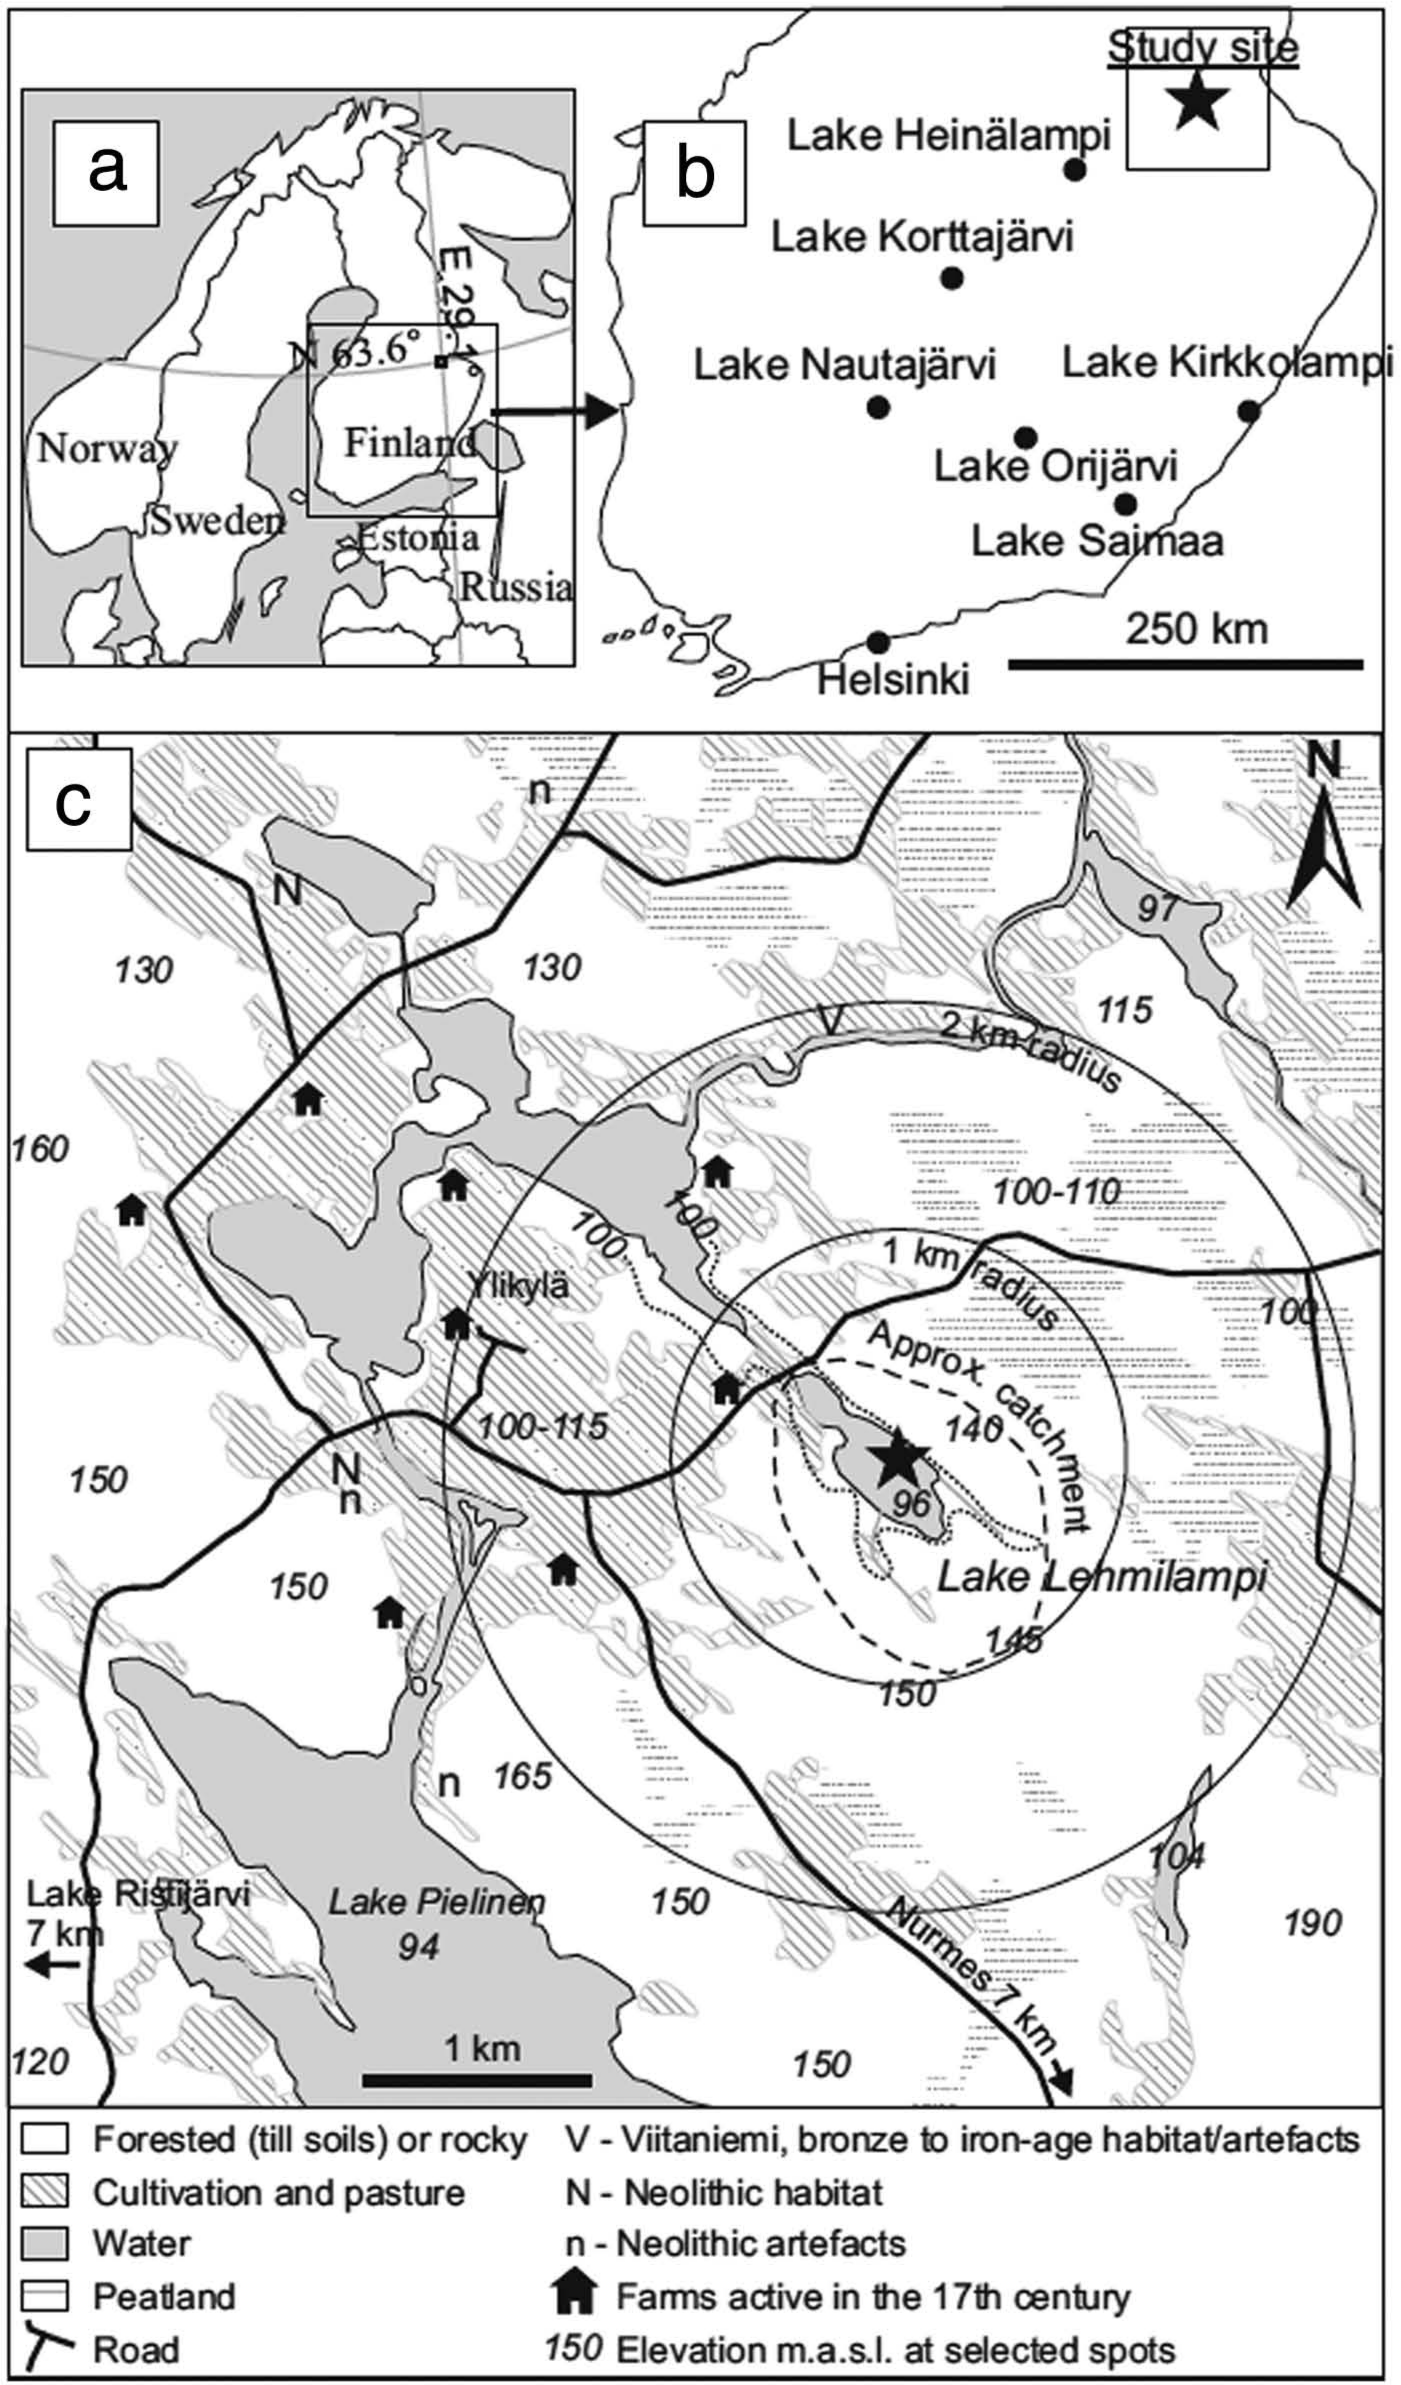
Location of Lake Lehmilampi north of Lake Pielinen in eastern Finland. The dashed line shows the lake catchment as estimated from topographical maps.
Materials and methods
Three overlapping subcores were used to extract a 486 cm long sediment sequence for geochemical analyses. The geochemical characteristics and trends of the entire sediment sequence, hereafter referred to as the ‘geochemical core’, have been described and discussed by Augustsson et al. (2010). It was only possible to visually identify individual varves in a few segments of the core. These distinct marker zones enabled the matching of overlapping subcores, but subsampling for geochemical analyses had to be made in continuous 1 cm segments rather than defined time intervals. The analyses presented in this paper were conducted on sediment from the same subsamples and we adopted the chronology that was established earlier in Augustsson et al. (2010), where the geochemical core was matched against a previosly dated core .
Erosion intensity
Variations in the erosion intensity can be inferred either from the estimates of total mineral matter accumulation available from the x-ray density analyses of the dated core (Haltia-Hovi et al., 2010), or from the variations in ash content measured in the geochemical core. These two variables showed strong positive correlation in the Lake Lehmilampi sediment (n=76; r=0.78; p<0.05; Augustsson et al., 2010). In order to study the possible relationships between changes in erosion from the catchment and vegetation/land use changes, it was essential to compare data of exactly the same age. We chose to use the ash content from the geochemical core as an indicator of relative changes in erosion intensity since it could be directly correlated with the results of the chemical leaches and the pollen and charcoal records from the same core. We define high, respectively low erosion intensity as ash content values above the third quartile (> 87.9%; n= 486; Augustsson et al., 2010) and below the first quartile (< 84.2%).
Pollen and microcharcoal analysis
To establish whether major shifts in erosion intensity were related to changes in vegetation and/or land use, 32 subsamples from the geochemical core were selected for pollen and microcharcoal analysis around major shifts in the ash content.
Eight tablets of Lycopodium clavatum spores were added to 1 g of dry sediment for calculation of pollen concentrations (PCs, pollen grains/g per yr) and pollen accumulation rates (PARs, pollen grains/cm2 per yr) (Stockmarr, 1971). Sample treatment followed the acetolysis method (Berglund and Ralska-Jasiewiczowa, 1986), and a minimum of 500 pollen grains per sample were identified using keys (Beug, 2004; Punt et al., 1976–2003) and the reference collection at the Laboratory of Palaeoecology at Linnaeus University.
Microcharcoal fragments >10–25 μm and >25–250 μm were counted on the pollen slides following the method used by e.g. Berglund et al. (1991) and Greisman and Gaillard (2008). The sediment from the studied subsamples did not contain any plant macroremains or macrocharcoal fragments >250 μm.
Pollen diagrams, including the microcharcoal records, were drawn using the TILIA and TILIAGRAPH programs (Grimm, 1990). The pollen sum (S) used for calculation of percentages includes all pollen of terrestrial plants (Berglund and Ralska-Jasiewiczowa, 1986). Percentages of charcoal fragments and taxa excluded from the pollen sum were calculated using the pollen sum S with the addition of the count for the excluded taxon/charcoal particle-fraction. Pollen assemblage zones were identified by constrained cluster analysis (Coniss; Grimm, 1987) as implemented in TILIAGRAPH. PCs were calculated in TILIA, and PARs by multiplying PCs with the weight of the 1 cm thick original sample (g), and dividing the result with the number of years represented in the sample and the area of the core section (cm2). Palynological richness (estimated number of pollen taxa E(Tn)) was estimated using the rarefaction analysis of Birks and Line (1992). All terrestrial spermatophytes and pteridophytes were included in the analysis.
Grain size analysis
Size fractionation was determined with a Micromeritics SediGraph 5120 at the Department of Geology at Lund University, Sweden. The SediGraph analysis is based on continuous x-ray scanning of particle settling through a liquid medium of known density and viscosity by applying Stokes law. The principles of the method, reproducibility, and confidence limits are described by Jones et al. (1988). The grain size analysis was conducted on 91 samples from the geochemical core. Prior to analysis, samples were treated with 30% hydrogen peroxide and 10% hydrochloric acid to remove organic matter and carbonates respectively. For dispersion of the particles, samples were suspended in 100 ml 0.5% sodium pyrophosphate and shaken overnight. The suspension was filtered through a 63 µm sieve and centrifuged to 50 ml. Before analysis, samples were treated for 30 s with an ultrasonic probe. Measurements were made in intervals down to the 0.5 µm level. In this paper, however, only the clay size fraction (<2 µm) is reported in order to examine whether an increase in small particles occurred during periods of high or low erosion intensity, as fine-grained material should contain a higher proportion of easily weathered element forms than coarse material.
Geochemical analyses
Material from the same 22 subsamples used for pollen and charcoal analysis was treated for sequential extractions. Three fractions were targeted using the sequential extraction procedure suggested by Hall et al. (1996) and Hall (1998). The first extraction targets elements in exchangeable forms and bound to carbonates (Exch) by the addition of 1.0 M sodium acetate. The second extraction releases organically bound elements using 0.1 M pyrophosphate (Org), and the third one releases elements associated with amorphous Fe and Mn oxyhydroxides by adding 0.25 M hydroxylamine (Fe/Mn). Total element concentrations were determined after digestion with a mixture of hydrofluoric acid, hydrochloric acid, perchloric acid and nitric acid (Tot). The total extraction was conducted with fresh material instead of analyzing the residual fraction as a final step in the sequence.
The following elements were determined with ICP-AES/MS at Actlabs, Canada: Al, As, Ba, Ca, Ce, Co, Cu, Fe, Ga, K, La, Mg, Mn, Ni, Pb, Rb, S, Sr, Th, U, V, Y, Zn. Concentrations in each fraction were recalculated into annual accumulation rates, in a similar way as described for pollen concentrations above. The total potentially mobile fraction (PMF) of elements (%) was calculated from the annual accumulation rates (mg/m2 per yr) of the different fractions according to:

Results and discussion
Land use and fire history
As one of the study’s aims is to compare inferred erosion intensity from the lake catchment with changes in climate, vegetation and land use, it is necessary to define the size of the area around the lake for which the pollen and charcoal records are representative. To date, a concept of the source area exists for pollen assemblages in lake sediments, i.e. the relevant source area of pollen (RSAP) sensu Sugita (1994). The RSAP of small sites can be estimated when there are a number of pollen records from small and large lakes available in the study region, which is not the case here. The radius of the RSAP for small lakes in forested to half open landscapes was estimated to range between 800 m and 2000 m in southern Sweden (Hellman et al., 2009a, 2009b; Sugita et al., 1999). Here we assume that the RSAP of Lehmilampi is/was of similar size and, therefore, comparable with the size of the watershed catchment area of the lake (c. 1.5 km2). Below, ‘study area’ refers to the lake catchment area and the RSAP, while ‘study region’ refers to a larger area around the lake of 2.53–103 km2.
The definition of the RSAP also implies that it is the smallest area for which a pollen-inferred quantitative reconstruction of vegetation abundance (in percentage cover within the lake’s RSAP) can be achieved using the Landscape Reconstruction Algorithm (LRA) of Sugita (2007). The LRA also requires that a number of pollen records from small and large lakes are available in the study region. In this study we thus need to use general insights from quantitative reconstructions in other regions when we interpret the pollen record from Lake Lehmilampi. Although pollen assemblages from small lakes primarily include pollen grains from the local vegetation within the lake’s RSAP, a significant fraction of the pollen assemblage (the ‘background pollen’ sensu Sugita, 2007) originates from the regional vegetation. The background pollen fraction is particularly large when the regional vegetation is characterised by high pollen producers such as Betula and Pinus (e.g. Broström et al., 1998), which is the case in our study region. In such circumstances, non-arboreal pollen (NAP) strongly underestimates the cover of local herbaceous plants (Hellman et al., 2009b; Sugita et al., 1999). Therefore, we assume that the pollen record from Lehmilampi can be interpreted in terms of local vegetation changes, i.e. within the watershed catchment of the lake or slightly larger (a 2 km radius area around the lake), and that the percentages of NAP in the pollen record at Lehmilampi are an underestimation of the actual cover of open vegetation within the RSAP of the lake.
The source area of microscopic and macroscopic charcoal fragments has been discussed by many authors, but a consensus has so far not been reached (see Greisman and Gaillard, 2008, for a detailed discussion). Here we assume that the size fractions 10–≤ 25 µm and >25–250 µm roughly represent regional respectively local fire activity. In a study of Lake Ristijärvi (7 km from Lehmilampi; Figure 2c), it was shown that the local forests burned in intervals of 220–260 years between c. 4350
We interpret the simultaneous occurrence of pollen indicators of human impact (following Gaillard, 2007), pollen cereals (Cerealia-type, Hordeum-type and/or Secale) and high values of large microcharcoal particles (>25–250 μm) (Figure 3a) as an indication of local slash-and-burn cultivation (Cornell, 2007). However, the occurrence of pollen from light-demanding plants alone – without a simultaneous occurrence of pollen from cereals – may just as well represent natural local disturbances (i.e. fire, wind, disease, etc.). The latter needs to be kept in mind when interpreting pollen data in terms of land use and human impact. Changes in palynological richness (estimated number of pollen taxa E(Tn), see methods) are assumed to provide an estimate of changes in plant diversity at the biotope/vegetation level. E(Tn) was shown to increase with disturbance intensity up to an intermediate level of disturbance (e.g. Berglund et al., 2008). Thus we assume that a high E(Tn) is an additional indicator of disturbance in the record from Lehmilampi.

(a) Pollen and microcharcoal percentage diagram. Pollen grains of cereals were identified following Beug (2004), i.e. Cerealia-type is distinguished from wild grasses by the size of the grain, its pore diameter, and breadth and height of the annulus, which should be >37 μm, >2.7 μm, >2,7 μm, and >2.0 μm, respectively. Within the Cereal type group, Hordeum-type is distinguished by its round shape and exine sculpture (in phase contrast, isolated dark points, relatively large and regularly distributed), and Secale by its asymmetric shape. Some Hordeum-type pollen may belong to Secale, i.e. the Secale pollen morphological type may underestimate the amount of pollen from Secale. Moreover, the genera of wild grasses Glyceria, Bromus, Agropyron and Elymus have the same pollen morphology as Hordeum, i.e. they are included in the Hordeum type. The taxa groups A to I are according to Gaillard (2007) adapted for the purpose of this study. A: Trees and shrubs of damp soils; B: shade-tolerant trees and shrubs; C: light-demanding trees and shrubs; D: Pteridium; E: dry pastures and heaths; F: fresh meadows and pastures; G: Cyperaceae, Sphagnum (wet meadows); H: ruderal communities; I: cultivated land; J: Dryopteris type, Huperzia selago; L: lake vegetation. Pollen taxa, which are not shown in this diagram, are presented in Table 2 of the electronic supplementary material, available online. (b) Diagram of pollen accumulation rates for selected major pollen taxa. The taxa groups A–C and E–H are the same as in (a).
Below we refer to the archaeological chronology developed for the inland areas of eastern Finland. The major characteristics of the local pollen assemblage zones (LPAZs) are summarised in the electronic supplementary material (Table 1, available online). The pollen diagrams (Figure 3a, b) include the most abundant pollen types. Rare pollen findings are presented in the electronic supplementary material Table 2 (available online). We inferred four major periods of vegetation/forest disturbance (natural or human-induced); the three oldest periods are separated by two phases lacking signs of disturbances. The two last periods follow each other in time, but are different in character. Below we mainly discuss the inferred periods of vegetation/forest disturbance.
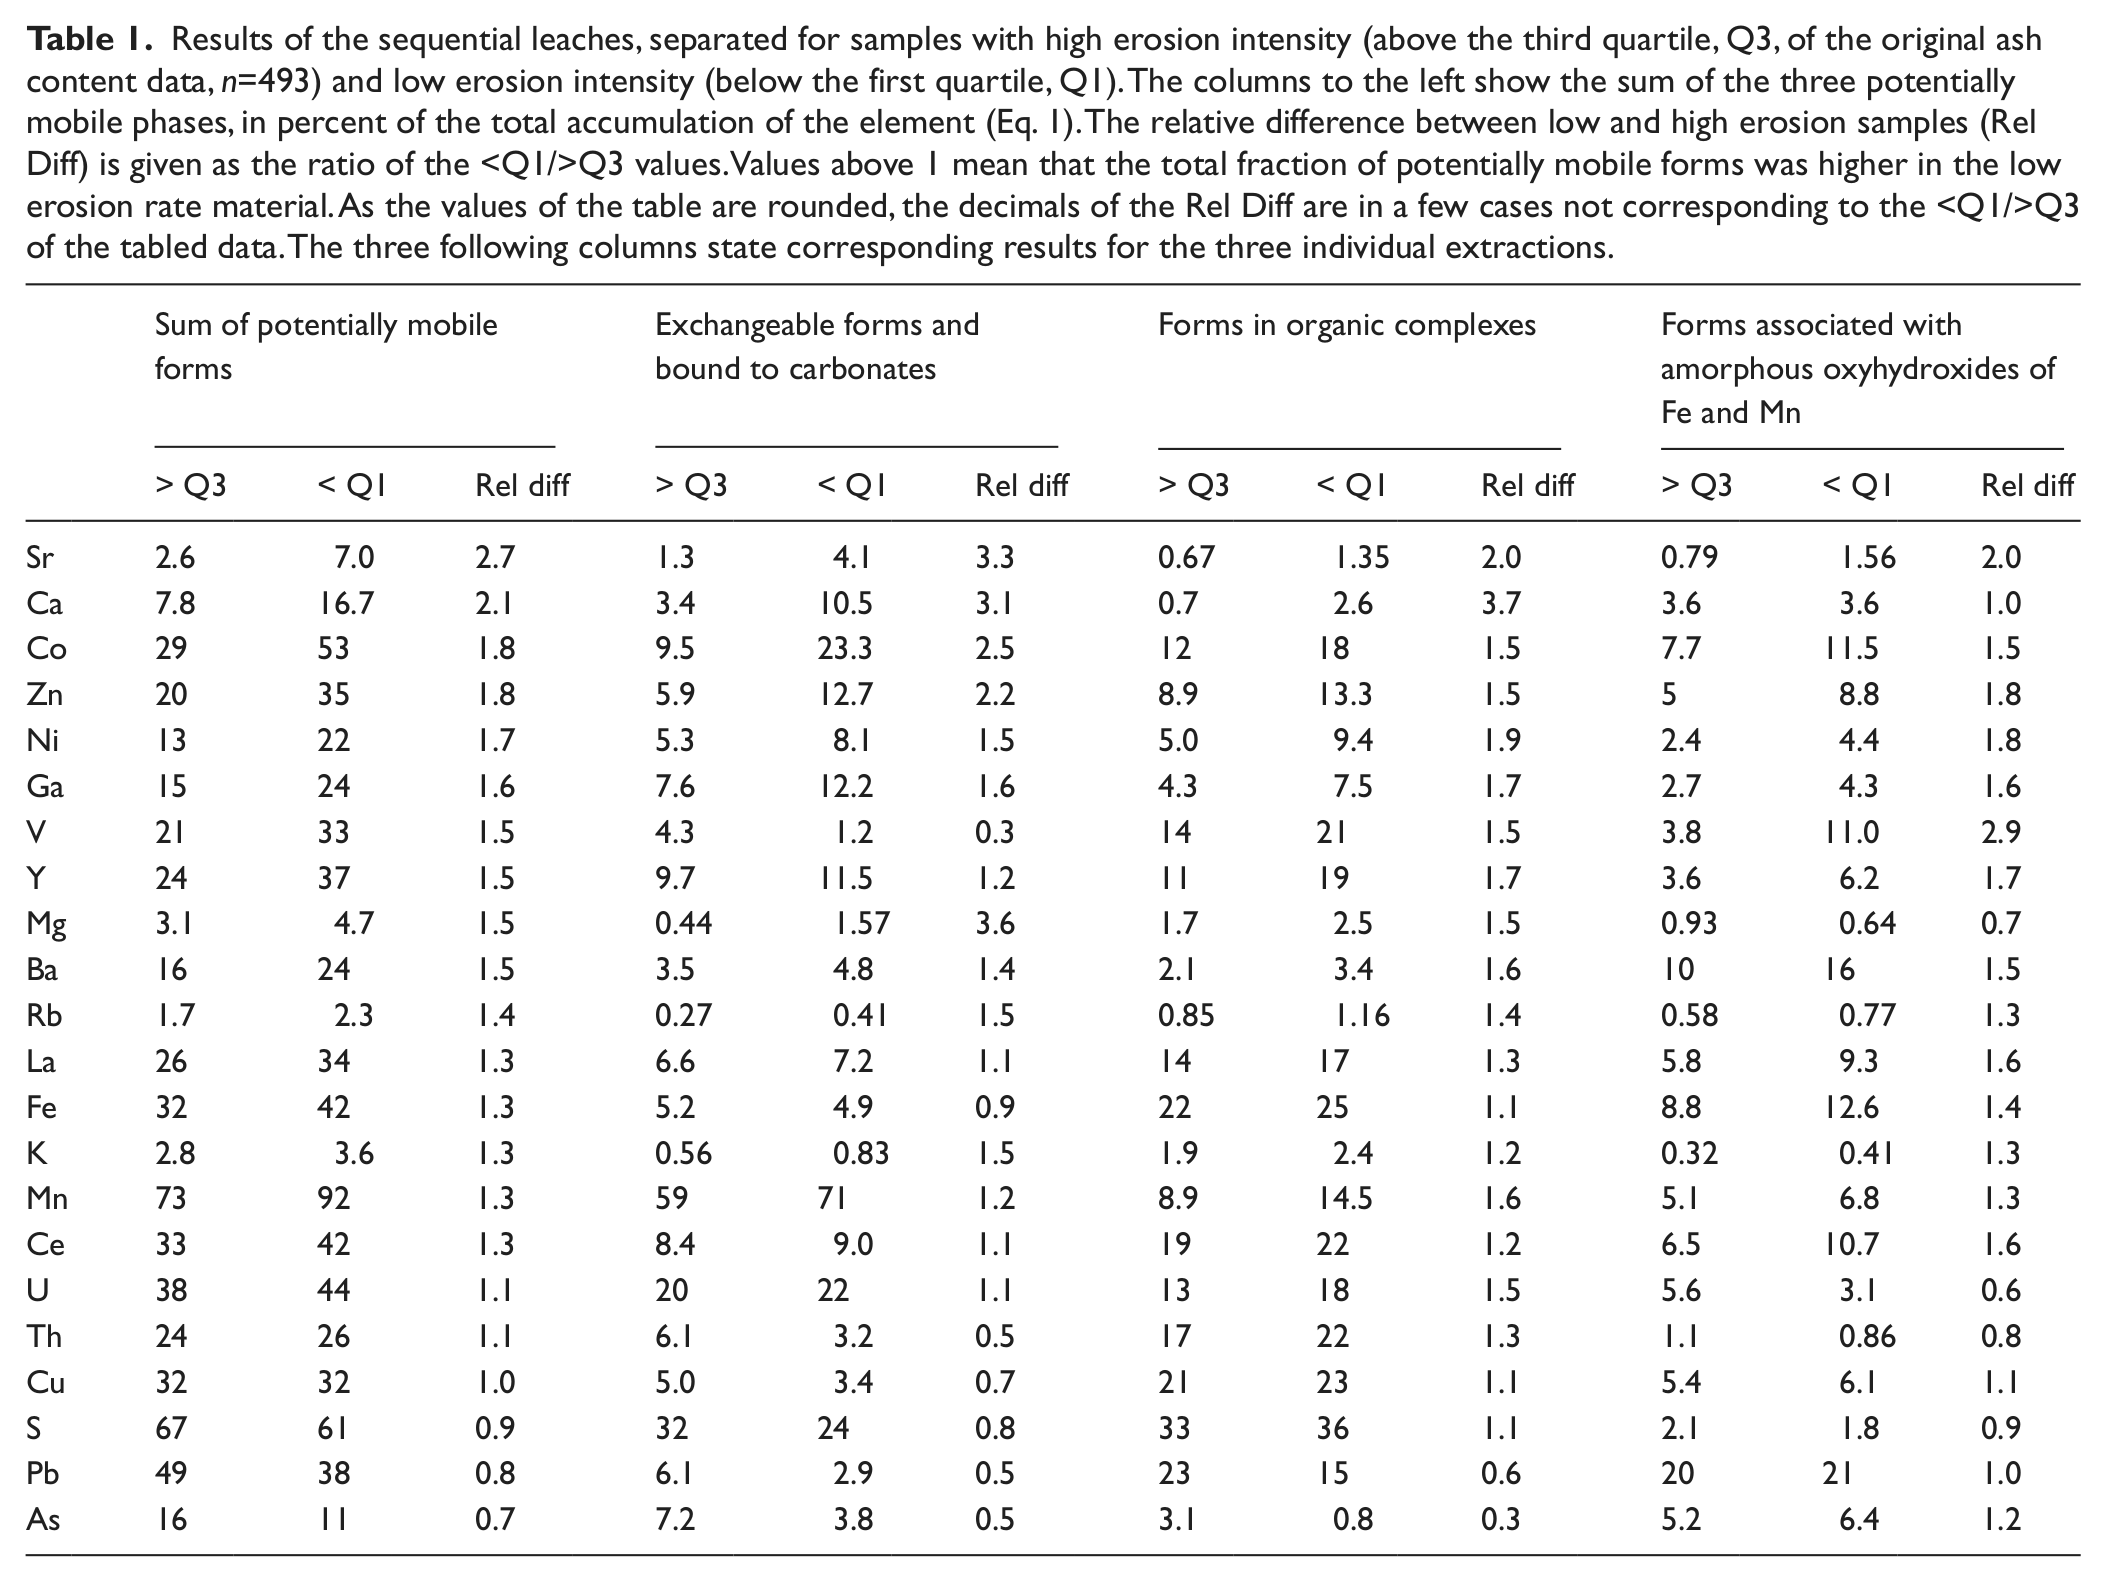
Results of the sequential leaches, separated for samples with high erosion intensity (above the third quartile, Q3, of the original ash content data, n=493) and low erosion intensity (below the first quartile, Q1). The columns to the left show the sum of the three potentially mobile phases, in percent of the total accumulation of the element (Eq. 1). The relative difference between low and high erosion samples (Rel Diff) is given as the ratio of the <Q1/>Q3 values. Values above 1 mean that the total fraction of potentially mobile forms was higher in the low erosion rate material. As the values of the table are rounded, the decimals of the Rel Diff are in a few cases not corresponding to the <Q1/>Q3 of the tabled data. The three following columns state corresponding results for the three individual extractions.
Neolithic time, c. 3000–2500 bc (LPAZ 2a)
The first possible indications of human impact can be seen as early as the Neolithic time, between c. 3000 and 2500
LPAZ 2b (2500–1800
Early Metal Period, c. 1800–100 bc (LPAZ 3a–3c)
The period of 1800–100
Lake Heinälampi is the closest site with indications of human impact in the pollen record dated to c. 1300
LPAZ 3d (800
Migration period (middle Iron Age) to late Middle Ages, ad 600–1500 (LPAZ 3e)
Between c.
A large body of archaeological and palaeoecological records from southern and eastern Finland clearly demonstrate that farming started to develop at many sites during the Iron Age and increased in intensity during the Middle Ages (Alenius et al., 2008; Grönlund, 1995; Grönlund et al., 1992). Sporadic slash-and-burn agriculture of a similar age (
ad 1500–Modern times (LPAZ 4)
A study by Pitkänen et al. (2002) indicates a drastic increase in forest fires about 500 years ago associated with stronger human impact in the area. The increase in percentage and accumulation rate of large microcharcoal particles c.
Controls on erosion intensity
Lake Lehmilampi was chosen for this study because the effects of within-lake processes on the sediment are assumed to have been small compared with the effects caused by changes in the catchment. Although there is a small fraction of organic matter in the clastic-organic varves that may originate primarily from authochtonous primary production (Haltia-Hovi et al., 2007), Lake Lehmilampi is a deep oligotrophic, clear-water lake where the material deposited in the deep basins is dominated by allochthonous mineral matter. The sediment is characterized by a low sediment accumulation rate and bioturbation from benthic animals is negligible. Moreover, the lake’s large water volume in relation to its small catchment area implies a lake water retention time that allows for precipitation and accumulation in the lake sediment of suspended particles originating from the surroundings. Obviously, oligotrophic lakes may exhibit internal changes over time as a result of climate change. It is well known that, for example, changes in temperature or water stratification can affect the redox potential and leakage of elements from the sediment into the overlying water (Wetzel, 2001). However, no signs of such changes were detected in the sedimentary data and, therefore, we assume that the major processes affecting the geochemical properties of the lake sediments are terrestrial.
When discussing erosion intensity at Lake Lehmilampi we need to remember that changes are occurring in a relatively stable environment as indicated by the preservation of a varved sequence. The input rates cannot have reached extremes, otherwise the varves would not have been preserved. Also, the indicators of human disturbance in the sediment are assumed to originate from a relatively small area corresponding more or less to the size of the lake watershed catchment (1.5 km2). The latter probably had a marginal location in relation to the major human activities around farms and villages, thus the disturbances in terms of open land and soil erosion were probably never very large in the lake catchment itself. Still, significant changes were registered in the sediment sequence.
The inferred erosion record at Lake Lehmilampi is shown in Figure 4. The highest erosion intensities coincide with periods characterised by human disturbance and local fire. The maximum erosion intensity is found during the most recent centuries, together with palynological evidence of cereal cultivation from
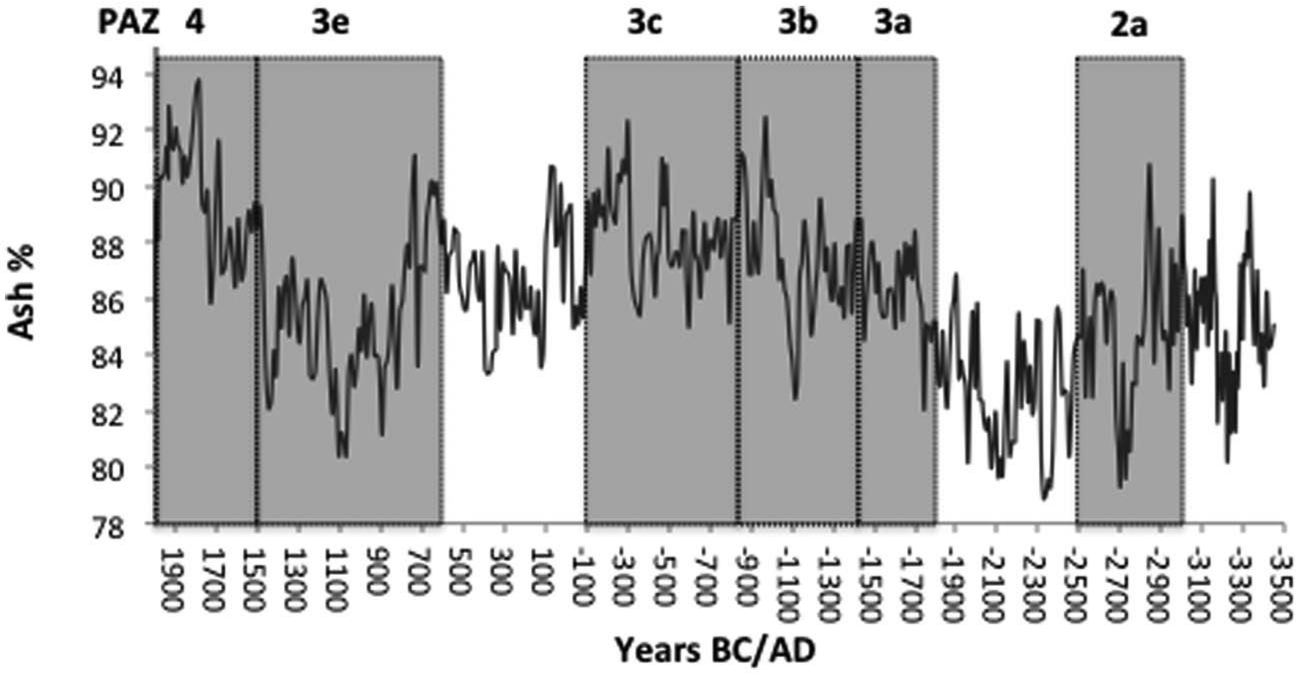
Inferred variations in erosion intensity, illustrated by ash content. Grey zones indicate the periods of natural or human-induced disturbances of the catchment and an increased openness of the landscape. For description of pollen assemblage zones (PAZs), please see the Land Use and Fire History Discussion.
The 900–100
The two periods with the most significant reduction in erosion intensity were found between 3000–2500 b
Climate change obviously played a significant role in the sediment accumulation and composition of Lake Lehmilampi during some periods of the Holocene. This was also shown by Haltia-Hovi et al. (2007), who found a strong positive correlation between varve thickness and solar activity. However, varve thickness is controlled mainly by the accumulation of organic matter, which has a high water content (Renberg et al., 1984). The accumulation of organic matter is mainly a function of autochtonous primary production and decomposition rates, and hence not suitable for tracking changes occurring in the catchment area. Haltia-Hovi et al. (2007) also present the results of mineral matter accumulation, which matches the ash content profile discussed in this paper. However, since their comparison with solar activity was not based on changes in the input of detrital mineral matter, their study and ours complement each other and show that lake sediments are controlled by both limnological processes (varve thickness) and terrestrial processes (mineral matter accumulation), where climate might be a strong forcing factor on processes both within the lake and in its catchment, but where the processes within the lake’s catchment may also be strongly affected by human disturbances, natural forest fires, and other phenomena influencing both the erosion intensity and the physical and geochemical composition of the lake sediments.
An increase in potentially mobile element forms during low erosion intensity
There is a clear negative correlation between the total potentially mobile fraction (PMF) of elements and the erosion intensity (rs=−0.87; p<0.01; n=22) (Figure 5a). Each element’s PMF is given in Table 1. The PMF varies from 10 to 90% depending on the element, which means that a substantial fraction of all elements was deposited in relatively unstable and easily leachable forms. The only elements with low values were Sr, Mg, K and Rb, all common in stable silicate minerals. All elements except S, Pb and As had a higher PMF in samples from periods with low erosion intensity. Of the 22 samples, the one with the highest erosion intensity contained a PMF of 18%, while the sample representing the lowest erosion intensity had a PMF of 38% (Figure 5a). The average annual accumulation of sediment was estimated to be 550 g/m2 per yr for the sample with the highest estimate of erosion intensity, and 210 g/m2 per yr ( i.e. c. 40% of the 550 g) for the sample with the lowest estimate of erosion intensity (Augustsson et al., 2010). However, the higher PMF in the samples characterised by low erosion intensity compensates for the lower total sediment accumulation; thus the total accumulation of potentially mobile forms did not change much with changes in erosion intensity (Figure 5b). For example, the 18% PMF in the sample with the highest erosion intensity corresponds to 100 g/m2 per yr of potentially mobile forms, and the corresponding value for the sample with the lowest erosion intensity is 80 g/m2 per yr.

The total fraction of potentially mobile element forms (sum of the three sequential leaches for Al, As, Ba, Ca, Ce, Co, Cu, Fe, Ga, K, La, Mg, Mn, Ni, Pb, Rb, S, Sr, Th, U, V, Y and Zn) as a function of the rate of catchment erosion. Ash content values are used as a proxy for catchment erosion from the same samples, which were sequentially leached.
The decrease in PMF with erosion intensity could result from an increased input of coarser particles. As these particles should be more resistant to the leaching procedures applied, they would dilute more easily extractable forms. However, the lower PMF at high erosion intensities may also depend on altered conditions for leaching from the catchment. The impact of grain size effects and leaching are discussed below.
Effects of grain size changes on potentially mobile element forms
The lowest erosion intensities found during warm and dry periods might be explained by comparatively low surface water runoff. If this is the case, the average grain size of the eroded material might be lower during such periods, which has been indicated in the sediments of Lake Nautajärvi (Ojala and Francus, 2002). Since finer fractions are enriched in the species that were targeted in the sequential extraction, i.e. the potentially mobile forms, the high PMF values at low erosion intensity could result from a higher content of fine particles. However, no correlation was found between the ash content and the particle size. Figure 6 shows the results for the clay-size fraction (<2 µm), but the same lack of relationship appeared also when larger fractions were considered. The lack of systematic changes in the mechanical sorting of the fine fraction between periods of high and low erosion intensity was unexpected.
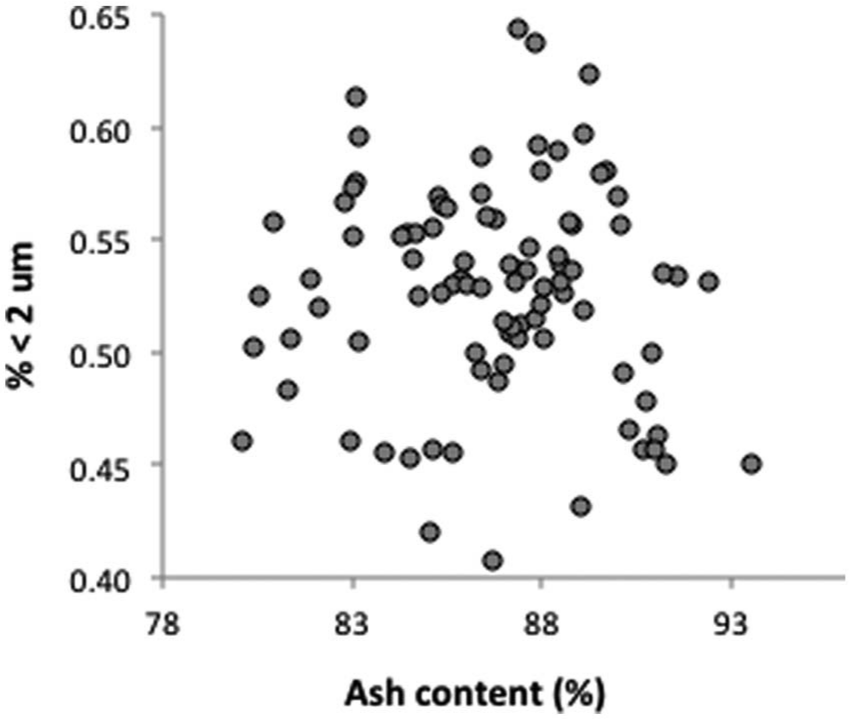
The percent of material in each sample that belonged to the clay sized fraction (<2 μm) plotted against the erosion rate, inferred from the ash content (n=91).
Effects of weathering and/or leaching
Is it then possible to explain the change in the PMF by a change in the chemical weathering regime and a subsequent change in leaching of soluble species from the catchment to the lake? It can be assumed that surface soils have more time to weather and podzolise during stable periods with low erosion intensity (Mackereth, 1966). During podzolisation elements are released from primary minerals by chemical weathering, and either lost by leaching or retained through precipitation of secondary minerals or adsorption onto solid particles (Lundström et al., 2000; Sauer et al., 2007). With an increase in leaching, there should be an increased transport of soluble elements with surface runoff and groundwater into lakes where precipitation might occur. In these forms the elements are more easily leached than from their original mineral structures. The elements that are retained in the soil after weathering are also more labile, which should be reflected in the lake sediment if such soils were eroded and transported to the lake.
An inverse relationship between chemical weathering and erosion intensity is not only suggested by the aspects of the podsolisation process described above. In the case of Lake Lehmilampi, it is also telling that the lowest erosion intensities were found during warm anomalies. Weathering intensity is sensitive to changes in climate, as temperature and humidity are critical for the rate of mineral dissolution (White et al., 1999), and for the decomposition of organic matter (Kirschbaum, 1995), a process which releases humic acids that further stimulate weathering. An increase in temperature may have a profound effect on the annual release of elements after weathering at sites where there is snow and ice for a significant part of the year. Past weathering intensities have been deduced from lake sediments using the ratios of Ca/K or Sr/Rb (Chen et al., 2005; Jin et al., 2001; Kauppila and Salonen, 1997; Solovieva and Jones, 2002). These ratios can provide robust evidence of weathering intensity since they are based on common elements, of which K and Rb are primarily associated with silicates and Ca and Sr are common in carbonates. As carbonates are more readily dissolved, the ratios should decrease in the parent material as weathering proceeds. In sediments, however, the ratios increase with an increase in weathering intensity. This is because solubilised and leached Ca and Sr ions easily form secondary phases that accumulate in the sediment. K and Rb, on the other hand, represent conservative elements. The fraction of these elements that is weathered remains dissolved and are thus less likely to end up in the sediment.
In Lehmilampi there is a clear negative correlation between erosion intensity and the ratios of both Ca/K (Figure 7) and Sr/Rb, which supports the idea of weathering being more pronounced during warmer periods with low erosion intensity.

Variations in the Ca/K ratio in relation to variations in estimated erosion (inferred from ash content) of the catchment area.
Conclusions
The pollen and charcoal analyses at Lake Lehmilampi (the first to be produced from the area) suggest that the first undisputable signs of human impact and practice of slash-and-burn cultivation date to 1800
The highest erosion intensities were found during periods with local fire and human impact (slash-and-burn cultivation), i.e. 1800–100
The lowest erosion intensities are clearly related to warm and dry climate conditions and the related effect on soil processes in the catchment during the HTM, 3500–2100
The records of erosion intensity, pollen and charcoal, combined with a general knowledge of the climate history of the region, clearly show that climate change and human impact both had an impact on erosion intensity during the 5500 years of environmental history covered by the sediment sequence studied here. The HTM, its end c. 2000
Although the preserved varve sequence in Lehmilampi indicates a relatively stable environment in the lake’s catchment, changes in erosion intensity were significant enough to affect the fraction of potentially mobile element phases; the latter clearly increases with decreasing erosion intensity. The increase in potentially mobile forms cannot be explained by an increased proportion of fine grained material, as no correlation was found between erosion intensity and the fraction of clay. Thus we assume that periods of low erosion intensities were associated with a higher degree of chemical weathering and leaching.
Detailed geochemical studies of annually laminated lake sediments, together with pollen and charcoal analyses, have a great potential for providing an in-depth understanding of how lake-catchment erosion and related geochemical properties in lake sediments may be affected by land use and climate change; sometimes they act together, and sometimes they play contrasting roles, depending on the time period. Annually laminated sediments are particularly useful in such studies as they make it possible to date significant changes with high accuracy and thus allow a precise correlation with information from other, independent sources such as archaeological data and proxy climate records.
Footnotes
Acknowledgements
The authors would like to thank Teija Alenius, Department of Archaeology, University of Helsinki, for useful discussions on the interpretation of the pollen analysis in terms of human impact and providing a scheme of archaeological periods for the study area.
Funding
The study was financially supported by the Faculty of Natural Sciences and Technology, Linnaeus University.