
Abstract
Bomb-pulse dated mini moss-monoliths were used to determine modern pollen accumulation rates on mire surfaces at six locations in northern and central Norway. Coupled with vegetation data these were used to assess the modern pollen–vegetation relationships for Pinus, Betula and Poaceae. Preliminary absolute pollen productivity (APP) estimates are for Pinus sylvestris 11,300 ± 2300 (SE) grains/cm2 per yr, Betula pubescens 2200 ± 300 and Poaceae 1800 ± 200. The study suggests that pollen accumulation rates and absolute pollen productivity estimates can be derived from mire surface peat. This would ease the establishment of APP estimates for more taxa and regions than available today.
Introduction
Pollen productivity estimates are becoming increasingly important for interpreting fossil pollen data (e.g. Gaillard et al., 2010; Mazier et al., 2012; Nielsen and Odgaard, 2010; Nielsen et al., 2012). Most of these estimates are relative measurements based on moss samples (e.g. Broström et al., 2004; Bunting et al., 2005; Hjelle, 1998; Mazier et al., 2008; Räsänen et al., 2007; Sugita et al., 1999; von Stedingk et al., 2008) or surface lake sediments (e.g. Nielsen, 2003; Prentice et al., 1987; Sjögren et al., 2008b; Soepboer et al., 2007; Theuerkauf et al., 2013). Lately, the emergence of long-term pollen accumulation rate (PAR) data series based on pollen traps (e.g. Hicks, 2001; Kvavadze, 1999; van der Knaap et al., 2001; cf. Giesecke et al., 2010) has allowed the calculation of absolute pollen productivity estimates (Filipova-Marinova et al., 2010; Sjögren et al., 2008a, 2010; Sugita et al., 2010). Absolute pollen productivity estimates are superior to relative pollen productivity estimates on several counts: (1) they provide a means to interpret fossil PAR data, which is especially important in areas with sparse vegetation cover; (2) they allow independent absolute pollen productivity measurements of taxa, which ease the assessment of e.g. outliers and taxon-specific dispersal functions; and (3) they make comparison between investigations easier as a common (and reliable) reference taxon is not required. At the same time, absolute pollen productivity estimates (APPs) can easily be recalculated into relative pollen productivity estimates (RPPs), which are of common practical use in most vegetation reconstructions and model evaluations. The main drawback of using pollen-traps for calculating APPs is that it is a time-consuming method, and thereby indirectly also expensive. At least 5–10 years of measurements are required in order to attain reliable mean PAR values (Hicks, 2001; Hicks and Hyvärinen, 1999), especially if masting trees as pine, spruce or oak are studied, and there exist only a handful of such long pollen-trap data-series in the world. In addition, there are limitations of where pollen traps can be placed as people and cows tend to damage them.
The fraction of exotic pollen has previously been used to calculate relative pollen accumulation rates from moss humus samples and modern lake sediment samples, and subsequently to calculate relative pollen production (Andersen, 1970; Sjögren et al., 2008b). Even though this approach removed the percentage- or so called Fagerlind-effect (Fagerlind, 1952), it does not produce absolute pollen accumulation rates (PARs) or absolute pollen productivity estimates (APPs). It is also confined to areas with a large and easily identifiable fraction of exotic distance-transported pollen present in the pollen assemblages. In the present study a more applicable and accurate method to derive absolute PAR values, and subsequently absolute pollen productivity estimates, from mires will be presented.
Materials and methods
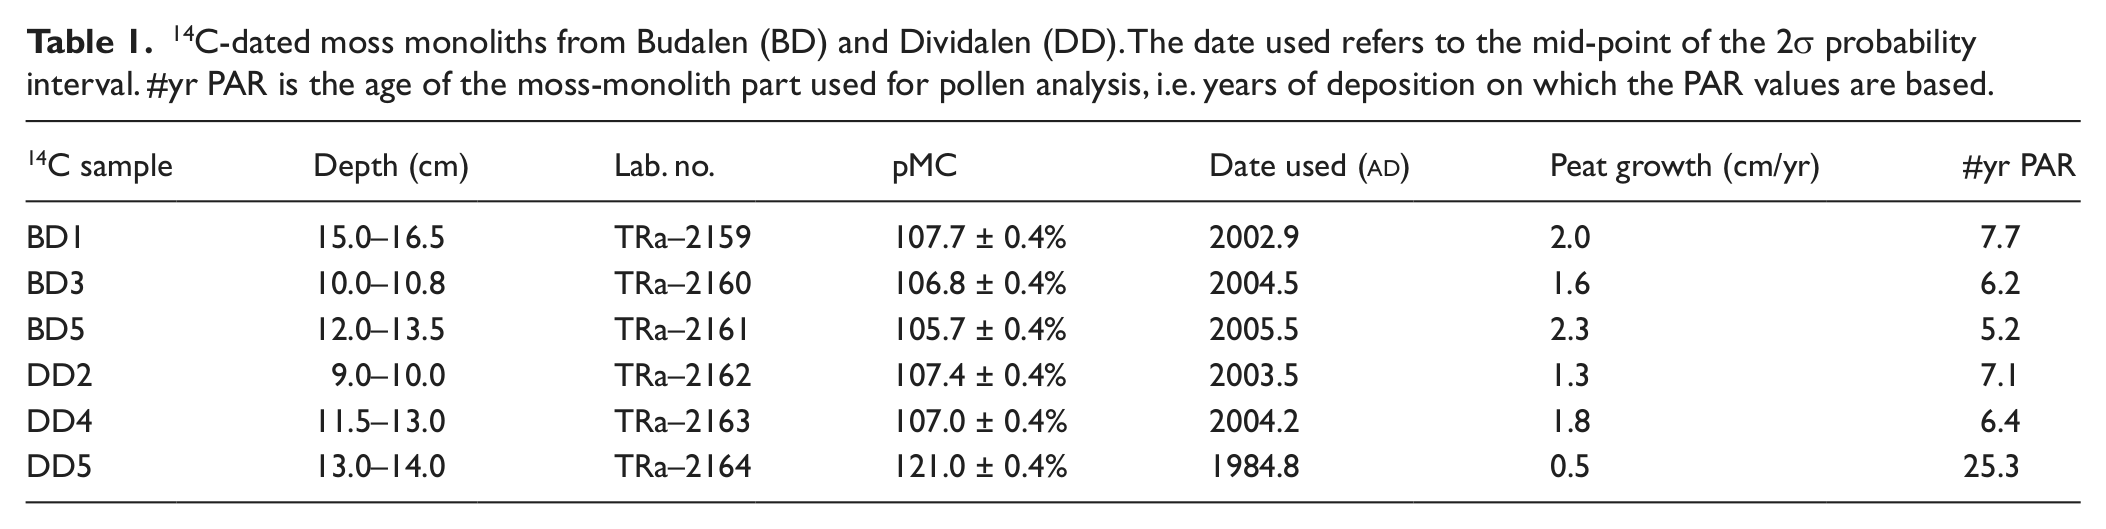
In order to assess the modern pollen–vegetation relationship for Pinus sylvestris, Betula pubescens and Poaceae a total of six samples were analysed, three in Budalen valley, central Norway, and three in Dividalen valley, north Norway (Figure 1). Both valleys are north–south orientated with the highest part to the south. The samples were collected from mires situated 1.5–5.5 km apart in the upper pine and lower birch belt during late summer/early autumn 2010. Pollen accumulation rates were determined by extracting small moss monoliths of c. 2–3 cm sides and 10–15 cm length. First a relatively large peat monolith was cut out of the mire after which the sides were trimmed down to desired breadth with a pair of scissors and then carefully measured with a vernier caliper, giving a very precise measurement of the surface area. The upper part, which constituted most of the monolith was used as a single pollen sample, while the lowermost centimeter or so were separated and used for radiocarbon dating. Bomb-pulse calibration was done with the CALIBomb program using the Levin data set (Levin and Kromer, 2004; Reimer et al., 2004), see Table 1. A 1 yr smoothing was applied and it was assumed that all dates were post 1963. Lycopodium spores were added to the remaining moss which was then heated in KOH. A minimum total sum of 500 pollen from the investigated taxa (Pinus sylvestris, Betula pubescens, Poaceae) were determined in each sample. Sampling site information and pollen accumulation rates are provided in Table 2.
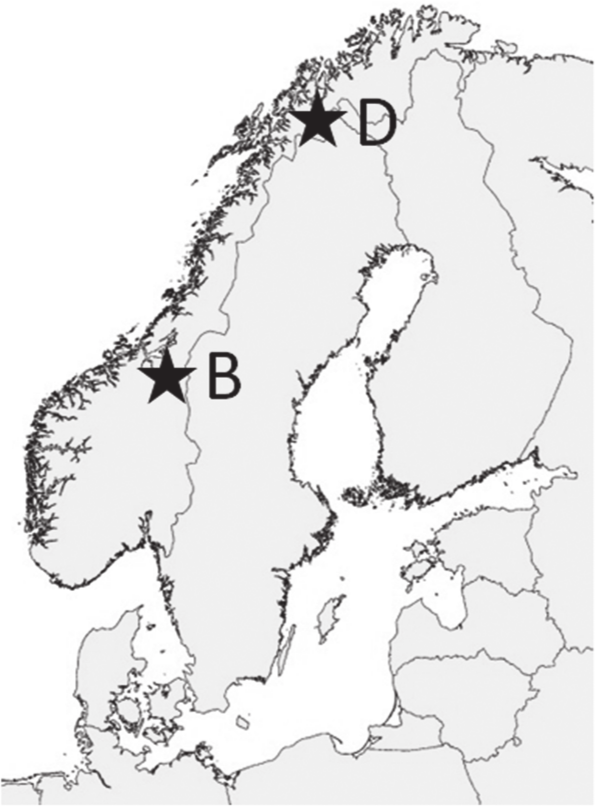
Overview map. The investigation areas Dividalen (D) and Budalen (B) are marked with stars.
14C-dated moss monoliths from Budalen (BD) and Dividalen (DD). The date used refers to the mid-point of the 2σ probability interval. #yr PAR is the age of the moss-monolith part used for pollen analysis, i.e. years of deposition on which the PAR values are based.
Site location and PAR in Budalen (BD) and Dividalen (DD). Vegetation refers to the dominant vegetation type within 100 m. PAR is measured in deposited pollen grains/cm2 per yr.
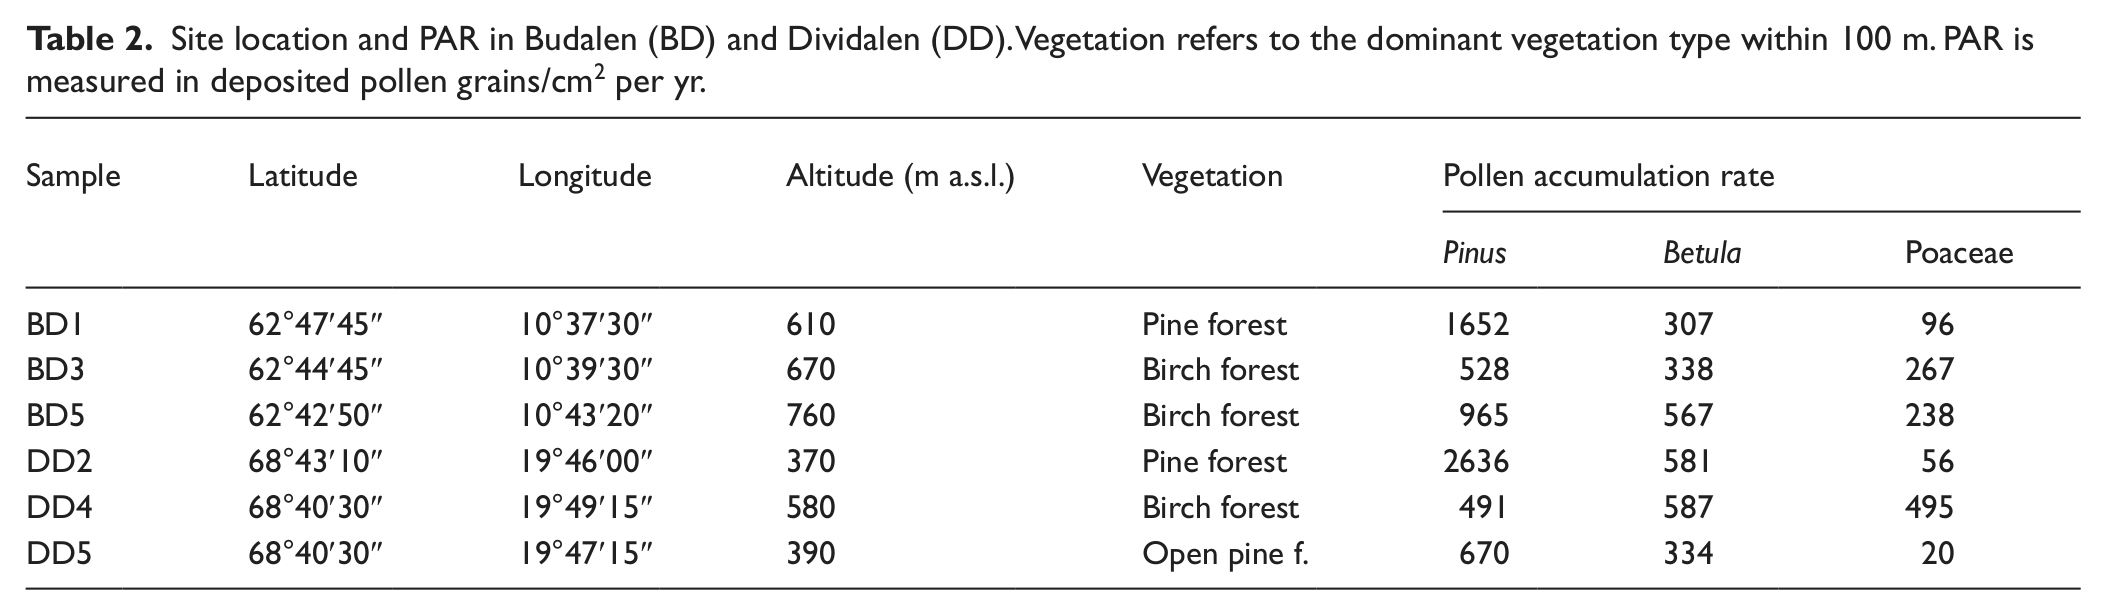
All surface samples were collected from open mires with at least 20 m distance to abundant stands of the investigated taxa (with exception of DD4 where Poaceae occurred on the mire surface). Surrounding vegetation cover was extracted from two sets of vegetation maps: The field survey based NIJOS (Rekdal and Larsson, 2005) and the satellite-derived SatVeg (Johansen, 2009). As the NIJOS map-set is considered more accurate it was preferred when available, but as it has limited coverage. SatVeg was used to a large degree (covers all of Norway). The vegetation types within logarithmic increasing rings were calculated. Each ring had an outer radius 101/3 larger than the inner radius (cf. van der Knaap et al., 2001). At Budalen the NIJOS-map was used for rings between 0.02 and 4.64 km, while SatVeg was used for rings between 4.64 and 464 km. For non NIJOS-mapped areas within 4.64 km the vegetation was approximated using an adjacent mapped area, in practice an area within a certain distance from the pollen sampling point and/or altitude. For Dividalen SatVeg data was used for all distances as NIJOS-maps were not available for the area. Each mapped vegetation type was then appointed a certain taxon-specific vegetation composition. Some corrections to the vegetation composition were made close to individual sampling sites based on field observations. For areas in the outermost rings extending into Sweden only general data was used; south northern Sweden for the Budalen samples and north northern Sweden for the Dividalen samples (Nilsson et al., 2012).
The pollen–vegetation relationship for a large area can be approximated as (i.e. the absolute version of Davis R-value model (cf. 1963)/the basic version of Andersen’s model (1970)):

In this equation PPDC is the site-specific pollen productivity deposition coefficient, PAR the pollen accumulation rate (or pollen influx) and DWPA the distance-weighted plant abundance. The PPDC is theoretically the same as a single site pollen productivity estimate, and the mean of a representative number of sites in a region would provide a reliable pollen productivity estimate. However, a single site is presumably strongly affected by local dispersal and deposition conditions (topographic controlled wind and precipitation, etc.). In addition, single-site pollen productivity measurements would be affected by random error, and impossible to evaluate statistically, making it a poor estimate of the actual pollen productivity in the region. Hence the term PPDC is considered more suitable.
DWPA was determined using two different dispersal functions, one logarithmic and one based on Sutton’s equation for wind dispersal of small particles (Sutton, 1953). A basic assumption for both dispersal functions as applied here is a pollen source area (100%) of 464 km, i.e. that no pollen is deriving to the point of deposition from outside this area. It should be noted that long-distance pollen likely is present (cf. van der Knaap, 1988; van der Knaap et al., 2012), although this would only constitute a minor contribution to the pollen assemblage compared with the deposition from within 464 km.
In the logarithmic distance-weighting function each ring was given equal weight, which in practice means that each vegetation unit was down-weighted 4.64 times compared with the previous ring (cf. Sjögren et al., 2008a; van der Knaap et al., 2001). The innermost ring is here set to have an outer radius of 10 m (0–10 m) and the outermost an outer radius of 464 km.
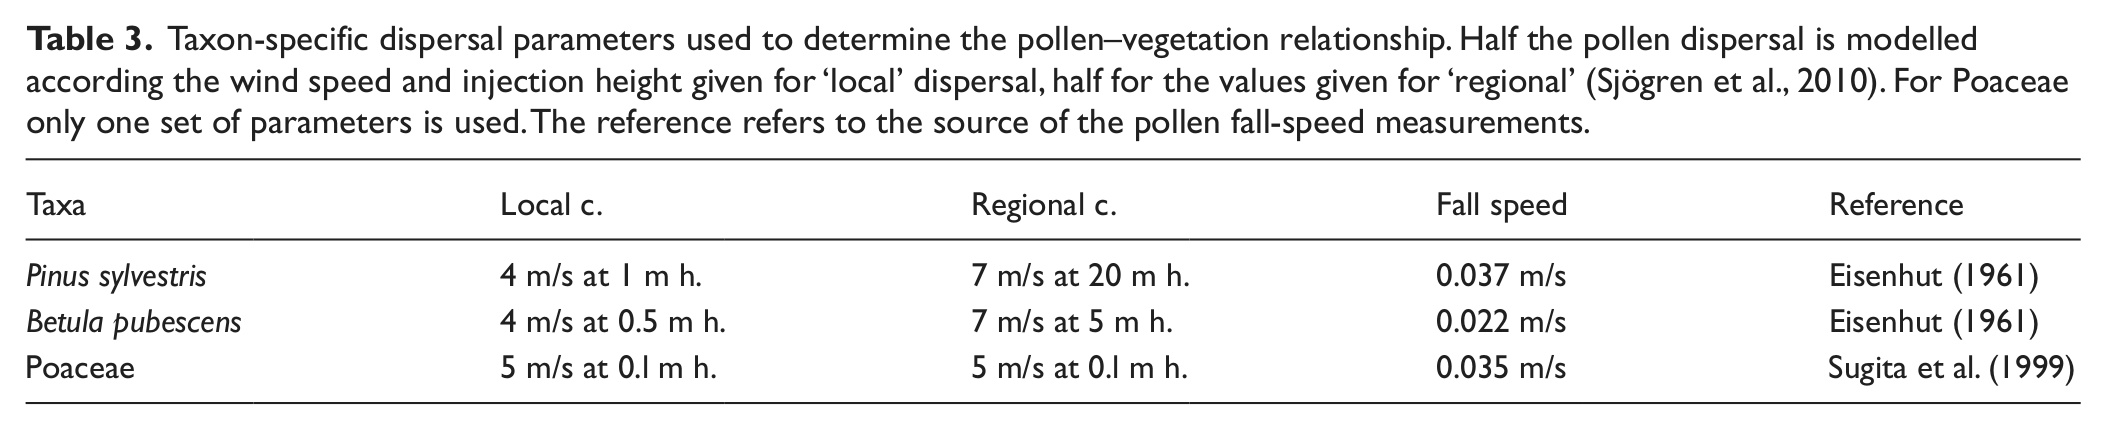
For the distance weighting following Sutton’s equation the basic assumptions are the same as in Prentice model for pollen dispersal-deposition (Prentice, 1985; Sugita 1994) with the following exceptions: (1) maximum distance for pollen dispersal is 464 km; and (2) pollen is released from an elevated source. Distance-weighted plant abundances for Pinus sylvestris and Betula pubescens were determined with composite dispersal functions (CDFs, Sjögren et al., 2010) based on Suttons’s equation (Sutton, 1953; sensu Prentice 1985). Owing to the low number of modern samples the dispersal parameters could not be determined empirically based on the present data set and were inferred from other investigations. For Pinus sylvestris the same height and wind parameter values as suitable for Picea abies (Sjögren et al., 2010) were applied. For the shorter Betula pubescens lower heights were used. The dispersal function for grass is based on preliminary results based on pollen-trap data in the Alps (Sjögren et al., unpublished data, 2012). The specific dispersal parameter values used are presented in Table 3. When applied to the vegetation data the dispersal function only explains 77%, 64% and 85% of the theoretical pollen deposition from Pinus, Betula, respectively Poaceae. Part of this is pollen that according to the dispersal function should derive from outside 464 km and part is caused by the relatively low number of rings applied. In order to compensate a proportional increase of DWPA at all distances was applied so the equation theoretically explained 100% of the pollen deposition within 464 km.
Taxon-specific dispersal parameters used to determine the pollen–vegetation relationship. Half the pollen dispersal is modelled according the wind speed and injection height given for ‘local’ dispersal, half for the values given for ‘regional’ (Sjögren et al., 2010). For Poaceae only one set of parameters is used. The reference refers to the source of the pollen fall-speed measurements.
Results
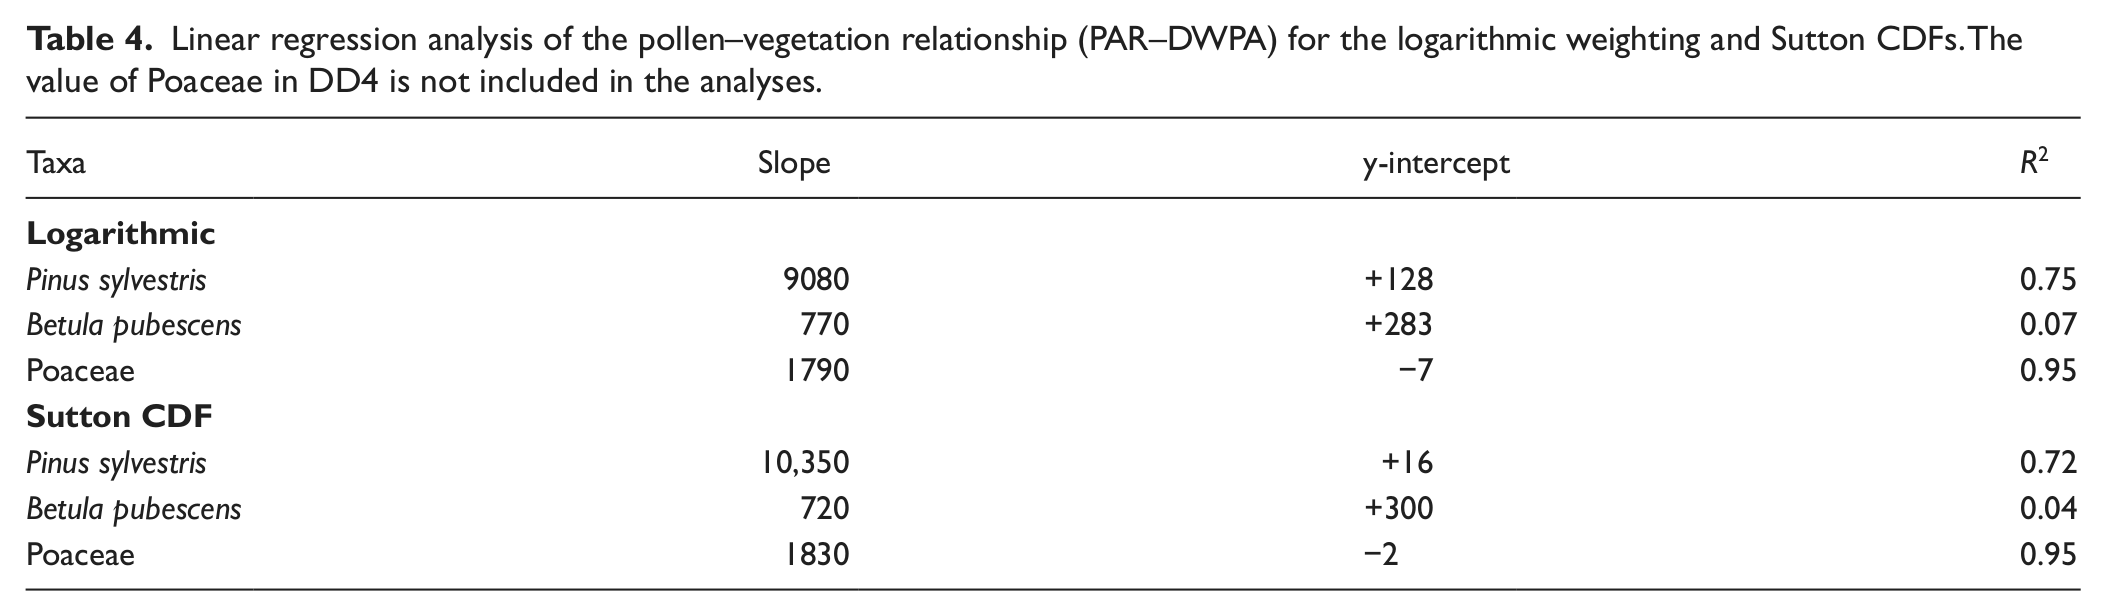
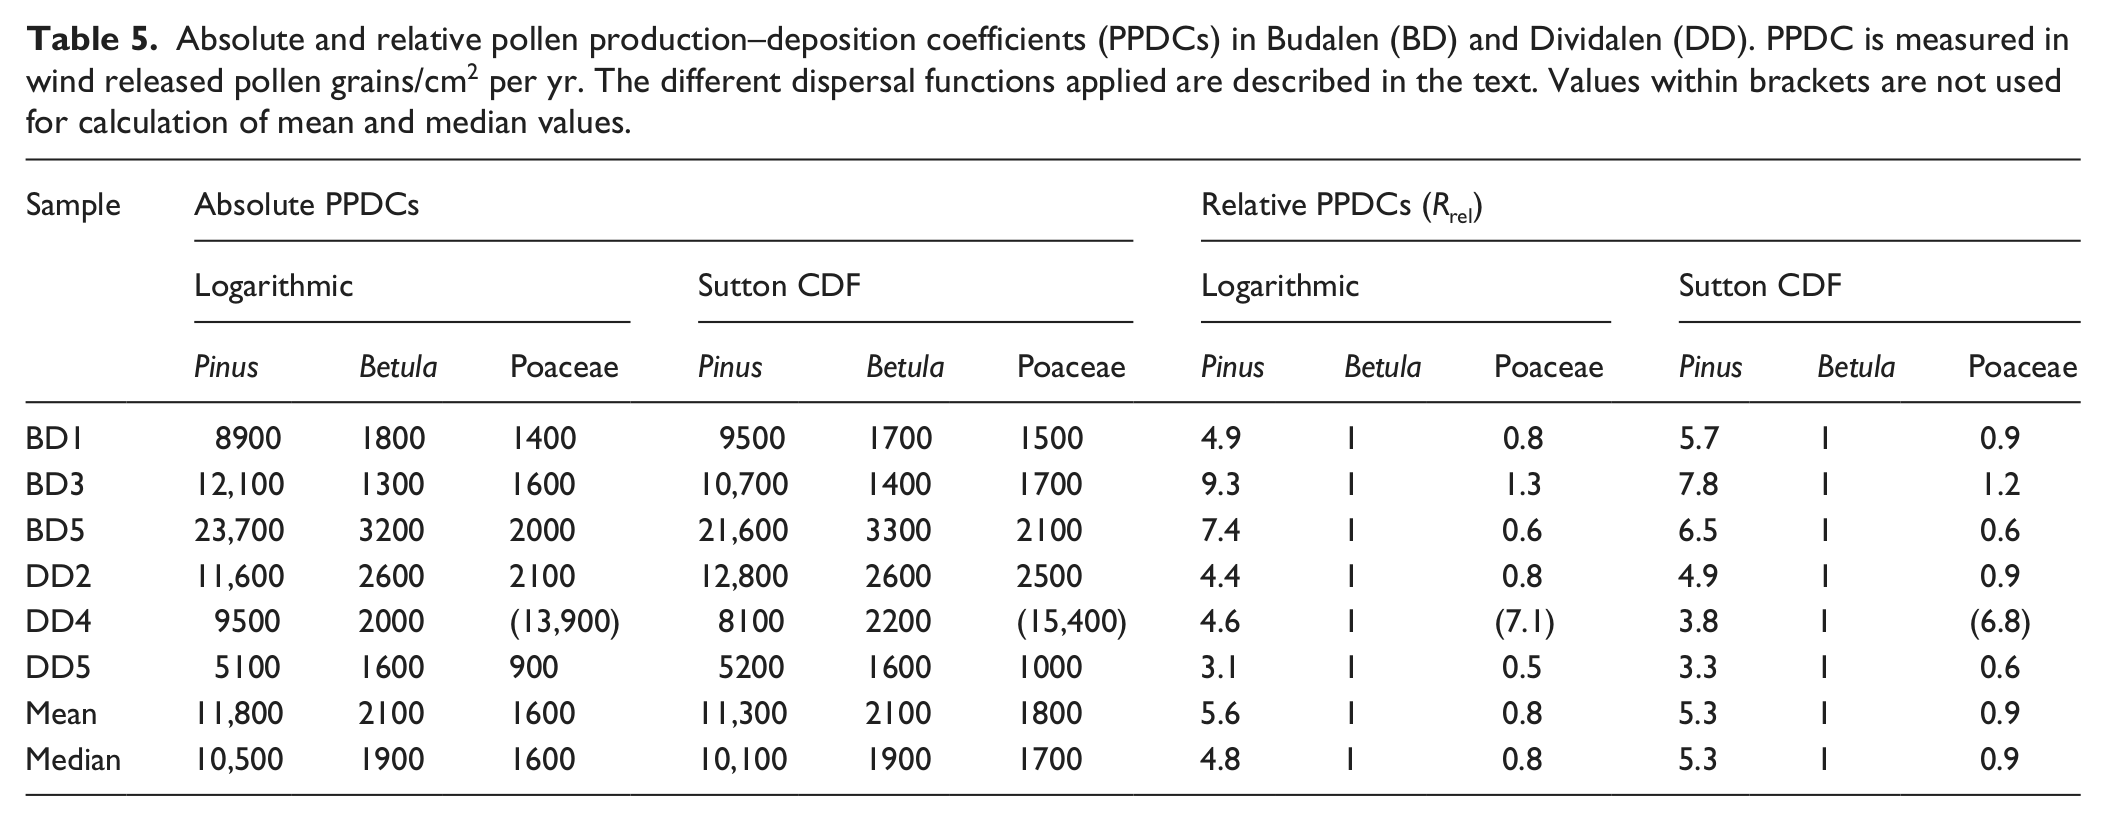
Linear regression analyses of the pollen–vegetation relationship based on Sutton’s equation gives a very high correlation for Pinus sylvestris and Poaceae, which suggests that the applied dispersal parameter values are correct, see Figure 2 and Table 4. The linear pollen–vegetation relationship for Betula pubescens is, on the other hand, poor and it is not possible to determine a reliable y-intercept value. One reason may be that the samples only cover a narrow range of DWPA (0.11–0.16) and thus make the regression analysis sensitive to small, random variations. A regression line with a zero y-intercept, as ideally should occur when the correct dispersal parameter values are applied (Sjögren et al., 2010), does not look less likely than any alternative when applied to the Betula scatter plot (see Figure 2). Still, the unexplained variations in PAR are large and even though the assumed dispersal parameter values may be correct this cannot be verified, so some caution concerning the results are required. The logarithmic dispersal function provided a very similar pollen–vegetation relationship. Pollen productivity-deposition coefficients (PPDCs) are presented in Table 5. The mean value for all sites, although based on a low number of sites, provides preliminary estimates of the absolute pollen productivity. Based on Sutton’s equation these are: Pinus sylvestris 11,300 ± 2300 (SE) grains/cm2 per yr; Betula pubescens 2100 ± 300; Poaceae 1800 ± 200; and based on the logarithmic weighting: Pinus sylvestris 11,800 ± 2600 (SE) grains/cm2 per yr; Betula pubescens 2100 ± 300; Poaceae 1600 ± 200.
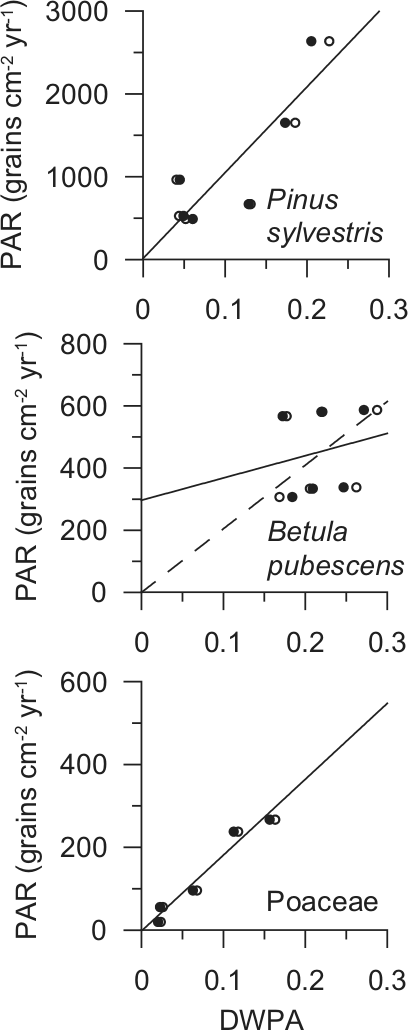
Scatter plots and linear regression of the pollen–vegetation relationship. Black dots show the relationship derived from Sutton’s equation and open circles from logarithmic weighting (see text for details). Linear regression is based on the results derived from Sutton’s equation. The dashed line in the Betula pubescens graph shows linear regression through origin. DWPA: Distance weighted plant abundance (dimensionless).
Linear regression analysis of the pollen–vegetation relationship (PAR–DWPA) for the logarithmic weighting and Sutton CDFs. The value of Poaceae in DD4 is not included in the analyses.
Absolute and relative pollen production–deposition coefficients (PPDCs) in Budalen (BD) and Dividalen (DD). PPDC is measured in wind released pollen grains/cm2 per yr. The different dispersal functions applied are described in the text. Values within brackets are not used for calculation of mean and median values.
Discussion
In the present investigation bomb-pulse dated mini moss-monoliths were used to achieve modern PAR values. If only average values over time are of interest this is a faster and more flexible method compared with using pollen-traps. However, the mini moss-monolith PAR method is not without potential problems. In the present investigation most samples turned out to be younger (5–8 yr) than the intended 20–30 yr. The ideal sampling depth would achieve dates in the 1980s, well after the 1963 bomb-peak and still a decent decline in 14C activity. Shorter time periods would give relatively higher error in age determination and less reliable average values as the year-to-year variation in pollen deposition is large (cf. van der Knaap et al., 2010). Still, 5–10 years of measurement is considered an acceptable minimum for reliable mean values of pollen deposition (Hicks, 2001; Hicks and Hyvärinen, 1999). Surface moss/peat growth is notoriously difficult to judge and may vary greatly over the surface of a mire (Ohlson and Dahlberg, 1991), and predicting the optimal sampling depth is likely to be a lasting challenge when employing the present method.
A second problem is that reliable bomb-pulse based PARs, and thereby APPs, only can be derived from mires and lakes with rather fast, undisturbed growth/sedimentation rate. In some areas such locations may be scarce and thus limit the applicability of the method. On the other hand, many such localities when present are also suitable for studies of fossil pollen back in time. Locally derived PPDCs include site-specific pollen dispersal and deposition conditions and may thus prove a better pollen–vegetation relationship for interpreting fossil pollen data than regionally derived PP estimates. This assumes, of course, that dispersal and deposition conditions are constant through time.
Ideally all PPDCs for a taxon would be identical, although this is of course impossible to achieve in practice. In the present investigation the main question is whether the observed variance can be attributed to dating error or not. Compared with single site measurements based on pollen-trap data (Filipova-Marinova et al., 2010; Sjögren et al., 2010) the present variation seems to be low and that dating errors have no major impact on the result. The exception might be DD5, which has much lower PPDCs for all three taxa, suggesting that the dates might be too old. This was also the oldest date – 1984. An alternative explanation would be that the 2000s contained more years with high pollen productivity than the 1980s and 1990s, which could have caused the discrepancy. Another diverging PPDC is the very high values for Poaceae in DD4, most probably caused by abundance of grass on the mire surface. This sample is so extreme that it has been treated as an outlier. The Pinus and to some degree Betula value in BD5 also seems too high. This sample is from the upper end of the valley and it is possible that there is some tunnel or pass effect that brings undue amounts of pollen up from the Pinus-rich lower part of the valley (cf. Julierpass-See (JUL-2) in Sjögren et al., 2008b). Unexplained high amounts of Pinus pollen can also be seen in the fossil material from the site (Solem et al., 2012).
The two dispersal functions applied resulted in similar PPDCs, and it seems the dispersal parameters applied to Sutton’s equation resulted in a weighting of vegetation not much different from the logarithmic. The largest difference between taxa is found in Poaceae, and the main reason for this is probably that the logarithmic dispersal function underestimate local (<20 m) dispersal of herb pollen. So for establishment and use of non-local (>20 m) APPs logarithmic weighting (sensu van der Knaap et al. 2001) of vegetation might be a simpler and more practical alternative than more advanced functions and models, especially if the dispersal parameters of the taxa used are unknown. The exception would be if the data set includes very heavy pollen such as Larix, which the logarithmic weighting does not handle well (Sjögren et al., 2008a). When it comes to Sutton’s equation it is questionable if it performs optimally for dispersal of very light pollen such as Betula (fall-speed 0.022 m/s). A substantial part of the Betula pollen, according to Sutton’s equation, derives from outside 464 km, much more than Pinus despite the much lower injection heights applied (theoretically 30% of the Betula pollen disperse further than 464 km, compared with 20% for Pinus). This is counter-intuitive to the general concept among many palynologists that Pinus pollen disperses very well and is found in high numbers at great distances. According to Lagrangian stochastic modelling of pollen dispersal all particles with a fall speed below 0.04 m/s tend to disperse similarly (Kuparinen et al., 2007; Theuerkauf et al., 2013). It could be argued that Sutton’s equation for pollen dispersal would provide more accurate results if a minimum fall speed of, e.g., 0.04 was introduced. Another question is how well Sutton’s equation (as applied here) performs at very large distances (>500–1000 km). Even though large numbers of pollen could travel far, the amount is likely overestimated by the equation as wind direction will change and dispersal may be terminated by rain or by calmer condition during the night (cf. Sjögren et al., 2010). For modelling extra–regional pollen dispersal using Sutton’s equation it may thus give more accurate results if one imposes a maximum dispersal distance as done here, although it can be discussed if this should be 464, 1000 or 2000 km. Of course there is also a practical dimension to this, i.e. the availability and quality of vegetation data.
Compared with pollen-trap based APP estimates in the Alps (Sjögren et al., 2010) and the Black Sea region (Filipova-Marinova et al., 2010) the present moss-sample based PPDCs seem low, although there is no direct overlap in taxa so it is difficult to draw any clear conclusions. Pollen-trap based APP estimates of Pinus and Betula from northern Finland (Sugita et al., 2010) are indeed higher than the present (Pinus 19,500 grains/cm2 per yr, Betula 3000), although this could well be an effect of the different pollen dispersal-deposition models and functions applied (cf. Theuerkauf et al., 2013). It has been reported that Pinus often is over-represented in moss samples compared with pollen traps (Lisitsyna et al., 2012; Pardoe et al., 2010; Räsänen et al., 2004). This may of course also be true of the present samples, and future studies including overlapping taxa and using comparable pollen dispersal-deposition models and functions may prove this. The present method for moss-sample based PARs also opens for sampling close to existing trap locations for direct comparison.
Footnotes
Acknowledgements
I would like to thank Thyra Solem, Mark Daverdin, Gunnar Austrheim and Andreas Kirchhefer for support during field work, with maps and/or local conditions. The vegetation maps have been made available by the Norwegian Forest and Landscape Institute and the Norwegian Directorate for Nature Management. Many of the ideas developed in the present report have their roots in the POLLANDCAL network 2001–2005 (the Nordic Research Council) and the contribution from its members is acknowledged. I am grateful to Martin Theuerkauf and an anonymous reviewer for corrections and valuable comments on the manuscript.
Funding
This investigation is part of the DYLAN – How to manage dynamic landscape? project funded by the Research Council of Norway (190044/S30).