



Abstract
Past vegetation assemblages, preserved in peat layers, are one of the key proxies when reconstructing historical peatland dynamics. Northern peatlands can be divided into two main types: fens and bogs. Compared with bog peat, the fen peat is usually more decomposed because of different eco-hydrological conditions and effective humification processes. A high level of decomposition hampers reliable identification of plant remains and constrains palaeoecological approaches. Biogeochemical studies on bog plants and bog peat have shown that plant group–specific biomarkers can be applied to identify fossil plants or plant groups from peat, given the identification of plant group–specific markers in living fen plants. In this study, we applied plant macrofossil, biomarkers and multivariate statistical analyses to two mid-boreal peat sequences to investigate whether biomarkers can be applied to distinguish fen and bog environments and whether plant-specific biomarkers can be identified from fen peat. Macrofossil analyses clearly separate dry bog hummocks, moist lawns and wet fen habitats apart. Corresponding division emerged when the biomarker data were combined with the macrofossil data. Moreover, we succeeded to separate bog and fen habitats apart by the changes in n-alkane and the n-alkane ratio distributions along the cores. The fen–bog transition zone was indicated by high sterol and triterpenoid concentrations and changes in degradation measures. However, it remains a challenging task to attain species-level information of past plant assemblages from highly humified fen peat layers based on biomarkers only.
Introduction
Peatlands can be divided into two main types – fens and bogs – with the main factor controlling the peatland type and the occurrence of species being the ecohydrology, that is, the quantity and quality of water (Økland et al., 2001; Wheeler and Proctor, 2000). Fens are relatively shallow, and they receive water and nutrients from the underlying and surrounding mineral soils, groundwater and atmosphere (Rydin et al., 2006). Various sedge species, forbs, minerotrophic Sphagna (e.g. Sphagnum subsecundum and Sphagnum riparium) as well as brown mosses such as Warnstorfia spp. dominate fen habitats. In contrast, because of effective peat formation and the consequential increase in height of the peat surface, bogs are nutrient poor as they receive water and nutrients only through precipitation, maintaining plants, including hummock Sphagna (e.g. Sphagnum fuscum), dwarf shrubs, lichens and true mosses (e.g. Pleurozium schreberi and Polytrichum spp.) (Rydin et al., 2006). The different environmental conditions in terms of the level of acidity, nutrient status and water table level mean that raised bog peats in boreal region usually contain less-humified peat, while in groundwater-fed less acidic fen environments, biomass decay is much faster and highly humified peat layers are formed (Moore et al., 2007).
Peatlands play an important role in atmospheric carbon cycling. Northern peatlands alone are estimated to store 547 (473–621) Pg organic carbon (Yu et al., 2010); yet, simultaneously, peatlands are a natural source of CH4 to the atmosphere (Matthews, 2000). As different peatland habitats and their vegetation, even within one peatland complex, have a vital role in the carbon budget of the peatland (e.g. Riutta et al., 2007), and the fact that bryophyte-dominated and vascular plant–dominated communities differ in their CO2 and CH4 dynamics (Laine et al., 2007; Levy et al., 2012), it is important to be able to separate different habitats when reconstructing peatland dynamics back in time (Yu et al., 2013). Historical peatland habitats are preserved in peat layers as decomposed plant remains and form a key proxy when reconstructing the carbon budget of the peatland or historical climatic conditions (e.g. Barber et al., 1998; Mauquoy et al., 2002a, 2002b; Tuittila et al., 2007; Väliranta et al., 2007). Because of natural peatland succession towards ombrotrophic conditions driven by peat height growth, minerotrophic fen peat layers are likely deposited under most of the southern boreal raised bogs (Frolking et al., 2010). Moreover, most of the high-latitude peatlands are still the fen type of peatlands (e.g. Turunen et al., 2002), and in these environments, the lack of identifiable plant remains may hamper palaeoecological and climatological reconstructions.
Recently, organic geochemistry analyses have shown that the lipid fractions of plants contain biomarkers for identifying different plant species and plant groups from peat archives. Studies on bog peat environments have shown that plant group–specific chemical compounds can be applied to identify fossil plants or plant groups from peat (e.g. Avsejs et al., 2002; Bingham et al., 2010; Jia et al., 2008; McClymont et al., 2008; Xie et al., 2000). The most widely analysed compounds have been the n-alkanes: for instance, the difference between concentrations of mid-chain length (n-C23 and n-C25) and long chain length (n-C29 and n-C33) n-alkanes have been used to separate contributions of Sphagnum and vascular plant species in the peat (e.g. Andersson et al., 2011; López-Días et al., 2010; Nichols et al., 2006; Ortiz et al., 2011; Pancost et al., 2002; Ronkainen et al., 2013; Vonk and Gustafsson, 2009). Furthermore, the n-C23/n-C25 alkane ratio has been successfully used in tracking changes in S. fuscum abundance in a peat section from Finland (Bingham et al., 2010).
Thus far, in environmental reconstructions, biomarker analyses have focused on bog peats and plants typical to bogs. However, a pertinent question remaining is whether such plant-specific biomarkers could also provide information about the past plant assemblages in fen environments characterized by highly humified peat, where macrofossil remains are heavily degraded and thus essential information for environmental reconstruction is lost. Some previous studies have applied ‘bog’ biomarker analyses throughout the peat profile, including the fen peat section underlying the bog peat section (e.g. Andersson and Meyers, 2012; Andersson et al., 2011). However, our recent study of the n-alkane concentrations, n-alkane ratios and sterol distributions of moss and vascular plant species typical to fen habitats showed differences between some of the biomarker distributions between plant species characteristics to bogs and fens (Ronkainen et al., 2013). As in previous studies on bog plants (Baas et al., 2000; Ficken et al., 1998; Nichols et al., 2006; Pancost et al., 2002), fen Sphagnum species were also dominated by mid-chain n-alkanes and the above ground parts of fen vascular plants by long-chain n-alkanes. However, results showed similarity in the dominating n-alkanes of Sphagnum species and below-ground parts of sedges in studied fen plants, and thus, applying n-alkane ratios from bog plants to fen peats could result in incorrect interpretations about the actual proportions of these plant groups in peat (Ronkainen et al., 2013). Similar mid-chain n-alkane distributions in vascular plant roots were also reported by Huang et al. (2011). The similarity of n-alkane distributions in Sphagnum species and vascular plant below-ground parts suggest that the n-alkane ratios that have predicted different plant groups in bog environments relatively well (e.g. Andersson et al., 2011; Bingham et al., 2010) may not be directly applicable to interpret past habitats in environments where sedges dominate and sedge roots form an important peat component. One potential way to overcome this problem could be to combine the distributions of plant group–specific n-alkanes, n-alkane ratios and sterols, if present, when analysing the biomarker data (Ronkainen et al., 2013). The degradation of the plant matter and their chemical compounds could impede detection of especially sterols from the fen–bog transition and fen environment, where the peat is usually highly humified. The level of organic matter decomposition can be studied by comparing the variations in C/N ratio and the amount of total organic carbon (TOC) through the peat section (Kuhry and Vitt, 1996). In addition, the ratio between 5α(H)-stanols and Δ5-sterols can be used to infer the rate of sterol degradation because 5α(H)-stanols are known as degradation products of the Δ5-sterols. A high 5α(H)-stanols and Δ5-sterols ratio is related to anoxic conditions, shallow water table level and high rate of degradation (Bertrand et al., 2012). The level of degradation can also be estimated by n-alkane carbon preference index (CPI) value, where high CPI value is linked to high amount of well-preserved plant material (Andersson and Meyers, 2012; Xie et al., 2004).
In this study, we analysed fossil plant and biomarker compositions of two peat sections. We concentrated on the fen–bog transition phase where the plant composition is known to change (e.g. Dudová et al., 2013; Loisel and Yu, 2013; Tuittila et al., 2013). We aimed to investigate (1) whether biomarkers can be applied to distinguish fen and bog environments and (2) whether plant-specific biomarkers can be identified from fen peat. For this, we applied plant macrofossil analysis to examine the past plant compositions from the same subsamples from which the selected organic geochemical analyses were obtained.
Material and methods
Sampling
Two peat sections (SJ5 and SJ6) were collected from two closely located peatlands in Siikajoki (64°45′N, 24°42′E) located near west coast of Gulf of Bothnia, Baltic Sea, in the mid-boreal bio-climate zone in Finland (Figure 1). A chronosequence of terrestrial ecosystems from coast to inland has been created by the postglacial isostatic uplift and along the sequence peatlands alternate with sand dunes and glaciofluvial ridges (Tuittila et al., 2013). We have previously studied vegetation, microbial communities and carbon dynamics along a transect of seven mires (SJ0–SJ6; e.g. Laine et al., 2011; Larmola et al., 2014; Leppälä et al., 2011a, 2011b; Tuittila et al., 2013). In this study, we concentrated on the two oldest sites of the transect, and in particular on their sediment sections where fen–bog transition occurred, and from which historical plant communities had already been studied (Tuittila et al., 2013). Site SJ5 represents a peatland stage where the fen–bog transition is still partly in progress; vegetation is a mosaic of wet fen communities and drier bog communities, the average water table level is at 12 cm below moss layer surface and the basal age of the peatland is c. 2500 years. The peat core was taken from a drier surface dominated by lawn species (Sphagnum magellanicum). Site SJ6 is already a true bog with vegetation formed by hummock Sphagna and dwarf shrubs, average water table level 32 cm below moss surface and the basal age of 3000 years (both cores basal ages are extrapolated from known land-uplift rate). The top section of the peat core was dominated by hummock species (S. fuscum). More detailed site descriptions can be found in Leppälä et al. (2011a) and Tuittila et al. (2013). The sampling depth for SJ5 was 6–150 cm, and for SJ6 it was 0–100 cm. Both cores were cut into 2-cm sample slices and analysed with a varying down-core resolution focused on the fen–bog transition.

Location of the study site. Samples were collected from two closely situated peatlands from the Siikajoki commune (64°45′N, 24°42′E), Finland, Northern Europe.
Plant macrofossil analyses
Plant macrofossil sample volume was 5 cm3. Samples were rinsed under running water using a 140-µm sieve, and no chemical treatment was needed. Remains retained on the sieve were identified, and the percentage in volume of macrofossil remains within the total composition of the sample was visually estimated by using a stereomicroscope (magnification of 10×; e.g. Mauquoy and van Geel, 2007; Speranza et al., 2000; Väliranta et al., 2007 and references therein). If the proportion of bryophytes exceeded 10% of the total sample volume, a high-power light microscope was used to identify bryophyte species and to count proportions for different bryophyte species. Also, the proportion of unidentified organic matter (UOM) from samples was estimated.
Solvent extraction
Peat samples for solvent extraction were freeze dried and ground following the same procedure in Ronkainen et al. (2013). Lipids were extracted from c. 0.2 g of samples using repeated ultrasonication (20 min) with 6 ml CH2Cl2/MeOH (3:1, v/v). Samples were saponified with 0.5 M methanolic (95%) NaOH for 2 h at 70°C, and the neutral lipids were extracted using hexane. The neutral lipids were further separated into apolar and polar compounds using activated Al2O3 columns, eluting with hexane/CH2Cl2 (9:1, v/v) and CH2Cl2/MeOH (1:2, v/v), respectively. Prior to analysis using gas chromatography (GC) and GC-mass spectrometry (GC-MS), the polar fractions were derivatised using bis(trimethylsilyl)trifluoroacetamide (Sigma–Aldrich).
GC-MS
Apolar and polar fractions were analysed using GC-MS with a gas chromatograph equipped with flame ionization detection (GC-FID) and split/splitless injection (280 C). Separation was achieved with a fused silica column (30 m × 0.25 mm inner diameter) coated with 0.25 µm of 5% phenyl methyl siloxane (HP-5MS), with He as carrier gas, and the following oven temperature program: 60–200°C at 20°C/min, then to 320°C (held 35 min) at 6°C/min. The mass spectrometer was operated in full-scan mode (50–650 amu/s, electron voltage 70eV, source temperature 230°C). Compounds were assigned using the NIST mass spectral database and comparison with published spectra (e.g. Goad and Akihisa, 1997; Killops and Frewin, 1994). Quantification was achieved through comparison of integrated peak areas in the FID chromatograms and those of internal standards of known concentration (5-α-cholestane for apolars and 2-nonadecanone for polars). Biomarker concentrations were normalized to TOC content and are presented here as concentration per gram TOC, so that samples with different extent of degradation become comparable (Meyers, 2003; Ortiz et al., 2010). TOC and total organic N2 were measured by the CHN elemental analysis, where 1–2 mg dried and ground sample was combusted at 950°C with He as a carrier gas. The reduction of the combustion gases was carried out in a separate furnace, separated into individual components on a temperature-programmed desorption column and fed into a thermal conductivity detector. Results were computed as concentrations of C and N2 from the detector signal.
Statistical analysis
We applied multivariate analyses to study the variation within the plant macrofossil and biomarker data (triterpenoids, sterols, stanols, n-alcohols (C20–C28) and n-alkanes (C20–C35; µg/g TOC), and n-alkane ratios, see the Supplementary Data Table 2, available online). For the analyses, we combined macrofossil and biomarker data from both cores by depth.
We first quantified separately the variation in macrofossil plant species and biomarkers within the peat profiles by unconstrained (indirect) gradient analysis. For macrofossils, we used detrended correspondence analysis (DCA), where detrending was conducted by segments. All identified macrofossils were included in the analysis, with down-weighting of rare species. Macrofossil data were log transformed. For biomarkers, we used principal component analysis (PCA) with centred and standardized data. All biomarkers occurred in sufficient concentrations to be included in the PCA. Second, for the biomarker data, we conducted redundancy analysis (RDA), a constrained (direct) gradient analysis, to test whether the variation in biomarkers in the peat profiles correlates with the variation in macrofossil data. For the analysis, we applied the sample scores along the first and second macrofossil DCA axes as explanatory variables. As with the PCA, the biomarker data were centred and standardized. All constrained axes were tested with unrestricted Monte Carlo permutation (number of permutations = 499). Multivariate analyses were conducted by using Canoco for Windows 4.52 (ter Braak and Šmilauer, 2002). The correlation of the 10 most significant biomarkers identified in RDA with depth and UOM was analysed with Pearson two-tailed correlation using SPSS PASW statistics 18.
We applied TWINSPAN (Two Way INdicator SPecies ANalysis, Twinspan for Windows 2.3) to define groups of macrofossils and biomarkers that share a similar abundance peak in the peat profile. For the analysis, we rescaled the abundances for each macrofossil and biomarker from 0 to 1 by setting the highest abundance of each unit to 1 and calculating other values as a percentage of the highest abundance of the unit. In the analysis, we used five cut levels (0.0, 0.2, 0.4, 0.6 and 0.8) of abundance and two division levels, which determines the maximum level of recursive splitting for samples and for species (Hill and Šmilauer, 2005). The statistical analyses allow us to assess the relationship of the biomarkers to the macrofossil record and to determinate whether macrofossils and biomarkers can separate different environmental habitats as individual or rather as combined proxies.
Results
Macrofossil analyses
Sub-fossil plant assemblages revealed clearly the vegetation succession from fen to bog stage (Figure 2). Core SJ5 showed dominance of higher plants (Menyanthes trifoliata, Scheuzeria palustris, Equisetum sp.) in the earliest stage of the succession (150−100cm). In core SJ6, these plants were present, but they did not dominate (100−80 cm). In both of the studied cores, the transition from fen to bog environment is both identified and induced by the appearance of Eriophorum sp. and sedge roots followed by a distinctive occupation of Sphagnum mosses at the depth of 40−20 cm in SJ5 and 75−55 cm in SJ6.

Plant macrofossil records of cores SJ5 and SJ6. Macrofossil abundances are expressed as proportions (%). The fen–bog transition zone is marked with grey bar.
The DCA for macrofossil data (cores SJ5 and SJ6 combined) sub-divided the peat samples into three different groups: fen species (SJ5 150−30 cm and SJ6 98–62 cm), lawn species (SJ5 26−6 cm) and hummock species (SJ6 60−0 cm). The first axis describing the fen–bog gradient explained 28% (eigenvalue 0.5298) of the variation in the data, and the second axis describing the moisture gradient on bog explained 18% (eigenvalue 0.3491) of the variation (Figure 3).

DCA results of the macrofossil data of cores SJ5 and SJ6. The first axis explains 28% (eigenvalue 0.5298), and the second axis 18% (eigenvalue 0.3491) of the variation in the macrofossil data. Species representing hummock, lawn and fen habitats are circulated.
Biomarker analyses
Apolar fraction
Figure 4a and b show the distribution of n-alkanes in both peat cores (SJ5 and SJ6). In both cores, there is up-core variation in both overall n-alkane concentration and the chain length of the dominant n-alkane. n-C27 dominated the bottom layers (150–36 cm) of SJ5, excluding layers 130−110 cm, which were dominated again by n-C23 and n-C25 alkanes, while the uppermost layers (32−0 cm) were mainly dominated by n-C23 and n-C25 alkanes. In the deepest layers (100−60 cm) in core SJ6, the dominant n-alkane alternated between n-C23, n-C29 and n-C31. The middle layers (60–40 cm) were dominated by n-C25, whereas the uppermost layers (30−0 cm) of core SJ6 were dominated by the n-C31 alkane. Different n-alkane ratios showed changes along the depth in both cores (Figure 5). In core SJ5, the ratios n-C23/n-C27, n-C23/n-C29, n-C31/n-C27 and n-C31/n-C29 showed differences along the core, separating the top and the bottom layers apart, all ratios being higher than 1 in top 25 cm. For core SJ6, several ratios were able to separate the top and bottom layers apart, for example, n-C23/n-C25 and n-C25/n-C23 indicated changes happening at 62 cm (Figure 5).

(a) n-alkane concentrations (µg/g TOC) of core SJ5 by depth. (b) n-alkane concentrations (µg/g TOC) of core SJ6 by depth. The fen–bog transition zone is marked with grey.
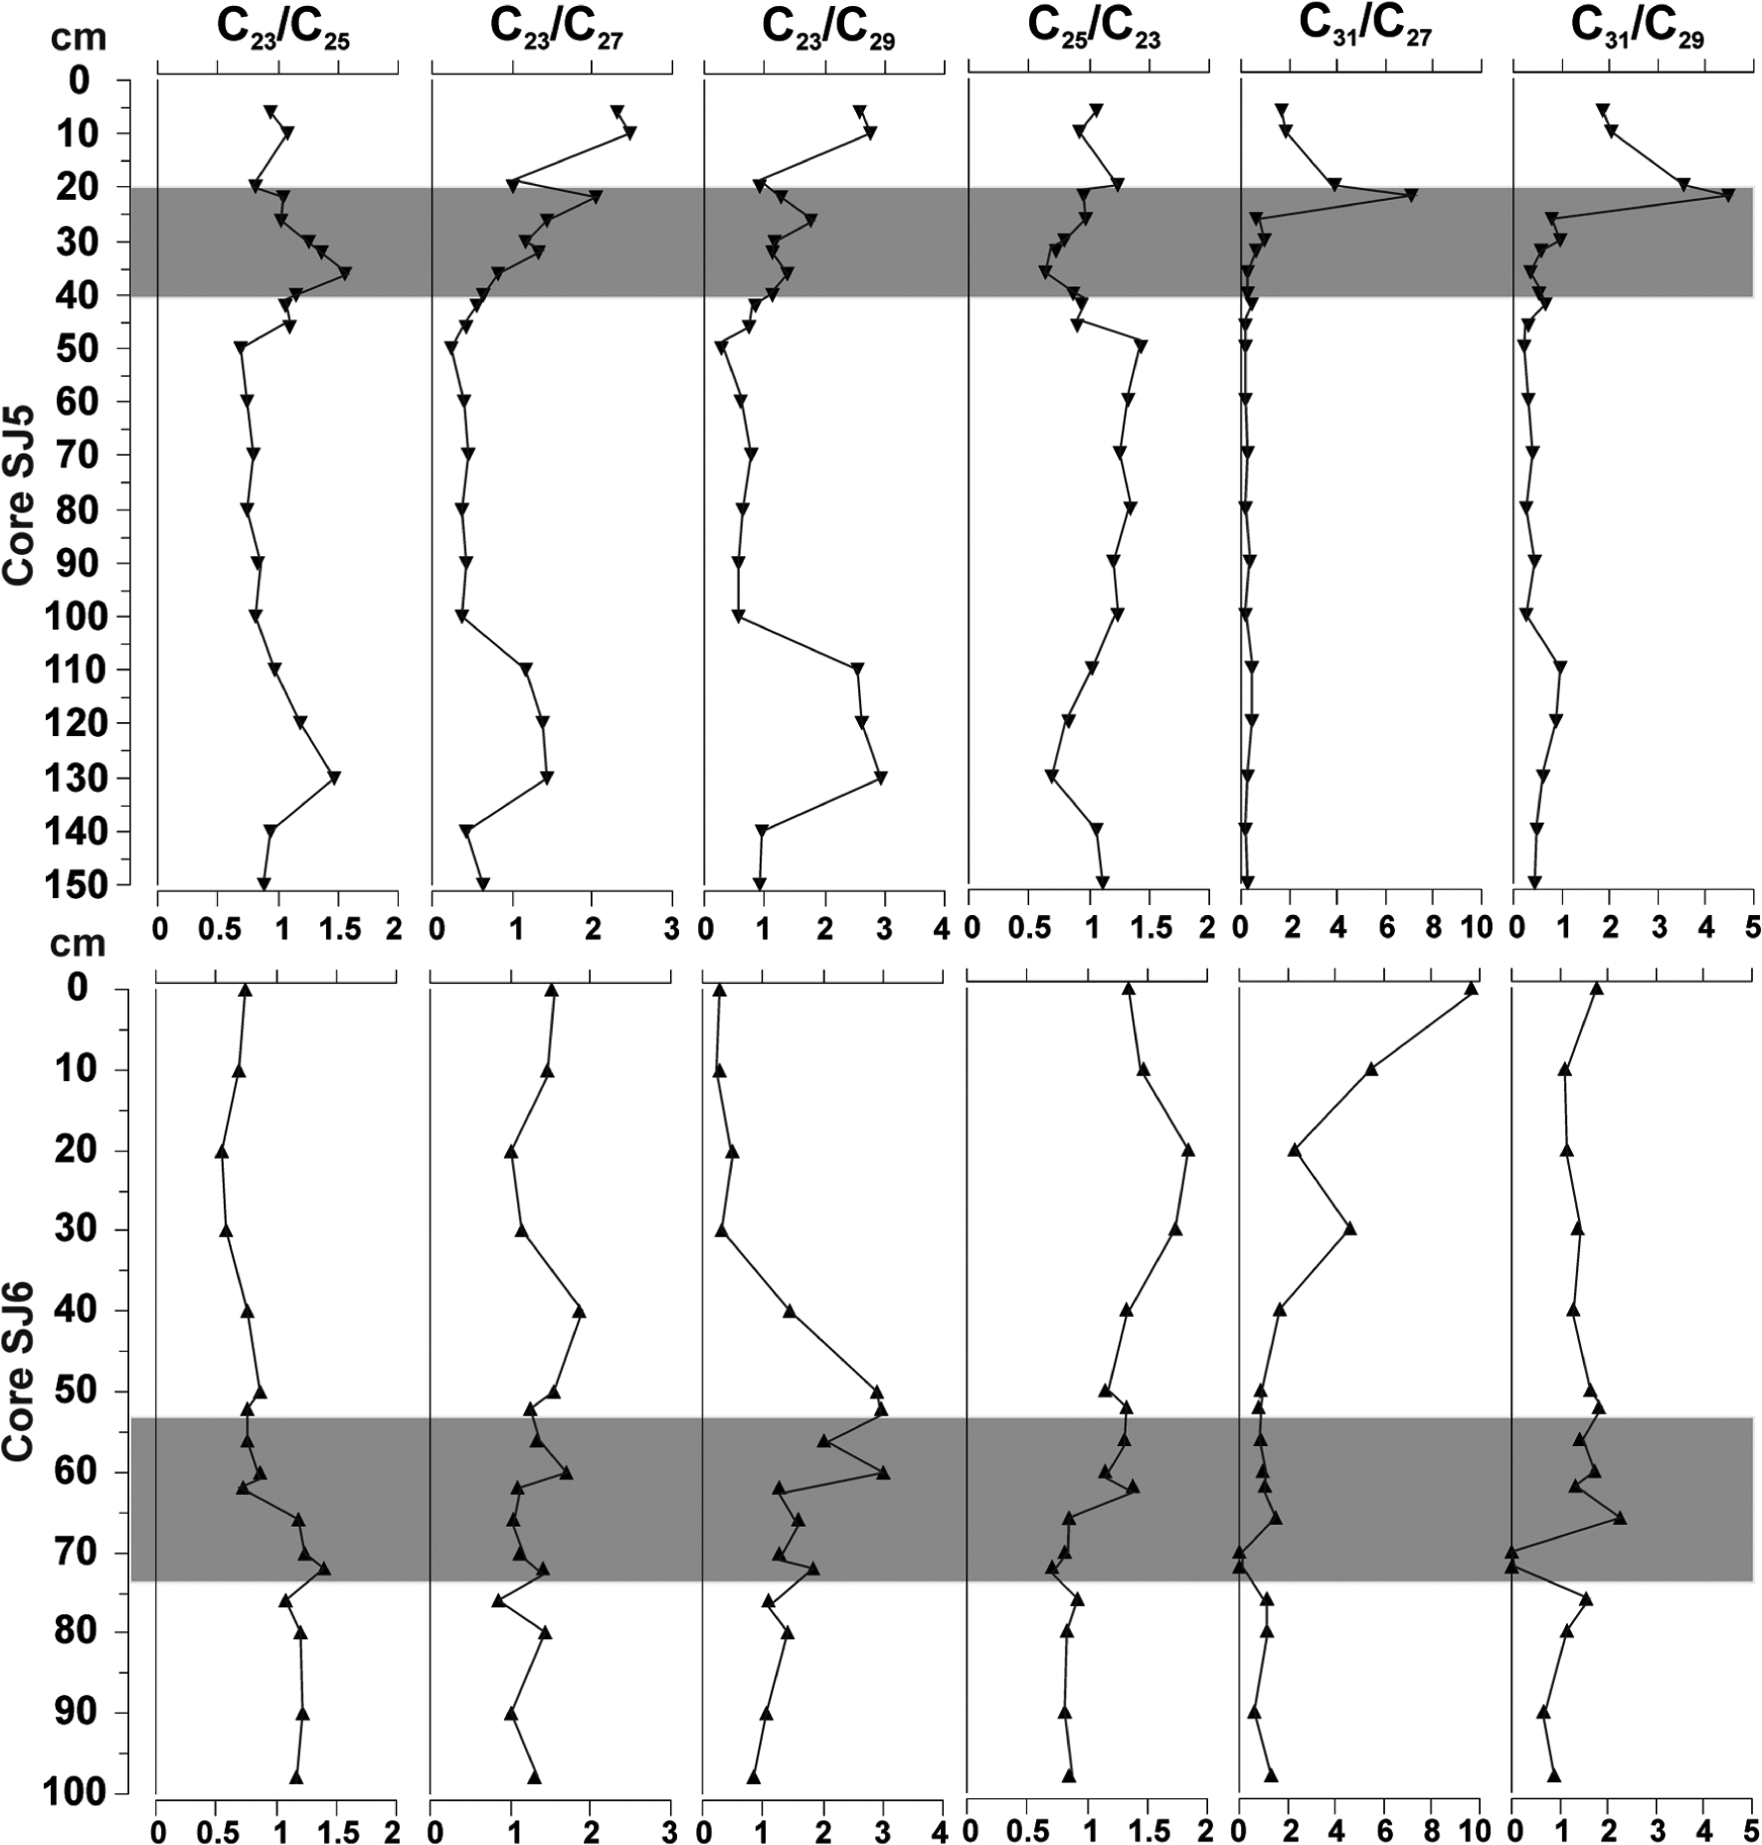
n-alkane ratios of cores SJ5 and SJ6. The fen–bog transition zone is marked with grey bar.
The distribution of the detected triterpenoids along the cores was similar for all compounds. In core SJ5 at depths 42–30 cm, the maximum concentrations of taraxer-14-ene (c. 60–720 µg/g TOC) and taraxast-20-ene (c. 50–500 µg/g TOC) were recorded. Squalene was identified only in upper layers, peaking at 30 cm (30 µg/g TOC). In core SJ6 at depths 80–66 cm, the maximum concentrations of taraxer-14-ene (260–1050 µg/g TOC) and taraxast-20-ene (500–1800 µg/g TOC) were recorded. Concentration of squalene was highest at 10 cm c. 140 µg/g TOC; down core, the concentration was c. 10 µg/g TOC (Figure 6). The highest concentrations of taraxer-14-ene and taraxast-20-ene coincided with high counts of sedge roots and UOM in the middle layers of both cores (Figures 2 and 6).
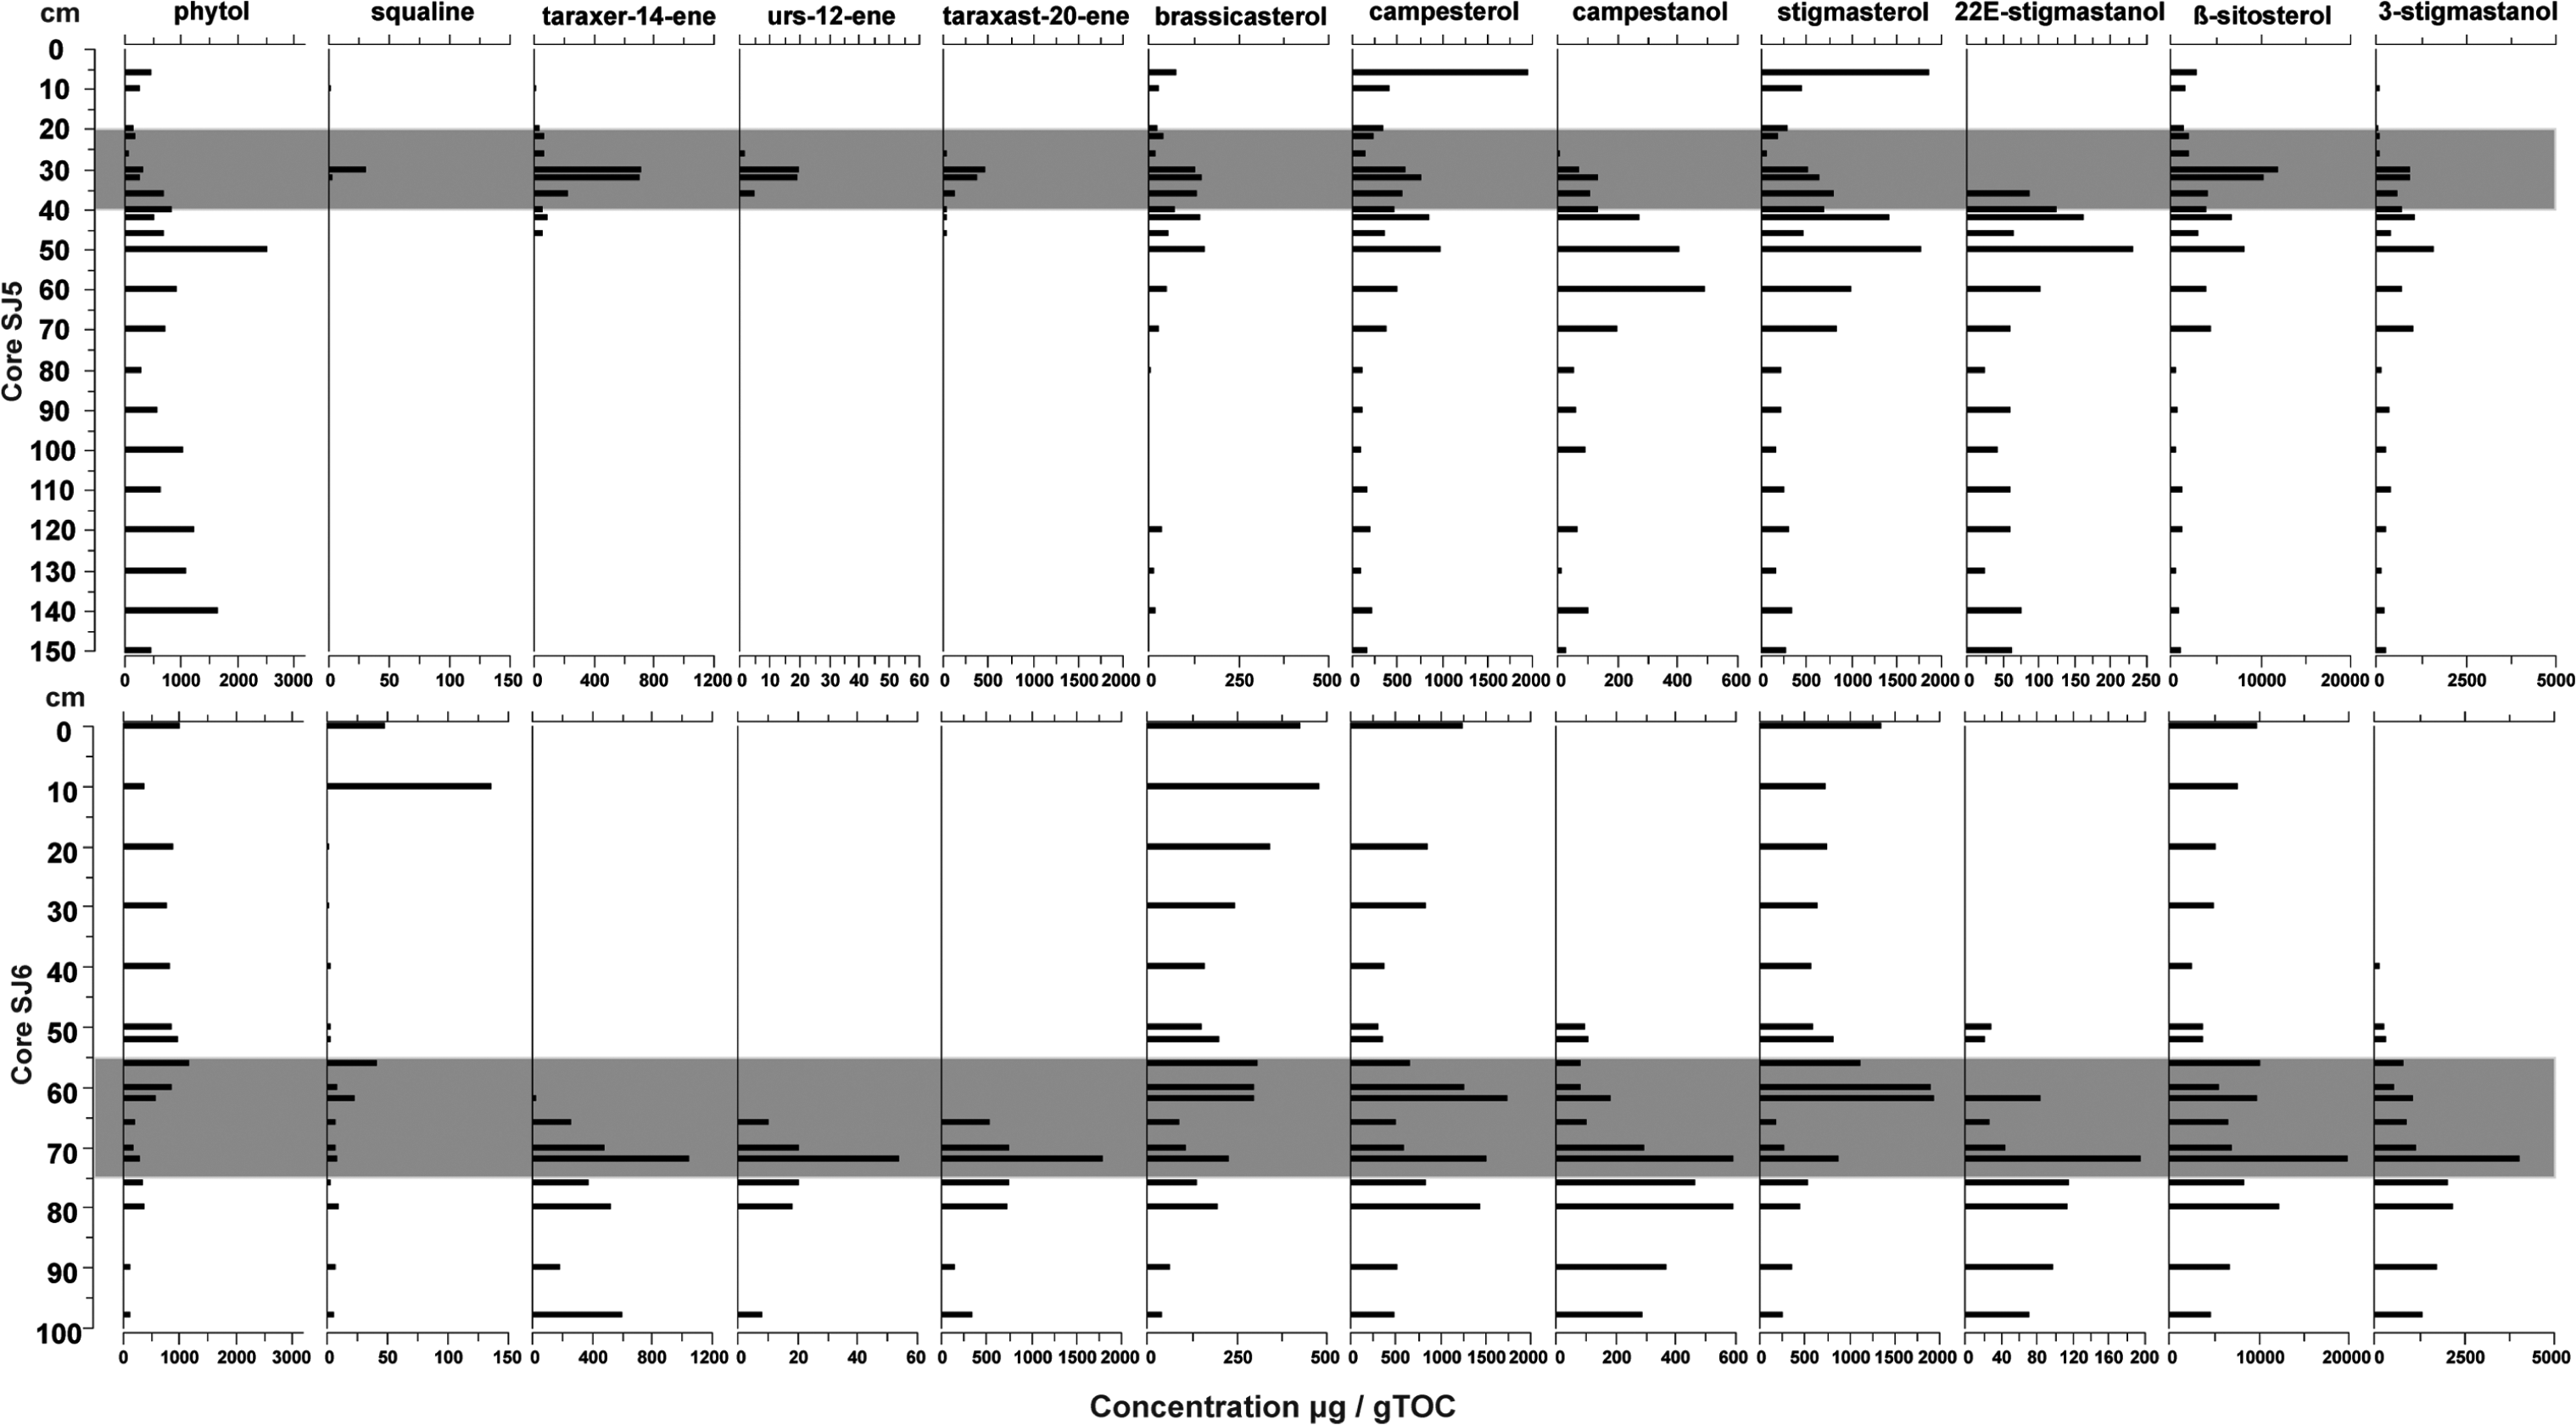
Concentrations (µg/g TOC) of triterpenoids, Δ5-sterols and 5α(H)-stanols in cores SJ5 and SJ6. The fen–bog transition zone is marked with grey bar.
Polar fraction
The most abundant sterols found from both cores were brassicasterol ((22E)-ergosta-5,22-dien-3β-ol), campesterol (campest-5-en-3β-ol), stigmasterol ((24E)-stigmasta-5,22-dien-3β-ol) and β-sitosterol ((3β)-stigmast-5-en-3-ol). The associated stanols of these sterols were also detected: campestanol (24-methyl-5α-cholestan-3β-ol), 22E-stigmastanol ((24-ethyl-5α-cholest-22-3β-ol)) and 3-stigmastanol ((24-ethyl-5α-cholestan-3β-ol)). In core SJ5, the concentration of brassicasterol was highest (c. 150 µg/g TOC) at 50–30 cm; below and above this depth, the concentration was less than 50 µg/g TOC, although concentrations increased in the uppermost 6 cm (80 µg/g TOC). The concentration of campesterol was also high in the uppermost 6 cm of core SJ5, reaching concentrations of c. 2000 µg/g TOC. Between 50 and 30 cm depth, the concentration of campesterol was c. 500–1000 µg/g TOC, and elsewhere in the core, the concentration was c. 100–470 µg/g TOC. Stigmasterol in core SJ5 had similar concentrations and pattern as campesterol, and while β-sitosterol also followed this same pattern, the concentrations were significantly higher, reaching a maximum of c. 12 000 µg/g TOC at 30-cm depth (Figure 6).
In core SJ6, the concentration of brassicasterol was higher than in core SJ5, and it increased towards the top of the core with highest concentration at top 30 cm (200–500 µg/g TOC). The concentration of campesterol in core SJ6 was the highest at depths 80–60 and 0 cm (c.1250–1700 µg/g TOC). Also, stigmasterol peaked at 62–60 cm (1300 µg/g TOC) and at 0 cm (1900 µg/g TOC). The concentration of β-sitosterol was higher in core SJ6, peaking at 72 cm (20 000 µg/g TOC); elsewhere, concentration varied between 2500 and 10,000 µg/g TOC. Tocopherol-α ((2R)-2,5,7,8-tetramethyl-2-[(4R,8R)-(4,8,12-trimethyltridecyl)]-6-chromanol) was found only from the lowermost layers of core SJ6. In both cores, all stanols, campestanol, 22E-stigmastanol and 3-stigmastanol were identified from bottom to upwards at all layers until 10 cm in SJ5 and at 40 cm in SJ6 (Figure 6).
In core SJ5, the concentration of phytol ((3,7,11,15-tetramethylhexadec-2-en-1-ol) was highest at 50 cm depth (c. 2500 µg/g TOC), and the overall concentration decreased towards the top layers. In core SJ6, the concentration of phytol was highest in top layers, 60−0 cm, c. 400–1200 µg/g TOC. Before 66 cm, phytol concentration was less than 400 µg/g TOC. The n-alcohol distribution in both studied cores did not vary substantially. In core SJ5, n-C22-ol dominated depths 150, 120 and 100–6 cm; n-C24-ol dominated depths 140, 130 and 110 cm; and n-C28-ol dominated depth 70 cm. In core SJ6, n-C22-ol dominated depths 100−50 cm, whereas n-C24-ol dominated the uppermost 40 cm.
Statistical analyses of biomarkers
The PCA for biomarkers produced groups, similar to the DCA for macrofossils. However, when the biomarker RDA was performed (Figure 7), where sample scores from macrofossil DCA were used as explanatory variables, the biomarker distribution of the two peat profiles correlated significantly with their macrofossil compositions (pseudo F = 9.2, p-value = 0.002). RDA resulted in three groups similar to macrofossil DCA: fens (SJ5 150−30 cm and SJ6 98–62 cm), lawn (SJ5 26−6 cm) and hummock (SJ6 60−0 cm; Figure 3). Biomarkers whose concentrations decreased in association with the shift from fen to bog habitat were the n-alkanes n-C20, n-C22, n-C24, n-C26, n-C27, n-C28 and stanols. Markers for the top layers of core SJ5 (lawn) were, for example, the n-alkane ratios n-C23/n-C27 and n-C31/n-C29, and for the top core of SJ6 (hummock) were, for example, n-C25, n-C29 and n-C28 alcohol. The 10 best-fitted biomarkers from the RDA are shown in Figure 8. In core SJ5, n-alkanes n-C22, n-C24, n-C25, n-C26, n-C27 correlated positively and 22E-stigmastanol negatively with depth, and only n-C25, n-C27, n-C29 correlated with UOM. In core SJ6, most of the n-alkanes correlated positively with UOM and depth, with n-alkane concentrations decreasing towards top layers (Figure 8).
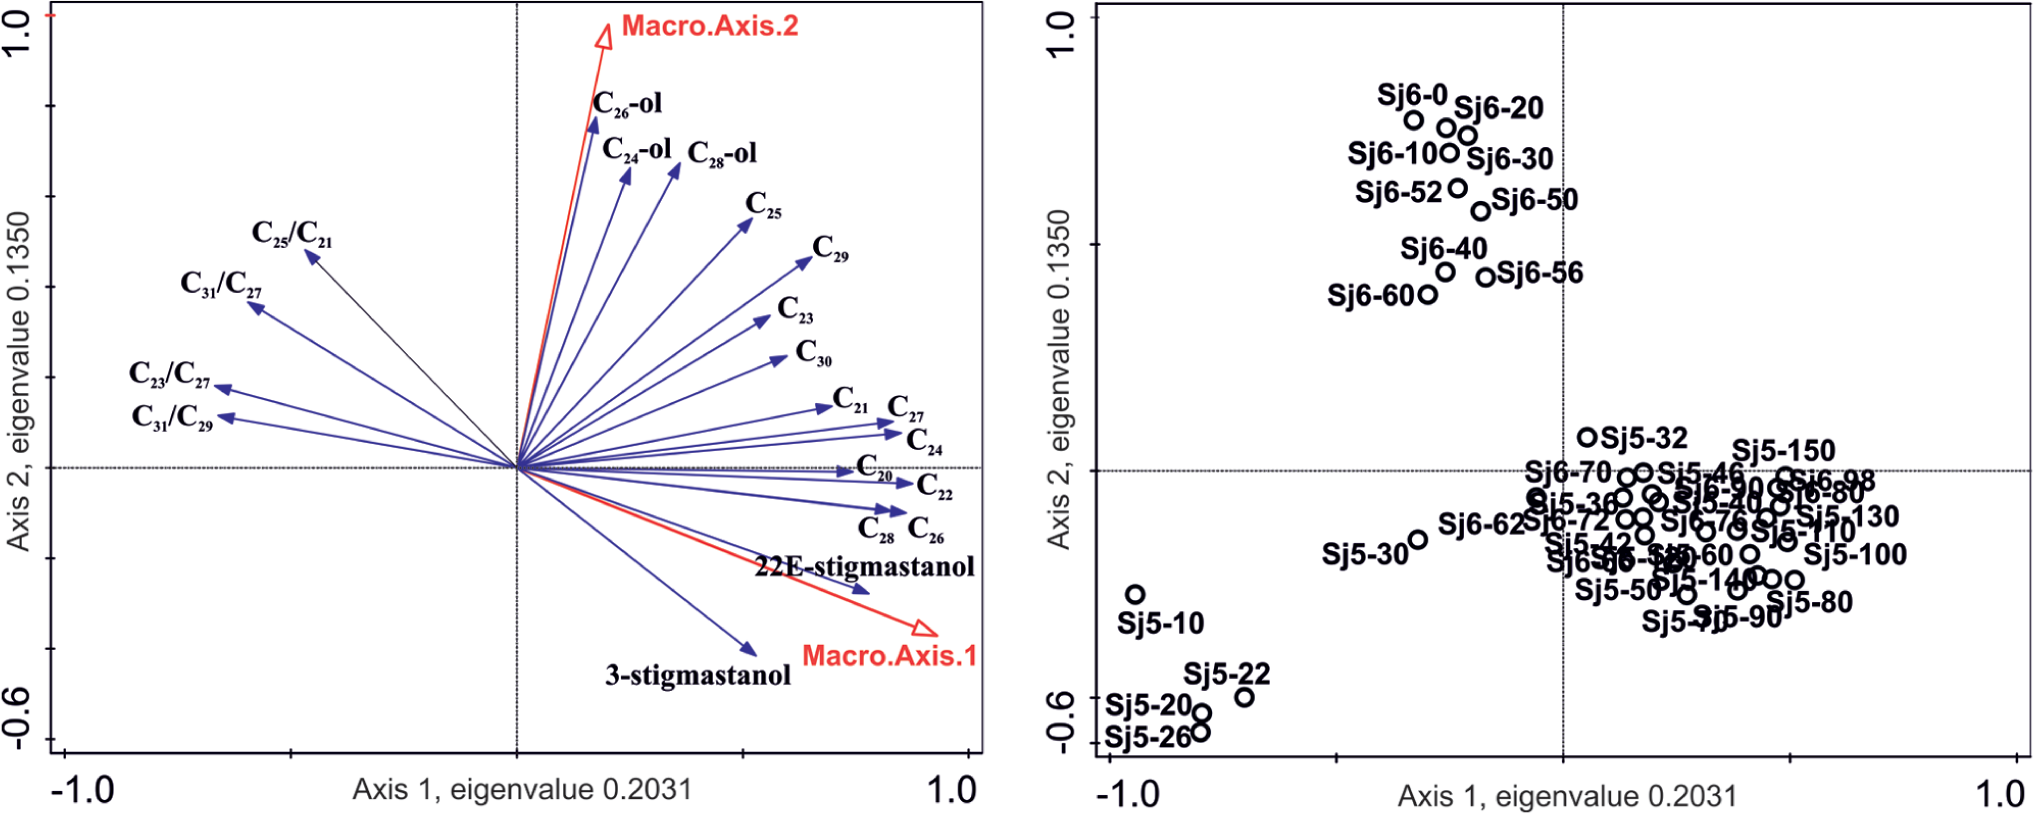
RDA of biomarker data of cores SJ5 and SJ6, case scores Macro.axis.1 and Macro.axis.2 from macrofossil DCA as explanatory variables. The first axis explains 20% (eigenvalue 0.2031) and the second axis 13% (eigenvalue 0.1350) of the variation in the biomarker data (pseudo F = 9.2 and p-value = 0.002). In the figure, 20 (out of 54) best-fitted biomarkers are presented.
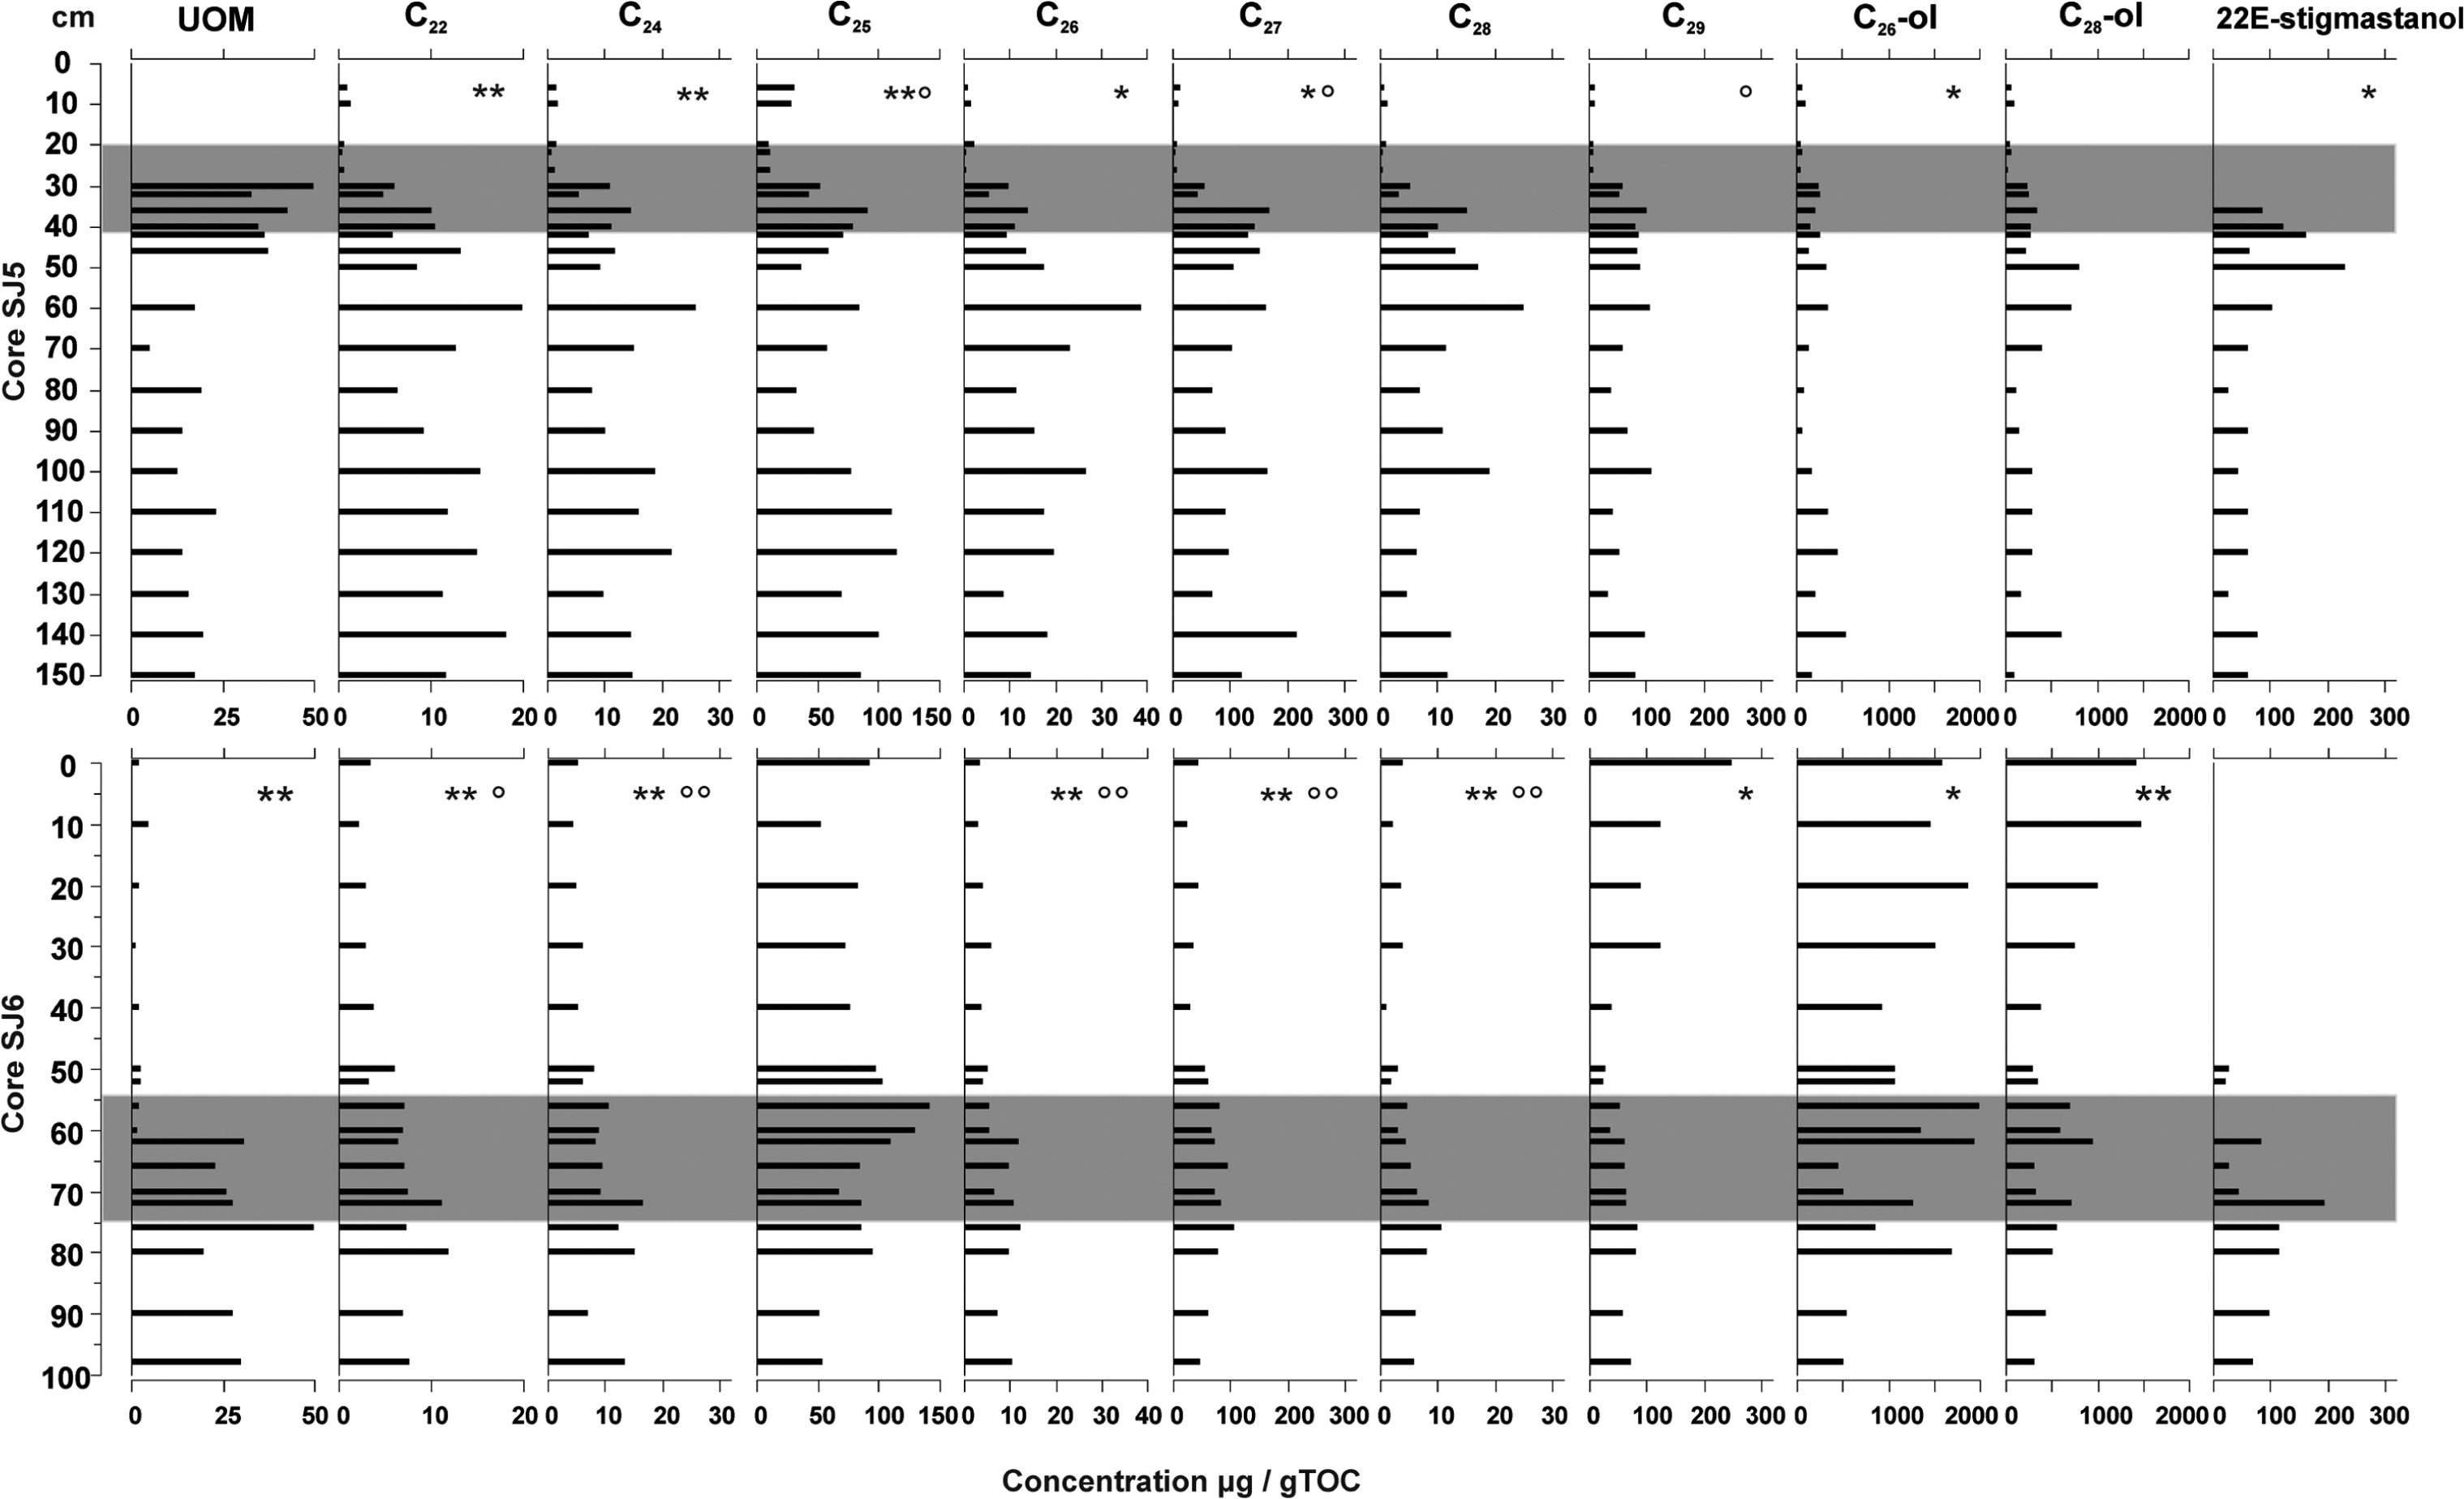
Concentrations (µg/g TOC) of 10 best-fitted biomarkers from biomarker RDA in cores SJ5 and SJ6. Compounds correlating with depth (sig. 0.05 = *, sig. 0.01 = **) and UOM (sig. 0.05 = °, sig 0.01 = °°) are marked. The fen–bog transition zone in both cores is marked with grey.
The first division of the TWINSPAN separated macrofossils from the top part of core SJ5, that is, lawn species with urs-12-ene from the rest of the samples (Table 1). The second division divided the rest of the data hummock species and biomarkers: (1) S. fuscum and shrub leaves with C27 n-alcohol, C34 n-alkane and squalene; and (2) fen species and biomarkers: brown mosses, sedge roots, Equisetum sp., S. palustris and M. trifoliata together with biomarkers: 22E-stigmastanol, n-C35 and urs-12-ene.
Members of macrofossil and biomarker communities in peat cores SJ5 and SJ6 derived from TWINSPAN (n=72, macrofossils and biomarkers in the data) where five cut levels and two divisions were used. First division separated hummock-fen communities and lawn communities. In the second division, hummock-fen community was divided into two.
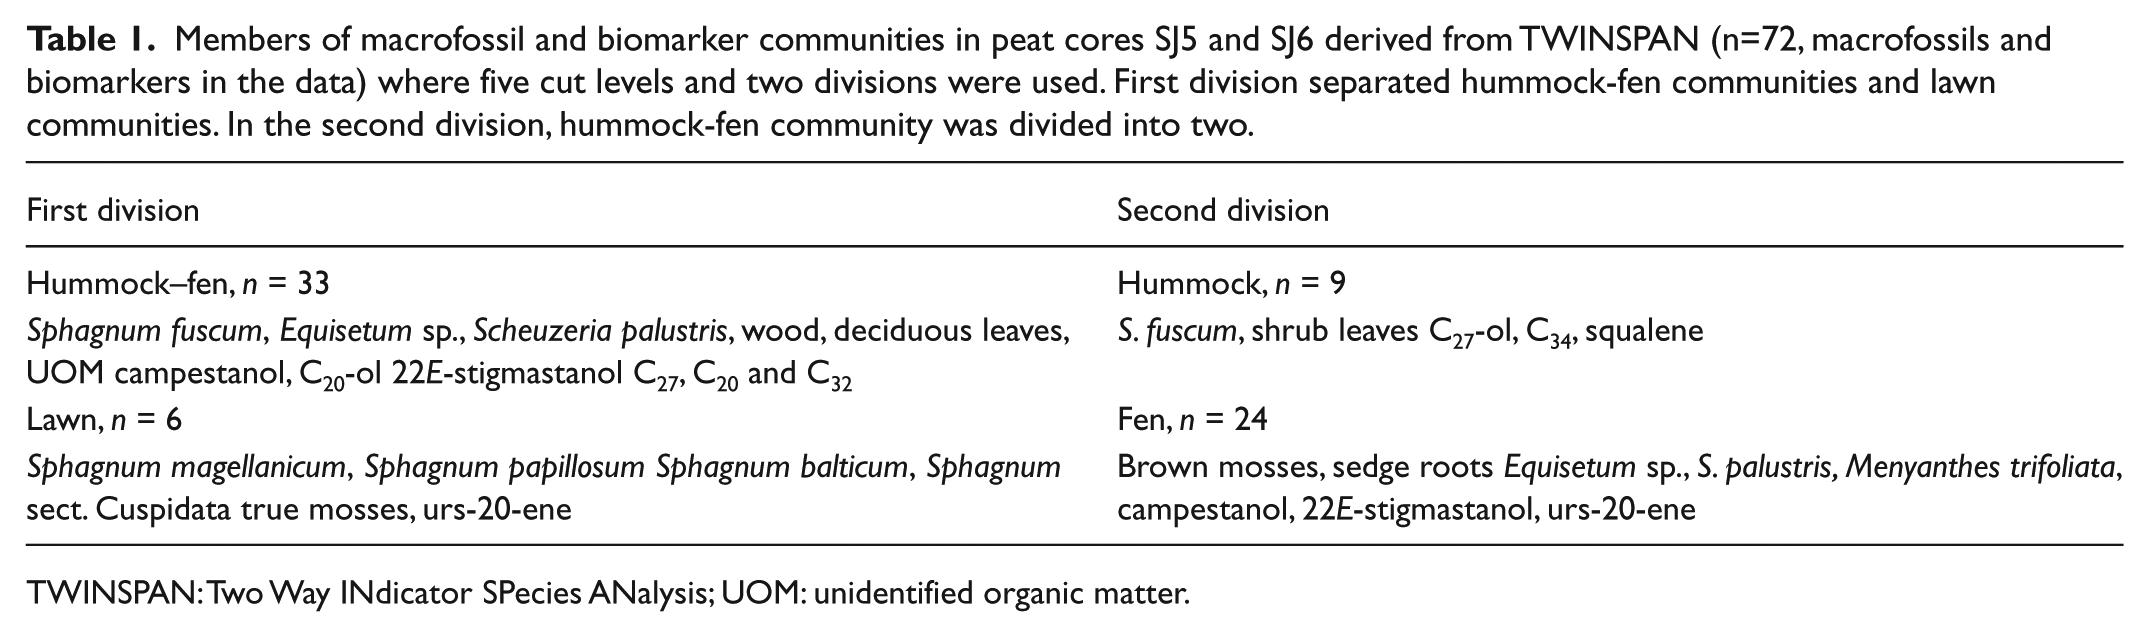
TWINSPAN: Two Way INdicator SPecies ANalysis; UOM: unidentified organic matter.
Degradation measures
In both cores, a high amount of UOM corresponded to the fen–bog transition zone (SJ5: 30−20 cm and SJ6: 75−55 cm). In these layers, 20–55% of the plant macrofossil material was unidentified. In contrast, TOC showed little variation and stayed around 50% throughout both of the cores (Figure 9). There was a clear up-core increase in the C/N ratio in both cores at the fen–bog transition. The most notable increase of the CPI (cf. Andersson and Meyers, 2012) of n-alkanes also occurred during the transition. The ratio of 5α(H)-stanols/Δ5-sterols (cf. Bertrand et al., 2012) decreased towards the top layers in both cores and was last detected in SJ5 at 10 cm and in SJ6 at 40 cm depth.
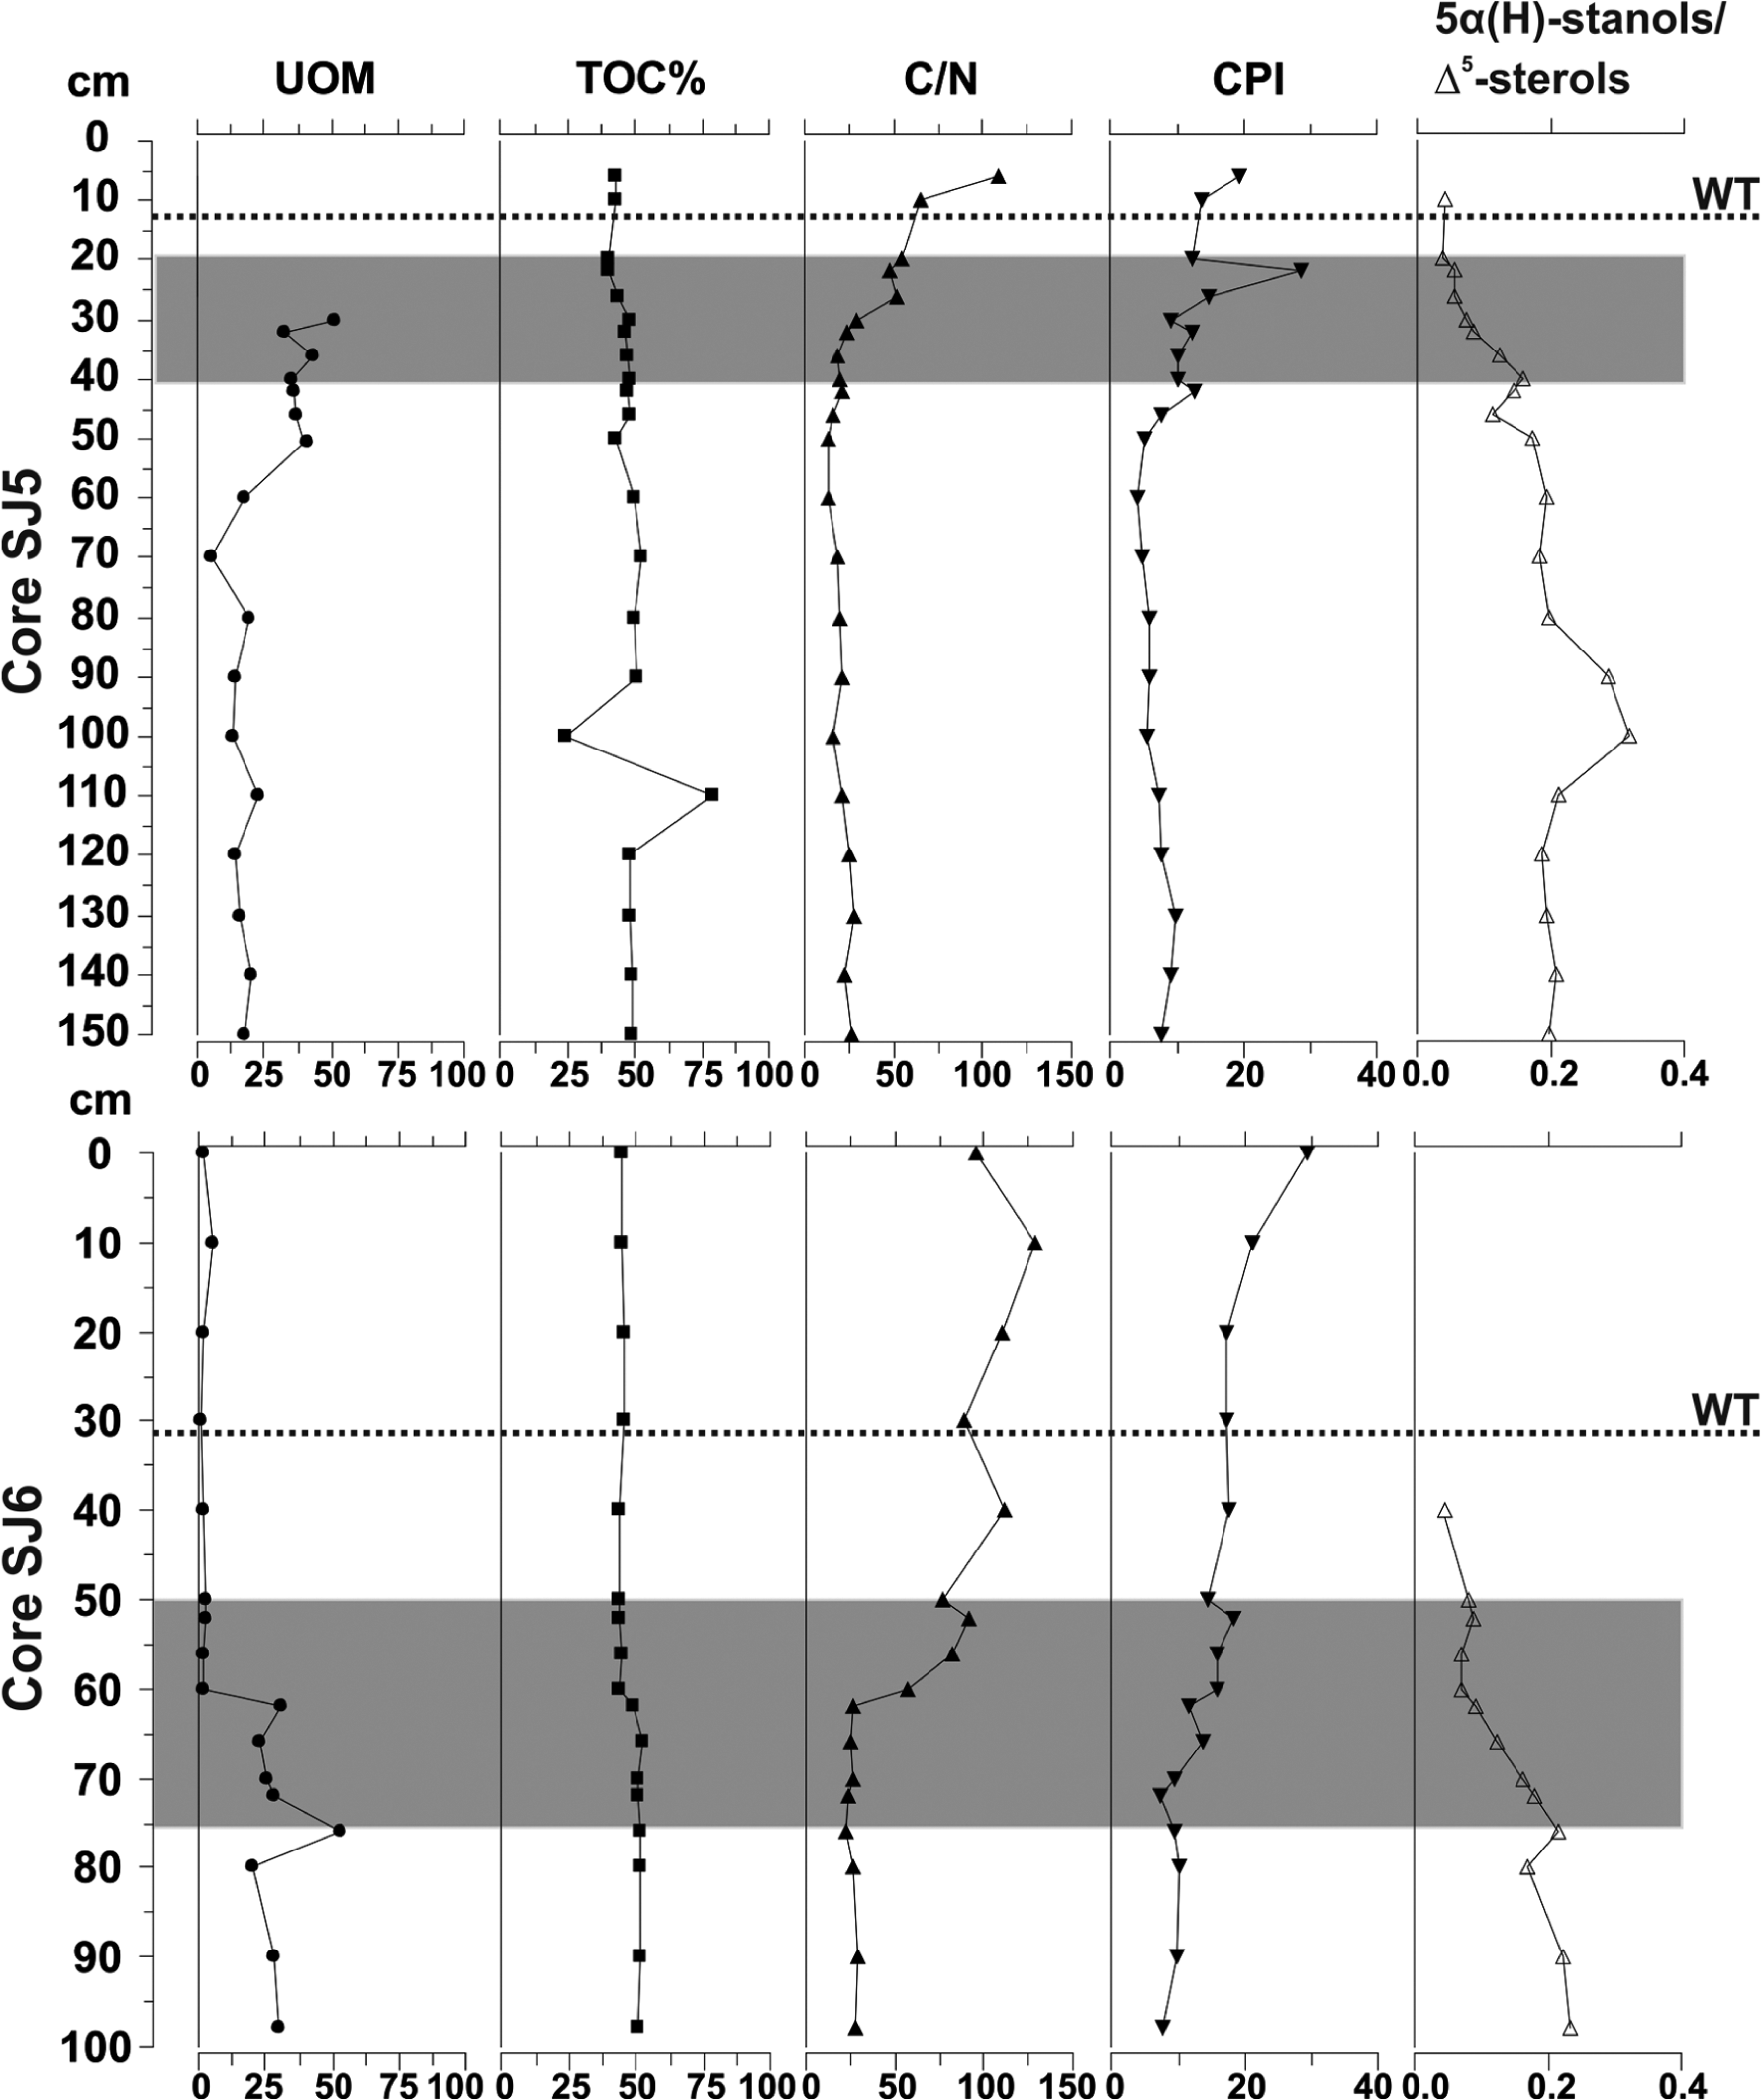
Degradation measures in cores SJ5 and SJ6. UOM and TOC are presented as %, C/N ratio, CPI value (= CPIalk = ((C21 − C31) + (C23 − C33)odd/2 * (C22 − C32)even) according to Andersson and Meyers (2012) and the 5α(H)-stanols/Δ5-sterol ratio (= (campestanol + 22E − stigmastanol + 3 − stigmastanol)/(campesterol + campestanol + stigmasterol + 22E − stigmastanol + β − sitosterol + 3 − stigmastanol)). The fen–bog transition zone is marked with grey bar and water table level (WT) with dashed line.
Discussion
Our results suggest that statistically, individual biomarkers predict the fossil plant species composition rather poorly, in support of observations from previous studies (e.g. Andersson, 2012; Ficken et al., 1998; Pancost et al., 2002) that recommended that biomarkers should be used as a complementary proxy. When we applied the combined data, that is, biomarkers together with macrofossils, as explanatory variables, a clear correlation between biomarkers and fossil plants was detected, and the biomarkers succeeded in describing three different environments: bog hummocks, lawns and fens (Figure 7).
Previous studies have identified the high concentrations of n-C23 and n-C25 and high ratios of n-C23 to n-C25, n-C29 and n-C31 to be characteristic to hummock Sphagnum species, whereas taraxer-14-ene, taraxas-20-ene, n-C31 and the ratio of n-C31/n-C33 to Ericaceae species (e.g. Bingham et al., 2010; McClymont et al., 2008; Nichols et al., 2006; Nott et al., 2000; Pancost et al., 2002). In contrast, the study here shows that the statistically significant biomarkers for bog hummock species, S. fuscum, S. angustifolium and Ericaceae roots and leaves were n-C24-ol, n-C26-ol, n-C28-ol, n-C25 and n-C29 (Figure 7). These compounds were particularly effective in identifying the difference between bog and fen zones (Figures 7 and 8). However, the visual comparison between the biomarker concentrations and palaeobotanical assemblages supports the previous works that has linked certain plant groups with certain biomarker distributions; for example, in core SJ6, the uppermost layers were dominated by n-C31, which is an indicator of Ericaceae whose macrofossils were also present. However, the triterpenoids and sterols associated with Ericaceae species (e.g. Pancost et al., 2002) were not detected. Although S. fuscum dominated the whole hummock bog peat section (SJ6), the concentration of n-C25 was exceeded by n-C31 when descending from 0 to 40 cm, but the low ratio of n-C23/n-C25 (<1) indicates a dry Sphagnum-dominated environment, as suggested by Bingham et al. (2010). In core SJ5, similar low n-C23/n-C25 ratios were detected in layers dominated by sedge roots, which agrees with Ronkainen et al. (2013), whose data showed this ratio to correspond both with sedge below-ground parts and Sphagnum mosses. However, in core SJ6, the depths that were dominated by sedge roots (100–66 cm) have a higher n-C23/n-C25 ratio than comparable layers in core SJ5 (100–40 cm; Figure 5). These results support the conclusion of Ronkainen et al. (2013) who suggested that the application of bog biomarkers to fen environments may be complicated by the similar signatures of Sphagnum mosses and sedge roots.
A recent study showed that in general, the most reliable proxy for Sphagnum mosses in peats are the n-alkane ratios n-C23/n-C27 or n-C23/n-C29 (Bush and McInerney, 2013). When studied visually rather than through the statistical analysis, our results showed that SJ6 top peat layers (60−0 cm) dominated by S. fuscum were separated from the rest of the layers by low n-C23/n-C29 ratio (<0.5). The statistically significant ratio n-C23/n-C27 (<1.5) described core SJ5 top layers (36−0 cm) that were dominated by S. magellanicum and Sphagnum papillosum. Other statistically significant biomarkers describing the uppermost layers of the core SJ5 with lawn habitat were n-C31/n-C27 and n-C31/n-C29 (Figures 7 and 8). The n-alkanes that dominated the lawn layer with S. magellanicum and S. papillosum were n-C23, n-C25 and n-C31, which agree with Bingham et al. (2010). Consistent with the fact that lawns are relatively wet microhabitats when compared with hummocks, the previously suggested n-C23/n-C25 and n-C23/n-C31 ratios that should describe dry bog environment (Bingham et al., 2010) did not describe the wetter lawn environment.
In both cores, the fen layers beneath bog peat consisted mainly of vascular plant remains, for example, M. trifoliata, S. palustris, Equisetum spp. and sedges. These plants are usually dominated by odd-over-even long-chain n-alkanes (Figure 2), and this was at least partly shown by RDA that grouped the mid- and long-chain n-alkanes C20, C21, C22, C24, C26, C27 and C28 as well as three stanols as fen peat biomarkers (Figure 7). Bush and McInerney (2013) stated that n-C29 and n-C31 should not be used as general proxies for grasses and woody plants, as these two compounds are highly variable and are overlapping between these groups, but that by differences in mid-chain and long-chain n-alkanes, Sphagnum mosses could be separated from them. Our results partly agree with this. In both of the studied cores, the macrofossil records indicated the transition zone from fen to bog stage (SJ5: 30−20 cm, SJ6: 75−55 cm) distinctively. In core SJ5, the biomarker record indicates that the fen–bog transition is characterized by a shift from long-chain n-alkanes (C27) to mid-chain n-alkanes (C23) at depth 36 cm. Yet, in core SJ6, such a clear change is not visible.
In our study of modern fen species, we found that sterols such as lupeol (5α-lup-20(29)-en-3β-ol), obtusifoliol (4α,14α-dimethyl-5α-ergosta-8,24(241)-dien-3β-ol) and gramisterol (4α-methyl-5α-ergosta-7,24(241)-dien-3β-ol) showed potential to yield information about the abundance of sedge roots and mosses (Ronkainen et al., 2013). Even though sedge root remains and mosses were present in the studied peat, the above-mentioned group-specific sterols were not detected and only brassicasterol, campesterol, stigmasterol and β-sitosterol that are common to most plant species were found from fossil peat material. We attribute this absence of the plant-specific sterols is because of degradation of these compounds (Lehtonen and Ketola, 1993) given that their concentrations in fen plants was rather low (Ronkainen et al., 2013), and we conclude that appearance of stanols (Figure 6) indicates degradation of organic matter since deposition. In both cores, the fen–bog transition and the layers below the transition were characterized by the presence of stanols, and it seems that especially the 5α(H)-stanols/Δ5-sterol ratio, which is related to anoxic conditions and decay of plant material (Bertrand et al., 2012) is a strong marker for degradation, and changes in the ratio were consistent with degradation measures presented here (Figure 9). Similarly to Andersson and Meyers (2012), the CPI value increases up-core in both of the studied cores, indicating better preservation of organic matter at the top layers and a progressive degradation down core. In both cores, CPI reaches its minimum right below the transition layer, almost simultaneously where the C/N ratio decreases to its minimum. In both cores, the amount of UOM is clearly higher at and below the fen–bog transition than in the bog peat layers. Changes in the degradation measures might indicate that drier periods with lower water table level triggered the fen–bog transition (Hughes, 2000; Hughes and Barber, 2003), resulting in accelerated plant litter decay. Also, around the fen–bog transition layer, the concentrations of sterols and triterpenoids were high in the peat, while the dominating macrofossils were sedge roots and other parts of sedges. Previous studies have stated that sterol and triterpenoid concentrations are higher in vascular plants than in mosses (e.g. Pancost et al., 2002; Ronkainen et al., 2013). The results presented here support this interpretation and suggest that these compounds originate from vascular plants. This result is potentially important because high proportions of highly decomposed organic matter hampers reliable environmental reconstructions (cf. Ficken et al., 1998), including identifying the timing of fen–bog transitions in peat cores.
Conclusion
In this study, we investigated whether biomarkers can be applied to distinguish fen and bog environments and whether plant-specific biomarkers can be identified from fen peat. Not surprisingly, the palaeobotanical analyses were able to clearly separate dry bog hummocks, moist lawns and wet fen habitats apart. With the biomarkers, more robust conclusions could be drawn only when the biomarkers were combined with the macrofossil data, after which a similar kind of sub-division of peatland habitats was achieved as yielded by palaeobotanical analyses. In agreement with our previous study of fen plants, we confirm that using biomarker data from highly humified fen peat layers to achieve species-level information of past plant assemblages is very challenging. Although we previously showed that certain sterols could be used as indicators for some plant groups (e.g. Sphagnum mosses or sedge roots), these signals were not translated into the highly humified peat. However, we were able to separate bog and fen habitats apart by the changes in n-alkane concentrations and the n-alkane ratios along the cores. Moreover, the transition zone between fen and bog habitats was characterized by high concentrations of sterols and triterpenoids originating from vascular plants. This proxy result seems to be applicable when reconstructing dominating plant groups during the highly humified peat phases and may potentially also be used as a degradation measure as related to past changes in the water table level, and the following increase in level of decay as indicated here by the 5α(H)-stanols/Δ5-sterol ratio, CPI value, C/N ratio and high UOM.
Footnotes
Acknowledgements
We thank J Menegazzo and M West for help in the laboratory. We thank the reviewers for providing constructive suggestions for improving the paper.
Funding
This study was funded by the Academy of Finland (codes 131409, 218101 and 201321) and the INTIMATE program via a COST STMS grant.
References
Supplementary Material
Please find the following supplemental material available below.
For Open Access articles published under a Creative Commons License, all supplemental material carries the same license as the article it is associated with.
For non-Open Access articles published, all supplemental material carries a non-exclusive license, and permission requests for re-use of supplemental material or any part of supplemental material shall be sent directly to the copyright owner as specified in the copyright notice associated with the article.
