



Abstract
Each year, a peatland has an annual net carbon balance (NCB), which can be positive (net uptake), zero or negative. Over centuries to millennia, this NCB accumulates as a peat profile. Contemporary peatlands can be sampled (cored), and the past apparent carbon accumulation rate (aCAR) can be determined as the quantity of peat carbon in any particular dated interval down the core profile. We use a process-based peatland carbon and water cycle model to compare peatland annual NCB during millennia of peat accumulation to the contemporary estimate of aCAR, resulting from this accumulation. Integrating over the entire profile, the accumulated NCB must equal the aCAR, but for shorter time intervals, these two quantities can diverge. A climate variation/perturbation that leads to persistent, slow carbon loss or negligible carbon gain through enhanced decomposition will necessarily reduce the aCAR for time periods before the climate variation/perturbation occurred. This can compromise peatland climate–carbon balance relationships inferred from joint analysis of peat cores and paleoclimate reconstructions.
Introduction
Peatlands provide a datable stratigraphic record of past environments through preservation of pollen and spores, plant macrofossils, microorganisms, and other traces of life over thousands of years (Barber, 1993). There is currently substantial interest in reconstructing the carbon balance history of peatlands through analysis of contemporary peat cores, and then relating that to past climate variability (e.g. Charman et al., 2013; Gorham et al., 2012; Yu, 2011). This understanding will improve predictions of the impact of 21st-century climate change on peatland carbon dynamics (Frolking et al., 2011). The annual peat C balance is the net of above- and below-ground litter input (a small fraction of which is ultimately preserved as peat) and the C loss from peat (fresh to highly humified) that exists at that time. The peat carbon record collected from contemporary cores is a result of initial C litter inputs and the subsequent decades to millennia of decomposition since deposition. The apparent carbon accumulation rate (aCAR) is a common metric for quantifying past peat carbon dynamics from contemporary peat core analysis (e.g. Jones and Yu, 2010). aCAR is the amount of peat carbon present between two dated depths in the core. For long intervals (e.g. an entire core), this is the long-term rate of carbon accumulation (LORCA; Tolonen and Turunen, 1996).
A peatland’s actual net carbon balance (NCB) in the past and the aCAR derived from peat core analysis cannot be easily or directly related based on field observations. Contemporary measurements of peatland NCB are not yet longer than ~15 years (e.g. Roulet et al., 2007); this record is too short to be compared with aCAR values generated from peat cores. In addition, since contemporary NCB is the net result of the carbon balance of the entire core (and vegetation), the contribution of components of the peat profile corresponding to past time intervals cannot be disaggregated from NCB for comparison to aCAR. However, a simulation model that tracks annual peat cohorts and peat accumulation over thousands of years can record annual NCB during the simulation, and then compare this directly to the simulated aCAR (i.e. the peat C remaining in annual cohorts in the final profile summed over the time interval of interest).
Spahni et al. (2013) used the relationship between peatland NCB and aCAR to set three parameters for multi-millennial peatland simulations in the LPX model. Since LPX does not track temporal cohorts in the peat profile, Spahni et al. aggregated inputs to the deeper catotelm peat into millennial cohorts, and then inferred how much of the initial input into these cohorts would remain at the end of a simulation, using temporally varying catotelm decomposition rates simulated by LPX. Comparison with observed aCAR from 33 northern peatland cores was used to set three LPX parameters related to decomposition rates and N-deposition.
We used the Holocene Peat Model (HPM; Frolking et al., 2010), a simple, annual time step, process-based model of peat carbon accumulation to explore relationships between climate, annual NCB, and aCAR in greater detail than was done by Spahni et al. (2013). The HPM model (Frolking et al., 2010) has several features that make it suitable for this analysis:
HPM simulates the annual peat carbon balance (NCB = Net Primary Productivity (NPP) − total C loss) and water balance (precipitation + run-on = evapotranspiration + runoff + change in storage) over several millennia. In HPM, total C loss is modeled as a decomposition process that includes all litter-bag C loss pathways (CO2, CH4, and DOC) in aggregate. The dynamic water balance (with run-on equal to zero in these simulations) leads to interannual variability in water table depth (WTD) below the peat surface.
HPM simulates above- and below-ground NPP, forming a surface litter layer – an annual ‘dated peat cohort’ to be buried in subsequent years – and adding fresh litter to shallow, young peat cohorts in the rooting zone (Murphy and Moore, 2010).
HPM simulates increasing peat humification with decomposition (following a linear decay rule, dm/dt = −[k0(m/m0)]·m; Clymo et al., 1998; Frolking et al., 2001), where m is the cohort peat mass remaining at time t, m0 is the total litter mass input to the cohort, and k0 is the initial decomposition rate. This allows the model to simulate more recalcitrant peat deeper in the profile (Laiho, 2006), and lower hydraulic conductivity as peat humifies (Walmsley, 1977).
Decomposition rates are modified by peat water content, with an intermediate optimum, generating the possibility of low rates if the surface peat is very dry (Laiho, 2006), and a rapidly declining decomposition rate at and below the water table (Blodau et al., 2011; Laiho, 2006). Water content and position relative to the water table are calculated for each annual cohort each year.
HPM tracks annual cohort properties (i.e. mass, mass lost, bulk density, and depth below surface) for the entire simulation; the simulated peat profile can be ‘cored’ at any time during the simulation, and a ‘core’ of the final model state can be compared with a contemporary core collected in the field.
HPM includes key positive and negative feedbacks connecting hydro-climate and peat accumulation, due to the modulation of productivity, decomposition, and runoff with the water table position.
Methods
We conducted five 8500-year HPM simulations for this analysis – two baseline climate runs based on reconstructions, two with prescribed drying scenarios, and one with a drainage ditch scenario. We used two reconstructions of precipitation for the St. Lawrence Lowlands region of southern Canada for the baseline simulations, and these were also both perturbed by drying. HPM parameterization was as in Frolking et al. (2010). Mean annual temperature in the St. Lawrence Lowlands was stable from 8500 BP (Muller et al., 2003), and so temperature effects were not considered in these simulations. We assumed that there was no water run-on to the peatland, so the only water input was precipitation. Runoff was calculated by the model as a function of simulated peat height, WTD, and peat relative transmissivity.
One of the baseline precipitation time series had high-frequency interannual variability, but no substantial variability or trend on century or longer time scales, and the other had lower frequency precipitation variability (more persistence) leading to wetter or drier intervals lasting several centuries (Figure 1a). This highlighted the impact of century scale variability in moisture on NCB and aCAR. The first baseline precipitation scenario came from the TraCE-21ka paleoclimate simulation with the CCSM3 GCM (He, 2011; http://www.cgd.ucar.edu/ccr/TraCE/), bias-corrected to match present-day data (CRU v.TS 3.1; Harris et al., 2014), and hereafter called high-frequency/baseline. The second baseline scenario was derived from a precipitation reconstruction for the St. Lawrence Lowlands (Muller et al., 2003); hereafter called low-frequency/baseline, it was modified from the scenario used by Frolking et al. (2010). It includes stochastic variability with strong persistence, and was adjusted to generate a reasonable agreement between HPM output and aCAR derived from a 5.3 m core at Mer Bleue Bog (Frolking et al., 2010; Roulet et al., 2007). In both cases, simulations were run for 8500 years and terminated circa at present, that is, 8.5–0 kyr (no recent climate change was included). The low-frequency/baseline precipitation scenario was generally drier than high-frequency/baseline (Figure 1a), and substantially drier (more than 10%) during 8.5–6.5 kyr and 5–3 kyr.

(a) Annual precipitation (high-frequency/baseline (h-f/base) – light gray line; low-frequency/baseline (l-f/base) – light blue line) and 100-year mean (h-f/base – black line; l-f/base – dark blue line). Interannual variability in h-f/base precipitation (up to 200 mm/yr) is much larger than the variability in 100-year means (~<20 mm/yr). (b) Peat age with depth for the two baseline simulations (h-f/base – red line; l-f/base – blue line), and for core MB930 (black solid circles and dashed line). (c) Apparent carbon accumulation rate (aCAR) for the two baseline simulations (h-f/base – thin red line for annual and heavy red line for 100-year mean; l-f/base – thin blue line for annual and heavy blue line for 100-year mean), and for core MB930 (solid circles and dashed line). (d) Net carbon balance (NCB) for the two baseline simulations (h-f/base – thin gray line for annual and heavy red line for 100-year mean; l-f/base – thin blue line for annual and heavy blue line for 100-year mean). (e) Development over 8500-year h-f/base simulation of peat humification profile and peat column height. Color bar refers to fraction of initial mass input (above-ground + below-ground) remaining as peat, and uses a log scale. Heavy black line about 0.25 m below peat surface is annual water table position in the peat profile. (f) Same as (e) but for l-f/base simulation.
We also generated a gradual drying perturbation to both baseline precipitation scenarios, initiating at 2 kyr, ramping linearly to maximum drying at 1.75 kyr, and then persisting to 0 kyr. The drying comprised both a linearly decreasing trend in annual precipitation to a maximum decrease of 10% (0.04%/yr for 250 years) of the 8500-year baseline mean precipitation (0.89 m/yr for low-frequency/baseline; 0.98 m/yr for high-frequency/baseline), while simultaneously linearly increasing potential evapotranspiration (PET) by 10% (0.04%/yr) above the baseline value (0.55 m/yr in both cases). Interannual variability in precipitation was not changed from the base runs during these dry periods. This drying scenario is hypothetical, chosen to illustrate the impact of climatic drying on peat aCAR and NCB, and not to represent past or future climate change. However, future climate change in northern North America – with uncertain precipitation changes and warming >5°C (e.g. Peacock, 2012), and annual mean PET increasing by 10–40% (Scheff and Frierson, 2014) – has the potential to cause comparable or greater drying over a shorter time period. Note that the additional impact of rising temperature on peat carbon dynamics, both productivity and decomposition (e.g. Spahni et al., 2013), was not considered in these scenarios. Finally, we simulated the installation of a drainage ditch for the final 0.15 kyr of the high-frequency/baseline scenario, by adjusting a model runoff parameter. This lowered the simulated water table by an average of 0.25 m relative to the previous 150 years, though interannual precipitation variability still caused interannual water table depth variability. This ditch scenario was chosen as it can provide a target for model evaluation, as intentional peatland drainage by ditching is a common occurrence (e.g. Joosten and Clarke, 2002).
For the two baseline simulations, both the peat age–depth profile and aCAR at the end of the simulation (0 kyr) were compared with the MB930 core collected at Mer Bleue Bog, Ontario (Frolking et al., 2010; Roulet et al., 2007). For the drying and ditch simulations, we compared simulated aCAR with simulated annual NCB. In addition, to help interpret those results, we also evaluated the depth-in-peat trajectories of annual peat cohorts over the simulated development of the peat profiles, and the development of the peat profile humification, represented as the fraction of total litter input remaining as peat down the peat profile, calculated for each year of the simulation.
Results
Baseline scenarios
The age–depth profiles were relatively insensitive to the differences in baseline precipitation, so both baseline scenarios were broadly consistent with the observed MB930 age–depth profile (Figure 1b). However, with the same annual PET, lower precipitation in the low-frequency/baseline scenario resulted in a deeper water table (8500-year mean increase of 5.5 cm), slightly less total peat accumulation, and a shallower age–depth profile slope during drier periods, compared with the high-frequency baseline scenario (Figure 1b).
Larger interannual precipitation variability in the high-frequency/baseline scenario caused similar variability in simulated water table depth; this resulted in larger short-term variability in both aCAR (Figure 1c) and NCB (Figure 1d). Overall, aCAR for the two baseline scenarios were broadly consistent; however, the low precipitation intervals in the low-frequency/baseline scenario generated lower aCAR, similar to aCAR reconstructed from core MB930 (Figure 1c). Except during the initial and final several hundred simulation years, aCAR behaves roughly as running mean NCB, averaged over a longer interval than the precipitation variation. During the initial years (c. 8.5–8 kyr), aCAR was generally less than NCB, as there was no deeper peat decomposing and reducing NCB relative to annual peat cohort accumulation; conversely, during the final years (c. 0.5–0 kyr), aCAR was generally greater than NCB, as these young cohorts are only partially decomposed (Figure 1e and f; Turunen et al., 2004).
High-frequency interannual precipitation variability had negligible impact on peat accumulation rates over centuries to millennia, and there was a general decline in the peat accumulation rate (Figure 1e; Clymo, 1984). The decreasing rate of accumulation, along with a very gradual increase in the thickness of the surface unsaturated zone, led to increased decomposition (or fractional mass lost) of peat cohorts ~1 m below the surface, while peat deeper than about 1.5 m below the surface decomposed only very slowly (Figures 1e, 2a–d). On the other hand, low frequency (persistent) variability in precipitation had a significant impact on peat accumulation, leading to periods of decades to millennia with no net accumulation of peat, or even slight loss (Figure 1f). This loss occurred, despite continuing inputs of fresh litter, because the deeper WTD increased decomposition of deeper peat (compare Figure 1e and f).
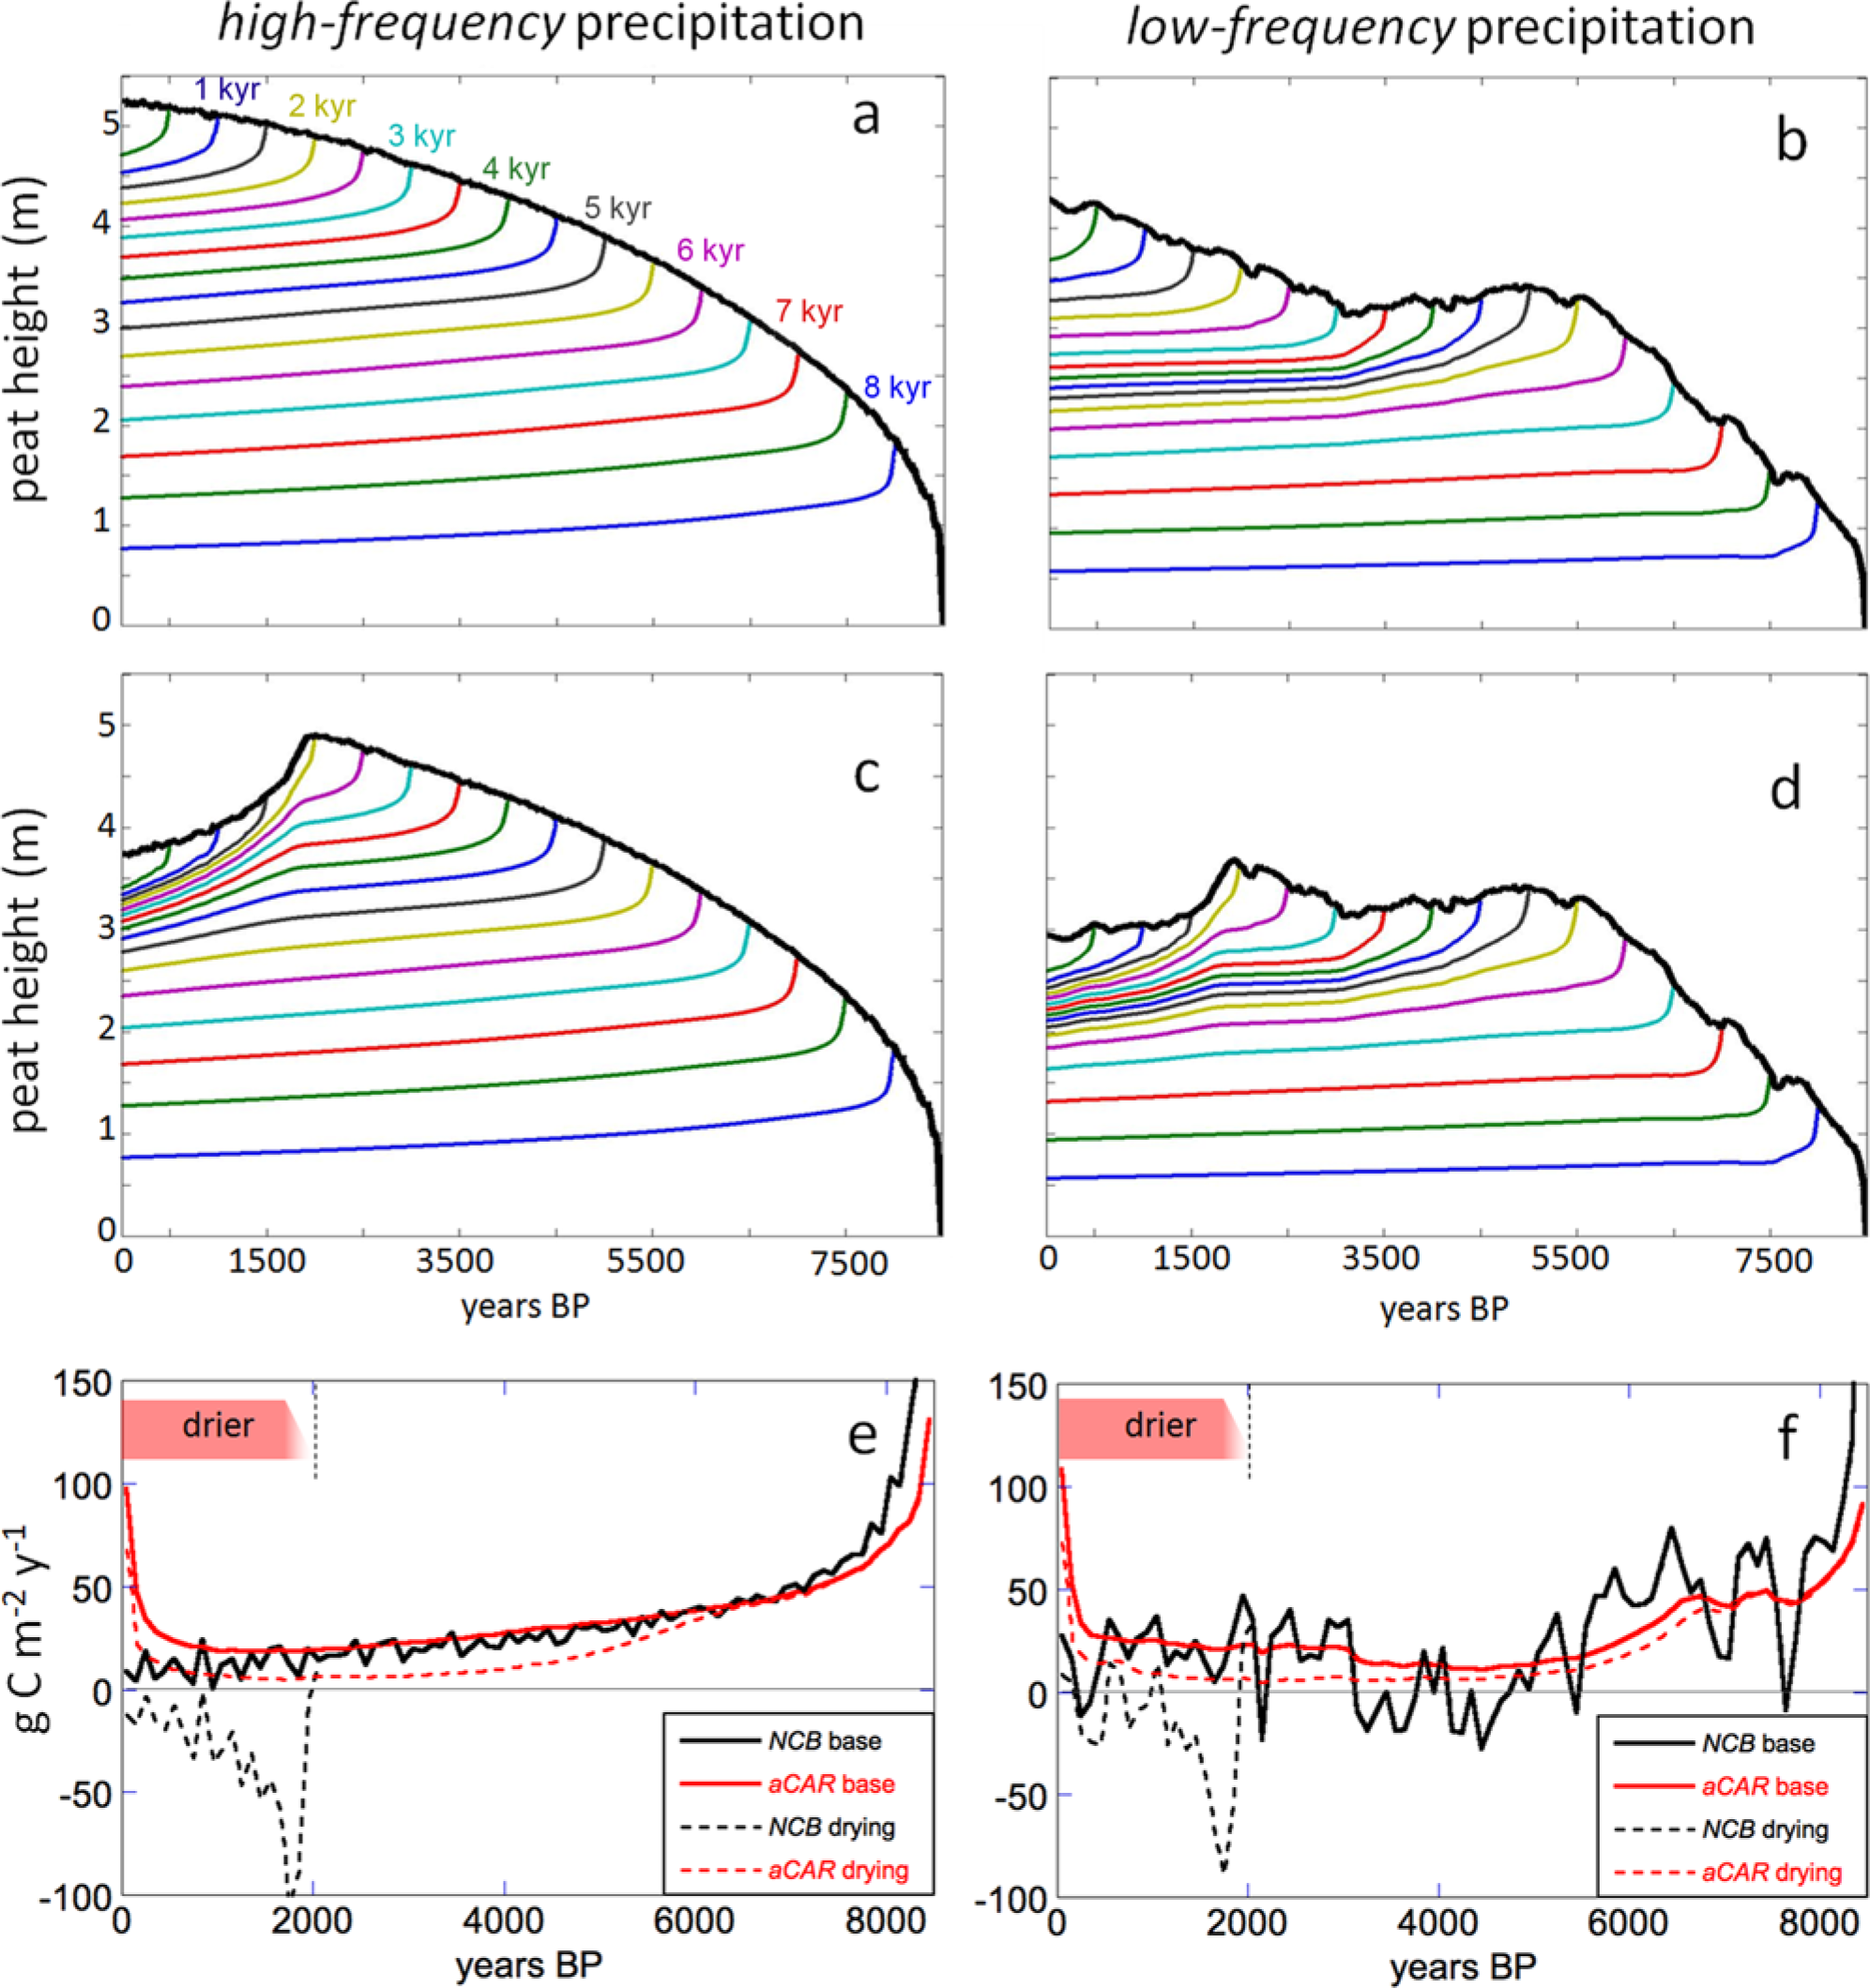
Peat cohort depth trajectories (or ‘iso-age’ lines) over the 8500-year simulation for (a) high-frequency/baseline (h-f/base), (b) low-frequency/baseline (l-f/base), (c) high-frequency/drying (h-f/dry), and (d) l-f/dry scenarios. Heavy black line is peat surface height above base; colored lines track annual vertical position of annual peat cohorts formed every 500 years (initial formation age labeled in ‘kyr’ or thousands of years BP in panel a). Comparison of 100-year mean aCAR and NCB for (e) h-f/base and h-f/dry, and (f) l-f/base and h-f/dry precipitation scenarios. Drying duration and relative intensity are represented by pink trapezoids in panels (e) and (f). Prior to onset of drying, precipitation and NCB were identical for baseline and drying scenarios, though there are large differences in aCAR. For either panel (e) or (f), the area differences between the red solid and dashed line, and between the black solid and dashed line are equal, and represent the difference in total peat C at the end of the baseline and drying simulations.
Drying scenarios
Persistent drying (~0.2 m water table drop) led to a substantial net peat loss in both drying scenarios (Figure 2). Total decomposition increased as the climate was drying, and then stabilized as the climate stabilized. Net peat loss rates were highest while the climate was drying; once the climate stabilized in a drier state, the rate of net loss of peat C declined gradually over centuries (Figure 2c–f); this gradual stabilization was primarily due to a negative feedback caused by the decrease in runoff as the water table subsided and peat humified.
As peat accumulated, the relationship between peat cohort age and its vertical position in the peat profile was determined by how quickly younger peat accumulated above the cohort and how quickly older peat below the cohort lost mass and/or increased in bulk density. Annual peat cohorts ‘sank’ to ~0.5 m below the peat surface during their first 100 years (Figure 2a) – gradual burial in the acrotelm, during which an annual cohort lost about 70–80% of its initial above- and below-ground litter input mass (e.g. Figure 1e and f) and peat bulk density increased (Turunen et al., 2004). After that, a particular cohort’s increasing depth below the peat surface was more a result of accumulating peat above it than of loss of peat mass below it (Figure 2a); loss rates of deeper peat were about 4 × 10⁻⁵/yr over the final 4–5 millennia of the simulation.
The impact of climate drying on peat decomposition gradually penetrated to deeper, older peat cohorts due to greater loss of acrotelm peat, bringing older cohorts closer to the surface (e.g. Figure 2c), and to deeper penetration of decomposition potential resulting from a lowering of the water table (the multi-decadal mean water table dropped ~0.15–0.2 m relative to the high-frequency/base scenario). This led to a compression of iso-age lines and a decrease in aCAR in both drying scenarios (Figure 2c–f). These climate-drying scenarios impacted peat aCAR at cohort ages up to several millennia prior to the onset of drying (Figure 2e and f). This ‘pre-onset’ reduction in aCAR is a necessary consequence of the net carbon loss that occurred during drying (Figure 2c–f); since aCAR cannot be negative, a period of negative NCB must cause a decrease in aCAR outside of and prior to the interval of net C loss (Figure 2e and f). The pre-drying decline in aCAR was greater for the high-frequency/baseline than the low-frequency/baseline scenario (Figure 2e and f), because high-frequency/baseline had no significant dry periods and its peat was more susceptible to drying-induced decomposition than the low-frequency/baseline-scenario peat (compare Figure 1e and f, and Figure 2a and b); the low-frequency/baseline scenario had a relatively dry period for ~2000 years prior to the imposed drying (Figure 1a).
Ditch scenario
Enhanced drainage lowered the water table ~0.25 m and led to a loss of about 0.44 m of peat (22 kg C/m2) relative to high-frequency/baseline. This was an average loss of ~140 g C/m2/yr, though most loss occurred during the first 75 years of drainage (Figure 3a and b). This drop in peat height was due only to peat mass loss and associated increase in shallow peat bulk density (Figure 3c); HPM does not simulate peat subsidence due to loss of water content (Price and Schlotzhauer, 1999). Ditch-induced peat loss simulated here is comparable to existing observations of peat loss in drained peatlands (Silvola et al., 1996). Ditching for the final 150 years led to reduced aCAR back to about 2 kyr (Figure 3d).
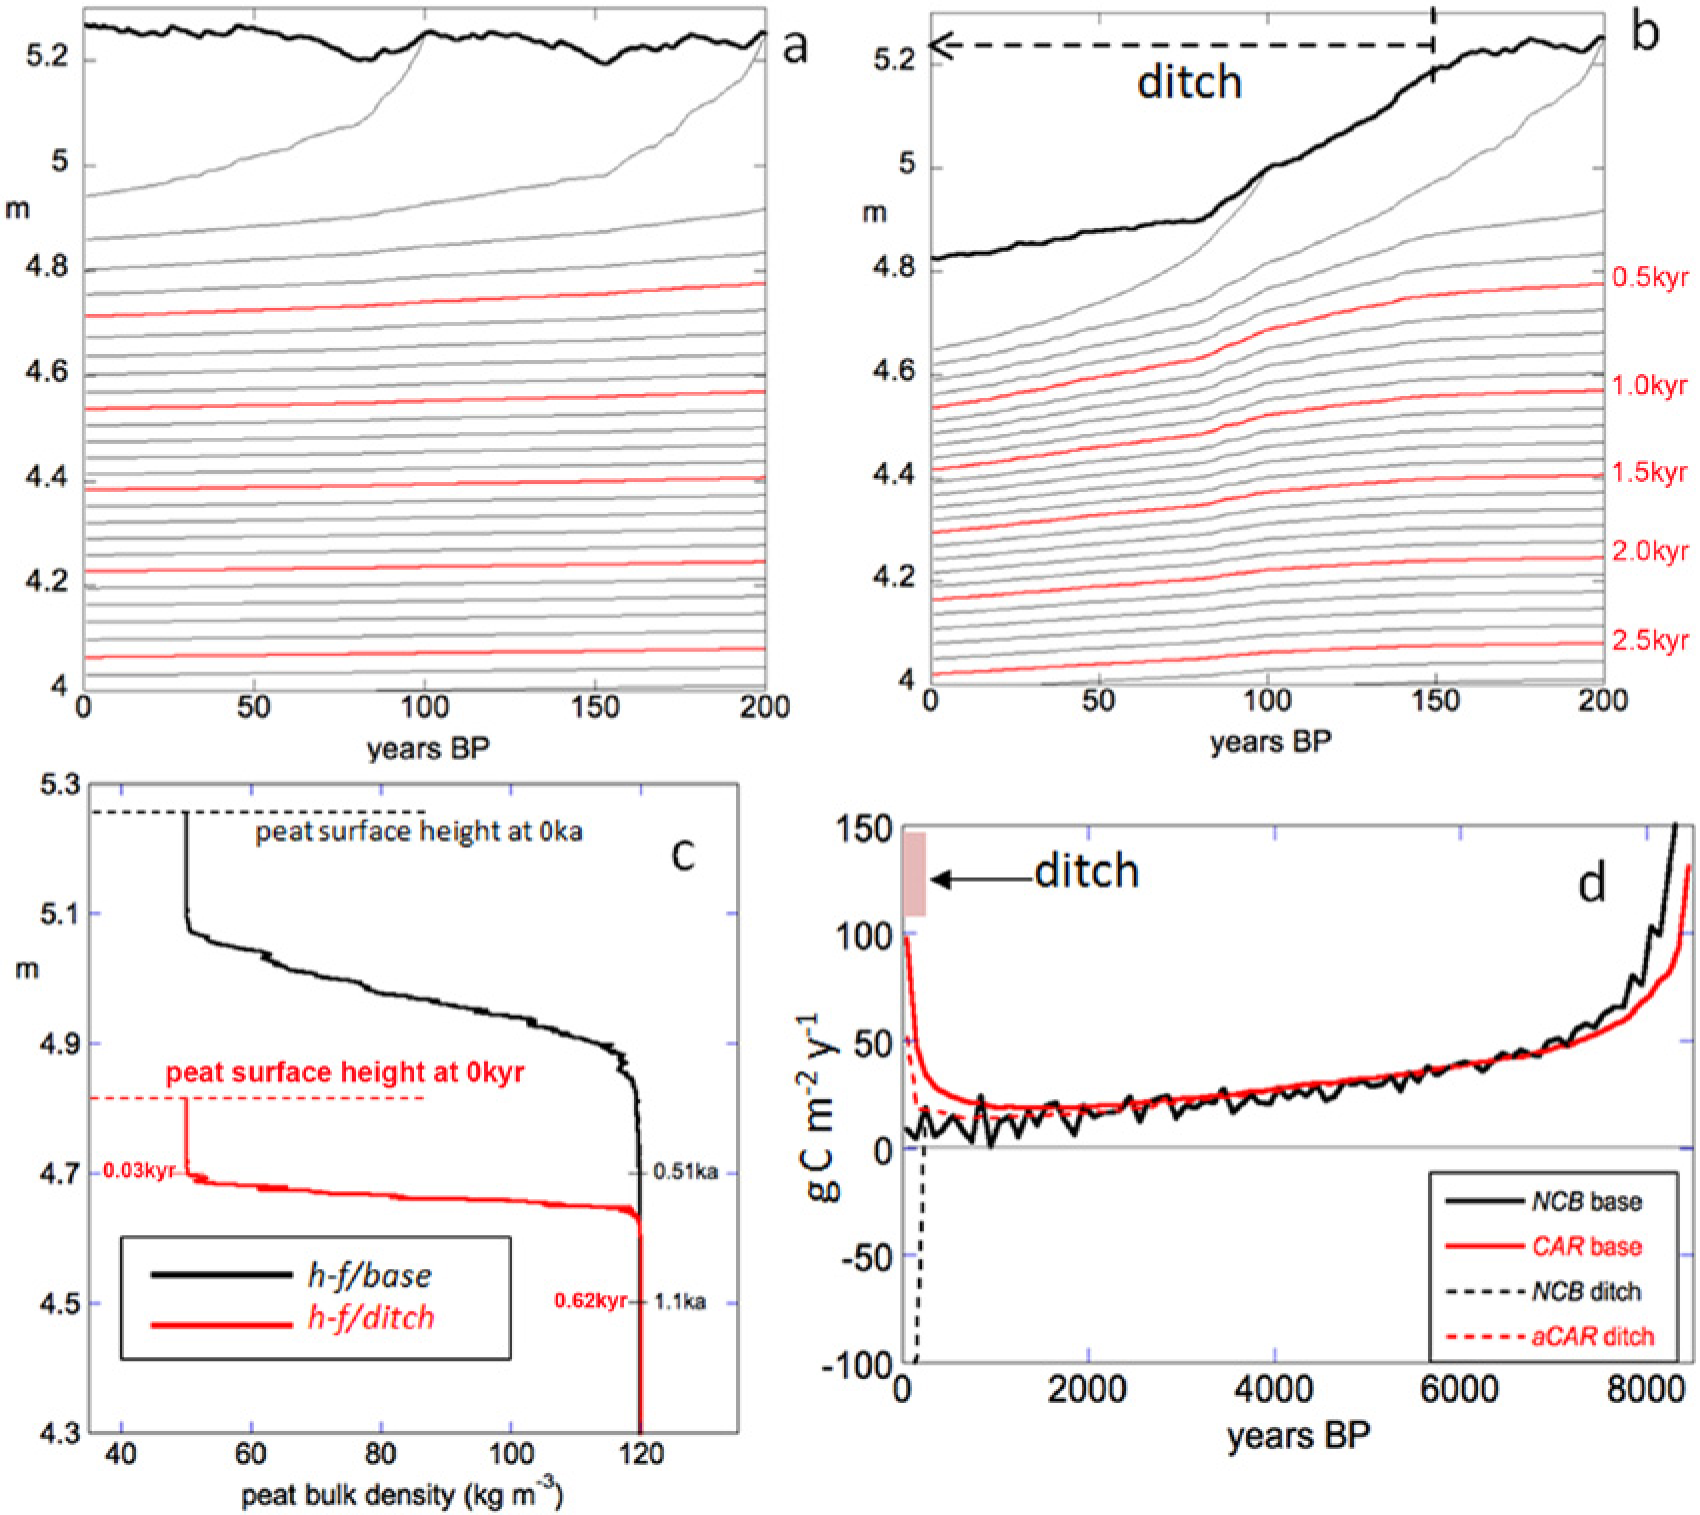
Peat cohort height (from base) trajectories over the final 200 years of the 8500-year (a) high-frequency/baseline (h-f/base) and (b) high-frequency/ditch (h-f/ditch) simulations. Heavy black line is peat surface height above base; thin lines track annual vertical position of annual peat cohorts formed every 100 years; red lines are labeled by initiation year in thousands of years BP (‘kyr’). The ditch was in place for final 150 years of the simulation; the water table was ~25 cm deeper with the ditch than in the baseline simulation. (c) Simulated peat bulk density profile in upper peat core at end of h-f/base (black) and h-f/ditch (red) simulations; y-axis is height above peat base. Horizontal dashed lines mark final surface elevation of simulated peat profile. Peat ages at 4.5 and 4.7 m above the base are noted. HPM simulates mass loss only, and bulk density changes associated with peat humification, but no physical subsidence due directly to peat dewatering. (d) Comparison of 100-year mean aCAR and NCB for h-f/base and h-f/ditch scenarios. Ditch timing and duration is represented by pink rectangle. Prior to ditching, precipitation and NCB were identical for baseline and ditch scenarios, though there are differences in aCAR.
Discussion
When integrated over the entire peat profile/age, LORCA and the mean NCB must both equal total peat C divided by total age. However, for shorter time scales, a peatland’s aCAR differs from the actual NCB that occurred over the aCAR interval (Figure 4). There are four important differences between NCB and aCAR. First, since aCAR is computed as carbon mass remaining divided by interval duration, it is necessarily positive for any datable interval (Figure 1c), while NCB can be positive or negative, both year to year (Roulet et al., 2007), and for longer intervals in HPM simulations (Figure 1d). Second, and equally fundamentally, aCAR is an observable quantity, measurable in principle for any time interval during a peatland’s developmental history, while NCB has not been measured until recently (e.g. Roulet et al., 2007), and only at a few sites, so a paleo-reconstruction of NCB must be derived from a model (Yu, 2011).
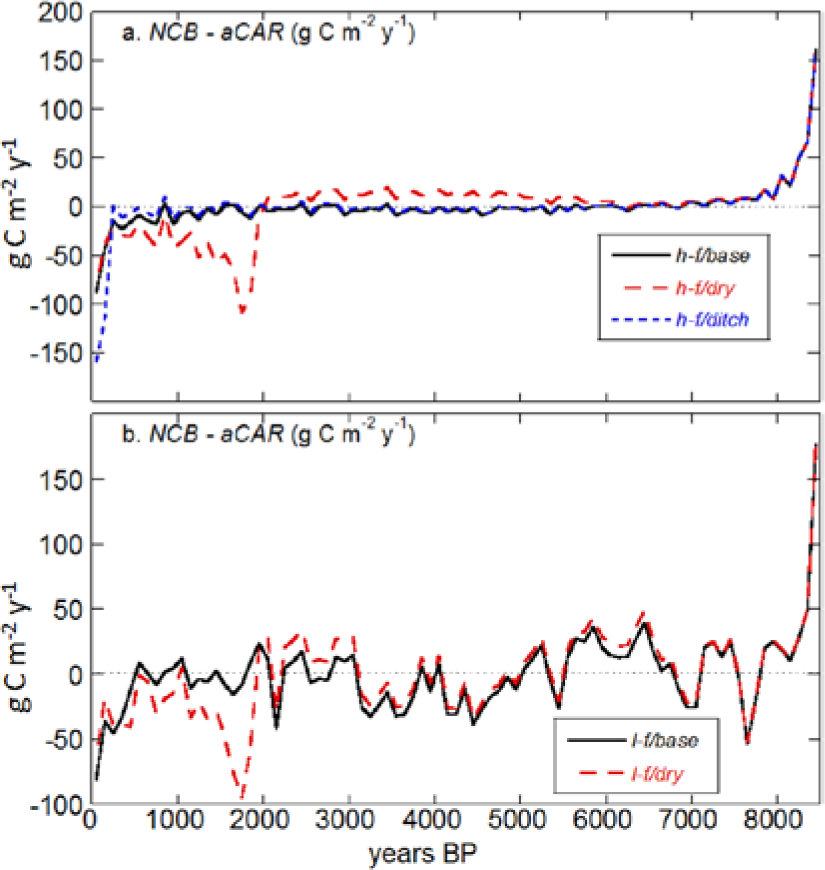
Difference between NCB and aCAR for (a) high-frequency/base, h-f/dry, and h-f/ditch and (b) low-frequency/base and l-f/dry. Difference computed as NCB minus aCAR for 100-year mean values.
A third difference is that aCAR quantifies the carbon remaining at the time of coring, while NCB is a past rate of net carbon exchange. The carbon in aCAR is less than the amount deposited during that interval, due to decomposition that has occurred since the younger date of the aCAR interval, which will be substantial, due to rapid loss of peat deposited near the end of the interval during its first few decades of decomposition in the acrotelm (Turunen et al., 2004). NCB is independent of decomposition occurring after the interval evaluated. Fourth, a peatland’s NCB during any particular interval will include decomposition losses from all peat that was already present at the start of the interval (i.e. all the older peat, deeper in the profile), while this makes no contribution to aCAR for the contemporaneous interval. Yu (2011) was the first to address these differences, estimating past NCB from observed aCAR by computing a post-interval carbon loss based on a fixed catotelm decomposition rate. Spahni et al. (2013) used the method of Yu (2011) to calibrate a process-based peat carbon model.
The relationship between aCAR during a particular time interval and the prevailing climate during that interval is necessarily compromised by any subsequent climate variability and change that influenced the decomposition rate of that interval’s peat (e.g. Figure 2). For a stable climate – for example, high-frequency/baseline, with interannual variability but no persistent deviations (Figure 1a) – this effect is probably not large – for example, high-frequency/baseline NCB and aCAR are generally similar (Figure 2e). This also manifested as smoothly declining cohort heights and stable spacing between iso-age lines after the cohorts have transitioned into the catotelm (Figure 2a). A stable climate impact was inherent in the global peat accumulation analysis of Yu (2011). In all other scenarios evaluated here, there were extended periods of a negligible or negative peat carbon balance, due to non-stable climate. These generated kinks in the cohort depth trajectories for the shallower cohorts and a narrowing of the gap between cohorts, implying relatively larger carbon mass losses below those cohorts (Figure 2b–d), and a reduced aCAR for those intervals, which occurred prior to the drying/net mass loss period (Figure 2e and f).
Finally, deeper peat was relatively unperturbed by climate variability/change on the scale evaluated here (see Figures 1f, 2b–d), even over a time scale of a few thousand years. This implies that climate change impacts will not likely penetrate more than 1–2 m into peat during the 21st century, unless they are more severe than the examples presented here. If these examples are representative, then, for estimating carbon impacts and feedbacks, it is more important to develop improved maps of peatland extent than of peat depth.
These conclusions are derived from simulations with a relatively simple model, so they should be considered heuristic hypotheses. In these simulations, NPP did not increase substantially with a drop in the water table. While this has been observed in drained, ombrotrophic peatlands (Minkkinen et al., 2002), increases in productivity can occur (Belyea and Malmer, 2004; Minkkinen et al., 2002). Decomposition rate sensitivities to tissue quality, peat moisture content and degree of humification are highly variable (Moore et al., 2007) – more complex than HPM’s simple representation. Other processes that may significantly affect a peatland’s NCB and aCAR are not included in HPM – for example, microtopography and its dynamics (Belyea, 1999; Nungesser, 2003), physical erosion (Worrall et al., 2003), fire (Turetsky et al., 2011), and temperature (Dorrepaal et al., 2009).
Nonetheless, if peatlands can have a negative/neutral carbon balance that persists, the simulation results presented here suggest that the observable aCAR for some significant period pre-dating this will necessarily be biased low relative to the actual NCB of that period. We do not suggest that aCAR and LORCA measurements and reporting are inappropriate or incorrect. aCAR and LORCA, not NCB, are the observables for past peat carbon dynamics. Our goal is to highlight the challenges in inferring the important biogeochemical metric NCB and information about the relationship between past climates and peat carbon balances from the observable aCAR, that is, aCAR ≠ NCB. Based on the ditch scenario simulation results (Figure 3), we suggest that this hypothesis could be most easily evaluated, both qualitatively and quantitatively, by collecting several peat cores from a large, relatively uniform peatland, part of which has been drained (substantially, but not catastrophically) for at least several decades. The cores would need to be analyzed to ~2 m depth, with relatively high-resolution dating of these peat profiles (and carbon bulk density) going back at least several hundred years and preferably 1000–2000 years (Figure 3). The hypothesis could be tested by comparing aCAR values for a core in the ditch disturbance and a nearby control core, for peat deposited before the ditch installation.
Footnotes
Acknowledgements
We thank R Spahni for providing the CRU-adjusted TraCE-21ka precipitation reconstruction. We benefited from discussions at the ‘Holocene Circum-Arctic Peatland Carbon Dynamics Training and Synthesis Workshop’ hosted by Lehigh University in October 2013 (workshop supported by NSF, INQUA, and PAGES), and discussions with R Dommain, S Kurnianto, SG Neuzil, and P Glaser. The manuscript benefited from comments and suggestions from J Loisel, Z Yu, and two anonymous reviewers. Model code and output available from lead author.
Funding
This work was supported by grants from the US National Science Foundation (DEB-1019523 and ARC-1021300), NASA (NNX-09AQ36G), Department of Agriculture (2011-67003-30373 and 10JV11242306135), and Department of Energy (DE-SC0010580).