



Abstract
During the last century, both earth surface temperature and moisture transport towards high latitudes have increased rapidly. The response of the sub-arctic region to these changes in terms of weathering, transport and delivery of terrigenous material towards the coastal and deep ocean is both complex and poorly understood. Sediments accumulating in fjords offer an excellent opportunity for studying such land–ocean interactions and may provide ultra-high-resolution records of environmental response to short-term climate variability. As a basis for Holocene climate change studies, modern sources, supply and distribution of particular sediment components in the Trondheimsfjord have been investigated and imply lithogenic elements as a promising proxy for terrigenous input and river discharge. To better understand the impact of atmospheric variability on central Norwegian environment, we examine instrumental time series and show that the dominant mode of the atmospheric circulation in the North Atlantic region, the North Atlantic Oscillation (NAO), has a strong impact on river discharge, temperature and precipitation in central Norway. In addition, elemental composition analysis of a short sediment core reveals that from 1959 to 2010, winter precipitation and temperature changes are recorded by changes in the inorganic geochemical composition of Trondheimsfjord sediments. Elemental ratios of Al/Zr and K/Ni in the sediment core MC99-3 show a close relation to small-scale, high frequency climate variations and large-scale changes in the Northern Hemisphere climate. This implies that terrigenous input and related erosional processes in the fjord hinterland are highly sensitive to atmospheric circulation variability in the North Atlantic region. By comparing our results with NAO records derived from ice accumulation rates of Norwegian glaciers, western Greenland ice sheets and river discharge anomalies in the Eurasian Arctic, we show that it is possible to reconstruct the NAO from sedimentary archives in central Norwegian fjords.
Keywords
Introduction
The investigation of sub-Arctic environmental response to climate variability requires well-dated high resolution archives from climate sensitive regions. One such region is the Trondheimsfjord in central Norway (Figure 1), which experienced relatively high sedimentation rates since the last deglaciation (approximately 0.3–0.5 cm/yr, Bøe et al., 2003; Rise et al., 2006). These sediments represent a natural repository for dissolved and particulate material derived from terrestrial weathering and erosion. Apart from the relatively warm northward flowing North Atlantic Current, the Norwegian coastal climate is strongly influenced by the North Atlantic Oscillation (NAO; e.g. Cherry et al., 2005; Dickson et al., 2000; Hurrell, 1995). This dominant mode of the atmospheric circulation is most pronounced during winter times (December–March) and swings between two phases: a positive (negative) NAO generates periods of warmer and wetter (colder and dryer) climate conditions in north-western Europe (e.g. Wanner et al., 2001). Changes in precipitation and temperature associated with NAO are assumed to alter the constitution of fluvial sediment flux from land towards ocean basins generated by weathering and erosion of bedrock and soils (e.g. Govin et al., 2012; Lamy et al., 2001; White and Blum, 1995). Moreover, several studies of sedimentary and mass-wasting processes in the Trondheimsfjord (Bøe et al., 2003, 2004; Hansen et al., 2011; L’Heureux et al., 2009, 2010, 2011; Lyså et al., 2008; Rise et al., 2006) imply Holocene climate variability as a potential trigger for geohazards. Exploring such a relationship between terrigenous input and changes in environmental conditions requires detailed knowledge of the transport mechanisms dominating particle supply (e.g. Zabel et al., 2001), although intricate fjord bathymetry combined with complex water circulation systems provides additional constraints on identifying climate proxies that pinpoint the terrigenous response to climate variability. In this study, we examine the inorganic geochemical record of the Trondheimsfjord sediments over the past 50 years (2010–1959). These data provide the possibility for a proxy calibration of selected sediment constituents to instrumental data of temperature, precipitation, river runoff and to large-scale modes of climate variability such as the NAO. Thus, the existing relationship between climate and sediment composition can be quantified, and the relative magnitude and impact of past changes can be better assessed. Investigations of Trondheimsfjord surface sediments and hinterland bedrocks show that the distribution of Al/Zr and K/Ni in the fjord sediments reflect regional sources of Al, Zr, K and Ni in the hinterland (Figure 2). Thus, by studying the lithogenic elements Zr, K, Ni and Al in temporally well-constrained sediment records, we may identify the causes, timing and extent of past changes in the erosion and weathering regime of the Trondheimsfjord catchment area associated with variable NAO modes.
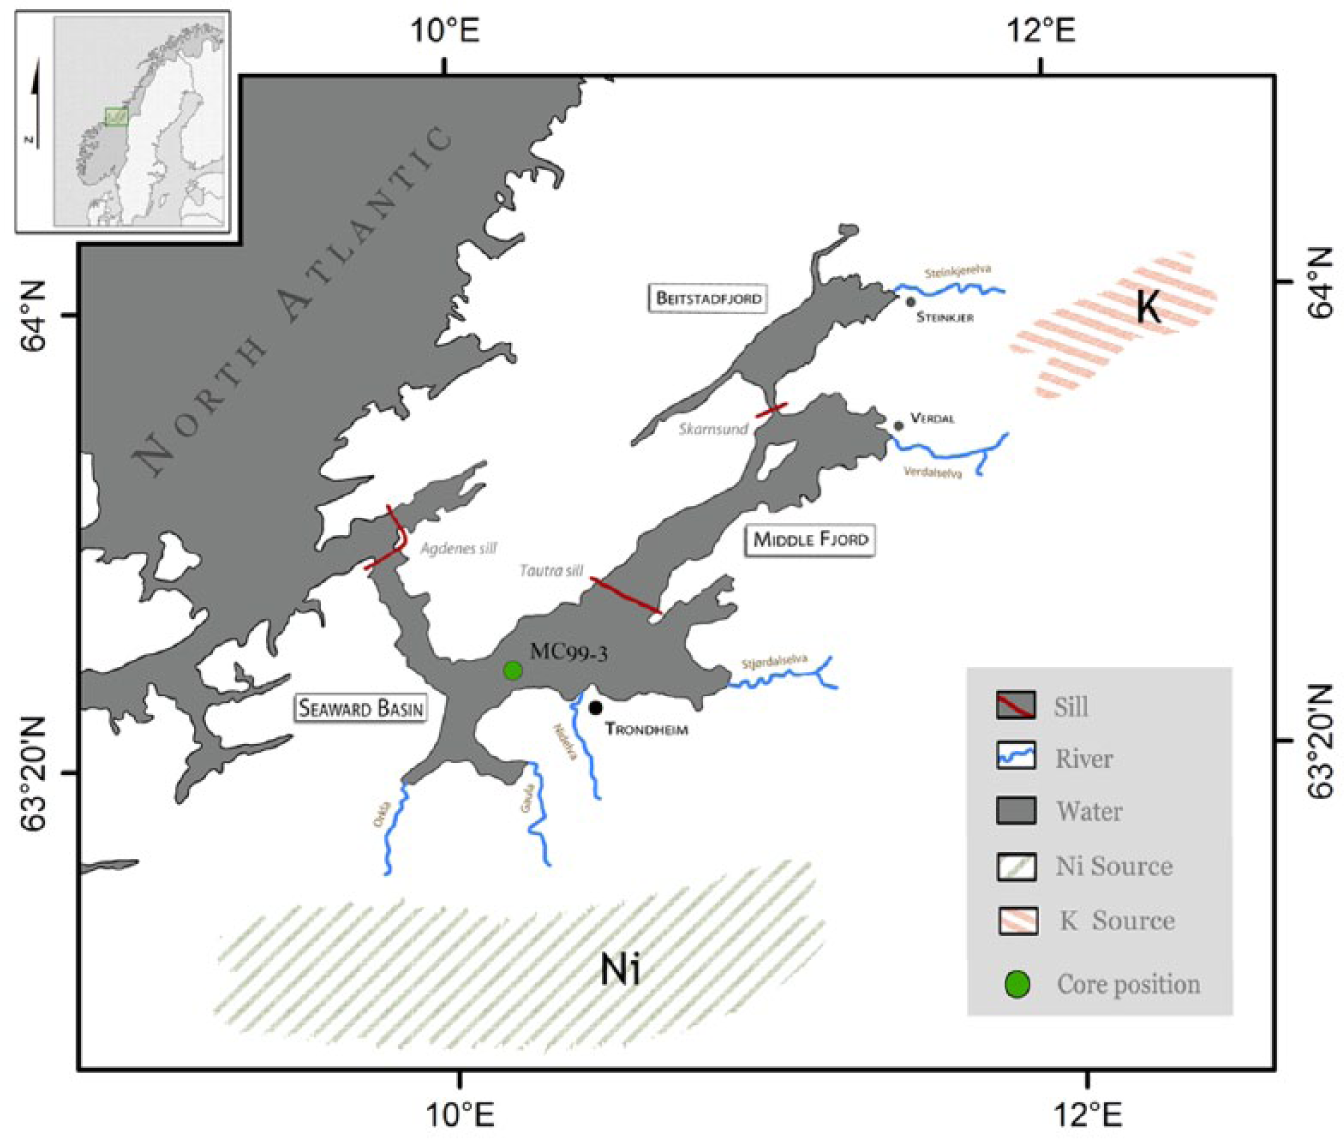
Location of the study area (upper left corner) and the Trondheimsfjord region with the core position of the MC99 (green circle) in the Seaward Basin. Three sills divide the fjord into three main basins, and the six main rivers enter the fjord form the south-east. Regional sources for Ni and K in the hinterland bedrock are greenstones and metagreywackes in the southern and Precambrian volcanic rocks in the northern region, respectively (Faust et al., 2014).
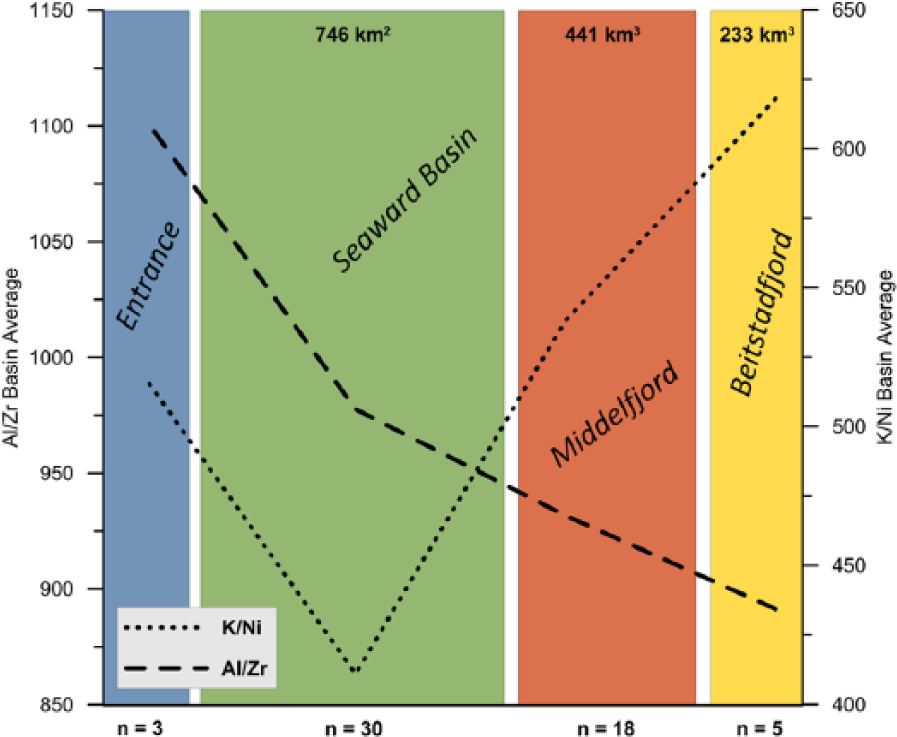
K/Ni and Al/Zr in Trondheimsfjord surface sediments (0–1 cm) shown as average values for each of the three main basins and the entrance area. Size of the basin areas is shown at the top, and the number of samples for each basin is indicated below (see Faust et al. (2014) for details).
In this paper, we show that changes in Trondheimsfjord regional temperature, precipitation and river runoff are strongly related to variabilities in the winter NAO. Moreover, our terrigenous proxies record small-scale, high frequency and large-scale long-term shifts in temperature and precipitation. These good relationships between regional sedimentary climatic proxies and key parameters of hydrological and atmospheric changes over the past 50 years potentially allow the reconstruction of long-term NAO variations from Trondheimsfjord sediments. With regard to an expected future warming and associated overall increase in runoff (Gedney et al., 2006; Labat et al., 2004), this study will also help to better estimate the expected impact of climate change on geohazards because of weathering and erosion.
Study area
The temperate Trondheimsfjord is located in the central part of Norway (63°40′N, 09°45′E, 64°45′N, 11°30′E; Figure 1). With a length of approximately 135 km, it is the third longest fjord in the country (Jacobson, 1983). Three sills, the Agdenes Sill at the entrance (max. 330 m water depth), the Tautra Sill in the middle section (max. 100 m water depth) and the Skarnsund Sill in the inner part (max. water depth 100 m), subdivide the Trondheimsfjord into three main basins: Seaward Basin, Middle Fjord and Beitstadfjord (Figure 1). The total fjord volume is 235 km3, total surface area 1420 km2, average tide 1.8 m and the average water depth is 165 m (Sakshaug and Sneli (2000) and references therein). The total drainage area is approximately 20,000 km2 (Rise et al., 2006), with a mean precipitation of about 1100 mm/yr. Six main rivers enter the fjord from the south-east: four in the Seaward Basin (Gaula, Orkla, Nidelva, Stjørdalselva), one in the Middle Fjord (Verdalselva) and one in the Beitstadfjord (Steinkjerelva; Figure 1). The freshwater supply from these rivers decreases the surface salinity and initiates an estuarine circulation (Jacobson, 1983) with a brackish surface layer 5–15 m thick (Öztürk et al., 2002). Although the fjord reaches depths up to 620 m, in general, water masses below the estuarine circulation cell can be described as an energetically low environment, and the distribution of sediments within the fjord is, therefore, largely controlled by the circulation and particle load in the upper part of the water column (Syvitski, 1989; Wendelbo, 1970). The temperature and salinity of Trondheimsfjord surface waters vary strongly with changes in insolation and river runoff (Jacobson, 1983). Because of the inflow of North Atlantic water, Trondheimsfjord deep water (below c. 100 m), however, shows stable temperature and salinity values of approximately 7.5°C and 34.8 PSU, respectively, throughout the year (Wendelbo, 1970).
Material and methods
Sediment cores: sampling and preparation
A short sediment core MC99-3 (26 cm; hereafter referred to as MC99) from the Trondheimsfjord Seaward Basin (water depth 504 m, 63°28′37″N, 10°11′37″E) was collected in April 2011 (Figure 1). The multi-core (5.5 cm diameter) was sliced in 1 cm intervals aboard the research vessel ‘RV Seisma’, and samples were stored in plastic bags at −18°C. Prior to further analyses, all samples were freeze-dried and, except for grain size measurements, homogenised through gentle grinding. All analytical techniques applied in this study are described in detail by Faust et al. (2014) and will be briefly summarised below.
Chronology
The chronology of the core is based on 210Pb and 137Cs content on neighbouring sediment core in the multi-corer rack (MC99-1). 210Pb and 137Cs measurements were made at EPOC, CNRS/University of Bordeaux 1, France. According to the age model of Milzer et al. (2013; Supplementary Table 1, available online), the sedimentation rate of the MC99-1 is 0.49 cm/yr and the core base age is 1959. The dating error increases gradually down core from ±0.07 to ±3.53 years.
Bulk elemental and grain size analyses
Sediment elemental composition was analysed at the ACME Ltd laboratory (Vancouver, Canada). Determination was performed by inductively coupled plasma atomic emission spectrometry (ICP-AES) following a four-acid digestion, which is considered to be a total digestion method. The analytical quality was calculated by duplicate analyses of every 20 samples and further controlled by using the certified multi-element soil standard OREAS 45e and the certified multi-element basalt standard OREAS 24p. Grain size distribution was determined by laser diffraction using a Coulter LS 200 instrument. The analysis was carried out on material within a particle diameter range of 0.4–2000 µm.
Instrumental data
Seasonal and annual mean air temperature and precipitation records for the Trondheimsfjord region since 1900 were obtained from the Norwegian Meteorological Institute (http://www.eklima.no). Time series (1963–present) of river discharge for the six largest rivers entering the Trondheimsfjord, Gaula, Orkla, Nidelva, Stjørdalselva, Verdalselva and Steinkjerelva (Figure 1) were obtained from the Norwegian Water Resource and Energy Directorate (http://www.nve.no). All data were collected at monitoring stations close to river outlets. The winter (December–March) principal component (PC)–based NAO index (Hurrell, 1995) is based on the difference of normalised sea level pressure between Lisbon, Portugal and Stykkishomur, Iceland, and the dataset was retrieved from https://climatedataguide.ucar.edu/climate-data/hurrell-north-atlantic-oscillation-nao-index-pc-based.
Results and discussion
Linkage between climate variability and terrigenous sediment supply
The inflow of relatively warm and saline Atlantic water keeps most of the Trondheimsfjord ice free during winter (December–March). However, the drainage areas of Trondheimsfjord experienced average winter air temperatures of −4.6°C over the last 50 years. Thus, precipitation in these regions occurs primarily as snow, rivers are often ice covered and freshwater inflow into the fjord is reduced. Annual precipitation and river discharge into the Trondheimsfjord are strongly correlated (Sakshaug and Sneli, 2000). Precipitation is highest in autumn and lowest in spring (Figure 3). However, the highest runoff occurs in late April to May and is primarily caused by snow melt (Figure 3). Thus, the major causes controlling the strength and duration of spring flooding events are winter precipitation (P), air temperature (T) and the resulting amount of river runoff (R) in April/May. As visually shown in Figure 4, and confirmed by principal component analysis (PCA), winter–spring river runoff, winter temperature and winter precipitation are closely linked to each other on an annual basis during the last 50 years (Supplementary Tables 2 and 3, available online). The first PC (PCA1) explains 81% of the variance and combines the three physical factors into a new RTP index (Figure 4). The strong relation between river runoff, temperature and precipitation (Figure 4) indicates that these regional records are strongly influenced by larger scale atmospheric or oceanic processes, such as the NAO.
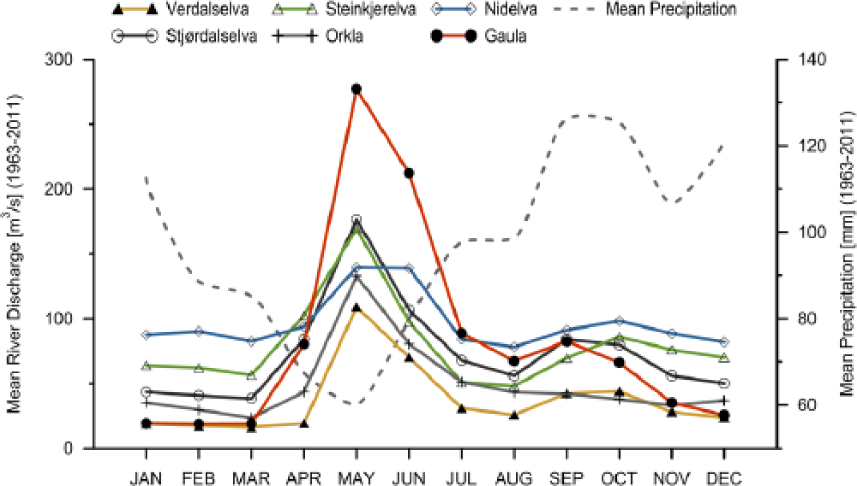
Monthly mean river discharge of the six main rivers entering the Trondheimsfjord and mean precipitation in the Trondheimsfjord region (1963–2011). During winter, rivers are often ice covered, precipitation occurs as snow and the runoff is very low. Snowmelt causes spring floods; thus, annual river discharge is highest in May–June. Precipitation in the Trondheimsfjord region is highest in autumn, but the effect on river discharge is small compared with the discharge in spring.
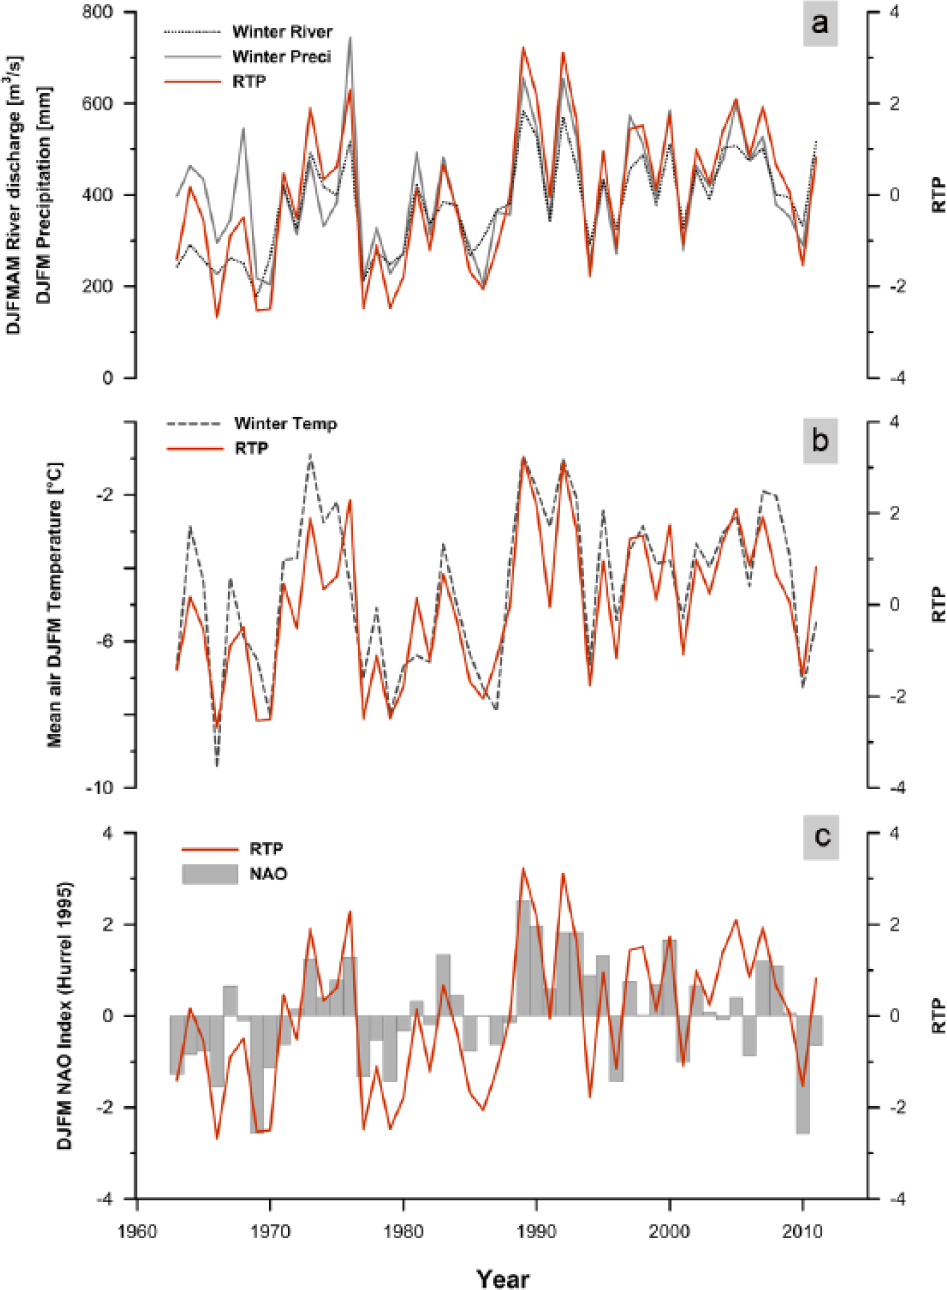
(a) River discharge (DJFMAM) precipitation (DJFM) and RTP (the annual winter mean of normalised river discharge (R), air temperature (T) and precipitation (P)) since 1963. (b) Air Temperature (DJFM) and RTP (c) Comparison between RTP and the PC-based winter NAO index from http://climatedataguide.ucar.edu/guidance/hurrell-north-atlantic-oscillation-nao-index-station-based.
Numerous studies suggest that the NAO has a strong impact on the Norwegian climate. For example, Dickson et al. (2000) showed from spatial analysis of Northern Hemisphere winter precipitation that positive NAO periods are characterised by positive precipitation anomalies in Scandinavia. Moreover, Cherry et al. (2005) found 55% of river discharge variation within Norway is associated with NAO variations. In accordance with these findings, our Trondheimsfjord regional RTP record shows a very good correlation to the winter NAO index (Figure 4 and Supplementary Table 2, available online), confirming that regional temperature and precipitation in the Trondheimsfjord area are responding to changes in large-scale Northern Hemisphere climate patterns.
To date, the only detailed studies of sediment transport in Trondheimsfjord rivers are within the River Gaula, where between 1975 and 1976, more than 90% of the annual sediment transport occurred during spring floods (Bulgurlu, 1977). Although the total annual water runoff differed by only 13%, a higher level and longer duration of spring flooding in 1976 generated a 68% increase in the total sediment transport compared with 1975. Our working hypothesis is that the other main rivers entering the fjord show similar sediment transport behaviour. The latter is supported by (1) a similar vegetation and landscape of the entire Trondheimsfjord drainage area, (2) an up to 15-m-thick brown brackish surface water layer often observed to cover the entire fjord in spring and (3) concurrent snow melting in the whole Trondheimsfjord region. As drainage basin temperature and precipitation are primary controls on the intensity of terrestrial weathering and erosion (Syvitski, 2002; White and Blum, 1995), the elemental composition of the terrigenous material delivered into the Trondheimsfjord is likely able to record past NAO changes.
NAO as determinant of temporal variation in terrigenous material supply
Chemical and mechanical weathering fluxes depend on climate through changing temperature and precipitation (e.g. Gislason et al., 2009; White et al., 1999). Bulk sediment elemental ratios can detect changes in the onshore weathering conditions and the intensity of the transport process such as freshwater discharge (e.g. Bertrand et al., 2012; Koinig et al., 2003; Zabel et al., 2001). Our previous study of numerous surface sediments provides evidence that Trondheimsfjord sediments are an excellent (recent) geochemical archive potentially reflecting the intensity of river discharge and therefore also the variability of the NAO (Faust et al., 2014). To further validate these findings and gain a better understanding of the environmental response to climate variability within the Trondheimsfjord region, we analysed the bulk geochemical composition of a short sediment core MC99 from the Trondheimsfjord Seward Basin (Figure 1).
In the following, we will (1) illustrate processes responsible for observed changes in elemental ratios of Al/Zr and Ni/K, and (2) show their potential to detect NAO related regional changes in air temperature, winter precipitation and river discharge in Trondheimsfjord sediments. The high resolution record of the MC99 enables us to capture past-environmental variabilities that are comparable with the instrumental records. However, the sampling resolution of approximately 2 years is still too low to reveal strong interannual variations. Thus, we compare our proxy records with 3-year running averages of the RTP data.
Because of a sudden rise in the K concentrations, samples dated between 2010 and 1985 show much higher concentrations (16% in average) compared with the samples between 1985 and 1959 (Figure 5). However, no sedimentological (grain size, colour) difference between the upper and lower part of the core can be identified, and a similar rise is not observed in any other elemental record. Since we cannot fully exclude an analytical problem or anthropogenic impact for this offset, we divide the K/Ni record into two sections (lower: 1959–1984, upper: 1984–2010) and individually compare the K/Ni records with RTP and NAO (Figure 5). Still, K/Ni closely follows the winter RTP curve in the range of the dating error (≤±1 year) in the upper and lower record, implying K/Ni accurately records temporal changes in the supply of terrigenous material (Figure 5). Furthermore, as expected from the good correlation between RTP and NAO, K/Ni shows a clear relation to the NAO over the investigated time span as illustrated by distinct K/Ni peaks during positive NAO phases (e.g. 1961, 1967, 1973 and 1992).
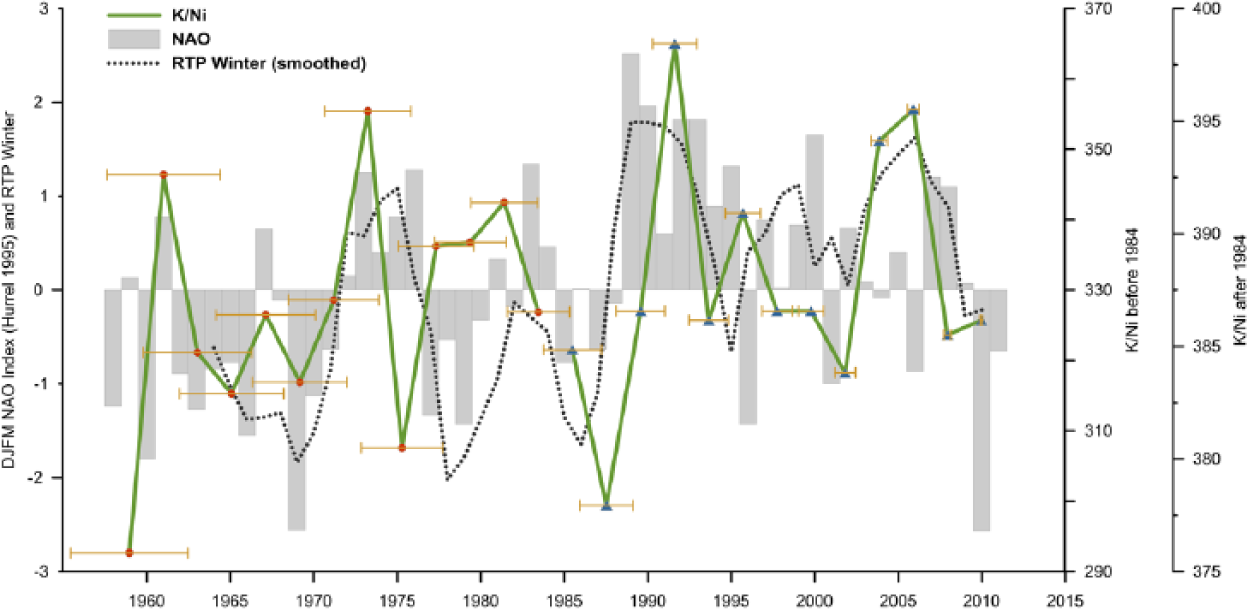
Comparison between K/Ni (Supplementary Table 1, available online) from the MC99, NAO (DJFM) and a 3-year running average of the winter RTP. Age error for each K/Ni measurement is indicated by yellow bars (Supplementary Table 2, available online). Note the different scale for the K/Ni record. Because of a leap in the K concentrations (see text for details), we divided the K/Ni record into lower sections (green line with red circles) and upper sections (green line with blue triangles) at 1984.
Recently, Faust et al. (2014) investigated the organic and inorganic composition of 60 evenly distributed surface sediment samples and revealed that the distribution of K/Ni in the fjord sediments reflects regional geological bedrock pattern in the northern and southern hinterland, respectively (Figures 1 and 2). Greenstones and metagreywackes located along the southern side of the fjord are the main Ni source in Trondheimsfjord sediments (Figure 1). Thus, Ni enters the Trondheimsfjord mainly via the rivers Orkla, Gaula and Nidelva directly into the Seaward Basin. On the other hand, K originates largely from Precambrian felsic volcanic rocks related to a tectonic window called Tømmerås anticline (see Roberts (1997) for details) in the north-eastern hinterland (Figures 1 and 2). Hence, K enters the Trondheimsfjord primarily by the rivers Verdalselva and Steinkjerelva into the inner part of the fjord. We assume that the distribution of K and Ni rich material within the fjord takes place in the brackish surface current, above the halocline (Hoskin et al., 1978) because the water column below the estuarine circulation cell is a relatively low energy environment (Syvitski, 1989). Moreover, during periods of high river discharge, the velocity of the fjord’s surface currents is high, the water column is well stratified and the suspended material is transferred over longer distances. Hence, increased river discharge will strengthen surface water currents, and more K will be transported from the Middlefjord basin in the north across the Tautra sill into the Seaward basin in the south. Alternatively, hyperpycnal flows associated with sediment-laden river discharges and turbidity currents can also affect the distribution of terrigenous sediments in the Trondheimsfjord (Bøe et al. (2004) and references therein). However, the sediment core MC99 is composed of homogeneous very fine grained material. More than 90% of the sediment grains are smaller than 63 µm, and the grain size maximum is only 250 µm. Moreover, it has a linear sedimentation rate (0.49 cm/yr). Hence, it seems very unlikely that the core position has been affected by strong and variable bottom currents during the past 50 years. Thus, we propose that the good relation between RTP and K/Ni in the MC99 can be explained by the variable strength and duration of the annual spring floods. A strong (weaker) flooding event will generate higher (lower) surface velocity and transports more (less) K across the Tautra sill, causing an increase (decrease) in the K/Ni values. Finally, the annual spring floods are caused by snow melt, and therefore, K/Ni is related to the NAO variability because of its impact on winter precipitation and winter temperature (Figure 5).
The comparison of Al/Zr from the MC99 with NAO (DJFM) and the winter RTP is shown in Figure 6. Similar to the K/Ni record, the Al/Zr ratio closely follows the winter RTP curve between 1959 and 2002. The temporal offset between relative maxima and minima of Al/Zr and RTP is less than the dating error. Because of very low and very high Al/Zr values in 2004 and 2008, respectively, the relation between RTP and Al/Zr in the period 2004–2010 is less clear. However, besides these two data points, Al/Zr is shown to be sensitive to regional changes in winter precipitation, river discharge and temperature (as summarised by the winter RTP curve), which are in turn strongly related to the NAO. These findings indicate that large amounts of Al-rich (clay) minerals are transported into the fjord during the snow melt and the resulting spring flooding events. Because of a rapid Holocene glacioisostatic uplift of the Trondheimsfjord region (approximately 175 m), large onshore areas are dominated by fjord-marine and glacio-marine clays which contain high proportions of Al-rich illite and chloride (e.g. Hansen et al., 2011; Lyså et al., 2008; Rise et al., 2006). Therefore, it is likely that these clays contribute considerably to the delivery of Al-rich material to the Trondheimsfjord especially during flooding events. It is generally assumed that an increase of Zr concentration in sediments points to enhanced physical weathering (e.g. Koinig et al., 2003). Bertrand et al. (2012) found Zr/Al to be well suited for estimating changes in the energy of terrestrial sediment supply in Chilean fjords. Zr is most often associated with the very dense minerals zircon (ZrSiO4) and baddeleyite (ZrO2). Thus, Zr is generally expected to be concentrated in the coarse grain fraction (e.g. Ganeshram et al., 1999). As Zr, Al is a conservative element, and because of its strong relation to the clay fraction, it is often used as a normaliser to limit granulometric effects. As a result, lower (higher) Al/Zr values are assumed to occur during stronger (weaker) river discharge. However, as shown in Figure 6, Al/Zr in this study correlates positively with RTP and NAO. One probable reason for this behaviour is that in the sediment core MC99, Al is positively correlated to the grain size fraction < 63 µm (r2 = 0.55), while Zr shows no clear statistical relationship to any grain size fraction. Best regression for Zr was found with the grains size fraction < 63 µm (r2 = 0.2). Moreover, Zr and Al are well correlated (r2 = 0.6). This indicates that Zr in the MC99 originates rather from fine grained, heavily weathered material and from Zr ions adsorbed to clay minerals. We thus consider that Zr/Al in this study is not related to grain size changes. Furthermore, previous investigations of fjord surface sediments reveal Al/Zr to increase from the inner part of the fjord (Beitstadfjord) towards the fjord entrance (Figure 2; Faust et al., 2014). These points to either a Zr source in the northern or an Al source in the southern hinterland. However, geochemical surveys of the Trondheimsfjord drainage area show that Al is ubiquitous in the fjord’s hinterland. A distinct Zr source in the north could explain the affinity of Zr to the fine grain fraction in our core. Because of the large distance between the Zr source in the north and the position of the MC99, larger and heavy Zr rich grains might not be transported over such long distances. In fact, bedrock analyses suggest Precambrian rocks (same source rocks as for K) as a possible Zr source, and a good relation between Zr and K (r2 = 0.6) supports the suggestion. However, the relation between Zr and K is as good as between Zr and Al, and floodplain sediments (Ottesen et al., 2000) do not confirm a Zr anomaly in the northern drainage area. Further studies are needed to identify the Zr source in the sediments of the Seaward Basin.
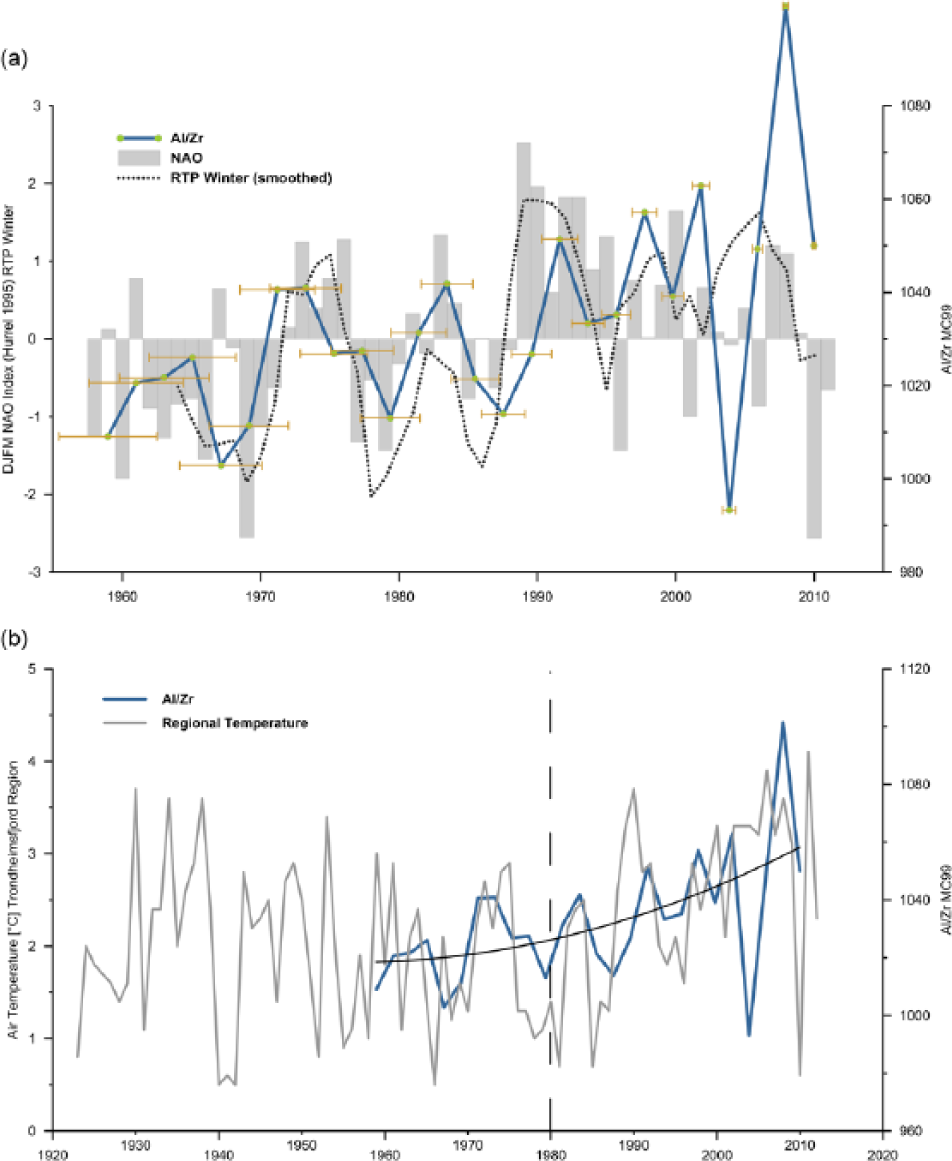
(a) Comparison between Al/Zr (Supplementary Table 1, available online) from the MC99, NAO (DJFM) and a 3-year running average of the winter RTP. Age error for each Al/Zr measurement is indicated by yellow bars (Supplementary Table 2, available online). (b) Comparison between Al/Zr and the air temperature in the Trondheimsfjord region. The dotted line indicates a gradient shift in the air temperature and in Al/Zr record at approximately 1980.
Implications and conclusion
With a global surface temperature increase of 0.6°C between 1975 and 2005 (Hansen et al., 2006), the time span discussed in this study corresponds to the most rapid recent global warming periods (e.g. Jones et al., 2001). Consequently, because of the direct link between temperature and weathering (e.g. West et al., 2005; White and Blum, 1995), overall weathering rates are expected to increase. In addition to the short-term changes of K/Ni and Al/Zr, the Al/Zr record reveals a long-term increasing trend with a shift towards a steeper gradient from approximately 1980 until today (Figure 6). We assume that the overall increase of Al/Zr and the gradient shift is a response to an increase in weathering and erosion favouring the input of Al-rich clay minerals. This assumption is supported (1) by a strong agreement of Al/Zr with the Trondheimsfjord regional air temperature record (Figure 6) and (2) by the course of the <63 µm fractions in the MC99 (Figure 7). The air temperature from the Trondheimsfjord region overall decreases slightly from 1920 until approximately 1980, and then in accordance with the global surface temperature record (Hansen et al., 2006), it increases steeply until about 2005 (Figure 6). Similar to the temperature record, the <63 µm fraction in the MC99 slightly decreases from 1960 (92.7%) to 1983 (91.3%) and afterwards increases to the highest value in the record in 2008 (95.3%; Figure 7). These findings show that Al/Zr in sediments of the Seaward Basin records two climatic processes: (1) a short-term variability portably caused by changes in the seasonal strength and duration of spring floods and (2) a long-term weathering development caused by an increase in the Al-rich clay fraction because of enhanced weathering and erosion.
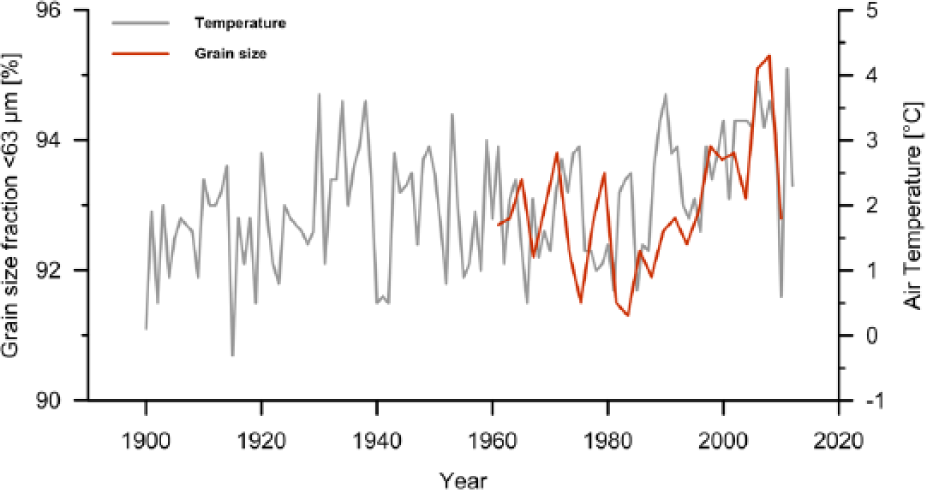
Comparison between the grain size fraction < 63 µm (Supplementary Table 1, available online) and the air temperature in the Trondheimsfjord region.
The long-term response of the hinterland to climate variability is not confirmed by the K/Ni because of the conciseness of both segments. However, the observed changes in the chemical composition of the Trondheimsfjord sediments in close relation to the rapid variability of NAO and atmospheric temperatures (Figures 5 and 6) suggest that weathering and erosion in the Trondheimsfjord hinterland respond very sensitive to climate change. Gravitational sedimentary processes in the Trondheimsfjord region are common today (e.g. L’Heureux et al., 2010), and a relation between periods of warm/wet climate and increased land slide activity during the Holocene in the Trondheimsfjord region was reported by Bøe et al. (2003). The ongoing increase in global surface temperatures and the related increase in the moisture transport from lower to higher latitudes are therefore likely to induce an increase in erosion and river sediment load of Trondheimsfjord rivers. Accelerated sedimentation and erosion are considered to be one of the main potential factors triggering slope failures, sub-marine mass movements (e.g. L’Heureux et al., 2011, 2013; Masson et al., 2006) and quick-clay landslides in the Trondheimsfjord region (Hansen et al. (2011) and references therein). The risk for geohazards in future times can therefore be expected to increase in central Norway. Based on this assumption, one might expect the MC99 to show an increase in the sedimentation rate for the last 50 years, which is not shown by the radiogenic isotope-based chronological framework (Milzer et al., 2013). While a change in the sedimentation rate could be masked by the dating error, we are highlighting that most sediments are probably transported to the position of the MC99 in a brackish surface water layer in a pulse during spring. This configuration possibly will limit the amount of material reaching the position of the MC99. Further studies of river load and sediment cores close to the river outlets are required to reveal the mechanism of the sediment transport in more detail.
The correspondence between NAO, RTP, K/Ni and Al/Zr suggests that the terrigenous input to the Trondheimsfjord responds to changes in large-scale Northern Hemisphere climate patterns. In order to further investigate the reliability of the elemental composition of Trondheimsfjord sediments as climate proxy, we compared the continuous Al/Zr record with the following three NAO records from the circum-North Atlantic region (Figure 8): (1) winter snow accumulation rates on a small glacier (Ålfotbreen) located near the coast approximately 300 km south-west of the Trondheimsfjord (Nesje et al., 2000), (2) total annual discharge of the six largest Eurasian Arctic rivers (Yenisey, Lena, Ob, Kolyma, Pechora and Severnaya Dvina; Peterson et al., 2002) and (3) normalised proxy NAO index based on western Greenland ice accumulation rates (Appenzeller et al., 1998).
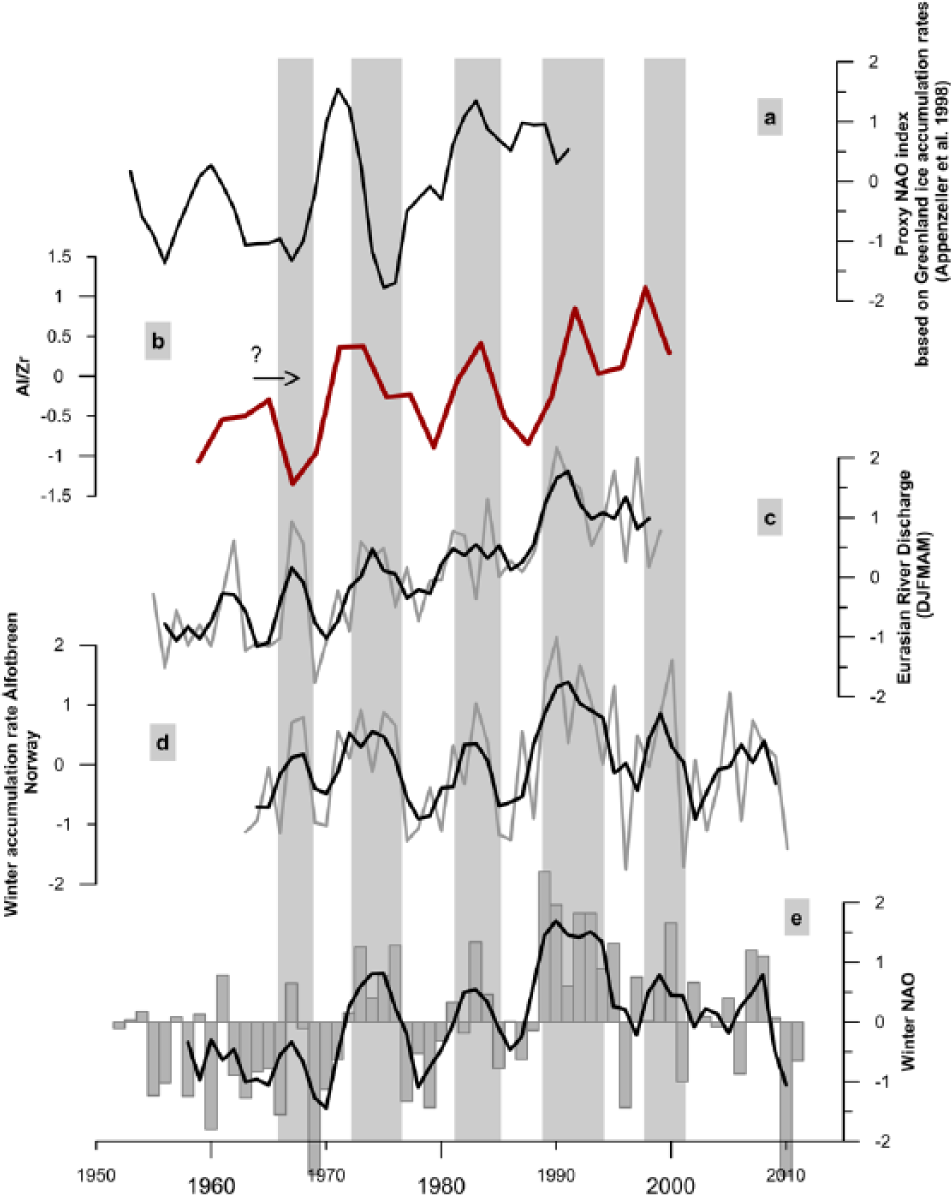
(a) Normalised proxy NAO index based on western Greenland ice accumulation rates (see Appenzeller et al. (1998) for details). (b) Normalised Al/Zr record between 1959 and 2002. Very high and low values in 2004 and 2008 were treated as outliers. (c) Combined and normalised Eurasian River discharge (DJFMAM) from the six largest arctic rivers: Yenisey, Lena, Ob, Kolyma, Kolymskoye, Pechora and Severnaya Dvina. We utilise the same river discharge data as Peterson et al. (2002) from the R-ArcticNet database, but only total discharge values for the time period December–May, 1959–1999. In this period (December–May), discharge is much stronger related to the NAO (DJFM; r2 = 0.46) as the annual runoff (r2 = 0.11). The comparison between the 3-year running averages (black lines) shows this even more clearly: r2 = 0.70 compared with r2 = 0.17. (d) normalised annual winter accumulation on the Norwegian glacier Ålfotbreen located approximately 300 km south-west of the Trondheimsfjord near the coast. Similar to the precipitation in the Trondheimsfjord area, positive (negative) NAO periods correspond to large (little) winter accumulation (see Nesje et al. (2000) for details). The black line is a 3-year running average. (e) Winter (DJFM) NAO index from https://climatedataguide.ucar.edu/climate-data/hurrell-north-atlantic-oscillation-nao-index-pc-based. The black line is a 3-year running average. Grey bars indicate five positive NAO phases (1: 1966–1968; 2: 1972–1976; 3: 1981–1985; 4:1989–1994; 5: 1998–2001).
Figure 8 shows a strong relation between the 3-year running average of the accumulation rate from the Ålfotbreen and the river runoff of the Eurasian Arctic rivers. Both records indicate the strong impact of the NAO on the precipitation patterns in Eurasia. The elemental ratio of Al/Zr in Trondheimsfjord sediments show a close relation to these records (Figure 8), implying that terrigenous input, and thus weathering and erosion in the central Norwegian hinterland, responds very sensitive to atmospheric circulation variability. Only the older part deviates slightly from the NAO pattern which might be related to the increasing dating error with core depth. The NAO index from Appenzeller et al. (1998) is less well related to any of the parameters in Figure 8. Appenzeller et al. (1998) noted that the accumulation measurement of the top metres of the ice core is difficult because of uncertainties in the density measurements. Furthermore, Mosley-Thompson et al. (2005) analysed the same ice core data used by Appenzeller et al. (1998) and found a decrease in the correlation between NAO and the accumulation rate from r2 = 0.53 in the period 1865–1925 towards r2 = 0.23 in the period 1926–1994. Mosley-Thompson et al. (2005) assumed that this change is caused by the Arctic warming and related change in the NAO impact on precipitation variability in west-central Greenland. Nevertheless, the difference of the NAO index provided by Appenzeller and the other records in Figure 8 indicates that the temporal impact of the NAO in Greenland might be different as in Eurasia.
We conclude that the winter NAO is strongly related to changes in regional temperature, precipitation and river runoff in central Norway. Moreover, our terrigenous proxies recorded both small-scale, high frequency and large-scale long-term shifts in temperature and precipitation in the Northern Hemisphere over the past 50 years. By comparing our results with NAO records from the broader Atlantic–Arctic region, we show that it is possible to reconstruct a proxy NAO index from sedimentary archives in central Norwegian fjords on longer time scales.
Footnotes
Acknowledgements
We thank the captain Oddvar Longva, and the crew of the RV Seisma for their professional support during our expedition. For their interest, stimulating discussions and many useful comments, we thank our colleagues Karl Fabian, Ola Mange Sæther, Simone Sauer, Reidulv Bøe, Anne Dehls and John Naliboff. We also thank James Hurrell and the National Center for Atmospheric Research Staff for providing the NAO index data as well as Christof Appenzeller (ETH) for making his proxy NAO index available for us.
Funding
This work is a contribution to the CASE Initial Training Network funded by the European Community’s 7th Framework Programme FP7 2007/2013, Marie-Curie Actions, under Grant Agreement No. 238111.
References
Supplementary Material
Please find the following supplemental material available below.
For Open Access articles published under a Creative Commons License, all supplemental material carries the same license as the article it is associated with.
For non-Open Access articles published, all supplemental material carries a non-exclusive license, and permission requests for re-use of supplemental material or any part of supplemental material shall be sent directly to the copyright owner as specified in the copyright notice associated with the article.
