
Abstract
This paper presents the results of a study of surface pollen deposition on 26 glacier forelands in the Jostedalsbreen–Jotunheimen region of southern Norway. Numerical techniques, including two-way indicator species analysis (TWINSPAN), detrended correspondence analysis (DCA) and canonical correspondence analysis (CCA), are used to identify distinct plant assemblages, to examine the pollen–vegetation relationship and to distinguish broad trends in the data. The source of pollen is fundamental; the majority of samples, especially those from sparsely vegetated sites, are dominated by arboreal pollen (up to 90% of the total land pollen (TLP) sum), most with a long-distance source. However, indicator taxa, notably Salix and Empetrum, although present at low frequencies, can hold the key to the true nature of the local vegetation. Indicator taxa produce strong correlations between their presence in the vegetation and representation in the pollen spectra, at times essential to distinguish plant communities. Multivariate analysis of the 197 surface pollen samples and vegetation data indicates the broad division of the sub-alpine and alpine vegetation into four major groups: pioneer communities, snowbed communities, heath communities and woodland. The primary DCA ordination axes show significant correlations with altitude and terrain age (e.g. correlation r = 0.36 between altitude and non-arboreal pollen (NAP) Axis-1). The most readily interpretable results are produced by CCA simultaneous ordination of vegetation data and NAP data. The potential for improving the interpretation of Holocene vegetation is assessed.
Keywords
Introduction
This paper is the second part of a study of surface pollen deposition on glacier forelands in the Jostedalsbreen–Jotunheimen region of southern Norway. The initial paper focussed on the vegetation–surface relationship at Storbreen foreland (Pardoe, 2006). This paper extends the study to a further 25 glacier forelands in order to examine regional trends in surface pollen deposition and to incorporate a wider range of plant communities (Figure 1). Few studies of surface pollen deposition on individual forelands exist (Birks, 1977, 1980; Caseldine, 1989; Jochimsen, 1972, 1979; Pardoe, 1996, 2001, 2006), but there have been no previous studies of surface pollen deposition on glacier forelands on the regional scale.
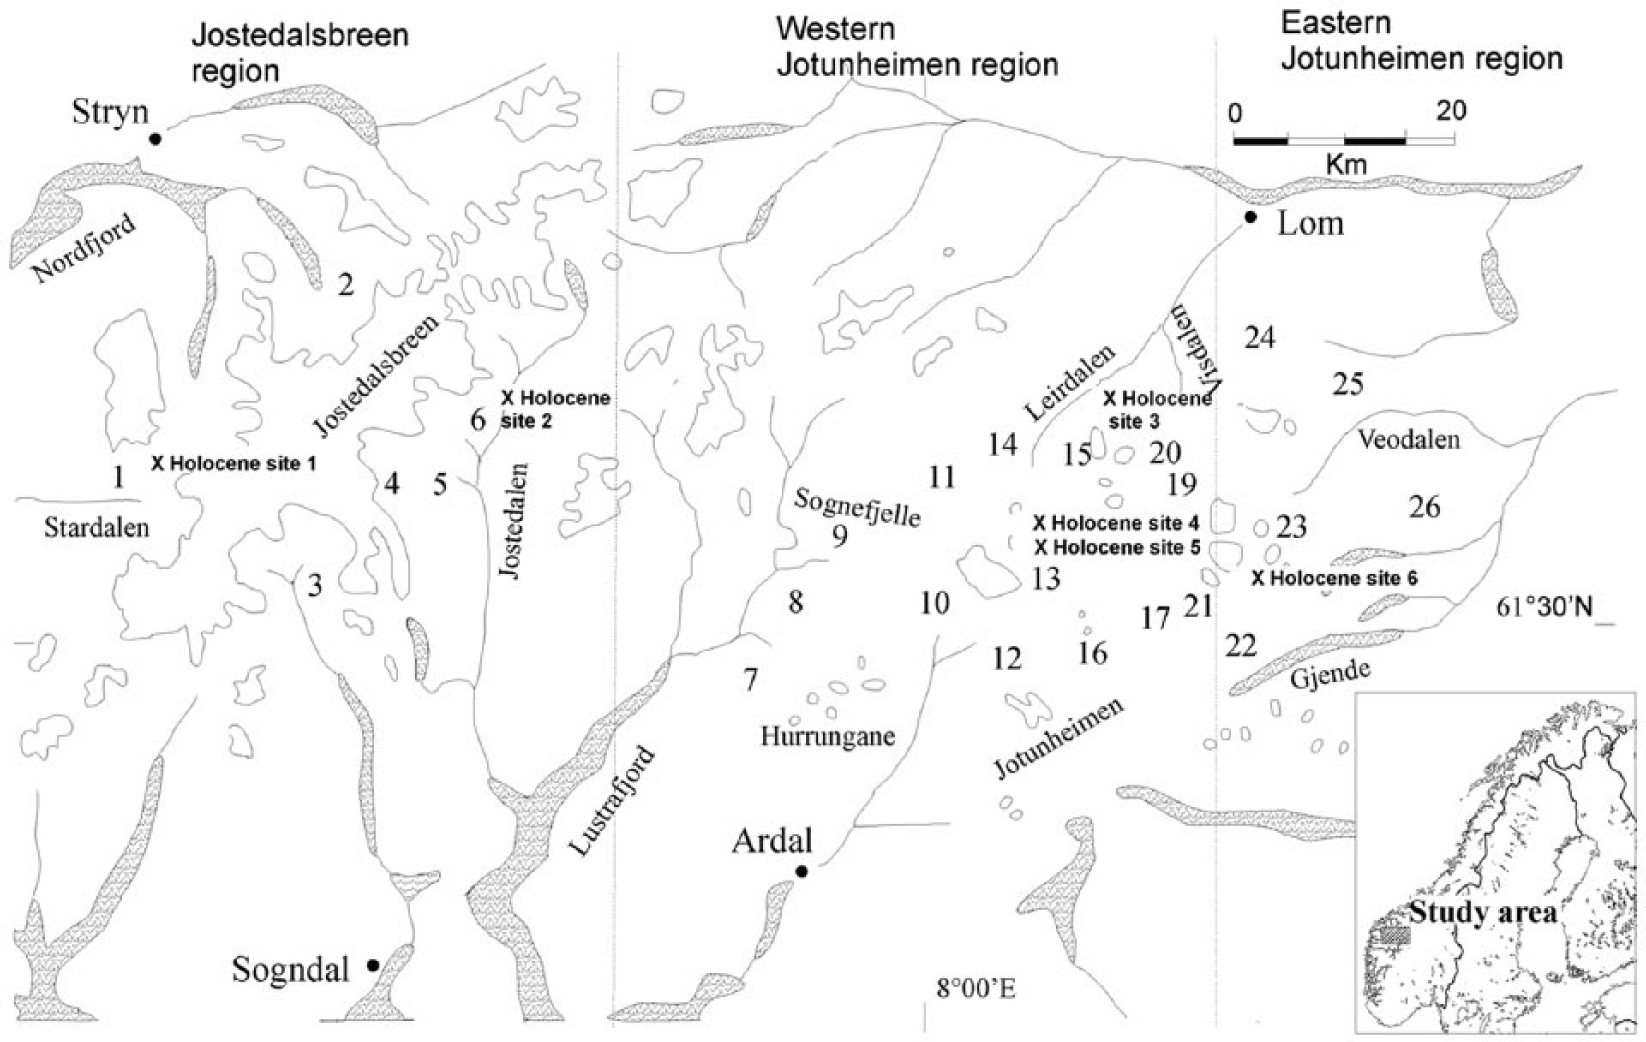
The location of the 26 glacier forelands and six Holocene sites involved in the study.
Study of the relationship between vegetation and patterns of surface pollen deposition is fundamental to the identification of present-day analogues for past plant communities and the elucidation of vegetation change (Bennett and Hicks, 2005; Broström et al., 2004; Caseldine and Pardoe, 1994; Hicks, 2001; Seppä and Hicks, 2006). Direct comparison of surface and Holocene pollen assemblages using numerical analysis can provide insights into vegetation change and, by inference, environmental change. Of particular interest is the source of pollen (Broström et al., 2004, 2005; Bunting et al., 2004; Caseldine, 1989; Gaillard et al., 1992, 1994, 2008; Hicks, 1994, 2001; Oswald et al., 2003a, 2003b; Pardoe, 2001, 2006; Sugita, 1993, 1994). The composition of the local pollen assemblage depends on the density, identity and the mode of pollination of the constituent taxa. There is a complex relationship between pollen deposition and vegetation, dependent on production, dispersal and preservation of individual taxa (Birks and Gordon, 1985). On the glacier forelands, vegetation succession produces a series of relatively well defined plant communities, which facilitates identification of the probable source of poorly dispersed pollen types (Pardoe, 2006). Pollen spectra characteristic of distinct plant communities are sought.
The present study has five aims: to gain new insights into the present-day vegetation–surface pollen relationship, to identify distinct pollen assemblages that can be related to specific plant communities using multivariate analysis, to identify patterns in the data that can be related to regional trends in environmental factors and also patterns of plant succession on individual glacier forelands, to analyse total land pollen and non-arboreal pollen data separately and compare the results, and to consider the implications of the results for Holocene studies and examine the possibility of producing modern analogues. The 26 glacier forelands involved in this study lie in a transect from Jostedalsbreen to eastern Jotunheimen allowing regional gradients to be studied. However, the data set produced is relatively complex with simultaneous gradients in altitude, longitude, aspect and terrain age. Multivariate techniques are used to identify the major gradients in the data, to assess the relative importance of environmental variables on the regional scale and to examine the main influences on the vegetation–pollen relationship.
Methods
Sampling sites
A hierarchical sampling system was employed; Storbreen foreland (at the centre of the transect) was the major focus of the study and therefore sampled most intensively. At Storbreen, 22 paired samples were collected in a transect. Fewer samples were collected at seven ‘intermediate’ forelands; a total of 18 paired samples were collected at two forelands; and nine samples were collected at five forelands. Five samples were collected at a further 18 ‘minor’ forelands (Figure 1). Vegetation surveys were conducted in 1985 and 1986, and the moss samples were collected in 1985.
For the initial vegetation survey, a quadrat size of 4 m2 was selected. Matthews (1978) demonstrated that on an alpine foreland, where there is considerable local variation, a quadrat smaller than 4 m2 was insufficient to provide reproducible results (see Pardoe, 2006). A patch of vegetation representative of the local vegetation was selected at each site. At Storbreen and intermediate forelands, replicate samples were taken 10–15 m from the original sample. Although every effort was made to select a site representative of the local vegetation, this was not always possible at the very high-altitude forelands. The pollen sampling necessitated that there be 20 pinches of moss within 4 m2 of the sampling point. Where the moraines were composed simply of bare rock or lichen-covered boulders, such mossy patches represented the best vegetation rather than being typical.
The quadrat was subdivided into 100 squares, each measuring 20 cm × 20 cm. The presence of every vascular plant species rooted in each subdivision was recorded so the frequency of each species growing at a site was expressed as a score out of 100. This absolute measure of frequency ensured that each species was recorded independently (see Pardoe, 2006).
For the second survey, a quadrat size of 100 m2 was selected, divided into 100 subdivisions, centred on the same point as the previous survey. A simple vegetation classification system was devised based on the physiognomy and life forms of the major constituents of the vegetation. The vegetation was divided into 12 categories: (1) trees; (2) ericales; (3) Betula nana; (4) Salix herbacea; (5) shrub Salix spp.; (6) other woody shrubs; (7) pioneer forbs; (8) late-successional forbs; (9) grass; (10) Lycopodium, Equisetum and ferns; (11) mosses and liverworts; and (12) lichens, together with bare ground. The ground cover of each category was estimated for each subdivision and the average calculated for the whole quadrat (see Pardoe, 1992). The aims of the second survey were to provide a representative sample of the vegetation over a larger area and to indicate the percentage cover of the dominant plant groups.
Pollen sampling
Pollen was collected using moss samples consisting of 20 pinches of moss. Each sample was collected from the 4 m2 quadrat in which the initial vegetation survey was conducted. This is the minimum number of pinches necessary to overcome problems of local variability (Pardoe, 1992, 1996).
The samples were prepared according to standard techniques described in Pardoe (2006). Essentially, the moss samples were boiled in sodium hydroxide, thoroughly shaken for an hour to suspend the pollen and then passed through a 180 µm sieve to remove coarse particles. A subsample was then treated with hot hydrofluoric acid, followed by Erdtman’s acetolysis.
Counting techniques and pollen sums employed
Two pollen sums were deployed in the analyses: the first is based on a TLP sum including all taxa except obligate aquatics, while the second is based on a NAP sum excluding all arboreal taxa and obligate aquatics. In this paper, Arboreal Pollen (AP) includes only trees and NAP includes both herbs and all shrubs. The NAP sum precludes possible effects of long-distance transport of AP and has been found to better reflect local vegetation characteristics (Caseldine and Pardoe, 1994; Pardoe, 1992, 1996, 2001, 2006).
Two minimum pollen counts were used: a minimum of 500 TLP grains and, in addition, for each sample, a minimum of 100 NAP grains.
Numerical methods
Three multivariate techniques were employed to examine the structure of the data: these were two-way indicator species analysis (TWINSPAN), detrended correspondence analysis (DCA) and canonical correspondence analysis (CCA). In both this paper and the first part of the study (Pardoe, 2006), the vegetation data are used in place of the environmental variables and the pollen data have been used for the species data in the CCAs. This approach allows direct comparison of the vegetation and pollen data and permits identification of the taxa in the vegetation that dominate the pollen assemblages.
Results
Vegetation succession on the glacier forelands
For the sake of simplicity, the main trends evident in the vegetation data set are described by dividing the regional transect into three subdivisions (see also Caseldine and Pardoe, 1994). Glaciers 1–6 are located in the Jostedalsbreen area, glaciers 7–21 in western Jotunheimen and glaciers 22–26 in eastern Jotunheimen (Figure 1). The cover of the 13 categories defined in the second vegetation survey, for the three subdivisions of the transect, are presented in Supplementary Figures 1–3 (available online), and corresponding TLP data are presented in Supplementary Figures 4–6 (available online).
Jostedalsbreen area
There are six sub- or low-alpine glacier forelands in the Jostedalsbreen group (Figure 1). The most westerly, Haugabreen, is an outlet glacier of Myklebustbreen. The remaining five are all outlet glaciers of the Jostedalsbreen icecap. All six lie at relatively low altitude (with snouts lying between 320 m and 900 m). Generally, there is very rapid vegetation succession on these forelands and relatively diverse vegetation in the later stages of succession (Supplementary Figure 1, available online). The climax vegetation on the terminal moraine is usually either luxuriant dense shrubs such as Vaccinium uliginosum, Calluna vulgaris and Cornus suecica or Betula pubescens woodland. Betula pubescens seedlings often appear very early in the succession.
Western Jotunheimen
There are 15 glacier forelands in the western Jotunheimen group (Figure 1). This is a heterogeneous group of low- to mid-alpine glacier forelands ranging in altitude from 1100 to 1660 m. At these higher altitudes, vegetation succession is much slower and the climax vegetation tends to consist of dense shrubs such as Empetrum, Vaccinium, Betula nana and Salix phylicifolia (Supplementary Figure 2, available online). At higher altitudes, snowbed communities, dominated by Salix herbacea, are more prevalent.
Eastern Jotunheimen
There are five glacier forelands in the eastern Jotunheimen group, mainly high-altitude (ranging from 1540 to 1900 m), high alpine glacier forelands. The predominant vegetation is generally sparse and species poor, with the exception of Veobreen (Supplementary Figure 3, available online). At the highest sites, there is long snowlie and the moraines are usually blocky and unstable and therefore unsuitable for plant colonisation. Those taxa regarded as pioneers at lower altitude such as Ranunculus glacialis and Cerastium alpinum are more extensive at these forelands.
Multivariate analyses
The results of TWINSPAN classification and DCA and CCA ordination are presented in Figures 2 and 3 and Supplementary Figures 7–11 (available online). The correlations between the ordination axes and also between the ordination axes and selected environmental variables are presented in Table 1.
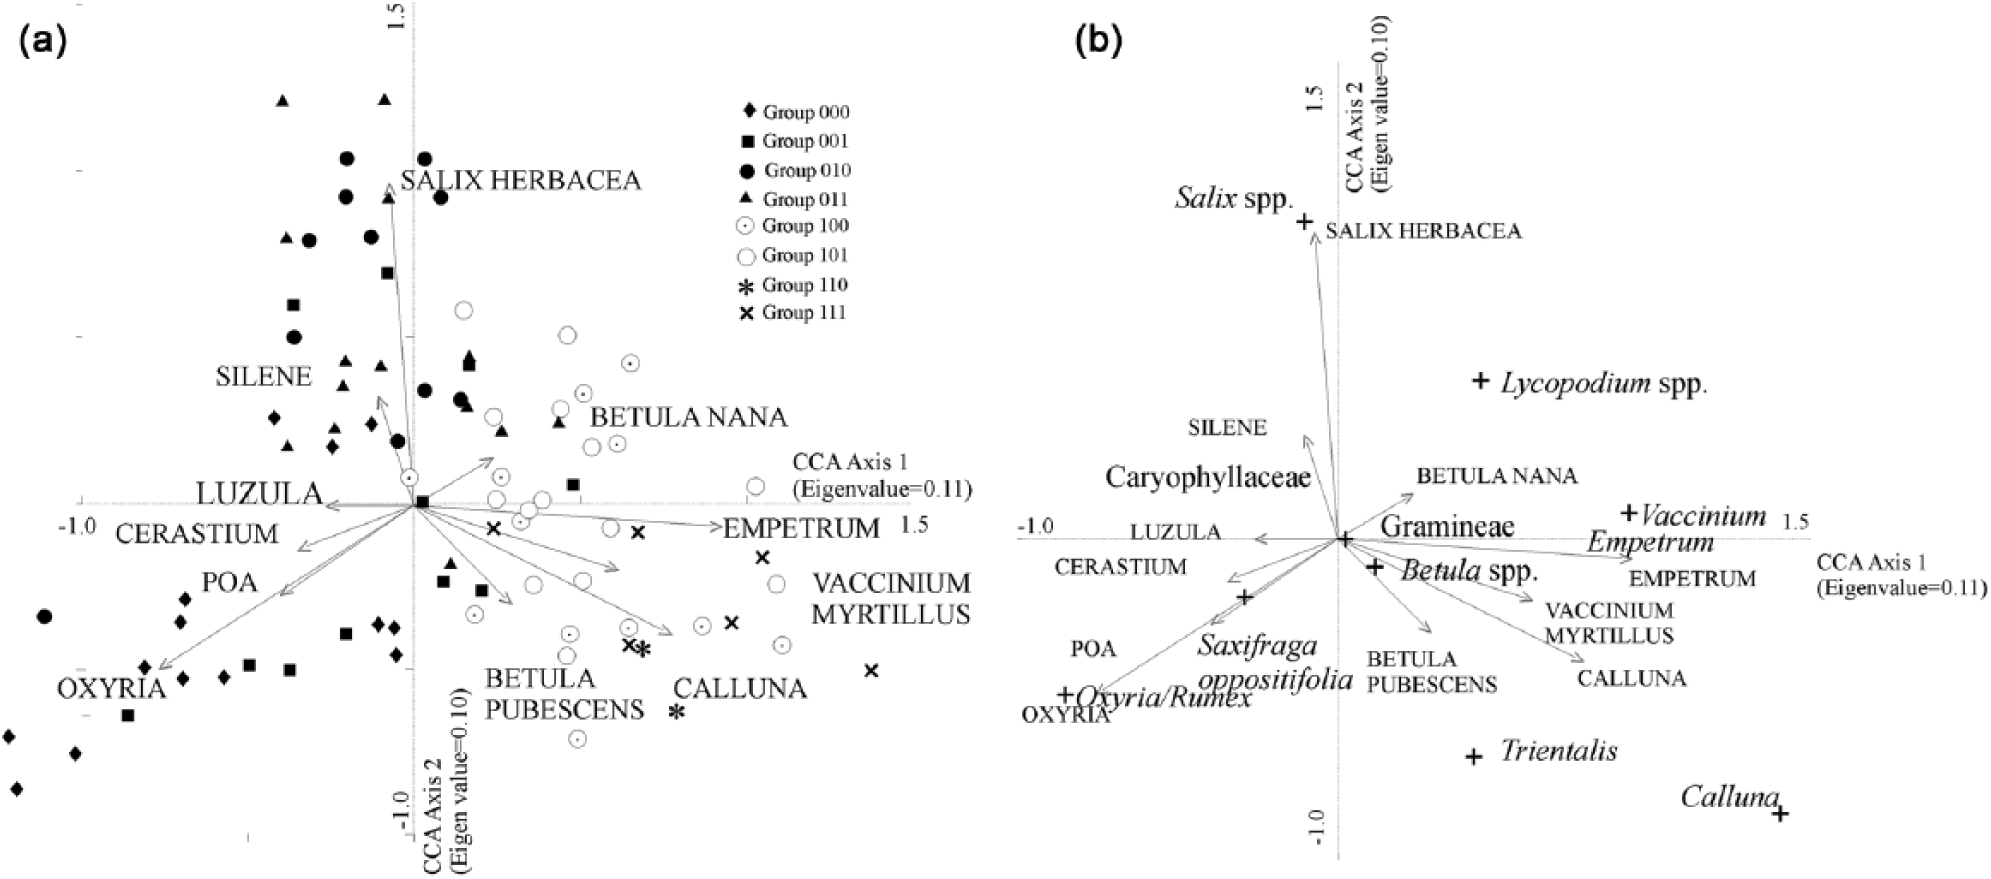
CCA ordination of vegetation (4 m2 quadrat) and total land pollen data from the 26 glacier forelands: (a) sites; (b) species sample scores (the names in capitals are plant taxa and those in lower case are pollen taxa).

CCA ordination of vegetation (4 m2 quadrat) and non-arboreal pollen data from the 26 glacier forelands: (a) sites; (b) species sample scores (the names in capitals are plant taxa and those in lower case are pollen taxa).
The correlation between environmental variables and the axes produced by detrended correspondence analysis of the data from the 26 glacier forelands (Pearson’s r) and between the axes produced by detrended correspondence analysis.
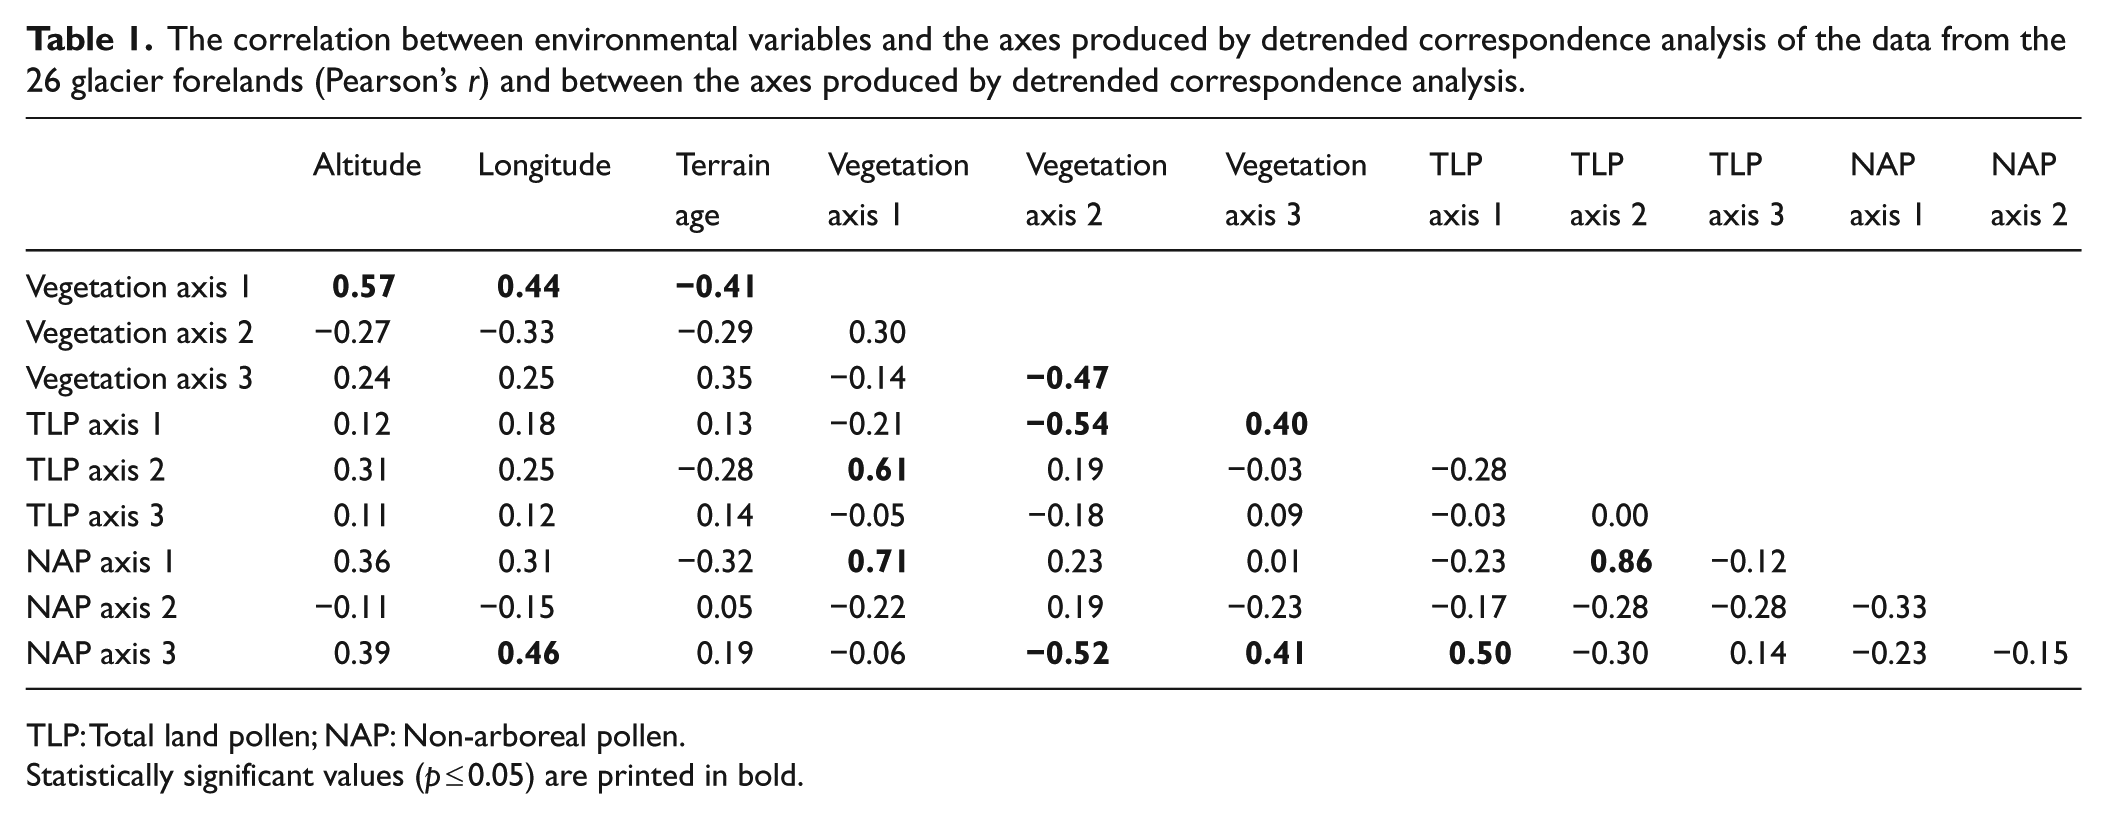
TLP: Total land pollen; NAP: Non-arboreal pollen.
Statistically significant values (p ≤ 0.05) are printed in bold.
Source of pollen
A broad range of plant communities are found on the forelands in the region, and each foreland is unique. However, to illustrate the major trends in the data sets, three forelands have been selected as examples. These are (1) Haugabreen, an intermediate sub-alpine foreland to the west of the region; (2) Storbreen, a mid-alpine foreland located in the centre of the region; and (3) Gråsubreen, an intermediate high-alpine foreland in the east of the region (Figures 1 and 4). The potential origin of pollen was explored by calculating the proportions of herbs shrubs and trees (Figure 4a–c) and also by comparing the total quantity of AP (including and excluding Betula) to the vegetation data (Figure 4d–f) to demonstrate how these change across the forelands and between the three glacier forelands.
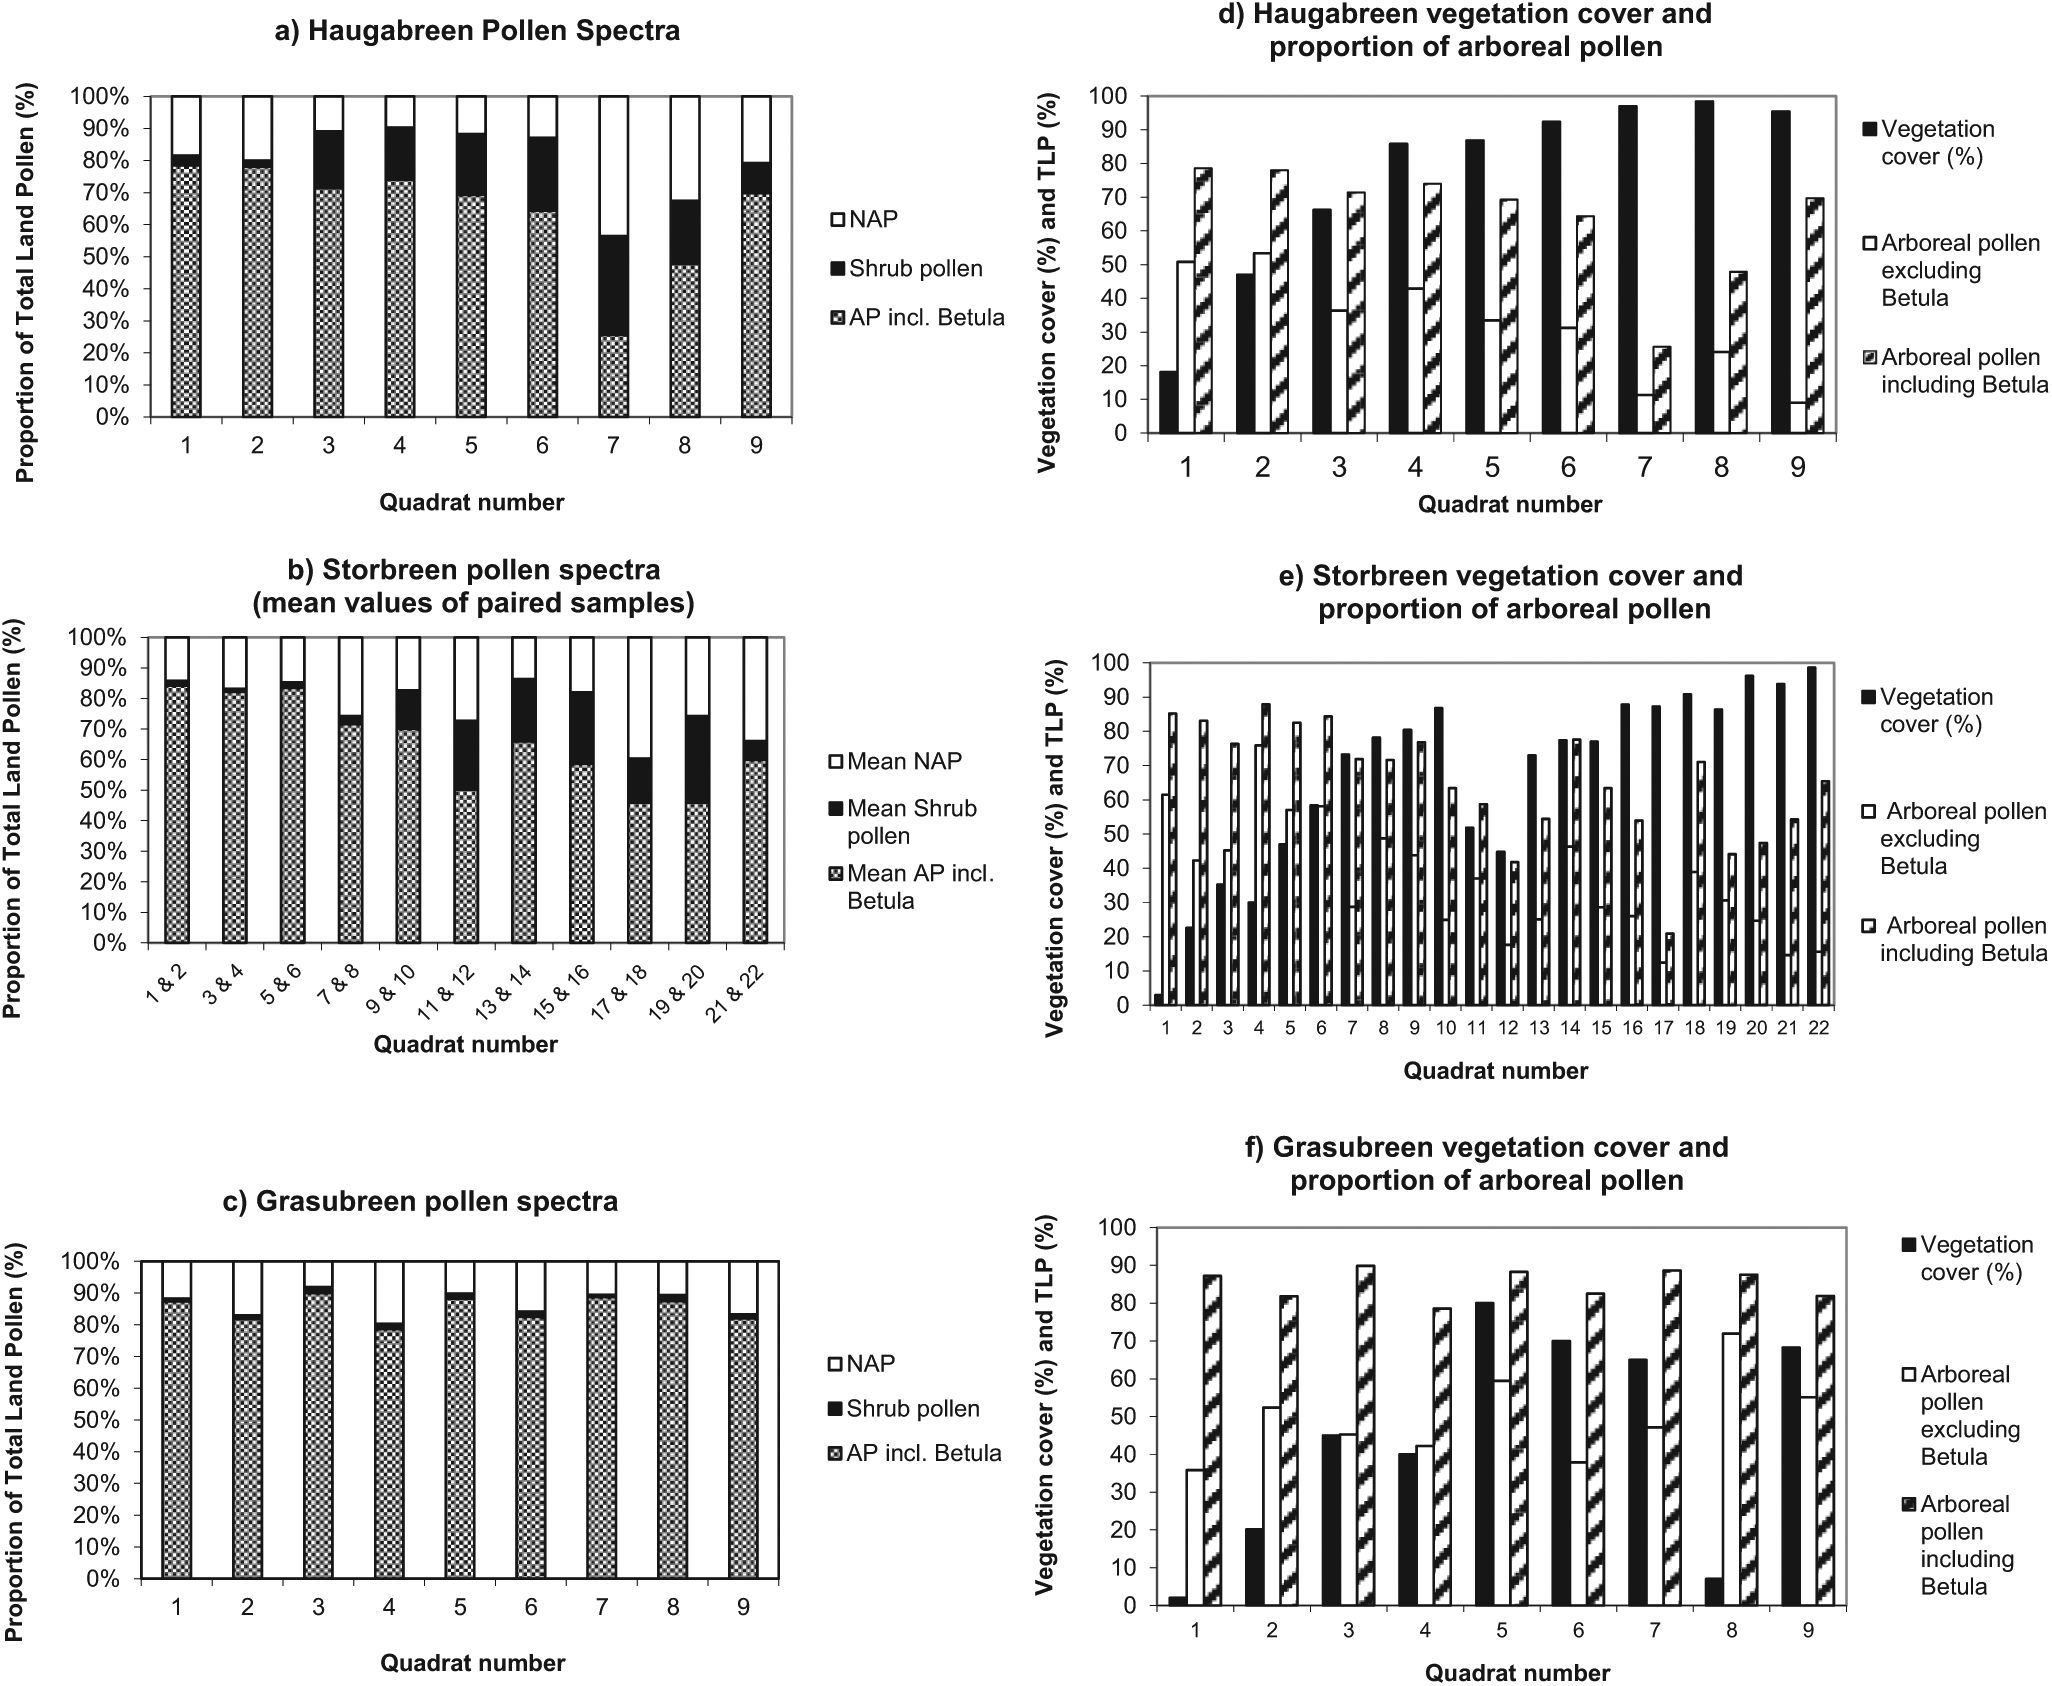
(a)–(c) Diagrams showing changes in the composition of the pollen spectrum across the glacier forelands at Haugabreen, Storbreen and Gråsubreen. (d)–(f) Diagrams showing changes in vegetation cover and arboreal pollen frequency across the glacier forelands at Haugabreen, Storbreen and Gråsubreen (in this context, the arboreal pollen sum comprises pollen of Pinus, Picea, Quercus, Alnus and Betula).
Analysis
TLP data
The vegetation data and the pollen data were classified using TWINSPAN and ordinated using DECORANA, both in parallel and in series. The results are presented in Supplementary Figures 7–11 (available online). The interpretation of these analyses is also included in the Supplementary information (available online).
CCA ordination of the TLP and vegetation data simultaneously produces a more easily interpretable pattern than the other multivariate techniques. The major plant communities in the data can be seen on the first two ordination axes (Figure 2). The beginning of the vegetation succession can be seen as a pioneer group with Oxyria in the pollen data being placed closed to Poa, Oxyria and Cerastium in the vegetation. A second major group, the snowbed community, is distinguished by Salix spp. in the pollen spectra and Salix herbacea and Silene acaulis vegetation axes. The third major group on the first two axes is essentially a heath group including Calluna, Empetrum and Vaccinium vegetation axes, together with Calluna and Lycopodium clavatum in the pollen data. Both of these latter two taxa are likely to have a local source (see Pardoe, 2001). Herb taxa such as Cornus and Lotus are also placed in this area – these are species that are typical of the late succession at low-altitude forelands. Betula pubescens and the Betula spp. pollen group are placed quite close to Calluna, and the samples from low-altitude woodland are located in this area of the figure, although this group grades into the heath group.
NAP data
CCA ordination of the NAP and vegetation data simultaneously produces a pattern very similar to that produced using the TLP sum (Figure 3). There is a close link between the pollen taxa and the taxa that dominate the local vegetation. Three of the major plant communities can be distinguished: a pioneer group, a dwarf-shrub group and a Salix scrub/snowbed group. Salix spp. pollen is located close to the vegetation axes for Salix herbacea and Salix glauca. Pollen taxa that are also associated with this plant community such as Lycopodium annotinum are located in this area of the ordination. Dwarf shrubs form a second group. Both Empetrum and Calluna pollen show a close relationship with their respective vegetation axes as one would expect with such large pollen grains that are poorly dispersed. Vaccinium pollen and pollen of herbs such as Lotus and Corneus are also associated with this cluster. Pioneer taxa form a third cluster including taxa such as Oxyria/Rumex (pollen and vegetation), Saxifraga oppositifolia (pollen and vegetation) together with the vegetation axes of Poa alpina and Cerastium. Lycopodium clavatum is an outlier in the ordination. The snowbed community grades into the heath community, but the pioneer taxa produce a more distinct group.
In this analysis, Salix spp., Lycopodium spp. and Empetrum lie much closer to the origin, probably because taxa such as Salix and Empetrum are the dominants in this data set and occur at relatively high frequencies in more samples.
Use of the NAP sum also produces greater differentiation between groups and stronger correlations with the major environmental variables than does the TLP sum (Table 1). This suggests that the NAP sum is more valuable for predicting the type of vegetation at a site, even though it relies upon a much smaller pollen count. Patterns in the TLP data tend to be obscured by the high proportion of long-distance AP which swamps local pollen production. CCA ordination of the pollen and vegetation data simultaneously produces clusters that can be interpreted more easily than the other multivariate techniques in terms of the source plant community because the direct ordination restricts the pollen data by taking into account the vegetation taxa.
Discussion
Identification of plant communities in pollen data
This study demonstrates that distinct alpine plant communities often produce characteristic pollen assemblages. Four core plant communities can be identified in the vegetation and pollen data sets: pioneer communities, heath, snowbed and, to a lesser extent, Betula woodland. These pollen ‘signatures’ are particularly useful in the search for modern analogues for past plant communities. The pioneer community is relatively easily identified using the NAP sum, but it is more difficult to distinguish the other plant communities from the pollen data. Subtle changes between plant communities, such as the gradual transition from a snowbed to a heath community, can be particularly hard to identify from the pollen record alone.
Close examination of the vegetation on glacier forelands reveals that there is frequently a mosaic of plant communities on the small scale, especially where there is mature, dense vegetation on the older moraines. This becomes evident in the multivariate analyses, for example, in situations where two samples collected from the same vicinity are allocated to different TWINSPAN groups (see Pardoe, 2006). The existence of mosaics of plant communities makes it more difficult to identify distinct plant communities from the pollen assemblages they produce, and this has important implications for the interpretation of fossil cores (see also Oswald et al., 2003a, 2003b).
Source of pollen and the representation of plant taxa in the pollen spectra
There have been substantial advances in the identification of the origin of pollen in recent years, using computer modelling, for example, in the studies by Sugita (1993, 1994), Broström et al. (2004, 2005) and Bunting et al. (2004). Sugita coined the term ‘relevant source area of pollen’ (RSAP), which is defined as the area around the pollen sampling point beyond which the pollen–vegetation relationship does not improve. Models of RSAP suggest that in southern Sweden, the RSAP in the open agricultural region is of the order of 400 m. Sugita et al. (1999) found that it is difficult to quantify the area of open land from NAP estimates of pollen productivity. Sugita notes in a recent paper (Sugita, 2011, personal communication) that ‘recent studies in NW Europe using LRA [Landscape Reconstruction Algorithm] demonstrate that the unforested areas regionally and locally were more profound and extensive than the pollen percentages alone would suggest, particularly after human impacts on the landscape intensified’.
The initial vegetation survey for the present study was carried out in such a way that the RSAP could not be calculated. The survey focussed on small-scale, fine-resolution data collected in the field to show relatively subtle changes in vegetation through the plant successions. Despite that, it was considered useful to compare the pollen and vegetation data for each quadrat (Figure 4). An earlier study at Storbreen suggested that the proportion of pollen that could have derived from the foreland is quite variable, depending on the composition of the local vegetation (see also Pardoe, 2006). The results indicate that at Storbreen, the source area of pollen decreases significantly as succession proceeds, and that generally where there is a continuous ground cover, the majority of pollen is likely to originate from the foreland, an area of approximately 1.2 km2. Over 60% of pollen could be produced within 4 m2 (Pardoe, 2006).
Oswald et al. (2003b) suggest that the relevant source area for tundra is quite small because many of the pollen types are insect-dispersed, and also because the smaller stature of the vegetation may result in different dispersal pattern than in forests. They suggest that the RSAP of their sites is around 600–800 m.
However, at high altitude and where the vegetation is very sparse and open, it is possible that the source area is much larger. At virtually all sites, there is a high proportion of AP that is likely to have a regional source (Supplementary Figures 4–6, available online). The proportion of regional pollen depends on the density and form of vegetation and the quantity of local pollen production (see Pardoe, 2001).
It is difficult to decide whether Betula should be included in the AP sum. Above the treeline, Betula is bound to have a distant origin, and so it is appropriate to include Betula in the AP sum. For example, Figure 4c shows dramatically the dominance of AP at Gråsubreen (accounting for 79–90% of TLP, Betula alone accounting for 15–51% of TLP). In fact, the vegetation is so sparse here and the foreland is so remote that the pollen assemblage found at sites where there is no local vegetation probably provides a good approximation of the composition of long-distance pollen in this region. In contrast, it is not appropriate to include Betula in the AP sum where there is a potential local source of Betula from Betula nana, for example.
At Haugabreen, recently deglaciated terrain is rapidly colonised, and early in the plant succession, there is a complete ground cover (Supplementary Figure 1, available online). The dense vegetation provides a potential local source of pollen throughout most of the succession. There is a high proportion of AP in samples taken from the pioneer stages, and even in the later stages of succession, there is more than 50% AP in the samples with the exception of quadrats 13 and 16. At these two sites, there is a dense shrub cover of dwarf shrubs such as Vaccinium myrtillus, Phyllodoce caerulea and Salix herbacea. Shrubs are also well represented in the pollen spectra early in the succession.
At this site, Betula seedlings are found very early in the succession, and here, Betula has a potential local source, despite the fact that many seedlings are probably too immature to produce pollen and the Betula pollen might have originated much further away. However, as succession proceeds, the Betula trees grow and mature. They become more widely spaced through competition for light. In consequence, therefore, in the later phases of succession, where there is mature Betula pubescens woodland, it is less likely to find Betula pubescens actually growing in the sampling quadrat. Outside the foreland, there is dense Betula woodland providing a local source of Betula pollen. The presence of established woodland seems to make little impression on the representation of AP in the pollen spectra (see also Pardoe, 2001). Beyond the terminal moraine, there is luxuriant and diverse vegetation, including several insect-pollinated taxa such as Alchemilla, Corneus and Potentilla.
At Storbreen, there is a clear succession of plant communities, and at the terminal moraine, the vegetation is dominated by dense dwarf shrubs such as Betula nana and Empetrum nigrum. The vegetation cover increases steadily in the early phases of succession and remains high over most of the foreland (Supplementary Figure 2, available online). In the pioneer stages, there is a high proportion of AP, a limited quantity of herb pollen and very little shrub pollen. Regional AP generally masks local pollen production, particularly where there is only sparse vegetation. Many small, insect-pollinated taxa produce little pollen, especially if growing in harsh, unstable environments so their contribution is easily lost in the noise. For example, a taxon such as Cerastium may be relatively abundant in pioneer communities, but at forelands such as Storbreen, where Caryophyllaceae pollen accounts for only 1–2% of the TLP sum, then its signal is easily overlooked. As succession proceeds on the foreland, the proportions of both herb and shrub pollen increase significantly (Supplementary Figure 5, available online). At first, the proportion of NAP increases as a consequence of colonisation and increasing ground cover by pioneer herbs and grasses such as Poa alpina, Ranunculus glacialis and Oxyria digyna. However, on and beyond the terminal moraine, the proportion of AP falls to around 50% reflecting the dense local vegetation of dwarf shrubs and herbs that potentially produces considerable quantities of pollen.
In the initial phases of succession, locally produced pollen is poorly represented since the vegetation is dominated by poor pollen producers. However, in the later stages of succession, the proportion of local pollen increases substantially. Again, the inclusion of Betula in the pollen sum, which may be produced locally by Betula nana, has a large impact.
In the early phases of succession at Gråsubreen, the recently deglaciated terrain is largely bare and unstable, consisting mainly of large boulders. There is prolonged snowlie at this high-altitude foreland. There is a very high proportion of AP across the entire foreland which has a regional source. There is little herb or shrub pollen in the pollen assemblages, and even this could have a regional source. It is remarkable that at the two sites where there are patches of slightly more diverse and extensive vegetation, providing a potential source of herb pollen, there is a significant quantity (up to 14%) of herb pollen that could have been locally derived (Supplementary Figure 6, available online).
Influence of plant succession and environmental variables
At most of the 26 forelands, a readily interpretable succession of plant communities can be seen that can be related to the altitude and location of the foreland. In addition, local scale variation in environmental factors such as topography, length of snowlie and soil stability will produce a unique plant succession at each foreland.
All three data sets appear to be strongly influenced by altitude, terrain age and longitude (Tables 1 and 2). However, numerous other variables such as mean annual temperature, disturbance and length of growing season are also inter-correlated with these variables, so it is difficult to establish a causal link with any single variable. An extremely complex ecological situation exists, with a number of environmental factors acting simultaneously (Matthews and Whittaker, 1987), making it difficult to distinguish ecologically interpretable trends.
Summary of correlations between the frequency of individual taxa in the vegetation and pollen assemblages with altitude and longitude.
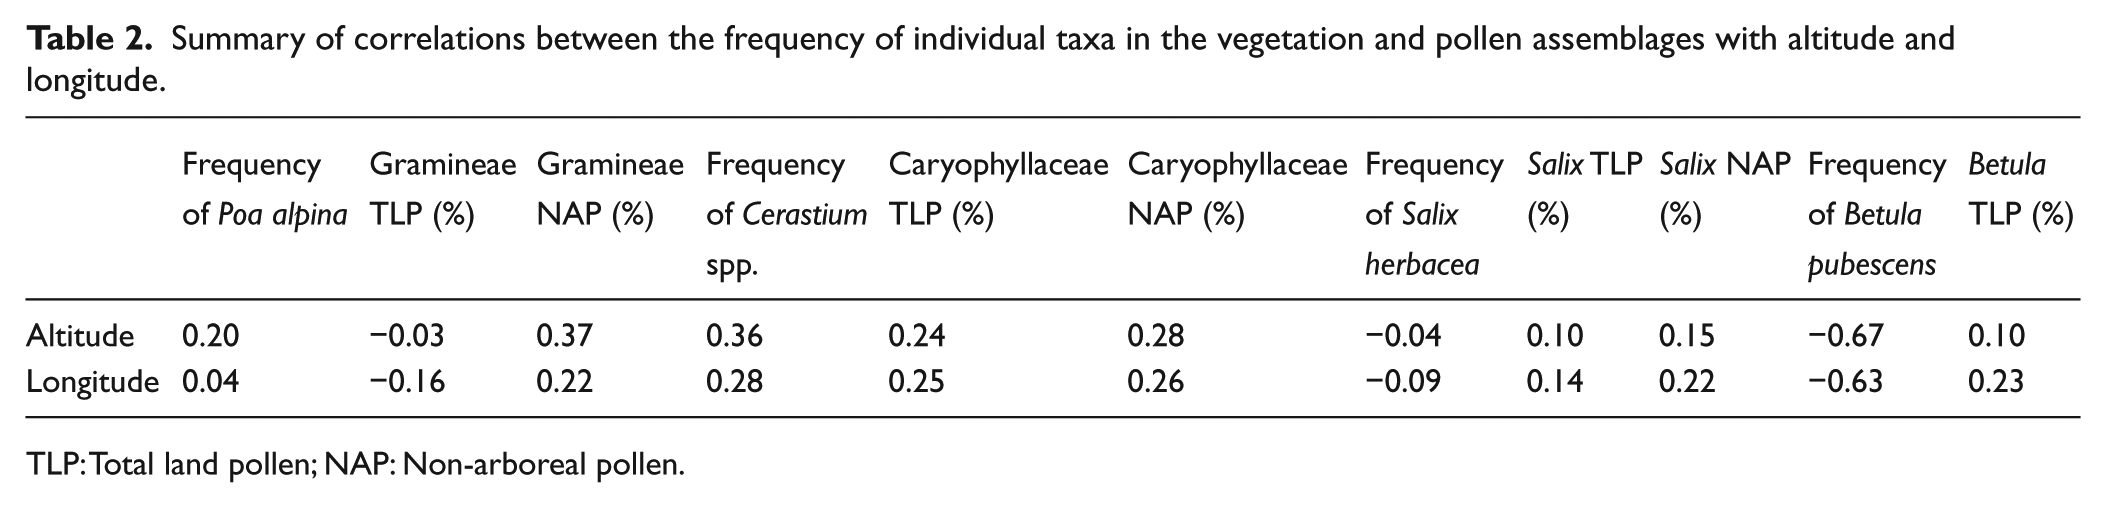
TLP: Total land pollen; NAP: Non-arboreal pollen.
Regional trends in the data
The multivariate techniques and the correlation coefficients (Table 2) indicate regional trends in the data that reflect gradients in altitude and continentality.
Examination of the TWINSPAN, DCA and CCA diagrams reveals that there are consistent trends in both the vegetation and the pollen data from west to east of the Jostedalsbreen–Jotunheimen region which reflect trends in intimately linked environmental variables including altitude, age of terrain and soil stability, together with factors such as rate of succession, composition, density and diversity of the vegetation (Figures 2 and 3; Supplementary Figures 7–11, available online).
There are strong similarities between patterns produced by vegetation and TLP data. For example, TWINSPAN classification of the vegetation produces a category (Group 001) that includes recently deglaciated terrain from 13 of the forelands including westerly forelands such as Haugabreen, Austerdalsbreen, Bergsetbreen and Bødalsbreen. However, further east, this pioneer type of vegetation is more extensive on older terrain reflecting the higher altitude, greater continentality and resultant more severe climate prevalent on glacier forelands such as Memurubreen, Styggebreen and Høgvaglbreen in eastern Jotunheimen. Similarly, TWINSPAN classification of the TLP data distinguishes a pioneer category (Group 100) which occurs on recently deglaciated terrain at 20 out of the 27 forelands but is much more extensive at forelands in the east such as Grjøtbreen and Nautgardsbreen.
In terms of individual taxa, it is possible to see some regional trends between the frequency of taxa in the vegetation and pollen assemblages with both altitude and longitude (see, for example, Table 2 and Figure 5). However, often, the correlation coefficients are quite low due to the heterogeneous nature of the data. Betula pollen (Figure 5a), for example, is frequent in the pollen spectra both at westerly sites where there is dense Betula woodland present and also to the east of the transect on the high-altitude forelands where the pollen is likely to have a more distant source. In contrast, there is a much stronger relationship between the abundance of Salix in the vegetation and its frequency in the pollen assemblage (Figure 5b). For example, at forelands such as Ringsbreen, Høgvaglbreen, Veobreen, Memurubreen and Hurrbreen, Salix is well represented in both the vegetation and the pollen assemblages, especially in the NAP sum.
Taxa such as Cerastium that are insect-pollinated and produce relatively little pollen are generally poorly represented in the pollen spectra, but at Grjøtbreen, where Cerastium is abundant, the Caryophyllaceae are well represented in the pollen assemblage (Figure 5c). Gramineae exhibits a poor correlation, pollen is produced in abundance and high background levels occur as shown at forelands such as Gråsubreen and Nautgardsbreen where vegetation is very sparse and yet there is a relatively high frequency of Gramineae pollen in the surface samples (Figure 5d). The relationship between the frequency of individual taxa and their representation in the pollen spectra is described in detail in Pardoe (2001).
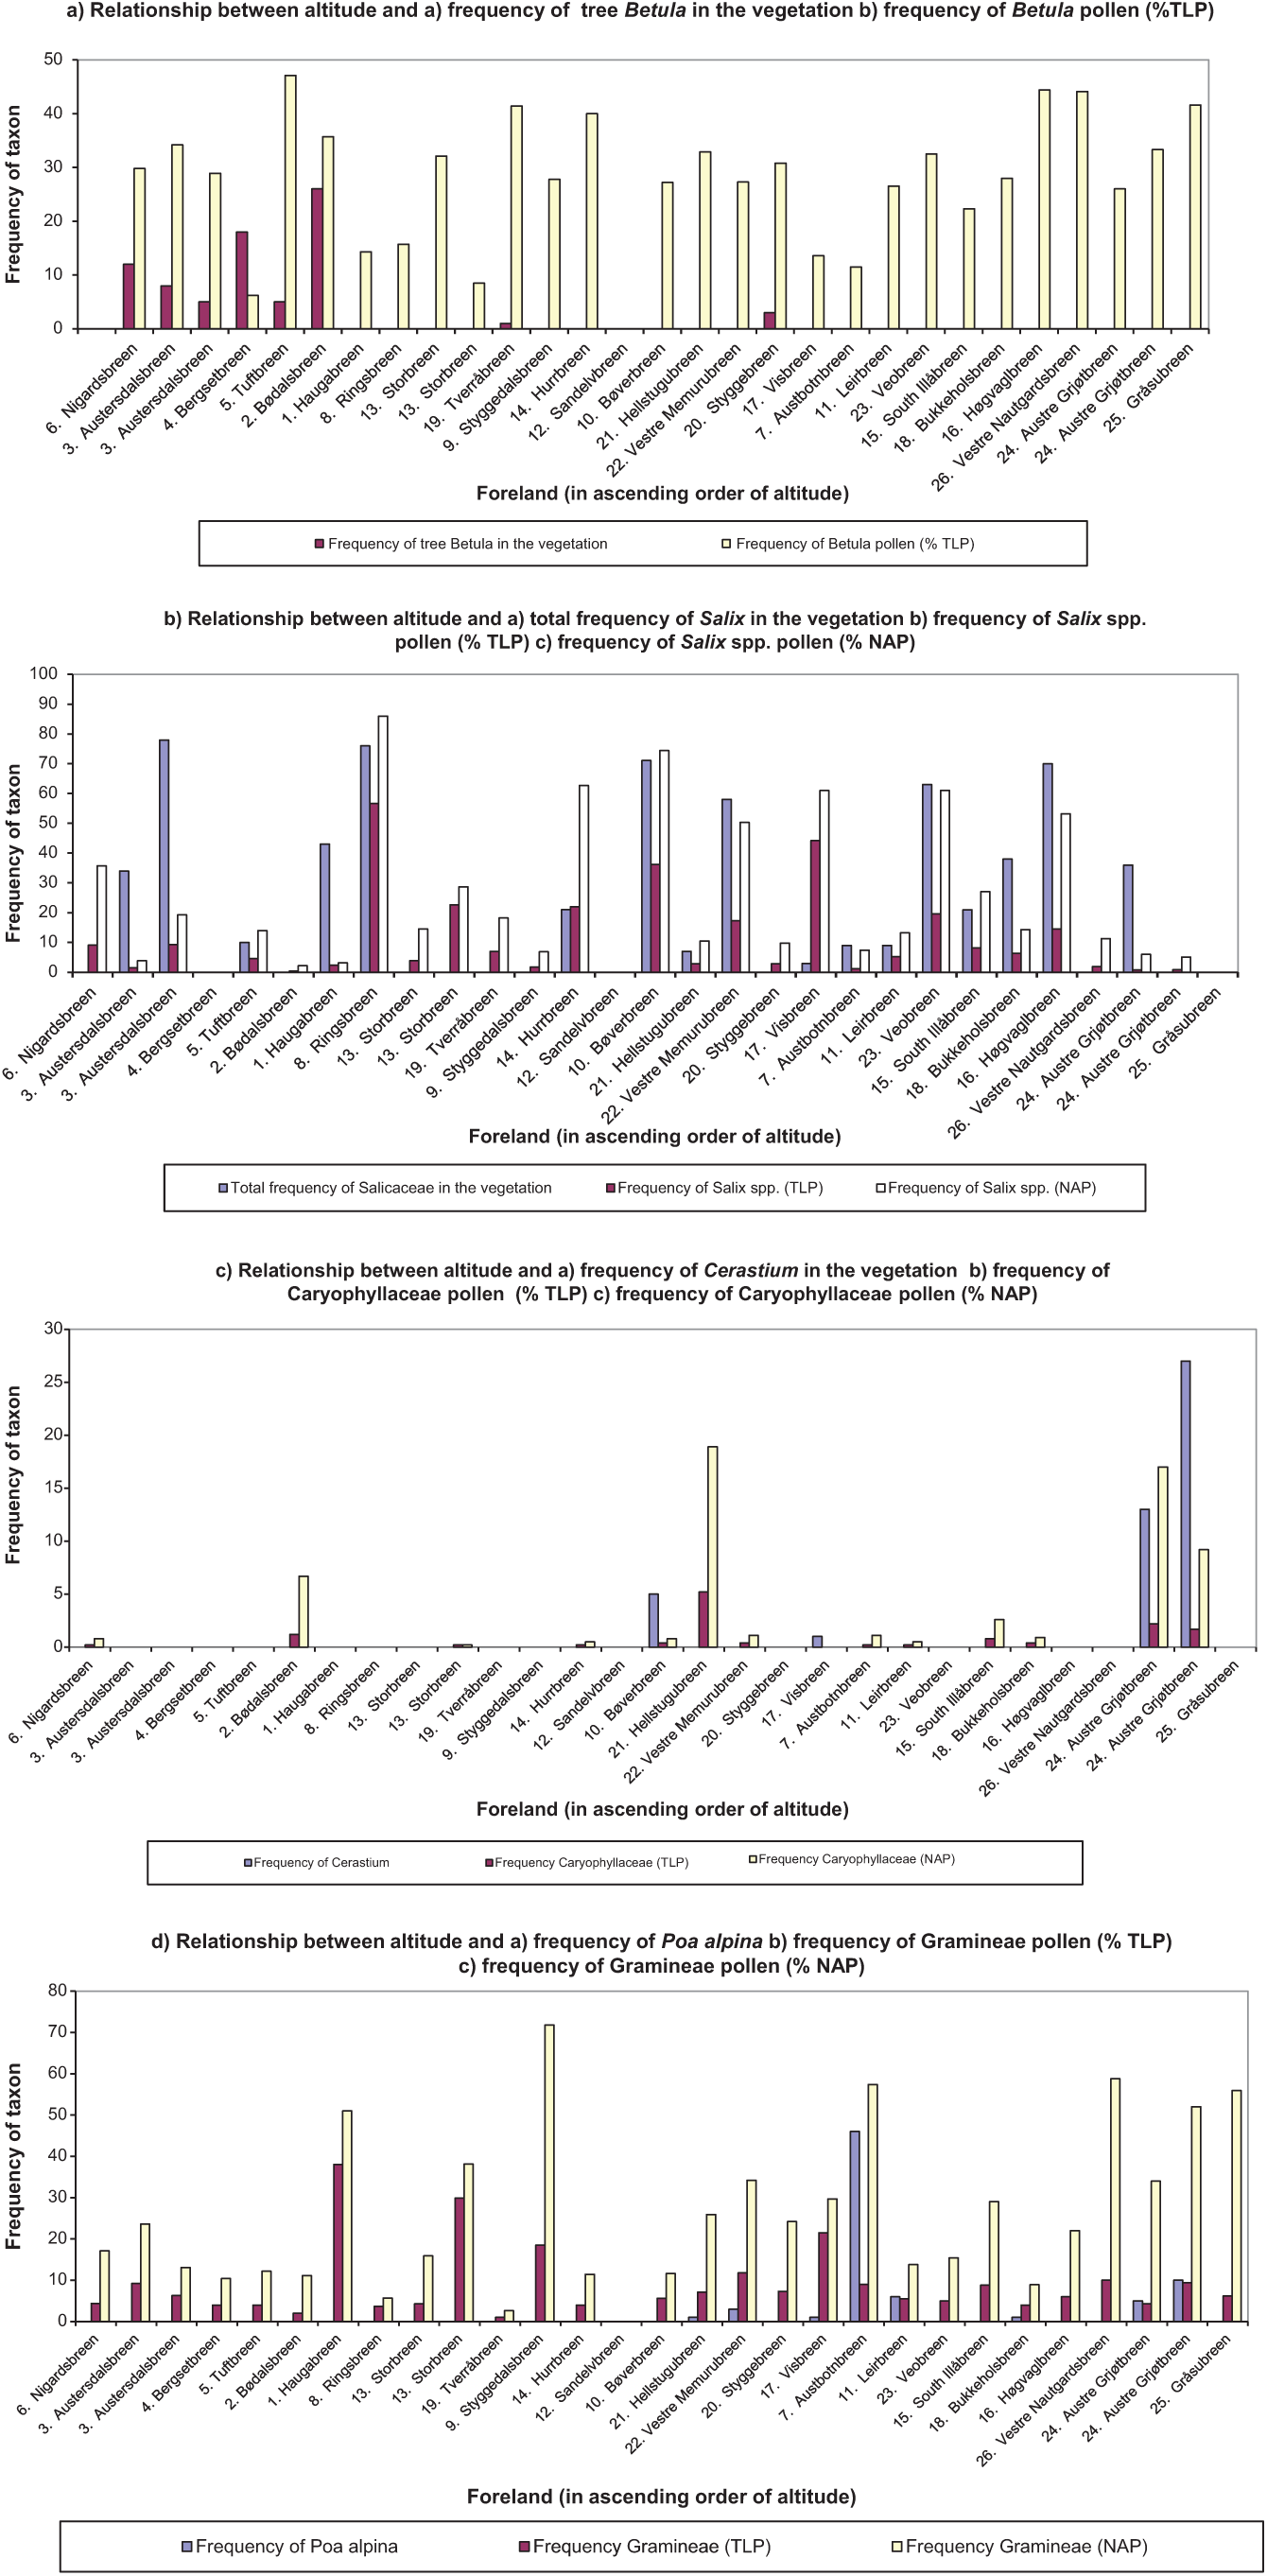
Regional patterns in the relationship between altitude and the frequency of a taxon in the vegetation and surface pollen assemblage on the glacier terminal moraine: (a) the relationship between altitude and (1) the frequency of tree Betula in the vegetation and (2) frequency of Betula pollen (%TLP); (b) the relationship between altitude and (1) the total frequency of Salix in the vegetation, (2) frequency of Salix spp. pollen (%TLP) and (3) frequency of Salix spp. pollen (%NAP); (c) the relationship between altitude and (1) the frequency of Cerastium in the vegetation, (2) frequency of Caryophyllaceae pollen (%TLP) and (3) frequency of Caryophyllaceae pollen (%NAP); (d) the relationship between altitude and (1) the frequency of Poa alpina in the vegetation, (2) frequency of Gramineae pollen (%TLP) and (3) frequency of Gramineae pollen (%NAP).
The patterns found in the Jostedalsbreen–Jotunheimen region resonate with the conclusions of Bennett and Hicks (2005), who, comparing pollen spectra from several large-scale plant communities in northern Fennoscandia, concluded that the main direction of variation in the arctic-boreal pollen trap data set is related to the vegetation region. Vegetation regions whose dominants are not high pollen producers are least well-characterised. They tend to resemble, as pollen assemblages, vegetation regions that are dominated by a high pollen producer that is also present in the poorly characterised region. Arctic-alpine vegetation produces pollen spectra that resemble those from birch woodland when compared with forest types such as Pinus or Picea where the dominants produce far more pollen. The presence of indicator taxa and the magnitude of pollen accumulation rates will distinguish them more clearly than the overall pollen composition.
Oswald et al. (2003a, 2003b) illustrated the benefits of indicator taxa when studying tundra communities in the Arctic Foothills of northern Alaska. They suggest that palaeoecological interpretations should be based on coherent patterns of several indicator taxa, in conjunction with multivariate analyses of the entire pollen assemblage. Similarly, Pardoe (2006) stressed the importance of indicator taxa to distinguish between different arctic-alpine plant communities at Storbreen glacier foreland in southern Norway. She demonstrated that taxa such as Salix and Empetrum are particularly valuable to separate the early phases of succession from the later stages of succession.
Implications for Holocene studies
Introduction
In the Jostedalsbreen–Jotunheimen region, there have been several palynological studies of pollen deposited during the Holocene in peats, soils and mires (Figure 1). The most extensive published studies are those at Haugabreen (Caseldine, 1983; Caseldine and Matthews, 1985, 1987) and Memurubreen (Caseldine, 1984; Caseldine and Matthews, 1987; Matthews and Caseldine, 1987).
A major problem, when trying to reconstruct the vegetation history of the whole region, is that the Holocene evidence is rather fragmentary. There are mainly short records from different time periods, different sampling media and different sites, and some of the dates are ambiguous. Nevertheless, most of the evidence suggests that the plant communities that existed in the past were similar to those occurring today, although the distribution of different plant communities in the past has been influenced by both climate change and human disturbance.
Vegetation change in the Jostedalsbreen–Jotunheimen region during the Holocene
One of the aims of the study was to determine whether the surface pollen spectra provide modern analogues to facilitate the interpretation of the Holocene vegetation history of the region. Pollen deposition on high, sparsely vegetated forelands such as Gråsubreen and Nautgardsbreen has not been examined previously, so modern analogues for this type of environment have not been published. It is difficult to identify such an environment from the fossil record alone because the high frequency of AP in fossil pollen samples might suggest the local presence of trees, whereas the AP may have a long-distance source (see Pardoe, 2006). For example, in Leirdalen, Barnett et al. (2001) suggest that high values of Pinus pollen may indicate the local presence of this taxon at around 9785 cal. yr BP, whereas very high values of Pinus are found in surface samples taken from many very open plant communities from across the Jotunheimen, far from the nearest woodland. This has important implications for the date of post-glacial colonisation of the region by Pinus; it is possible that Pinus-dominated woodland may have migrated to this site later than previously thought (see Pardoe, 2006).
The difficulty of determining the source of AP is a particular problem where the past treeline is used as an indicator of climate change. Both macrofossil evidence and indicator pollen taxa have a critical role to determine whether there was a local presence of trees. Birks and Birks (2000) provide a strong argument for the use of macrofossils, particularly in arctic and alpine treeless situations where pollen analysis alone can produce misleading interpretations.
Pardoe (2001, 2006) demonstrates that even a small signal from herbaceous plants that are likely to be growing locally might be important to determine whether there was woodland at a site. For example, in surface samples from the later stages of succession at Haugabreen, the consistent presence of Empetrum, Vaccinium, Potentilla and Ranunculaceae in the pollen assemblage is a good indicator of the presence of a herb-rich understorey and the local presence of trees. Furthermore, where absolute values of pollen deposition can be calculated, this provides a much clearer estimate of local AP production (see, for example, Hicks, 2001; Pardoe et al., 2010).
The results of surface sampling presented here confirm the strong links between plant communities and the pollen assemblages that they produce, and this potentially provides useful analogues for the plant communities found in the past. Superimposed on the large-scale changes in the distribution of plant communities are the much smaller scale subtle local or temporal changes in plant communities such as the mosaic of plant communities that arises from local scale environmental factors or competition between species. For example, where large terminal moraines exist, it is possible to see clear changes across the moraine which may be linked to the ecological preferences of individual species or environmental factors such as wind-exposure or substrate instability. The difficulty of distinguishing such changes in surface pollen assemblages is compounded in fossil pollen spectra where the distribution of plant communities is totally unknown, especially where the pollen assemblages are dominated by long-distance AP.
Regional patterns in published data from Holocene sites
Even in the past, it is possible to see changes in the plant communities associated with trends in longitude and altitude across the region. However, at individual sites, temporal changes between plant communities are interpreted as reflecting phases of climatic deterioration and amelioration associated with movement of the treeline and altitude of different vegetation zones. Nevertheless, the former plant communities appear quite similar to those still found in the local area today. For example, the woodland community and dwarf-shrub community described at Haugabreen (Caseldine, 1983) have modern counterparts either on or close to the Haugabreen foreland today.
At Haugabreen, Caseldine (1983) concluded that Because of the possibility of A.P. originating away from the sampling site it is difficult to ascertain whether the assemblage represents local woodland and its associated understorey vegetation or a sub-alpine grassland with birch woodland some distance away. It would appear … that most of the Betula pollen is of tree birch form.
This is a particular problem where the Betula pollen could be derived from either tree birch or Betula nana since they tend to grow in such different plant communities: ‘Palynologically therefore it would be difficult today, assuming significant long-distance transport of Betula, to separate the woodland and dwarf-shrub communities solely on their relative proportions’.
The evidence suggests that relatively open birch woodland did exist around the site. ‘The woodland understorey was fern-rich as it still is around the Haugabreen area today, but with the local importance of grasses, possibly Deschampsia sp., Compositae such as Solidago sp. and, increasingly Potentilla cf. erecta.’ (Caseldine, 1983)
The search for modern analogues
One would expect there to be a strong similarity between the Holocene pollen assemblages and the modern pollen assemblages described in the present study. However, when the data sets were compared quantitatively (Caseldine and Pardoe, 1994), there was limited overlap. Modern foreland samples were most similar to samples from a buried arctic-alpine Brown Soil from Memurubreen. There is a close affinity between surface samples from Memurubreen and Grjøtbreen and the youngest Memurubreen sub-fossil samples that are thought to have derived from a ‘grass’ heath type of community developing into a late-successional snowbed community. In many cases, the lack of overlap is thought to be because of the abundance of Cyperaceae in the sub-fossil samples from ‘wet’ bog profiles that contrast with the surface samples from essentially ‘dry’ sites on the glacier forelands. Differences in the catching and retention properties of the vegetation and soil surfaces may also be important. The analyses illustrated the potential of the overall approach for improving the explanation of Holocene vegetation and climatic changes, and indicated the limited occurrence of direct analogues for Holocene plant communities in the present flora represented on glacier forelands.
Similarly, at Nigardsbreen, Matthews et al. (1986) found a strong contrast between the pollen assemblages in the majority of buried Holocene samples from Nigardsbreen and those derived from surface samples from the outer moraines on this foreland. The buried soil samples are mainly dominated by Gramineae pollen, together with Cereal and various weed taxa consistent with fields used for permanent grazing with little immediate woodland cover. Much of the foreland now supports a dense Betula pubescens scrub and woodland, and the surface pollen samples are dominated by arboreal taxa such as Betula, Pinus and Alnus, while the most frequent NAP taxa are Salix, Gramineae, Calluna, Vaccinium and Empetrum (Pardoe, 1992). This strong contrast between the buried samples and the surface samples supports other lines of evidence including historical data and radiocarbon dates for the relatively rapid and recent changes in vegetation caused by the advance of the Nigardsbreen glacier during the 18th century. Since the moss and grass samples were buried by a relatively recent glacial advance, the changes in local vegetation at the foreland are relatively well documented. Presumably, the agricultural land was destroyed by the most extensive advance of Nigardsbreen that culminated in
The reasons for the limited correspondence are outlined in Caseldine and Pardoe (1994), but the primary reasons are thought to be a feature not only of changing vegetation structures but also because of the methodology adopted. Furthermore, the surface moss samples consisted of 20 pinches of moss collected from a 4 m2 quadrat producing an ‘average’ picture of pollen deposition within that plant community. In contrast, a sample from a peat profile represents pollen deposited at one point in space, and previous work has shown that there is often high local variability in pollen deposition within arctic-alpine communities (see Pardoe, 1996, 2006). Correspondence between Holocene and surface pollen assemblages might be improved either by manipulating the pollen sum or by comparing the surface samples with samples from other regions or from different sampling media.
Conclusion
There have been few studies of vegetation or pollen deposition on the regional scale, encompassing such a broad range of plant communities and influenced by several environmental variables. The results of this study suggest that there is a strong relationship between vegetation and surface pollen deposition on alpine glacier forelands and that it is possible to distinguish different plant communities by the pollen spectra that they produce.
The taxa that are most valuable for separating similar plant communities are locally produced, insect-pollinated, non-arboreal taxa such as Caryophyllaceae and Saxifragaceae. Empetrum and Oxyria are wind-pollinated, while Salix is both wind- and insect-pollinated. Nevertheless, the latter three taxa produce relatively small quantities of pollen, so they may also provide a valuable indicator of the composition of the local vegetation. By simultaneously ordinating both the pollen data and the vegetation data using CCA, it has been possible to demonstrate the close relationship between frequency in the vegetation and representation in the pollen spectra for several of the NAP taxa such as Salix and Oxyria. Even a very small quantity of pollen that can be linked to a specific source can be hugely significant. For example, at Grjøtbreen, where the foreland is largely bare of higher plants, just a small patch of vegetation could be identified from the pollen spectra, despite the fact that the vast majority of pollen has a long-distance source. The specific combination of non-arboreal taxa present provides strong indication of the nature of the local vegetation.
Over-reliance on trends shown by arboreal taxa can produce spurious results since in arctic-alpine environments, such a high proportion has a long-distance source. Even where there is dense Betula woodland present, the proportion of AP is not necessarily higher, making it difficult to distinguish wooded sites from very open sites.
The relationships and patterns described here are very similar to the results observed at Storbreen (Pardoe, 1992, 2006) although, because this study includes far more sites and a greater altitudinal range, there are more plant communities, including the dense Betula pubescens woodland found on the low-altitude westerly forelands and also extensive areas of bare rock and snowbed communities found at high altitude in the east. There are also more subtle differences in the plant communities because more samples are included in the analyses.
Generally, pioneer communities are more readily distinguished from the communities later in the succession. The combination of taxa such as Saxifragaceae, Caryophyllaceae, Gramineae and Oxyria are quite characteristic and of limited extent, except at very high altitude where few other taxa are found on the foreland.
These modern plant communities provide valuable modern analogues to facilitate our interpretation of fossil plant communities. However, direct comparison of fossil and surface pollen samples is impeded by differences in depositional environment, the selection of the pollen sum and potential contamination of soil samples and changes in the plant community wrought by mankind such as heavy grazing (Caseldine and Pardoe, 1994).
The source of pollen is critical; surface pollen samples, collected from sparsely vegetated plant communities far above the treeline, are often dominated by regional AP and local pollen production is obscured. Indicator taxa, that produce little pollen, can hold the key to the true nature of local vegetation, but their relatively weak signal can be lost in the noise of the analysis. This problem of representation is particularly acute in alpine environments where movement of the treeline is considered an important indicator of climatic change, and yet the source of AP is frequently indeterminable.
Footnotes
Acknowledgements
This work was initiated during the tenure of a NERC Research Studentship and the fieldwork was conducted on the Jotunheimen Research Expeditions. I am grateful to my field assistants, Kate Ahern, Susan Lambert, Alison Woolley, Janet Wearmouth and Andrew Martin, and to Art Ames for assistance in the laboratory. I also wish to express my thanks to Professor Chris Caseldine and Professor John Matthews for their advice and continued support.
Funding
This research was supported by Jotunheimen Research Expeditions, Contribution No. 191.
References
Supplementary Material
Please find the following supplemental material available below.
For Open Access articles published under a Creative Commons License, all supplemental material carries the same license as the article it is associated with.
For non-Open Access articles published, all supplemental material carries a non-exclusive license, and permission requests for re-use of supplemental material or any part of supplemental material shall be sent directly to the copyright owner as specified in the copyright notice associated with the article.