



Abstract
The so-called ‘Little Ice Age’ (LIA) of the 15th to 19th centuries
Introduction
While the timing of its onset varies both geographically and between archives, the so-called ‘Little Ice Age’ (LIA) from the 15th to 19th centuries
With glaciers in Southern Norway reaching their maximum Holocene extent variously from the early 18th to the late 19th century
While proxy-climate data from individual sites show that the period from c.
In Europe and North America, a wide range of proxy-climate methods has been used to infer the climate over the LIA. Detection of the LIA elsewhere has been patchy. Mann (2002) reviewed some of this evidence, which was largely terrestrially based, and noted rather subdued cooler overall temperatures in eastern China, more pronounced cooling for a time in the tropical Andes and evidence of glacial advances in New Zealand, but that there were large regional variations (Jones and Mann, 2004). Indeed, subsequently, Schaefer et al. (2009) reported glacier fluctuations in New Zealand that are not fully in accord with those in the Northern Hemisphere.
Whether the LIA can be regarded as a ‘global’ event has been disputed (compare, for example, views expressed in Jones et al., 2009; Rhodes et al., 2012). Part of the reason for caution is the paucity of LIA proxy-climate records from southern latitudes, which contrasts with the far greater concentration of proxy-climate studies of the LIA in the Northern Hemisphere. This is attributable in part to the large expanse of ocean compared with land in the Southern Hemisphere (SH), which restricts the availability of suitable SH terrestrial sites to provide land-based records. However, new data from the Antarctic Peninsula suggest the period of lowest ice melt and coolest temperatures in the last millennium was c.
The depth, geographical extent and duration of the LIA have a bearing on expectations of future climate, because both the trajectory of recent climate changes and computer projections for future climate are made against a background of the proxy-climate of the past millennium (Mann, 2007; Mann et al., 1998) or past two millennia (e.g. IPCC, 2013; Mann et al., 1999; 2008) in which both the Medieval Climate Anomaly and LIA feature – more prominently in some reconstructions than in others (Mann et al., 2009; cf. Esper et al., 2012). The importance of being able to reconstruct climates of past recent millennia was stressed by McCarroll (2010), who stated, ‘The wider the range of climate parameters that can be reconstructed, and the wider the range of locations, the more constraint will be provided’ (p. 1661).
Here, in this Research Report, we present proxy-climate data from a peat bog in Tierra del Fuego, southern South America, for the last 3000 years. The methods used to derive a proxy-climate record from this southerly site are identical to those that have been used widely in northern and central Europe and in parts of North America (Chambers et al., 2012) and for which a set of field and laboratory protocols has been established (De Vleeschouwer et al., 2010b). We focus our discussion on the period of time commonly associated with the LIA, and draw comparisons within the 3000-year record, including a previously reported particularly intense but short-lived climate shift in that record, dated to c. 2800 cal. BP (Chambers et al., 2007), which corresponded in time with one of opposite direction, reported from Europe (Van Geel and Renssen, 1998). Our proxy-climate record is based largely on bog surface wetness (sensu Barber et al., 1994), rather than temperature. Although there may be a temperature component in the data, this is unlikely to be a major component at such southerly cool latitudes; indeed, on the basis of changes within the period of meteorological records, it seems more likely that precipitation changes in response to variation in the Westerlies would have the strongest influence on bog surface wetness (Daley et al., 2012).
Our data can be seen in the context of claims made recently by Moreno et al. (2014) based on stratigraphic data from a lake in southwest Patagonia that there is ‘in-phase inter-hemispheric coupling of palaeoclimate over the last 3000 years through atmospheric teleconnections’ (p. 1).
Study site and field methods
The field location for analyses reported here is a Sphagnum-dominated raised mire, located c. 6 km north-east of Ushuaia, in the broad Andorra valley (Figure 1), Southern Argentina. Details of the mire vegetation are provided in Mauquoy et al. (2004) in which results of pollen analysis on a separate core of peat were reported. The 2-m core of peat (labelled AND-2) for the present study was extracted later by DM using a series of 10 cm × 10 cm × 50 cm stainless steel boxes, hammered into a cleaned peat face exposed during the creation of ditches for peatland harvesting (De Vleeschouwer et al., 2010a), and sub-sampled into 1 cm slices, which were bagged and transported back to the United Kingdom, for laboratory analysis.
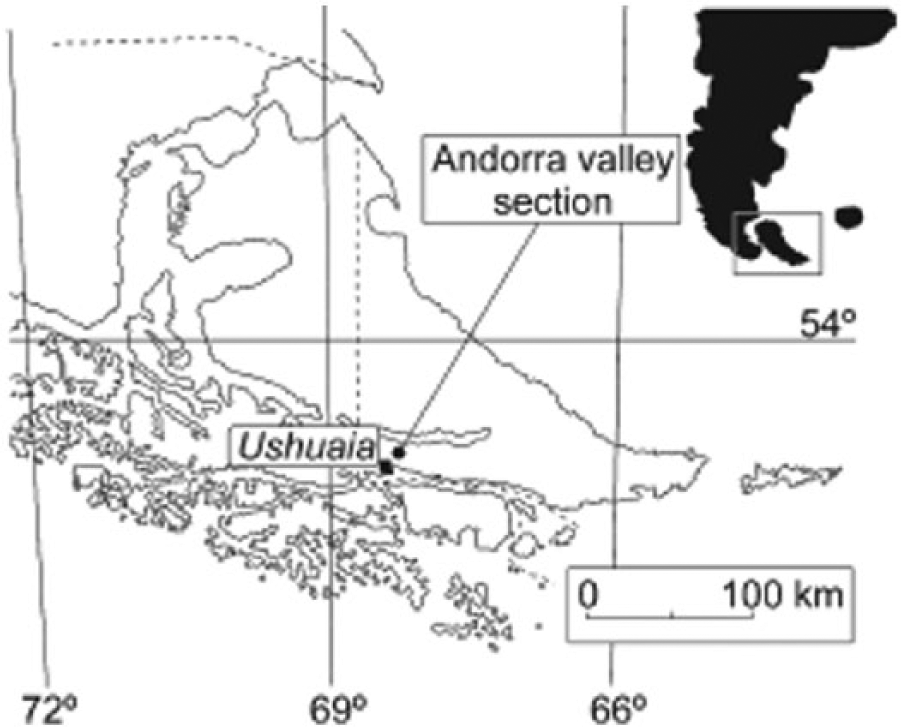
Map to show location of Valle de Andorra mire and Ushuaia, Tierra del Fuego.
Laboratory methods
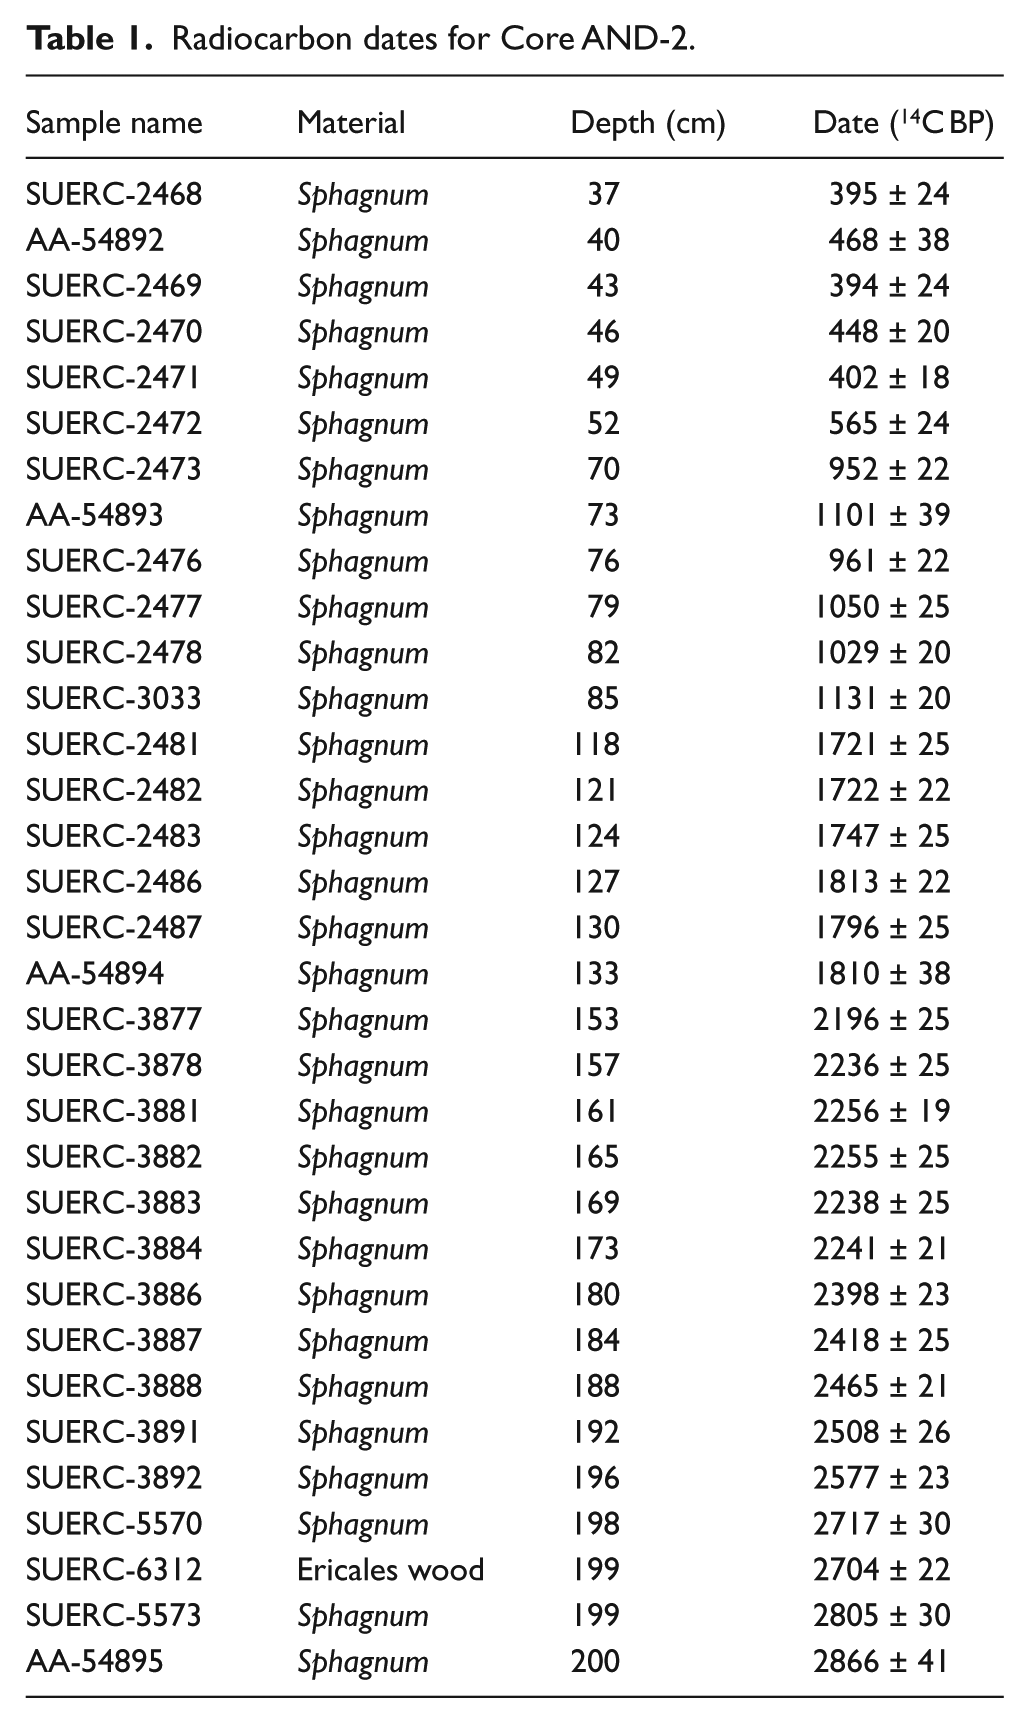
Two standard methods were used for producing a proxy-climate record from peats: plant macrofossil analysis (Mauquoy et al., 2010), conducted by DM in Uppsala, and determination of peat humification (Blackford and Chambers, 1993), the latter method modified (as in Chambers et al., 2011) and conducted by SB at Cheltenham. Radiocarbon dates for the core were requested by FMC from the Natural Environment Research Council, UK, in two submissions: a rangefinder series that focused on major shifts in the peat-humification data, followed by groups of samples that amplified the original rangefinder data (see Table 1), to facilitate possible wiggle-matching (Piotrowska et al., 2011; Van Geel and Mook, 1989). With one exception (an Ericales macrofossil, close to the base of the core), all dates were carried out on Sphagnum leaf macrofossils, separated assiduously from the peat by SB, following the methods used in the Northern Hemisphere ACCROTELM project (Chambers, 2006). An attempt to date the upper part of the core by 210Pb was unsuccessful, probably owing to low radon source in this region.
Radiocarbon dates for Core AND-2.
Initial deposition-rate curves were produced using a precursor of the ‘Bacon’ method of Blaauw and Christen (2011); limitations of this method for extrapolation when the basal age is unknown were exposed by initial lack of dating control beyond the base of the core, and so further samples were dated close to the base, to anchor the basal age by wiggle-matching. Dated samples in this basal-age wiggle match fitted the calibration curve very closely (Figure 2; see also Figure 3 in Chambers et al., 2007), and so permitted precise and accurate dating of the base of the sequence. The closely spaced sets of radiocarbon dated samples at intervals along the core have ensured precision and accuracy in dating the proxy-climate records, except in the uppermost layers, for which the sampling date provides a topmost dating-anchor point.
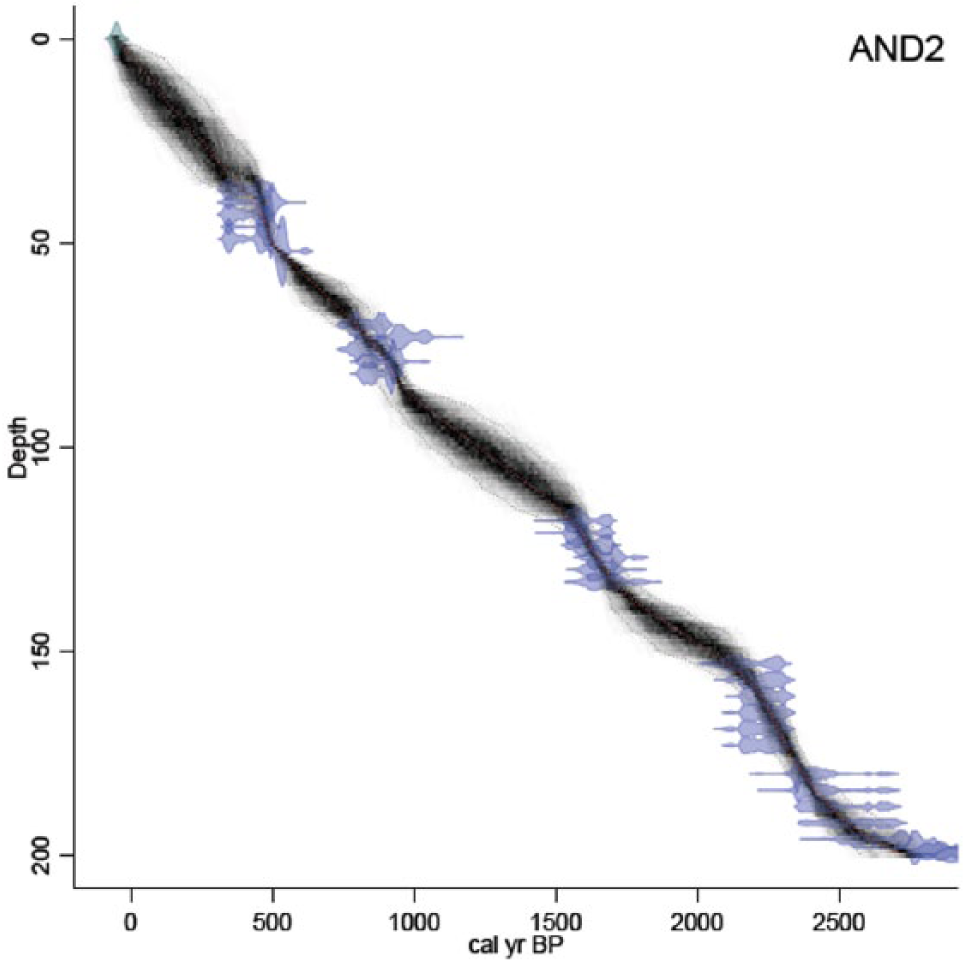
Radiocarbon-calibrated deposition-rate curve for the AND-2 core, produced using the Bacon method of Blaauw and Christen (2011), showing groups of samples that assist with ‘wiggle-matching’ (Van Geel and Mook, 1989), resulting in a tight chronology for most of the past 3000 years. Grey-scale plot indicates relative precision of dating; calibration based on SHCal13.
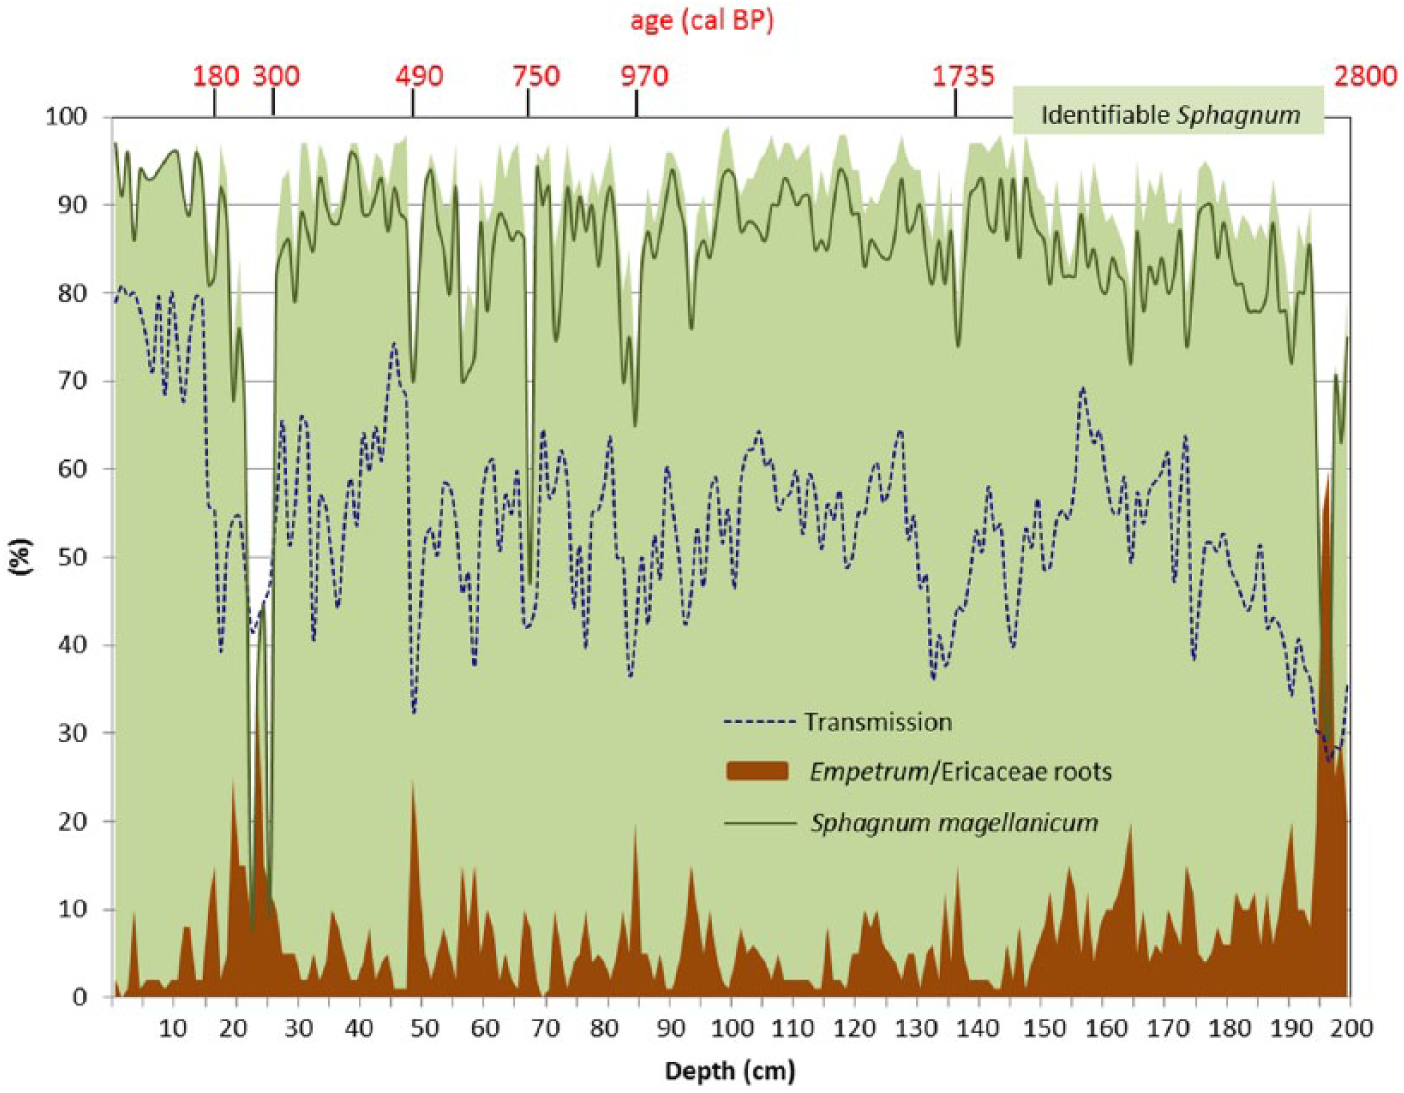
Percentages of identifiable Sphagnum (showing proportion of Sphagnum magellanicum) leaves and stems, and percentage light transmission through alkali extract of the AND-2 core peat (low values indicate dryness; high values indicate wetness) in contiguous 1 cm samples for the past three millennia, plotted against Empetrum/Ericaceae roots (indicating relative dryness). Age estimates derive from SHCal04, to be consistent with data published in Chambers et al. (2007); there are minor differences from SHCal13 used for Figure 2.
Results
Proxy-climate data for the past 3000 years are presented in a composite diagram (Figure 3), showing peat humification (expressed inversely as percentage light transmission) and the proportions of Sphagnum leaves and Empetrum/Ericaceae roots in plant macrofossils recorded from the mire. These data show that for most of the past 3000 years, the principal peat former has been Sphagnum, normally with over 70% and typically 75–95% of plant macrofossils being Sphagnum remains. Overwhelmingly, the dominant species has been S. magellanicum, with some 80–100% of the Sphagnum leaves attributable to this species. Owing to this dominance, it was not necessary to apply k-value corrections to the humification data (cf. Hughes et al., 2012). While original above-ground macrofossils (e.g. Sphagnum leaves) and below-surface remains (e.g. Empetrum/Ericaceae roots) in the same horizon may not be exactly contemporaneous, the latter are relatively shallow-rooted in ombrotrophic peats.
There are notable exceptions to the Sphagnum dominance: (1) a short-lived but pronounced episode c. 2800 cal. BP in which Sphagnum leaves are below 30% of plant macrofossils, while Empetrum/Ericaceae macrofossils were more abundant at >50%; (2) a short-lived episode c. 750 cal. BP (c. cal.
Peat-humification data from peat bogs often show an overall trend from higher humification values (i.e. lower light transmission) at the base to lower humification (or higher light transmission) towards the surface. Part of the reason for this is undecayed plant material in the upper peat layer (acrotelm), but the overall trend relates to continued slow decomposition over time in the catotelm below (Clymo, 1984). Removal of that overall trend (Figure 4) by linear regression reveals the low points in the light transmission curve to be c. 2800 cal. BP, 1735–1710 cal. BP, c. 950 cal. BP, c. 490 cal. BP and from 250 to 180 cal. BP. These are equivalent to c. 850 cal.
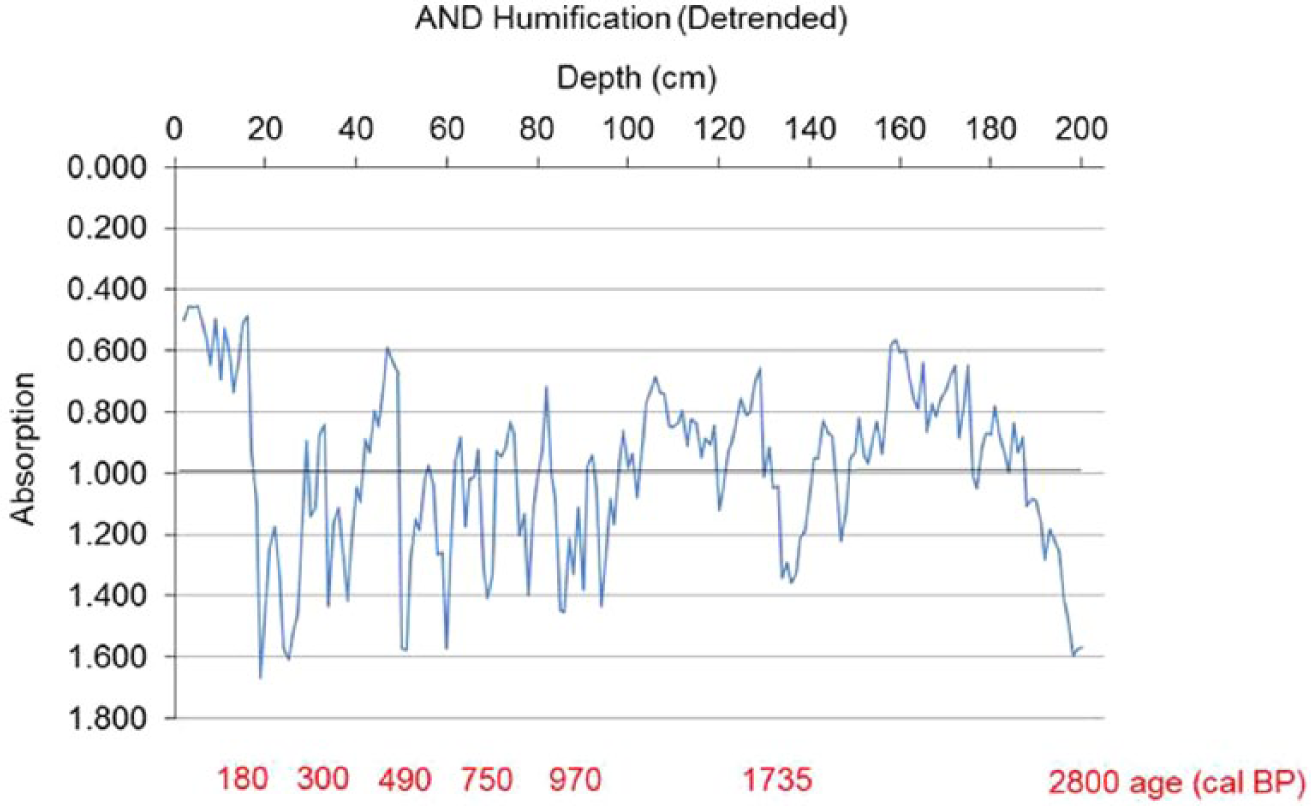
Detrended peat-humification data for the AND-2 core, plotted using absorption data, for the past 3000 years (age estimates as per Figure 3). Note the reverse vertical axis used when plotting these data, so as to create the same visual impression as in Figure 3: deep troughs indicate short-lived dry episodes.
The ages cited above are based on the new calibration curve (Figure 2) using the Bacon method of Blaauw and Christen (2011), with the estimated ages then rounded to the nearest 5 years.
Interpretation and discussion
Plant macrofossils
The overall plant macrofossil record for the past 3000 years, shown in Figure 3, indicates a mire dominated by S. magellanicum for most this period, but with some short interludes in which the mire has increased proportions of Empetrum/Ericaceae when Sphagnum is less abundant. This general dominance of S. magellanicum for millennia is reminiscent of northwest European bogs in which Sphagnum imbricatum (syn. Sphagnum austinii) has overwhelming dominance as the major peat former. Interestingly, in parts of Northwest Europe, notably in Britain, S. imbricatum becomes extinct at many sites during the last millennium, possibly related to airborne eutrophication (McClymont et al., 2008); at many sites, it is replaced by S. magellanicum, apparently occupying the same ecological niche, leading to its record being interpreted as having the same climate-indicator value in data analysis, with the data from the two species amalgamated (Barber et al., 1994). As S. imbricatum is a Northern Hemisphere species, it is not native to Patagonia. No major moss species change took place in this core, and so no species amalgamation has been necessary for interpreting the Sphagnum record.
The longest period in which the proportion of Sphagnum is lower, while Empetrum/Ericaceae remains are more abundant, although not as prominent as c. 2800 cal. BP, is that between c. 275 and 200 cal. BP (i.e. c. cal.
Peat humification
There is generally close agreement in direction, if not in magnitude, between the plant macrofossil record of a generally wet site (indicated by high percentages of Sphagnum remains) interrupted by short, dry episodes (shown by lower Sphagnum values and increased representation of Empetrum/Ericaceae remains), and the light transmission data, which indicate a mainly wet bog surface (shown by values >40%) interposed by drier episodes (when values dip below 40%). The most extreme dry episode is short-lived, at c. 2800 cal. BP (reported by Chambers et al., 2007). A short dry episode is suggested subsequently at c. cal.
Combining the proxy-climate records
When the two proxy-climate records are combined, there is evidence mainly from a pronounced low in the light transmission curve for a dry episode at c. cal.
Relationship to solar activity?
Short-term climate changes in the Holocene have been attributed to volcanism (Robock, 2000), changes in solar activity (Beer and Van Geel, 2008) or other extra-terrestrial causes (Baillie, 2007), whereas the LIA has in the past been attributed to reduced solar activity (Grove, 1988), notably around the Maunder (Eddy, 1976) and Dalton minima. However, other factors, including volcanism (Robock, 2000) and ocean circulation, are claimed to play a part (Mann, 2002), while its onset has recently been claimed to be caused by four, large, sulphur-rich explosive eruptions in a 50-year period, and its continuance to be sustained by sea ice/ocean feedback ‘during a hemispheric insolation minimum’ (Miller et al. 2012: 1), rather than requiring a reduction in solar activity. In contrast, Hunt (2006) used only internal forcing in the CSIRO mark 2 coupled global climate model and concluded that both the ‘Medieval Warm Period’ (i.e. the MCA) and LIA could not be explained by natural (i.e. internal) processes, and that ‘external forcing must be involved’ (p. 677). This conclusion was earlier exemplified by Mauquoy et al. (2002; 2008), who used proxy-climate techniques on mires in Denmark and northern England, and identified solar-forcing signals during the LIA.
It is notable that the dry episode we infer from the Valle de Andorra mire at c. cal.
Suck-in and smear
The deposition-rate curve from this site (Figure 2) contains some of the best examples of wiggle-matched dates from peat sequences, but this tight chronology only serves to emphasise the lesser chronological control in recent centuries. Baillie (1991) cautioned archaeologists about the dangers of both ‘suck-in’ – in which unrelated events, apparently closely dated in time, might be interpreted falsely as presenting evidence for a single event – and ‘smear’ in which the dating of a single event at different sites may cover a wide dating range, owing to inaccuracy and/or imprecision in dating techniques. Interpretations made in the present study are subject to that cautionary advice. For example, although the dry period from c.
Relationship to previous work
In previous work at the Valle de Andorra bog, using climate proxies on a separate peat core, Mauquoy et al. (2004) did not find clear evidence for the LIA. However, this was under a prevailing mindset that expected the mire to respond in the same way as those in Northwest Europe – to show evidence of cooler, wetter conditions – and these were not evident. In this more recent detailed work, the opposite tendency is shown for the LIA. Mauquoy et al. (2004) identified two notably wet periods: from c.
Large-scale controls on the Patagonian climate have been explored recently using results from a 30-year numerical simulation: Garreaud et al. (2013) conclude that variation in zonal winds account for much of the rainfall variability in Patagonia ‘at synoptic and interannual timescales’ (p. 215) and note somewhat opposite responses to the west of the Andes (recent drying trend) compared with the southern tip (modest increase). In general, a West–East contrast was noted, with a positive/negative correlation between the 850-hPa zonal wind speed and monthly precipitation for sites located to the west/east of the Andes ridge. It is difficult to relate their findings to our interpretations above, because their data covered only a limited time period; it also would be necessary to decide into which of two regions the mire falls. Geographically, it is East for direct precipitation; but in terms of original moisture source for the river in the valley, then arguably it could be West, because it originates there from glaciers and snowpacks. Hypothetically, during times of stronger Westerlies, and so with a more pronounced föhn effect, there could be more snow melt, causing a higher river discharge, which in turn could impede efflux from the mire; so, local water tables rise and appear to give a ‘West’ response. However, the overall scale of change suggested in the 3000-year Andorra bog record is greater than encompassed in that 30-year simulation, while the abrupt episodes of LIA dryness are pervasive for at least a few decades. This implies a more significant mechanism for parts of the LIA than minor variations in strength of the Westerlies, such as, for example, a major shift in their geographical position (cf. Moreno et al., 2009).
Varma et al. (2011) suggest that during times of reduced solar forcing (as, for example, during parts of the LIA), the Westerlies moved north; whereas, during times of higher solar activity (e.g. Medieval Climate Anomaly; late 20th century), the Westerly belt was more southerly. This contrasts with an earlier view of Moy et al. (2008), who suggested a poleward shift of the Westerlies during the LIA, based on data from a lake site in Chile. Also to the west of the Andes, from Lake Puyehue in Chile, Bertrand et al. (2006) report a humid period from
Limitations to the proxy-climate measures
We used two proxy-climate measures, rather than a single method, on this core. However, the measures are not completely independent, because there may be a species effect in humification data (Chambers et al., 1997; Yeloff and Mauquoy, 2006). The peat-humification technique has also been criticised for not fully capturing decay processes (Hansson et al., 2013). In a limited comparative study of methods to assess peat decay at a single site in Europe by Biester et al. (2014), techniques other than the colorimetric technique could be considered to have performed better; several of these other methods have been used in three pristine mires elsewhere in Patagonia (Broder et al., 2012). Nevertheless, the datasets reported here indicate that the greatest inferred climatic deviations fit well with climate excursions elsewhere, even though it is assumed that the principal change in the mire relates to bog surface wetness, rather than to temperature. Further work might be directed to investigating deuterium excess, as suggested in Daley et al. (2012), which could help to show whether shifting Westerlies were indeed the mechanism for inferred changes in bog surface wetness at this site.
Conclusion
Proxy-climate data from a mire in Tierra del Fuego, Southern Argentina, using the techniques of plant macrofossil analysis and determination of peat humification, show that the main climate changes recorded during the past 3000 years were (1) at 2800 cal. BP and (2) during parts of the time period conventionally associated with the LIA. These changes manifest as vegetation changes and changes in peat humification, both indicative of changes in bog surface wetness; they present as significantly drier-than-normal interludes. Although there may well be a temperature component in the records, no temperature-change equivalent can at present be calculated from these data.
The 2800 cal. BP shift is sharp, short-lived and coincides with a claimed abrupt ‘global’ climate change attributed to a temporary decrease in solar activity during a ‘Grand Solar Minimum’. That drier episode was interpreted by Chambers et al. (2007) as indicating a shift in the position of the moisture-bearing Westerlies. Subsequent short-lived climate shifts, of lesser magnitude, seemingly occurred at c. cal.
While the proximal cause of major changes in bog surface wetness may be shifts in the southerly jet stream, the data from this site suggest (1) that the LIA is recorded in Southern Argentina; (2) at its peak intensities, it is comparable in magnitude to the 2800 cal. BP climate perturbation; (3) the data support Moreno et al.’s (2014) claim of ‘inter-hemispheric [temporal] symmetry’; (4) these data are not inconsistent with the long-standing interpretation of the more severe multi-decadal episodes within the LIA being associated with decreased solar activity; and (5) that it may be hypothesised that decreased solar activity caused an equatorward shift of the Westerlies, resulting in a drier mire surface at the Andorra bog in Tierra del Fuego at c. 2800 cal. BP (which while temporally coincident with a major change to wetness recorded in mires in northwest continental Europe is nevertheless an opposite response of the bog surface here) and again during the more intense phases of the LIA; this hypothesis remains to be tested at other sites.
Footnotes
Acknowledgements
Radiocarbon dating was provided by the Natural Environment Research Council, UK, under Allocation number 1012.1002.
Funding
DM’s research (at Department of Earth Sciences, Uppsala University) was supported through a European Community Marie Curie Fellowship (Contract HPMF-CT-2000-01056).