
Abstract
A 2700-year-old peat core from the southern West Siberian Lowlands was used to reconstruct past water-table depth using testate amoeba analysis and to compare hydrological changes with temperature variations associated with the Medieval Climate Anomaly, ‘Little Ice Age’, and 20th-century warming. The robustness of water-table results was assessed using comparisons of four separate transfer functions, a testate amoeba reconstruction from an additional site in southern West Siberia, and an independent hydrological proxy of the δ13C values of Sphagnum remains from the same core. The paleohydrology results were robust in that (1) all four transfer functions returned similar results, (2) both peatland sites displayed very similar water-table fluctuations despite their distance from each other, and (3) Sphagnum δ13C values showed similar overall changes as the testate amoeba–inferred hydrology, but at a coarser temporal resolution. When comparing reconstructed hydrology in southern West Siberia to Northern Hemisphere temperatures, we found that during most of the record warmer time intervals tended to be wet locally and cooler time intervals tended to be dry including during the Medieval Climate Anomaly (~1150–650 cal. BP). This pairing continued until the ‘Little Ice Age’ (~650–100 cal. BP) when conditions became cool and wet, and recently, conditions have become warm again, but unlike the earlier wet interval, the peatlands have dried. Drier conditions shown by the water-table depth reconstruction suggest that future warming may continue the drying of southern peatland surfaces in the West Siberian Lowlands and may promote peat carbon respiration.
Introduction
Northern peatlands contain some 600 gigatons of carbon (Yu, 2012). Increased temperatures and changes in hydrology due to anticipated climate change may have significant impacts on peatland carbon dynamics (Arneth et al., 2010; Frey and Smith, 2005; McGuire et al., 2009; Moore et al., 1998; Yu et al., 2011). The surface wetness of northern latitude peatlands is expected to change in the future with many moving toward a net drying (Pachauri and Reisinger, 2007). Surface hydrology is, however, variable within individual peatland complexes (Belyea and Baird, 2006; Frolking et al., 2002, 2006; Moore et al., 1998). As temperature increases, water-table position may lower in areas containing hummocks, lawns, swamps, and pools and increase only in plateau-palsas due to thawing permafrost and melting ice wedges (Belyea and Clymo, 2001; Belyea and Malmer, 2008; Frolking et al., 2001; Moore et al., 1998; Vitt et al., 2000; Zoltai and Tarnocai, 1975). Improved quantification of relationships among air temperature, surface hydrology, peat growth, and carbon sequestration rates are needed to better understand the complex response of peatland growth and carbon balance to climate warming (Yu et al., 2011).
The hydrology of peatlands and the position of the water table affect the proportion of carbon released as either CO2 or CH4 (Arneth et al., 2010; Frolking et al., 2006; McGuire et al., 2009; Moore et al., 1998; Yu, 2012; Yu et al., 2011), as well as influencing overall rates of peat decomposition and accumulation (Belyea and Clymo, 2001; Belyea and Malmer, 2008; Clymo, 1984; Dise, 2009; Frolking et al., 2001; Hilbert et al., 2000; Malmer and Wallén, 2004). Drying of peatlands can promote increased decomposition, decreased peat carbon accumulation, and release of carbon dioxide, whereas higher water tables in peatlands impede overall decomposition but increase the proportion of CH4 released due to cool, anaerobic conditions (Belyea and Clymo, 2001; Belyea and Malmer, 2008; Clymo, 1984; Dise, 2009; Hilbert et al., 2000; Malmer and Wallén, 2004; Moore et al., 1998; Tsyganov et al., 2013).
Paleohydroclimate studies that compare past periods of warming to peat surface moisture and peat growth can add to our knowledge of the relationship between climate warming, peatland hydrology, and rates of peat growth and carbon accumulation (Chambers et al., 2012). Some studies linking temperature, paleohydrology, and carbon accumulation rates show a correlation between shorter term cool and dry conditions, such as during the ‘Little Ice Age’ (LIA) or time periods of solar minima, with low carbon sequestration rates due to decreased peat productivity (Lamarre et al., 2012; Van Bellen et al., 2011), whereas others have found links between cool and wet conditions and higher carbon sequestration due to decreased decomposition rates (Barber et al., 2013). A variety of carbon sequestration scenario responses have been suggested by the literature, but recent studies such as Charman et al. (2013) suggest that warming temperatures will ultimately increase carbon sequestration due to increased net primary productivity. It is likely that the response of peatland carbon balance in response to air temperature change is complex and dependent, in part, upon hydrology as governed by climate and local conditions.
Testate amoebae, a group of protozoa that produce shells resistant to decay, are common in peatlands. They are sensitive to substrate moisture and changes in their community structure within Sphagnum-dominated peatlands primarily reflect changes in surface-moisture conditions (Amesbury et al., 2008; Bobrov et al., 1995, 1999, 2004; Booth, 2008: 200, 2010; Borgmark and Schoning, 2006; Charman, 1997; Charman and Blundell, 2007; Charman and Warner, 1992, 1997; Hendon et al., 2001; Lamentowicz et al., 2009; Markel et al., 2010; Mitchell et al., 2000, 2008; Schnitchen et al., 2006; Schoning et al., 2005; Tolonen et al., 1992; Tsyganov et al., 2013). Transfer functions for reconstructing past water-table depth using testate amoebae have now been developed from a number of regions and have been tested through cross-validation approaches (Amesbury et al., 2013; Booth, 2008; Turner et al., 2013), as well as downcore comparisons with instrumental climate data (Booth, 2010; Charman et al., 2009), other peatland hydrological proxies (Barber and Charman, 2003; Swindles et al., 2012; Turner et al., 2013), testate amoeba–based reconstructions from other cores within the same peatland (Barber et al., 1998; Barber and Langdon, 2001; Charman, 2001; Hendon, 1998; Langdon et al., 2012; Moore, 1977; Svensson, 1988), and comparison among multiple peatland sites in the same region (Charman, 2001; Clifford and Booth, 2013; Hendon et al., 2001; Mitchell et al., 2000). These sorts of studies have demonstrated that testate amoebae respond quickly enough to environmental change to be sensitive indicators of decadal scale hydrology (Amesbury et al., 2012; Booth et al., 2010). By comparing inferred water-table depths to independent estimates of air temperature changes, testate amoebae can be used to help understand the responses of peatlands to past warm and cool periods.
Species of testate amoebae tend to have cosmopolitan distributions, and well-defined species generally occupy similar ecological niches with respect to water-table position even in widely separated regions (Booth, 2001; Booth and Zygmunt, 2005; Mitchell et al., 2000; Woodland et al., 1998), suggesting that calibration datasets developed in one region can be applied in another and still yield meaningful results (Charman, 2001; Mitchell et al., 2000). Empirical testing by applying multiple transfer functions on the same core has generally supported this idea; however, differences in the magnitude of water-table depth fluctuations have been observed (Charman and Blundell, 2007).
Hydrological proxies are sensitive to autogenic (site-specific) factors such as basin shape, peat accumulation, and fen to bog transition, as well as allogenic (site-independent) factors such as climate and watershed changes. Autogenic influences such as fen to bog transitions can affect proxy records. For example, testate amoeba records from Poland record wet and dry shifts representative of both site-specific lake to wetland changes as well as broader European climate changes (Lamentowicz et al., 2008). Generally, ombrotrophic Sphagnum-dominated wetlands and poor fens provide better records of allogenic changes in their proxy records because they are cut off from the confounding effects of groundwater. In a study using diatoms and testate amoebae, Hargan et al. (2015) determined that in modern ombrotrophic bogs, diatom communities were driven by microhabitat differences in surface chemistry, while testate amoebae were driven by a long-term drying trend. Testate amoebae in ombrotrophic peatlands from North America and Europe, including regions ranging from Russia to Scandinavia, record hydrological fluctuations with timing, magnitude, and direction matching each other or regional and global paleoclimate patterns (Bobrov et al., 1995, 1999, 2004; Borgmark and Schoning, 2006; Hendon et al., 2001; Klein et al., 2005; Lamentowicz et al., 2009; Mitchell et al., 2008, 2000; Schnitchen et al., 2006; Schoning et al., 2005; Tsyganov et al., 2013). However, it may be difficult to disentangle allogenic signals from autogenic variability.
Testate amoebae can be utilized in conjunction with other hydrological proxies in order to obtain the most robust results possible. Many such proxies exist ranging from diatoms to stable isotopes from Sphagnum remains (Barber et al., 2003; Chambers et al., 2012; Jones et al., 2004; Lamentowicz et al., 2008; Loisel et al., 2010; Markel et al., 2010; McClymont et al., 2008; Moser et al., 1996; Pancost et al., 2003; Yeloff et al., 2007; Zheng et al., 2007). One of these proxies is measured via carbon isotopes (δ13C) and was developed based upon the dependence of this carbon isotope ratio on atmospheric carbon dioxide and water content and saturation (Ménot and Burns, 2001; Proctor et al., 1992; White et al., 1994). Although internal factors of Sphagnum (Loader et al., 2007; Moschen et al., 2009; Rice and Giles, 1996) or methanotrophic bacteria (Markel et al., 2010) may influence the reliability of stable isotope records, some studies have found a more significant association between stable isotope ratios and external factors such as water availability in the environment (Ménot and Burns, 2001; White et al., 1994). Although some of this information questions the reliability of stable isotopes as a paleohydrological proxy, multiproxy studies increase our understanding of this relationship, including several resulting in high correlations between δ13C and testate amoeba–inferred water-table depth (Lamentowicz et al., 2008; Loisel et al., 2010; Markel et al., 2010).
Loisel et al. (2010) and Markel et al. (2010) found rather complicated relationships between these two proxies, including a weaker relationship in wetter environments. In a modern ecological study, Markel et al. (2010) found δ13C and measurements of water-table depth to be associated in hummock and Sphagnum lawn environments but not in pools and very wet habitats. A comparative paleoecological study by Loisel et al. (2010) correlated dry shifts inferred from testate amoebae with more negative isotope values. The close relationship between δ13C and testate amoeba–inferred water-table depths observed in this study lends additional support to the testate amoeba–based reconstructions and suggests that the sites have not experienced much standing water during the late Holocene. Our reconstruction of dry shifts associated with more negative isotope values is similar to that of Lamentowicz et al. (2008) and verifies the legitimacy of both proxies. The low correlation coefficient may relate to errors inherent in the reconstructions or to the difference between the representations of the hydrological proxies (i.e. water-table depth with testate amoeba and water film thickness on Sphagnum with δ13C).
In this study, we use testate amoeba analysis to reconstruct water-table depth at a site in the southern West Siberian Lowlands (WSL), assess the similarity of the water-table estimates provided by several previously published transfer functions (Amesbury et al., 2013; Booth, 2008; Booth and Zygmunt, 2005; Charman and Blundell, 2007; Markel et al., 2010), and compare the transfer function results to taxon-specific δ13C stratigraphy. Then, we compare hydrological changes with large-scale temperature variations of the past two millennia.
Over the past few thousand years, the Northern Hemisphere has been affected by significant climatic shifts. Climate in West Siberia is prone to intensified changes when compared to other Arctic regions due to its land-locked geographical location and extreme-continental climate (Kirpotin et al., 2009). The Medieval Climate Anomaly (MCA) or ‘Medieval Warm Period’ (MWP) was a period of widespread increased warming and may have affected specific regions of the Northern Hemisphere in greatest magnitude at slightly different times. The pronounced warming of the MCA took place from ~1150 to 650 cal. BP (AD 800–1300) in western Siberia (Mann, 2002). The LIA was a period of intermittent cooling that occurred locally in various regions throughout the Northern Hemisphere at different times and occurred in Siberia anywhere between ~650 and 100 cal. BP (AD 1300–1850) (Kononov et al., 2009; Mann, 2002). In general, temperatures of the 20th and early 21st century have been relatively warm.
The WSL are particularly important for the global carbon cycle as they contain some 70 gigatons of organic carbon (Sheng et al., 2004). We address the following specific questions: (1) Are testate amoeba transfer functions generally applicable outside the geographic region they were initially developed from, providing similar estimates of past water-table depth? (2) How do two separate peatlands in the WSL compare in terms of paleohydrological histories? (3) How does the testate amoeba–based reconstruction compare to the isotopic δ13C reconstruction of hydrology? and (4) What observable changes have occurred in water-table depth during the past 2000 years, particularly during the MCA, LIA cooling, and recent 20th- and 21st-century warming. The specifics of the hydrological response of these southern WSL peatlands during warming and cooling periods are generally unknown (Kirpotin et al., 2009; Yu, 2011). A testate amoeba analysis of the WSL will fill this gap by reconstructing water-table depth during these major climatic shifts. Addressing these questions will improve our understanding of the relationship between climate and peatland hydrology and allow for a discussion of the implications for carbon accumulation and emission.
Study area
The peat profiles studied here are located at the border of the provinces Tomsk and Novosibirsk in the southern WSL (Figure 1). The sites are within the Ob River basin and lie in the sporadic permafrost zone and at the border of boreal forest or taiga and the birch-poplar forest steppe (Frey et al., 2007; Kremenetski et al., 2003). Core SIB04 is the core of analysis focused in this study. Core SIB06, from a peatland located over 300 km to the northeast, was included in the study to validate regional paleohydrology. The two cores were collected by a UCLA–Russian field team in 2001 using a Russian peat corer (Smith et al., 2000). Cores SIB04 and SIB06 were extracted from oligotrophic bogs dominated by Pinus sylvestris and Ledum palustre with a groundcover dominated by Sphagnum fuscum. SIB04 was collected at 78.737°E and 56.804°N and was 400 cm deep. SIB06 was used for comparison for the inter-site hydrological portion of this study. SIB06 was collected at 83.434°E and 58.436°N and was 395 cm deep.
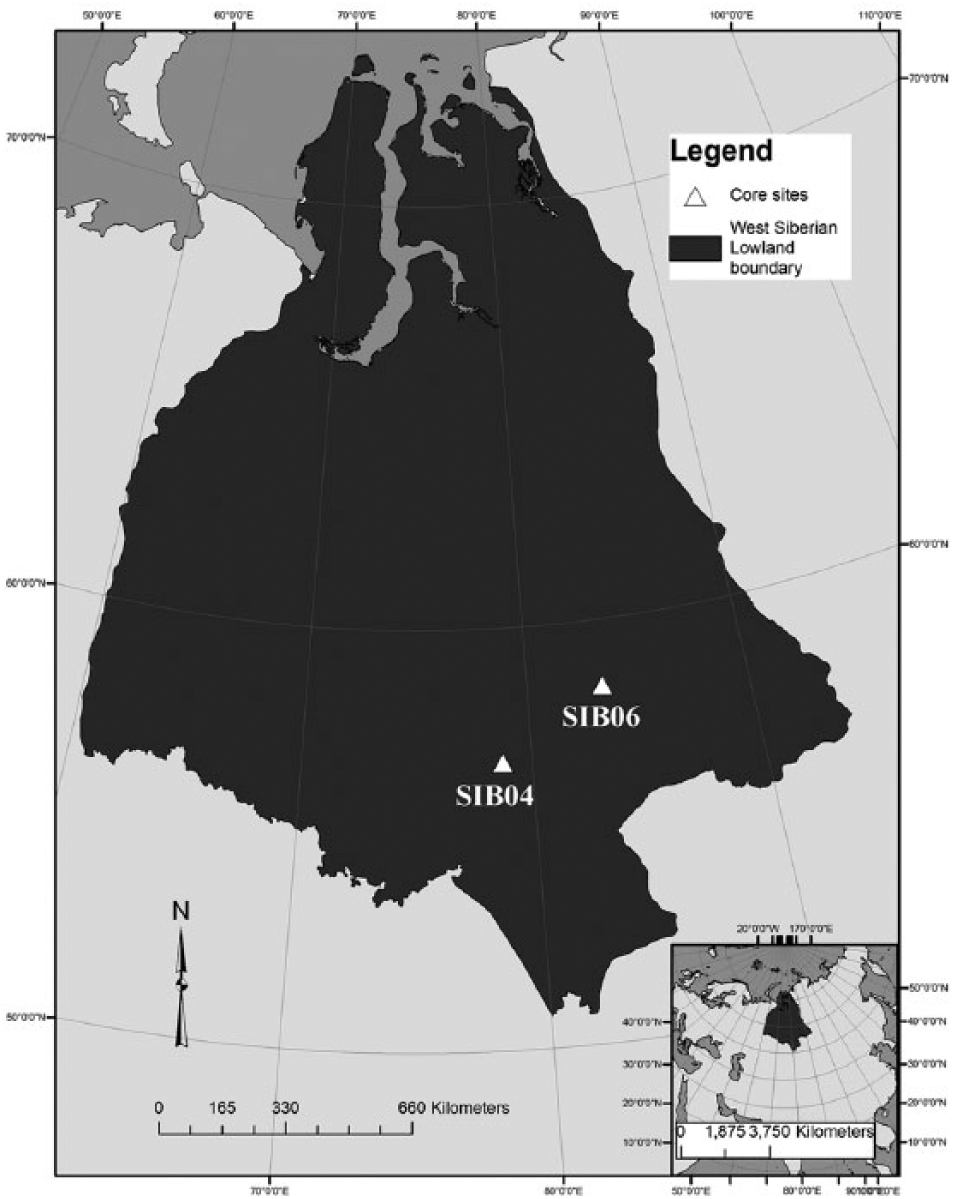
Location of West Siberian Lowlands (WSL) with core locations. Legend indicates peat types from Sheng et al. (2004).
The WSL, extending over 600,000 km2 (Frey and Smith, 2003; Smith et al., 2004), are the largest northern peatland region in the world (Kremenetski et al., 2003). The flat, extensive peatland complexes of the WSL are located east of the Ural Mountains and west of the Yenisei River, north of the Altai Mountains and Kazakh Hills, and south of the Kara Sea (Borren et al., 2004). The WSL contain approximately 15% of the currently estimated global peatland carbon stores (Frey and Smith, 2003; Sheng et al., 2004; Yu, 2012). The WSL have had a significant role in the global carbon cycle by sequestering large amounts of carbon dioxide (approximately 6.1 Tg/yr since 11,500 cal. BP) as well as releasing anywhere between 0.3 and 84 Tg/yr of methane (Kirpotin et al., 2009; Smith et al., 2004).
The flat and low-lying relief of the WSL has a significant effect on the hydrology of the region (Kirpotin et al., 2009). Many small lakes without regular drainage and with brackish water are scattered across the landscape. During spring melt season, rivers can expand greatly and flood over to saturate the surrounding peatlands (Walter, 1977).
Present-day climatic conditions of the WSL study sites are humid, cool, and continental (Kirpotin et al., 2009; Walter, 1977), with average January temperatures at approximately −20°C to −22°C and average July temperatures around 17°C to 18°C (Kremenetski et al., 2003). Frost-free periods currently last between 120 and 174 days (Kremenetski et al., 2003; Walter, 1977). Precipitation (at 500–800 mm/yr – 65% summer, 30% winter) is generally higher than potential evaporation, with the difference of precipitation and evaporation between 0 and 100 mm/yr (Kremenetski et al., 2003). Total radiation and humidity are relatively high, which allows for high peat accumulation rates (Walter, 1977).
The WSL are underlain with loess composed of silt, clay, and some sand deposits. This underlying loess and numerous sandy deposits are remnants of cold and dry conditions during the last glacial maximum and early post-glacial (Arkhipov et al., 1995). Peatlands began to develop throughout the region between 11,500 and 9000 cal. BP due to post-glacial warming and relatively moist conditions (Kremenetski et al., 2003; Smith et al., 2004). Peatland development continued through the Holocene but decreased in its pace from 8000 to 4000 cal. BP possibly due to warm yet dry conditions (Kremenetski et al., 2003).
Methods
Chronologies
Chronologies for SIB04 and SIB06 were established using multiple accelerator mass spectrometry (AMS) 14C dates (see Appendix A, Table 2, available online). Plant macrofossils were picked from peat samples, and extraneous fungal hyphae and plant rootlets were removed using forceps. All samples were prepared for AMS and analyzed at the Lawrence Livermore National Lab Center for AMS. The year of collection (−54 BP) was used as a chronological starting point for the surface. All 14C dates were calibrated, and age–depth models were created for each core using ‘Bacon’, a flexible Bayesian age–depth modeling software (Blaauw and Christen, 2011; R Development Core Team, 2012) utilizing IntCal13 for calendar year calibration (Reimer et al., 2011). Bayesian analysis requires priors; we used the program default settings for all priors except accumulation rate, which required prior values of 10 yr/cm for SIB04 and 50 yr/cm for SIB06.
Testate amoeba processing
Testate amoeba processing and taxonomy were based on the methods of Hendon and Charman (1997), Charman et al. (2000), and Booth et al. (2010). The core was subsampled every 2 cm, and 1- to 2-cm3 samples were used for testate amoeba analysis. Samples with little to no Sphagnum content were not included in the results since they lacked adequate numbers of testate amoebae. A minimum of 50 testate amoebae were counted per sample for each of the 123 samples considered with 400× magnification. Although this count total was relatively low due to low test concentrations in the peat, it is likely sufficient for transfer function applications (Payne and Mitchell, 2007), and we limit our direct interpretation of water-table inferences to those characterized by large fluctuations in community composition.
A principal components analysis (PCA) was performed on the testate amoeba assemblage data from SIB04 to summarize variability in community composition and compare it with the reconstructed water-table depths. PCA was run using the 11 most common species which made up 24–86% of the total percentage per sample. If moisture conditions were a primary control on testate amoeba community composition, we expected the first axis of the PCA to be correlated with the water-table depth reconstruction.
Transfer function comparison for SIB04
No local calibration dataset for water table exists for the WSL. Therefore, four different transfer functions were applied to the testate amoeba percentage data using C2 and R software (Juggins, 2003; R Development Core Team, 2014). The four transfer functions utilized here include the following geographic areas:
NARM. Eastern North America and the Rocky Mountains (Booth, 2008; Booth and Zygmunt, 2005);
AK. Alaska (Markel et al., 2010);
EUR. Europe (Charman and Blundell, 2007);
NENA. Northeastern North America (Canada and Maine; Amesbury et al., 2012).
These transfer functions were chosen because they are northern mid to high latitude and include a geographical variety of peatland sites and regions. The NARM transfer function was based on a combined dataset of 650 samples from 31 peatlands throughout eastern North America, Michigan, and the Rocky Mountains (Booth, 2008). The AK transfer function was based on 126 samples from 12 Sphagnum peatlands in south-central and central Alaska (Markel et al., 2010). The EUR transfer function was based on 119 samples from eight raised mire sites across Europe (Charman and Blundell, 2007). The NENA transfer function included 232 samples from 18 sites across Maine, Quebec, Nova Scotia, and Newfoundland (Amesbury et al., 2012). Results from the four transfer functions were compared with a correlation analysis using SPSS statistical software.
Comparison of WSL core reconstructions
The composition of the testate amoeba assemblages from SIB04 and SIB06 was compared in order to elucidate any major differences between the two different sites from the WSL region. A combined northern North America transfer function using data from NENA and AK, as described in Markel et al. (2010), was applied to both cores. Z scores were computed for each of the reconstructions and used in a simple Pearson’s correlation analysis to assess whether the two sites exhibited similar hydrological responses over time.
Comparison of SIB04 testate amoeba results to a Sphagnum δ13C record
In order to assess the robustness of our testate amoeba reconstruction when compared to another independent hydrological proxy, we compared our water-table reconstruction to the δ13C values of branch and leaf tissue (intact branches with leaves) of Sphagnum macrofossils. Very-well-preserved Sphagnum branches, only available from parts of the core comparable to those used in testate amoeba methods, were picked using forceps and a 40× binocular microscope from ~1 cm3 of peat dispersed in distilled water. The δ13C value of Sphagnum branches was measured by Elemental Analysis–Isotope Ratio Mass Spectrometry (EA-IRMS; Grassineau, 2006). Data from peat levels containing both testate water-table depths and δ13C information (n = 67) were used for a correlation analysis.
Results
Testate amoeba assemblages
SIB04 returned a basal date of 4020 cal. BP, while SIB06 had a basal date of 3770 cal. BP (see Appendix A, Figures 7 and 8, available online). Accumulation rates in core SIB04 resulted in decadal resolution with the 2-cm sampling interval. SIB04 was primarily composed of Sphagnum moss from 0 to 355 cm (2700 cal. BP-present), with sedges dominating from 355 to 400 cm. SIB06 contained less Sphagnum and was primarily composed of Cyperaceae leaves below 175 cm (see Figure 2 and Appendix A, Table 2, available online). Only the Sphagnum-dominated parts of the cores were analyzed due to extremely low counts of testate amoebae throughout the sedge portion of the core. Therefore, data were used from 355 to 400 cm or 2700 to 4020 cal. BP for SIB04 and 175 to 395 cm or 1924 to 3770 cal. BP for SIB06.

Testate amoeba species assemblages for core SIB04.
In total, 42 different species and 19 genera of testate amoebae were found during the past 2700 years of peat accumulation. Similar assemblages occurred in both cores, along with similar sediment types. Community composition was highly variable, including rapid changes on multi-decadal and centennial timescales. Water-table fluctuations were positively correlated with the primary gradient of community composition summarized in the first axis of the PCA (Appendix A, Figure 9, available online; R2 = 0.50, p < 0.01). Two species in particular, Archerella flavum and Trigonopyxis arcula, dominated the community composition throughout this core. Both of these species are well-established indicators of hydrology. A. flavum represents shallow water-table conditions (wet), whereas T. arcula tends to occur when water tables are deeper below the peat surface (dry) (Charman et al., 2000). The shifts between dominance by T. arcula and A. flavum suggest significant variations in water table over time.
Comparison of transfer functions as applied to SIB04
All four transfer functions showed similar shifts in the timing, direction, and relative magnitude of change in water-table depth (Figure 3) at SIB04. The EUR and AK transfer functions yielded less overall variability than the NARM and NENA transfer functions, with less prominent dry peaks throughout the past 2700 years. However, all reconstructions are significantly correlated (p << 0.001); see Table 1). The error bars for each reconstruction differ, which demonstrates the limitations of this analysis. Although the data are noisy and uncertainties vary, there are similarities in the major shifts over the time series which we focus on in our analysis.
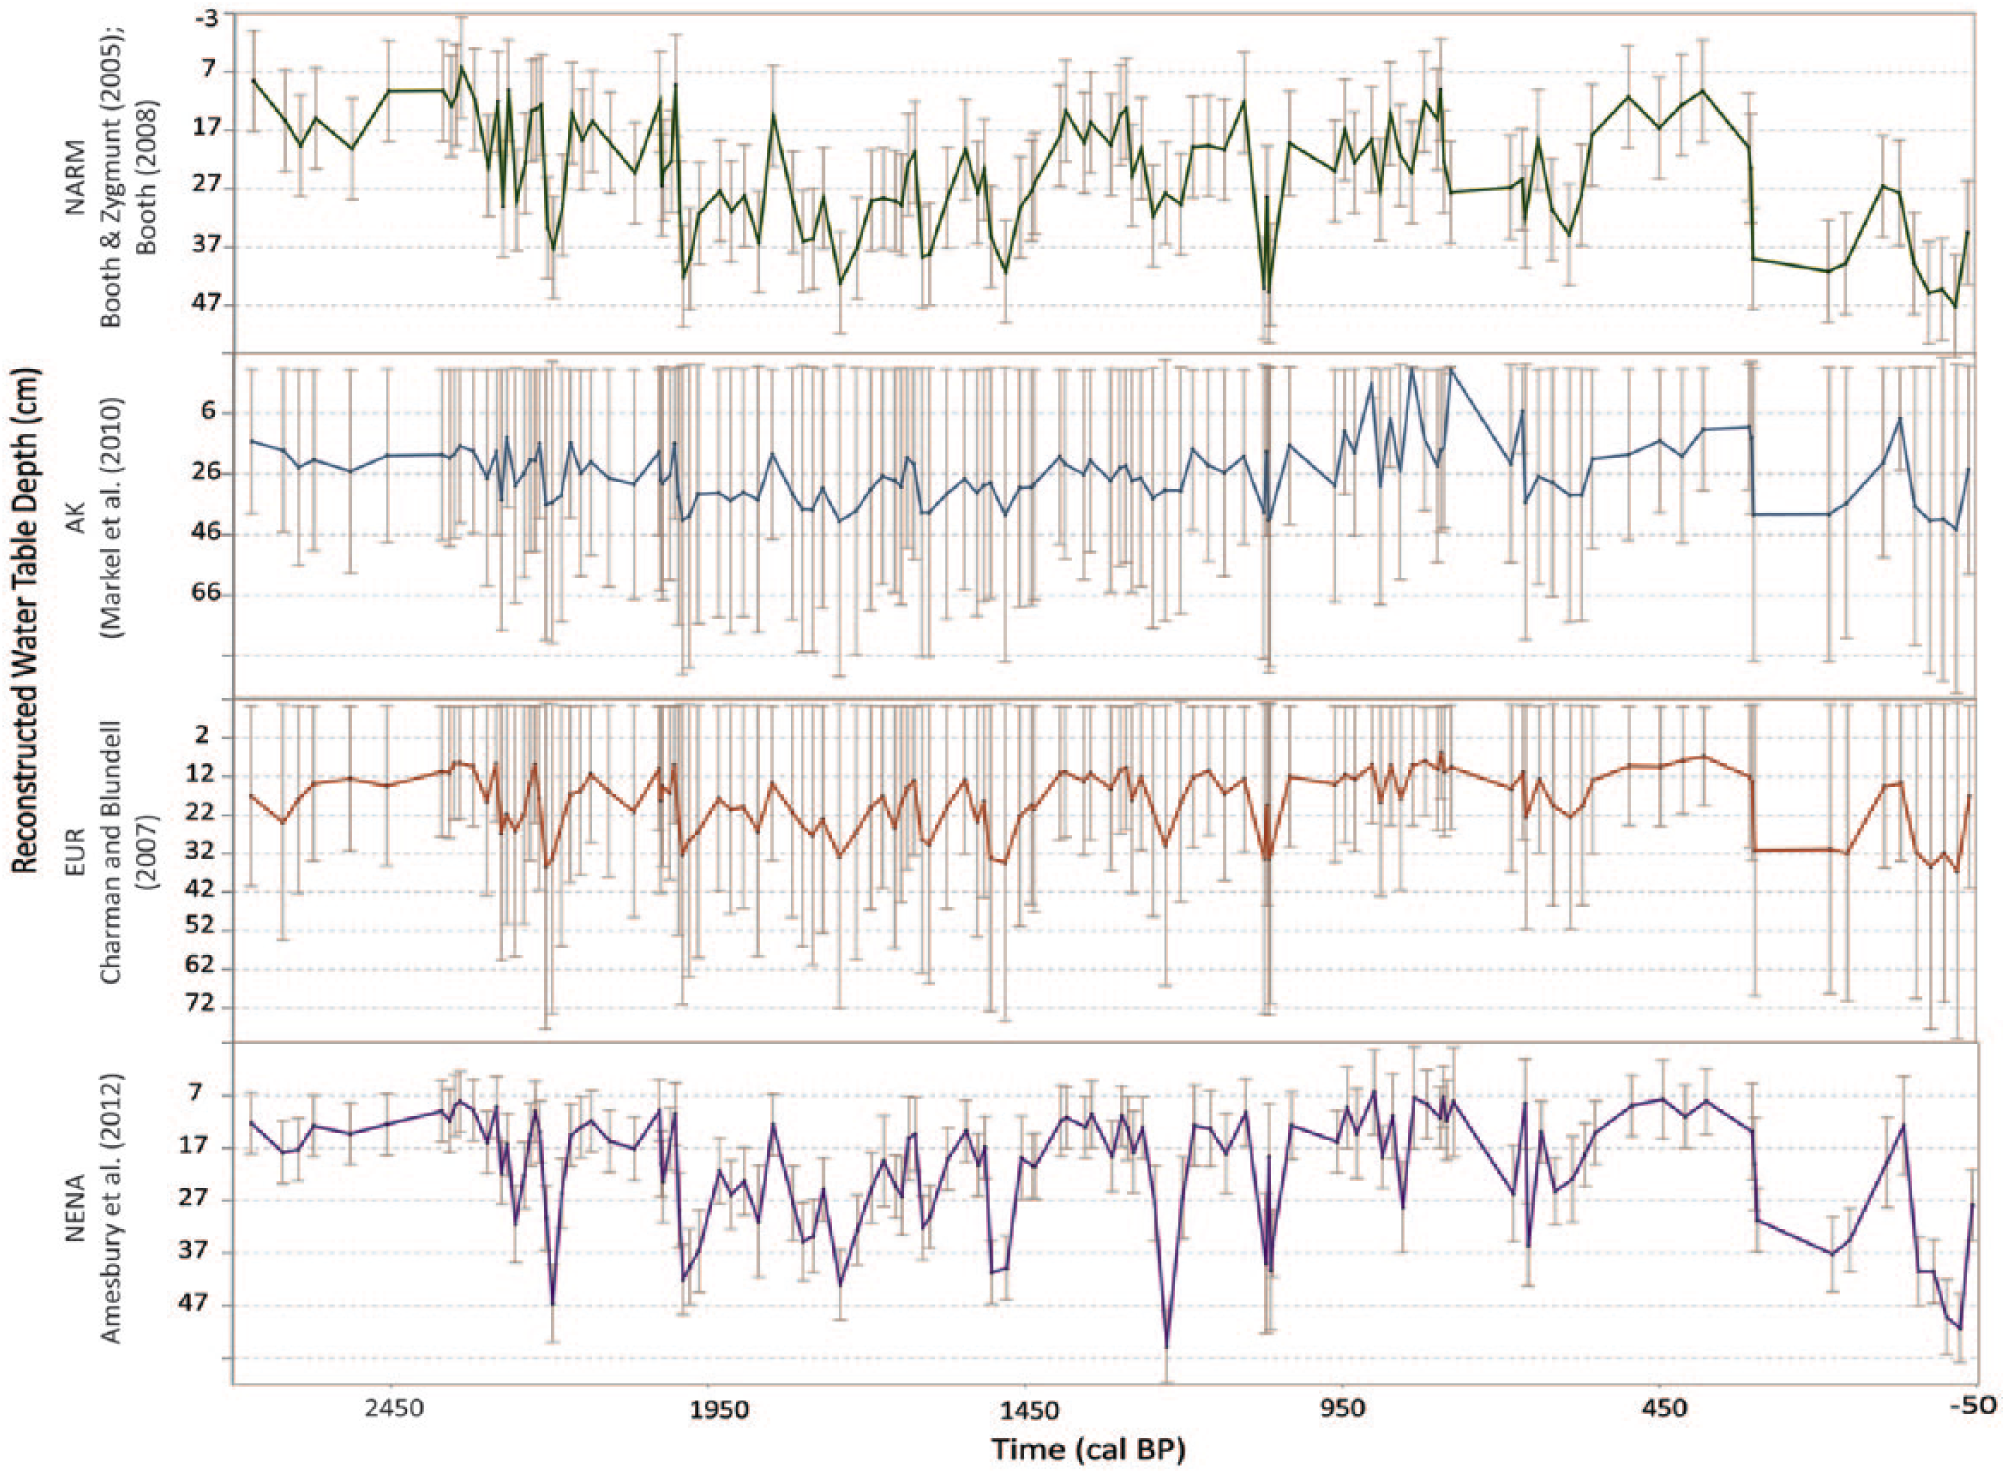
Water-table reconstruction for North America and Rocky Mountains (NARM; Booth, 2008; Booth and Zygmunt, 2005), Alaska (AK; Markel et al., 2010), Europe (EUR; Charman et al., 2007), and Northeast North America (NENA; Amesbury et al., 2012) with standard error bars.
Results of correlation analysis between water tables reconstructed from four transfer functions. Correlation coefficients (R) are shown along with significance factors (p).
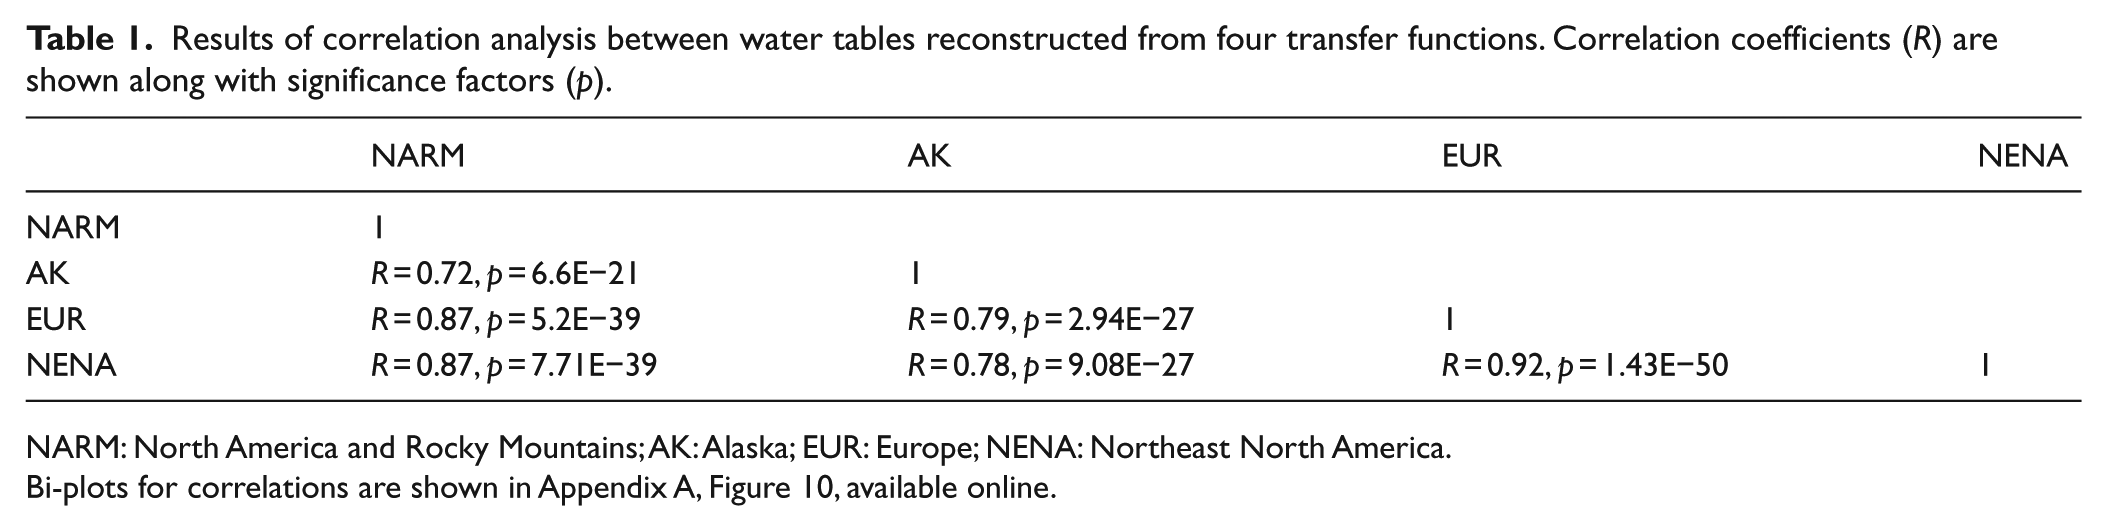
NARM: North America and Rocky Mountains; AK: Alaska; EUR: Europe; NENA: Northeast North America.
Bi-plots for correlations are shown in Appendix A, Figure 10, available online.
Water-table reconstructions for WSL core sites
SIB06 was also dominated by T. arcula and A. flavum. Over the past 2000 years, all of the reconstructions of water-table depths for SIB04 and SIB06 showed similar low-frequency shifts between wet and dry periods, especially in terms of a dry MCA (seen here by the wet LIA and the transition to dry conditions in the recent period; see Figure 4). Both cores also showed high variability over the entire record with a noisy time series. The lower temporal sampling resolution of SIB06 due to low Sphagnum presence complicated high-resolution comparison; however, the two records were significantly correlated (Pearson’s R = 0.40, p << 0.001). At site SIB04, conditions were likely relatively wet from 2700 to 2400 cal. BP and then became moderately dry until 1400 cal. BP. This period also appears to have been dry at SIB06. A shift to wetter conditions occurred from 1000 to 300 cal. BP with the highest moisture between 900 and 400 cal. BP. A large shift to drier conditions was seen in recent centuries. The AK transfer function displayed a notably wet peak at 900 cal. BP. This is likely explained by the abundance of Difflugia pulex, a species that was not well characterized in the Alaska calibration dataset, where it was only present in a few samples and never obtained very high abundance (Markel et al., 2010). Other studies have more clearly demonstrated that this taxon likely prefers moderately dry conditions (Booth, 2008) and may be particularly common when surface-moisture conditions are seasonally variable (Sullivan and Booth, 2011). Both cores showed strong drying during modern times, with SIB04 data displaying an earlier drying shift starting at approximately 400 cal. BP, and SIB06 displaying drying starting at approximately 200 cal. BP. However, there are also differences between the cores throughout the time series, such as when SIB04 displays a dry shift (while SIB06 is wet) from ~800 to 560 cal. BP and ~300 to 150 cal. BP. SIB04 also displays wetter conditions from 560 to 300 cal. BP and then drops in water table dramatically while SIB06 water table remains relatively consistent (and opposite) during this time period.
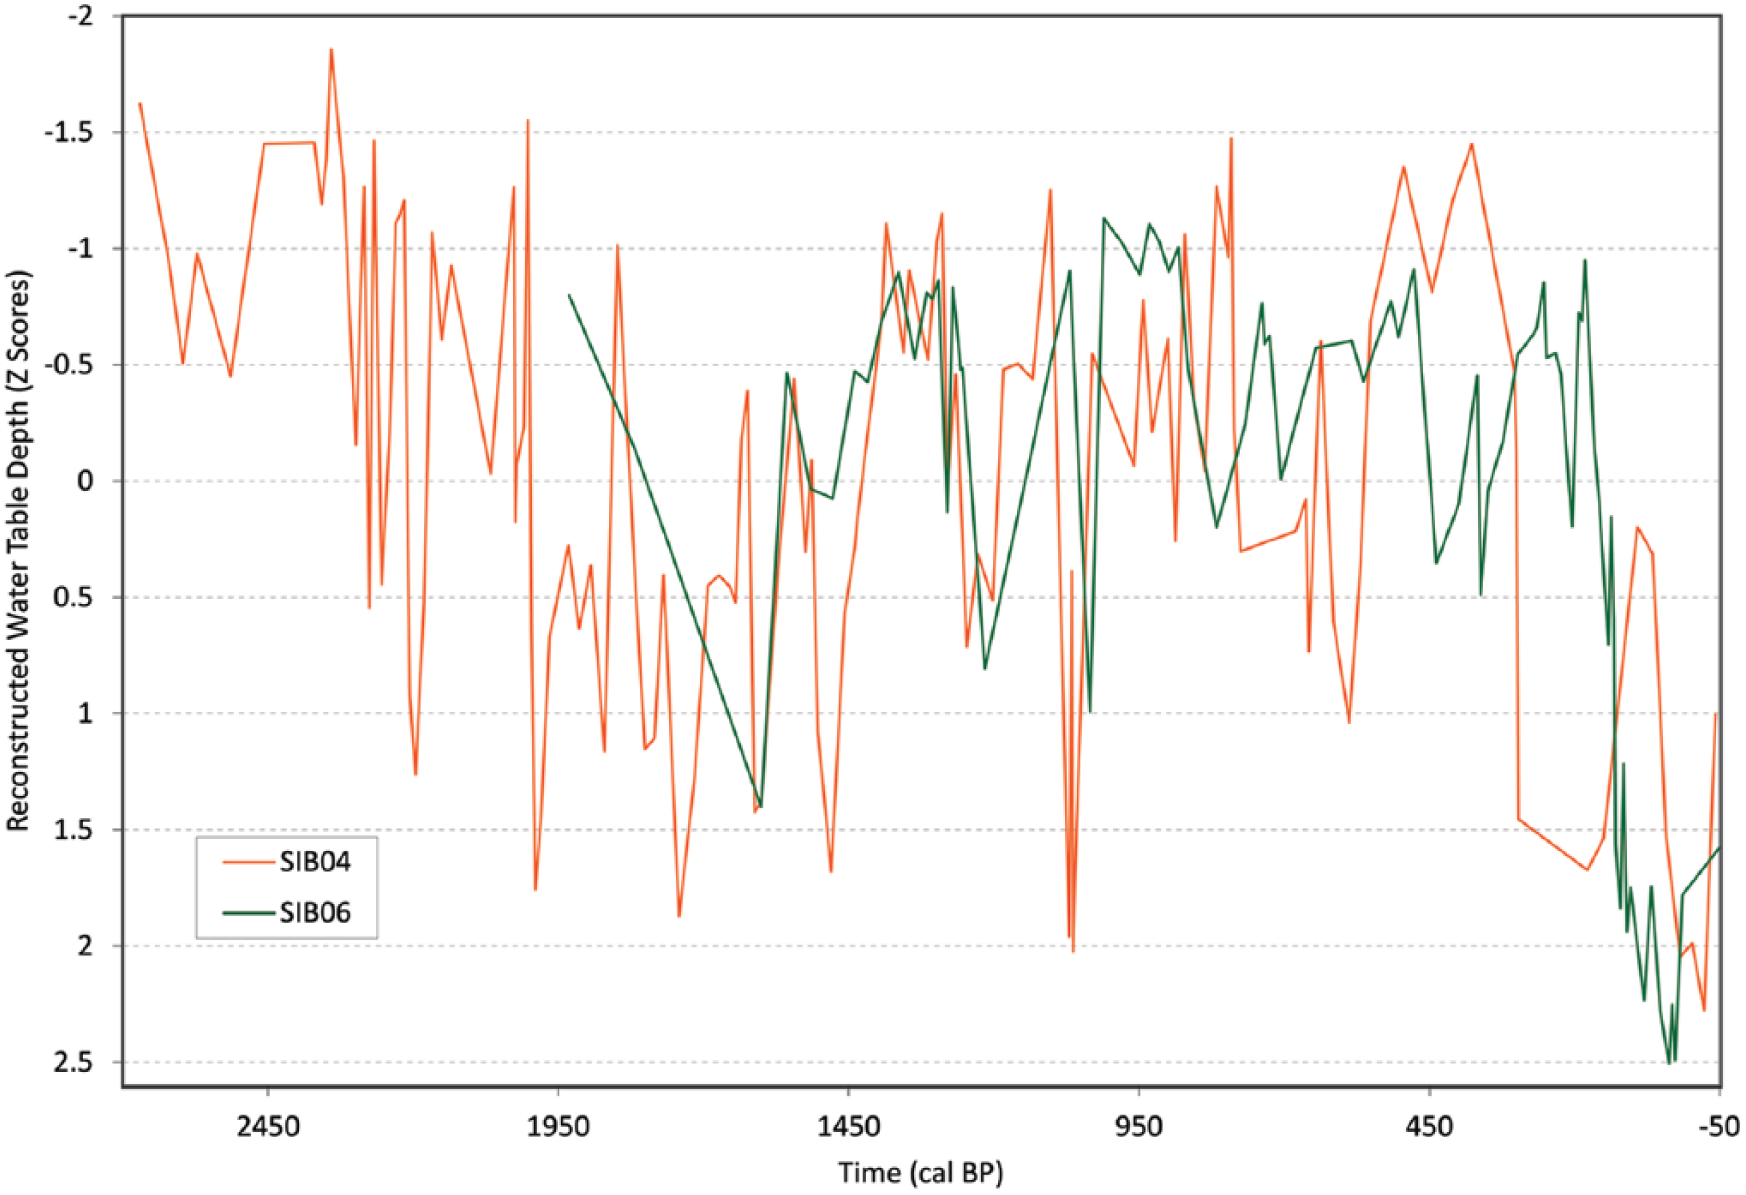
Water-table depth inferred for cores SIB04 and SIB06 using the combined transfer function.
Comparison of testate amoeba–inferred water-table depth and δ13C stratigraphy
The testate amoeba–reconstructed water-table depths and the δ13C (wet periods indicated by more negative values) stratigraphy of SIB04 showed similarity, with high significance yet low correlations (see Figure 5; R = 0.36, p < 0.005). Each proxy indicated wetter conditions prior to 2000 cal. BP, as well as between ~1500 and 600 cal. BP with a high peak in wetness at 800 cal. BP. Drier conditions were shown from 2000 to 1500 cal. BP, with gradual drying after ~600 cal. BP.
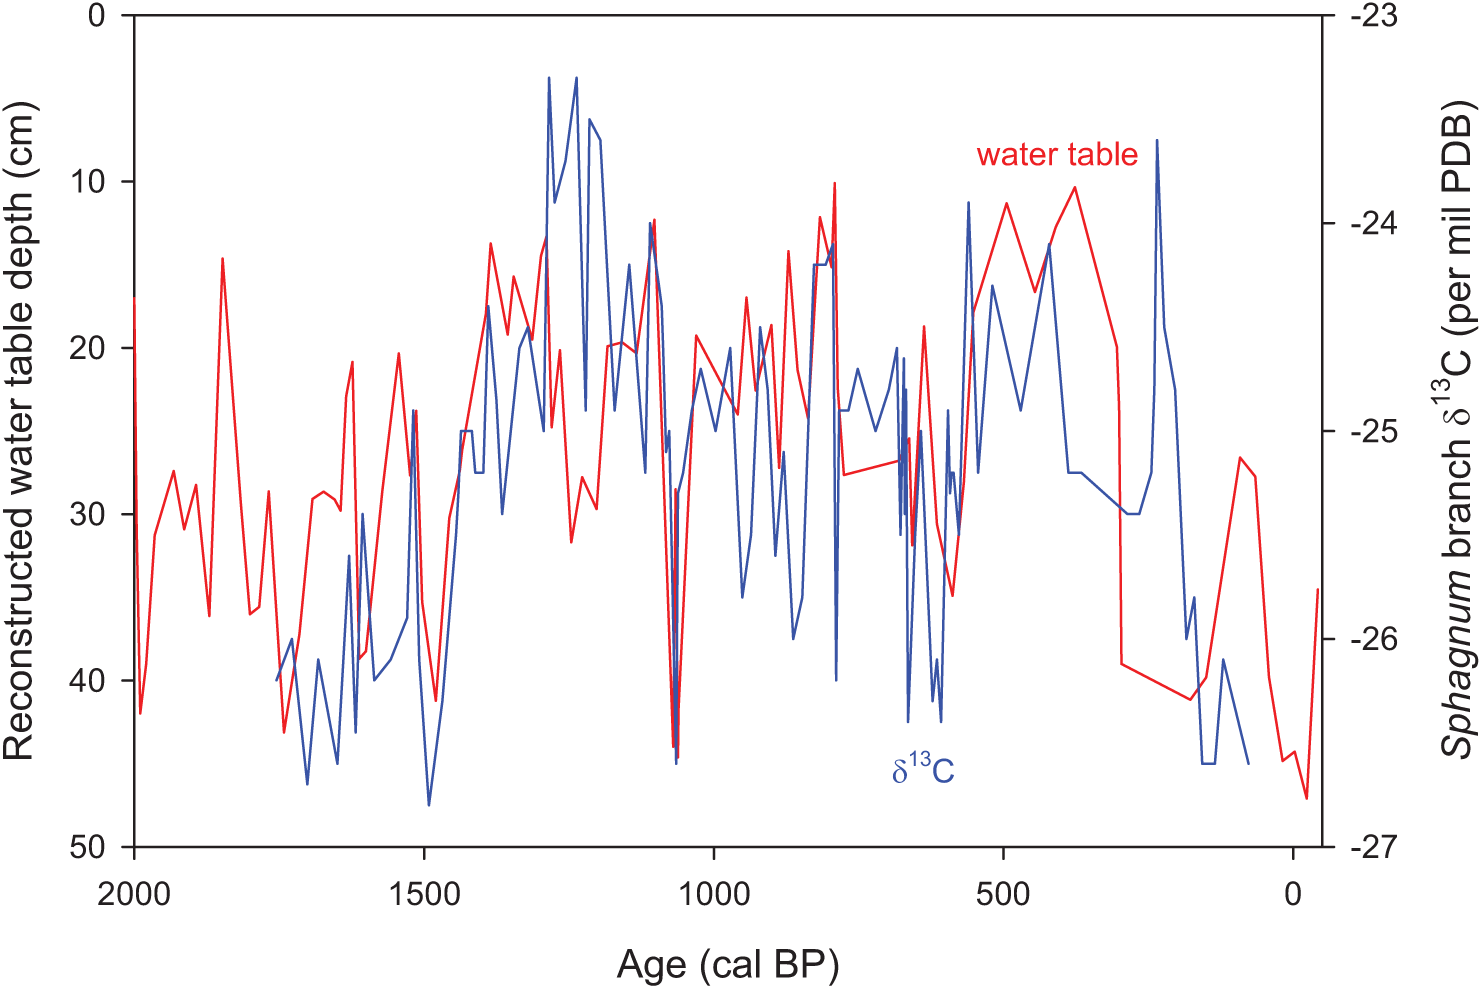
Comparison of two hydrology proxies from core SIB04; δ13C values of Sphagnum branch tissues and testate amoeba–reconstructed water-table depth per core depth.
Discussion
Water-table depth results, as well as the dominance by two species that are excellent indicators of hydrology, suggest that water-table depth is a primary driver of changes in testate amoeba communities in the two records. Furthermore, the relationship between δ13C and the reconstructed water-table depths also supports the importance of hydrology in controlling testate amoeba community composition. No local calibration dataset is yet available from the region, but given that all studies of testate amoebae from oligotrophic, Sphagnum-dominated peatlands have revealed the importance of hydrology, it is assumed that interpreting these records in terms of hydrology is valid. However, these results should be considered critically, due to the variable record of stable isotope studies.
Are testate amoeba transfer functions generally robust enough to be effective applied outside the geographic region they were initially developed from?
High similarity between all four transfer function reconstructions indicates that a unique transfer function derived from the vicinity of the core site was not necessary to accurately assess past shifts between wet and dry periods. The large shifts observed in this study are captured by all transfer functions and clearly represent significant changes in local hydrology. The cosmopolitan nature of most testate amoebae and a robust relationship between taxa and hydrology (Charman, 2001; Mitchell et al., 2000) are responsible for the applicability of transfer functions outside of the geographic regions in which they were calibrated. However, minor fluctuations or amplifications in hydrological variability may be over- or underestimated using different calibration datasets (Turner et al., 2013).
How do two separate peatland sites in the WSL compare in terms of testate amoeba assemblages and paleohydrological histories?
The high similarity between the SIB04 and SIB06 testate amoeba assemblages and the resulting water-table reconstructions suggest both the robustness of testate amoeba analysis and the role of large-scale climatic variations in controlling water-table depth in the study area. Autogenic bias and changes occurring locally over the two sites may have influenced species assemblages and the resulting water-table signal, which is always a factor when considering paleoclimate signal inferred from peatlands. The delayed drying SIB06 data displayed in response to current warming conditions could be a product of the site being located further northeast creating a slight buffer in climatic conditions. Another possibility is that this delay is an artifact of the data due to the level of precision in chronological control and low sampling resolution.
How does the testate amoeba reconstruction compare to an isotopic δ13C reconstruction of hydrology?
δ13C results from equivalent levels in the same core serve as an independent proxy and show extremely similar trends compared to those inferred from testate amoeba. Peatland paleoclimate proxies have different mechanisms and thus may represent different subdivisions of hydrology; for example, testate amoebae most closely mimic surface moisture, whereas δ13C reflects a more complex combination of both available surface water and CO2 uptake (Chambers et al., 2012; White et al., 1994). Therefore, results from these proxies may not always be consistent in comparison to one another. Lamentowicz et al. (2008) found more negative isotope values as well as testate amoeba assemblages to represent corresponding dry shifts in a Poland peatland with a low correlation coefficient (R = −0.396, p < 0.01). Isotopic signatures were interpreted as a function of the thickness of the water film present on Sphagnum stems.
The dissimilarity between our results and those of others such as Markel et al. (2010) and Loisel et al. (2009) could be attributed to more extreme climatic variations being present in the WSL due to its sheer immensity and continental climate conditions (Schoning et al., 2005). The higher correlation found here could also indicate that SIB04 was located on a hummock or Sphagnum lawn for the majority of the time period reconstructed, creating an exceptionally strong relationship between the stable carbon isotope and testate reconstructions for SIB04 (Markel et al., 2010).
Comparison of WSL water-table variations to large-scale temperature changes
Inferred water-table depths were compared with reconstructed Northern Hemisphere and Siberia temperature data (Briffa, 2000; Moberg et al., 2005; Osborn and Briffa, 2006). The geographically extensive temperature datasets were used for this comparison in order to avoid idiosyncratic error from using a smaller scale dataset, such as one derived from northern Siberia or the Northern Hemisphere, which may have a different long-term climatological regime than the southern WSL (MacDonald et al., 2008). Furthermore, the Northern Hemisphere dataset has been shown to be representative of Siberia’s overall temperature variations (see Appendix A, Figure 11, available online).
Comparison of the inferred water-table depth with reconstructed Northern Hemisphere temperature data revealed some interesting patterns in the timing of water-table depth and temperature changes; the relationship between temperature and moisture changed according to time period (Figure 6). For the majority of the record considered in this paper, cool temperatures were associated with drier peatland conditions, and warmer temperatures were associated with wetter conditions. This pattern held true from the start of the Moberg et al. (2005) temperature record (~2000 cal. BP) until the start of the LIA (~550 cal. BP). During this coupling of warm and wet conditions, the peatlands dried out slightly toward the end of the MCA. Throughout the LIA up until the present day, temperature and moisture conditions shifted, so that cooler temperatures associate with wetter peatlands and warmer temperatures with drier conditions.
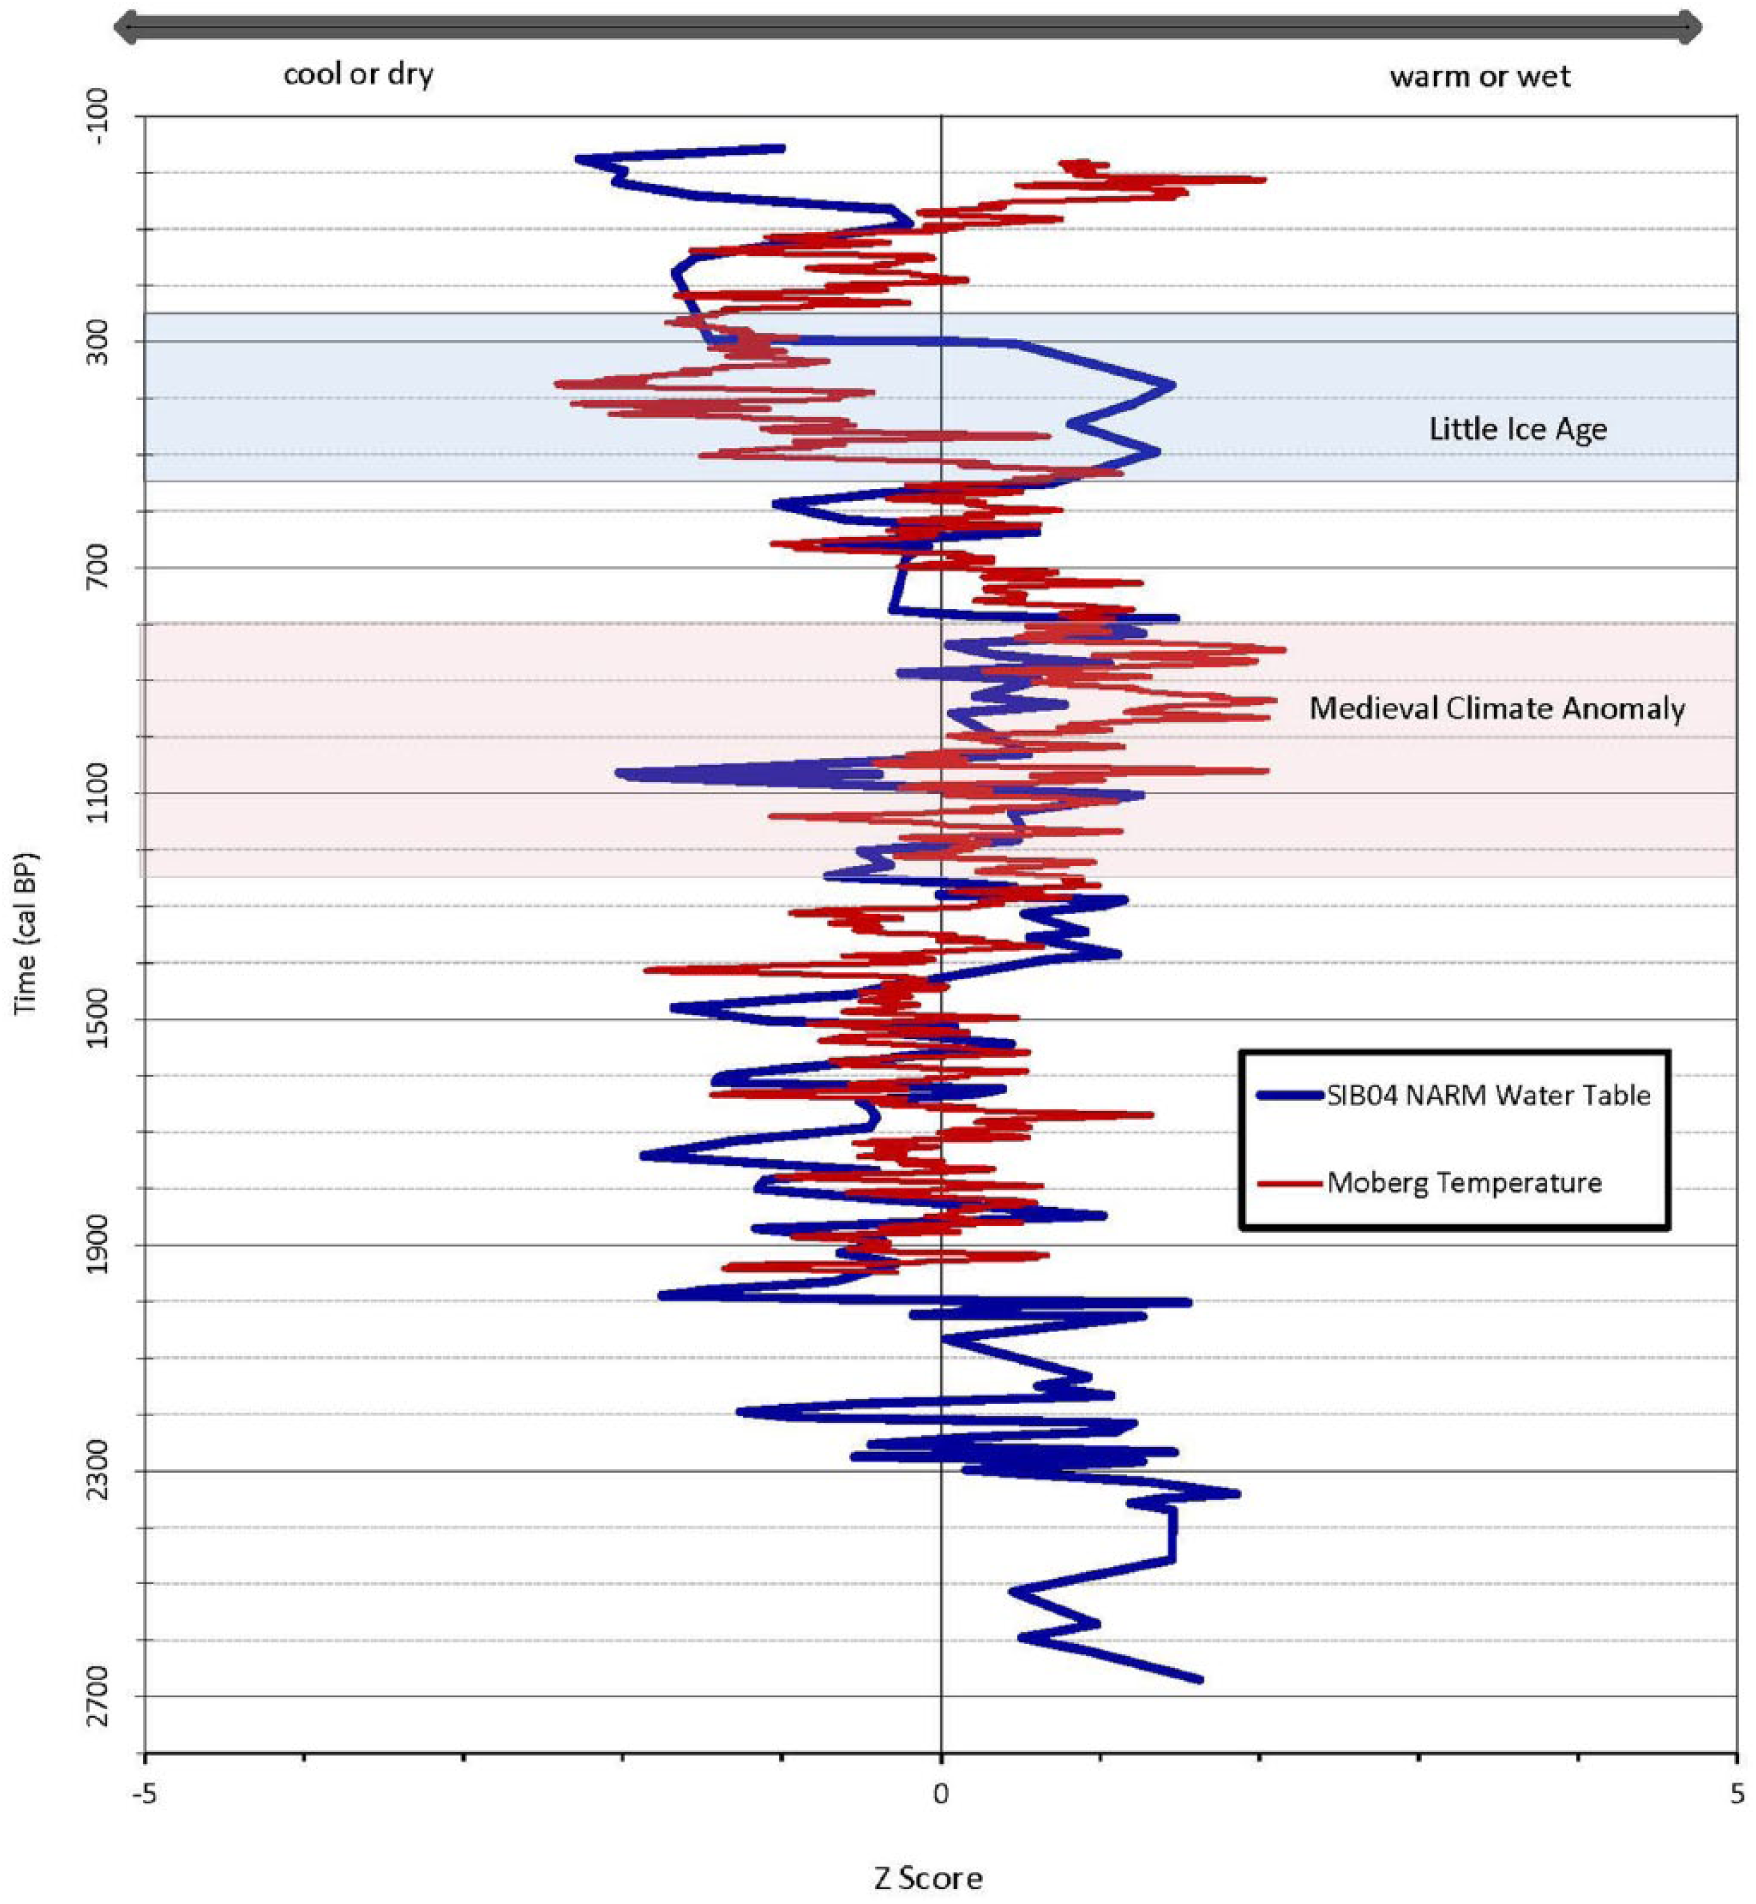
Testate amoeba–reconstructed water-table depth from core SIB04 and decadal smoothed Northern Hemisphere temperature data (Moberg et al., 2005). Data are normalized as Z scores, with positive values indicating warm or wet climate and negative values indicating a cool or dry climate.
What observable changes have occurred in water-table depth during the past 2000 years, particularly in reference to the MCA, LIA, and recent 20th- and 21st-century warming?
The reconstructed hydrology and hemispheric temperature data indicate that until about 550 cal. BP, a pattern of periods of warmer air temperatures corresponded with wetter conditions, and cooler periods corresponded with drier conditions in the two peatlands. Such a warm–wet pattern in our data prior to 550 cal. BP could be associated with increased stability in hummocks and increased carbon sequestration (Van Bellen et al., 2011). However, this pattern changes during the LIA (~550 cal. BP), and a pattern of cool–wet and warm–dry associations between air temperature and hydrology commences from 550 cal. BP to the most recent part of the record. Although it is possible that autogenic processes altered the temperature–water table relationships in the two peatlands (Swindles et al., 2012), the occurrence of this shift simultaneously at two distant sites supports the possibility that climate may have been a driver. Additional core sites would strengthen this argument as would additional proxy analyses.
Positive temperature–moisture relations during the MCA
In the observational period of the 20th century, there has been a positive relationship between temperature and precipitation in western Siberia (Frey and Smith, 2003). Increasing temperatures appear to be linked with a strengthening of the Arctic Oscillation, increased westerlies, and great incursions of precipitation delivery via storms, particularly in winter (Frey and Smith, 2003). The warming of the MCA likely encouraged the positive phase of the North Atlantic Oscillation–Arctic Oscillation, and circulation over the Atlantic was likely warm and moist, bringing increased precipitation to northern continental Eurasia (Mann et al., 2009). Although evapotranspiration would have increased in response to warmer air temperatures, it appears that this was not enough to counterbalance increased precipitation delivery and a positive hydrological response in the peatlands studied here.
Negative temperature–moisture relations during the LIA
Over the Northern Hemisphere, the LIA is represented by cooler summers, although with geographical differences in timing. Atmospheric circulation over the Atlantic was recorded to be cool and dry coming from the northeast toward western Russia and Europe during the late 17th century (250–300 cal. BP) (Mann, 2002). These patterns are similar to the negative phase of the North Atlantic Oscillation–Arctic Oscillation, which was found to prevail during the LIA following the positive North Atlantic Oscillation phase present during the MCA (Mann et al., 2009). During the negative phase of the North Atlantic Oscillation, there were suppressed westerly winds coming over the Atlantic Ocean, causing extreme seasons with bouts of high summer temperatures as well as extreme freezes during the winter. The negative Arctic Oscillation indicates high air pressure over the Arctic with low local winds, causing cool air systems over the Arctic and Subarctic land regions (Mann et al., 2009). While these cool and dry air flows were present over the Atlantic, the WSL displayed a continental climate due to their location further inland, which may have caused a variation in the effects of the oscillation system. A shift to a negative Arctic Oscillation such as seen during the LIA also possibly had an effect on seasonality (Mann et al., 2009), promoting low spring temperatures and lingering snow. The negative North Atlantic Oscillation–Arctic Oscillation cycle may also be an explanation for a change in the local climatology of the WSL. Under such generally dry climatic conditions derived from decreased delivery of precipitation, cooler temperatures that inhibit evapotranspiration and later snowmelt and release of surface water to the peatlands in the spring would have become more important in peatland moisture balance and may be reflected in the shift in the relationship between temperature and hydrology observed in our records.
Negative temperature–moisture relations in the recent past
As noted above, Frey and Smith (2003) found that in recent decades, increasing temperature was related to a positive phase of the Arctic Oscillation as associated with increased winter precipitation in western Siberia. However, a strong increase in spring warming is also evident and is causing a rapid melt of the winter’s snow cover in the WSL (Frey and Smith, 2003). This could explain the current drying phase seen in the peat, as a rapid melt of snow cover would indicate a longer warm summer period where the peat surface is exposed to evapotranspiration. A shift to a positive Arctic Oscillation may have the direct opposite effect, promoting higher spring temperatures and less late season snow cover to provide surface moisture in the summer. It is unclear in what specific attributes or magnitudes recent warming differs from the MCA, but it is clear that its impact on peat hydrology is, unlike the MCA, promoting drier surface conditions in the peatlands studied. If such effects are widespread in the WSL, they could have important implications for peat growth, decay, and carbon balance. Pronounced drying of the peat surfaces as warming continues could produce increased CO2 respiration as aerobic decay rates climb or due to the release of carbon through burning of the dry peat surfaces.
Conclusion
This study reconstructed water-table depth in West Siberia for the past 2700 years using testate amoeba analysis. Applying these raw data to various transfer functions yielded results with similarity in the timing and magnitude of wet and dry shifts. This indicates a possibility for future studies to utilize non-unique, comprehensive transfer functions which would increase research efficiency. The accuracy of our reconstruction results was assured by both our inter-site comparison between two WSL core sites (SIB04 and SIB06) and δ13C analysis conducted on one of the same cores (SIB04). The coupling of current warming temperatures to the drying of the peatland in the present day seems likely to continue unless a similar threshold is met to that encountered at the onset of the LIA. If this coupling does continue, results suggest continued drying of the southern WSL with the possibility of current carbon stores released at a relatively rapid rate in the form of carbon dioxide.
Footnotes
Funding
This work was supported by the NSF-RAISE grant (grant/award number: OPP-9818496) to Glen MacDonald and National Science Foundation (grant/award numbers: 0628598 and 0843685), and the high-resolution δ13C work was funded by Marie Curie grant (grant/award number: 40974) to David Beilman. Field collection of cores was provided by David Beilman, Olga Borisova, Karen Frey, and Konstantin Kremenetski. European transfer function results were run by Dan Charman (University of Exeter, UK).