



Abstract
We set out to test the ability to detect vegetation change from organic soil nutrient (carbon and nitrogen) composition in the fire-determined forest/non-forest mosaic of western Tasmania, Australia. We find no relationship between organic soil nitrogen and carbon content, despite widely varying local vegetation and fire regimes. Pollen evidence supports the role of fire in driving an initial vegetation state change from forest to non-forest, while carbon and nitrogen analysis of the peat section suggest that factors other than peat nutrient (carbon and nitrogen) content are responsible for the observed meta-stability of non-forest at the site for 7000 years. We find that we cannot validate the use of organic soil nitrogen and carbon content for inferring vegetation type and question the degree of post-European vegetation change inferred from this method.
Introduction
Humans have had a significant impact on vegetation systems across the Earth and there is a major global endeavour that seeks to characterise and remediate the human-induced vegetation change. This endeavour requires an understanding of not only the impacts of humans on vegetation landscapes, but also of the relative role of the multitude of factors that drive vegetation dynamics. Two major obstacles that impede attempts to restore vegetation landscapes are (1) a lack of data on their pre-impact state and (2) a lack of long-term data on the underlying environmental factors that govern vegetation dynamics (Seddon et al., 2014). Space-for-time substitution is an oft-employed ecological method used to gain an understanding of vegetation dynamics that exceeds the temporal limitations of most ecological datasets (Pickett, 1989). A critical and often untested assumption in space-for-time substitution is control over environmental variables (i.e. comparability of sites). Long-term ecological data, such as palaeoecological data, represent a powerful and alternative means of understanding longer-term ecological dynamics such as the impact of humans upon landscapes (Seddon et al., 2014). A case in point is the recent application of soil nutrient content to infer vegetation change in the fire-determined forest/non-forest in temperate Tasmania, Australia (Di Folco and Kirkpatrick, 2013). This study uncritically accepts a long-standing space-for-time based ecological model that links fire, vegetation and soil nutrient content (Jackson, 1968) to conclude a substantial degree of vegetation change in response to European colonisation (Di Folco and Kirkpatrick, 2013). Here, we use palaeoecology to explicitly test the central assumption of this approach – that soil nutrient content can be used as a proxy for vegetation change.
The landscape-scale mosaic of forest and non-forest in western Tasmania is widely considered an artefact of fire (Fletcher and Thomas, 2010; Jackson, 1968; Wood, 2011; Wood and Bowman, 2012). The role of fire in shaping vegetation landscapes is widely acknowledged (Bond et al., 2005; Bowman et al., 2009). Fires reduce plant biomass and can facilitate the replacement of trees with shrubs and grasses via a series of secondary influences that include impacts on soil nutrient dynamics (Jackson, 1968; Raison, 1979), alteration of physical and bio-physical environments (Fletcher et al., 2014) and changing macro- and micro-climate regimes (e.g. via fire-vegetation-precipitation feedbacks; Scheffer and Carpenter, 2003; Scheffer et al., 2001). Mosaics of forest and non-forest are key examples of how vegetation systems are impacted by fire and its secondary influences, with one (or more) of these pathways invoked to account for the maintenance of many forest/non-forest mosaics (e.g. Díaz and Armesto, 2007; Fletcher and Thomas, 2010; Fletcher et al., 2014; Jackson, 1968; Moore, 2000), often uncritically (Di Folco and Kirkpatrick, 2013).
In western Tasmania, the transition from forest to non-forest is punctuated by a series of vegetation states that have been convincingly framed within the alternative stable states framework (Fletcher and Thomas, 2010; Fletcher et al., 2014; Jackson, 1968; Petraitis and Latham, 1999; Wood and Bowman, 2012). Within this model of self- mediating alternative stable vegetation states, each state is ascribed a specific fire-return interval that is dependent on internally regulated vegetation-fire-nutrient feedbacks. In the absence of fire, peat nutrient content increases, facilitating the establishment of more woody species. The prolonged absence of fire enables the accumulation of sufficient peat depth and nutrient capital to support high biomass rainforest on any site in southwest Tasmania, while fire destroys extant vegetation, burns peat profiles and decreases nutrient availability. Short fire-return intervals favour species tolerant of low nutrient availability and frequent disturbance (i.e. non-forest species; Bowman and Wood, 2009; Jackson, 1968).
Despite the general acceptance of the vegetation-fire-nutrients model (coined the ‘ecological drift’ model) in the ecological literature, actual data collected on the role of nutrients in this vegetation system are contradictory with respect to the influence of nutrients over vegetation distribution. Wood et al. (2011) conclude that, while there is a systematic decrease in phosphorus from forest to non-forest vegetation, neither carbon, nitrogen nor phosphorus content of peat formed under any vegetation state in southwest Tasmania was a barrier to forest development. Conversely, Di Folco and Kirkpatrick (2013) employed a meta-analysis of carbon and nitrogen content in peat formed under a range of vegetation states across western Tasmania and concluded that forest and non-forest vegetation produce entirely different types of peat that differ in both carbon and nitrogen content. Di Folco and Kirkpatrick (2013) then use these findings to ‘fingerprint’ the peat-forming vegetation at their sites, concluding that there has been a substantial shift between forest and non-forest across this landscape since European arrival. Critically, virtually all assessments of the role of fire and nutrients in this slow-acting vegetation system are based on space-for-time studies (Bowman and Jackson, 1981; Bowman et al., 1986; Di Folco and Kirkpatrick, 2013; Jackson, 1968; Mount, 1979) and, thus, remain untested by time-series data.
Here we use fine-scale palaeoecology of a peatland on which a small patch of moorland (non-forest) formed after a fire burnt forest vegetation ca. 7000 years ago (Fletcher et al., 2014). A subset of this data that focussed on the transition between forest and non-forest was recently used by Fletcher et al. (2014) to propose an alternate model of self-maintenance of vegetation states in western Tasmania than the widely applied vegetation-fire-nutrient model: one that invokes eco-hydrology and eco-physiology in preventing forest reestablishment. In the present paper, we provide a vegetation history of this intriguing site through the last ca. 7500 cal. yr that allows us to explicitly test the assumption that nutrient content of peat (carbon and nitrogen) is dependent on vegetation type (sensu Di Folco and Kirkpatrick, 2013), asking: is the carbon and nitrogen content of peat in western Tasmania indicative of vegetation type? Can carbon and nitrogen be used to infer the type of vegetation that produced the peat?
Western Tasmania
Tasmania (41–44°S) is a cool temperate continental island that is connected to mainland Australia as a peninsula during low sea level stands. The island is bisected by a northwest–southeast trending mountain range that intercepts the dominant mid-latitude westerly winds, resulting in high annual rainfall (hyper-humid) south and west (~3500 mm p/a) and comparatively low rainfall (sub-humid) north and east (as low as 450 mm p/a). The topography is rugged and complex, with a geological basement comprised of low nutrient yielding quartz-dominated metasediments and occasional outcrops of rock types with a higher nutrient potential such as dolerite and limestone (Jackson, 1999). The temperature regime is cool (5–7°C in JJA; 14–16° C in DJF) and precipitation exceeds evaporation for most of the year.
Climatically, western Tasmania is capable of supporting cool temperate rainforest. Rainforest dominants in this region include Nothofagus cunninghamii, Phyllocladus aspleniifolius and Atherosperma moschatum, with endemic conifers dominating some higher altitude sites (Athrotaxis cupressoides, A. selaginoides) and riparian zones (Lagarostrobos franklinii). Instead, the landscape is characterised by a fine-scale landscape mosaic of forest and non-forest vegetation that owes its existence to fire (Fletcher and Thomas, 2010). Non-forest vegetation occupies a wide variety of sites in western Tasmania, ranging from well-drained hill slopes to boggy flats and valleys. Key species in moorland (the dominant plant community in western Tasmania today) are Gymnoschoenus sphaerocephalus (Cyperaceae), Melaleuca squamea, M. squarrosa, Baeckea gunniana, Leptospermum spp. (Myrtaceae), Empodisma minus and Restio australis (Restionaceae). Wet scrub and moorland heath communities are characterised by an increase in the proportion of Myrtaceae and Proteaceae species relative to Cyperaceae and Restionaceae. Transitional zones between forest and non-forest are sharp. Where an ecotone does exist, it is characterised by a rapid transition through wet sclerophyll forest, a community in which Eucalyptus spp. (Myrtaceae) and Pomaderris apetala (Rhamnaceae) overtop a rainforest understory. Mixed forest is a plant community in which Eucalypt species are emergent over a fully developed rainforest canopy and represent the last stage before rainforest development in the absence of fire. Soils in this region are universally organosols (peat) that have formed on extremely oligotrophic bedrock.
The study site
Granta Pools
Granta Pools lies on the Gog Range (41°30′28″S, 146°23′5″E; Figure 1). The Gog Range is a low (~750 m) 13 km range crested by a narrow flat plateau. The climate is super-humid and receives an annual rainfall of 1200 mm (winter dominant). Climatically, the local area is able to support both forest and non-forest species (Figure 1). Today, the site is occupied by a <18 ha patch of moorland (Figure 1) and is surrounded by tall Eucalyptus forest with an understory dominated by forest shrubs (such as Olearia spp. and Senecio spp.) and rainforest species. The core site occupies a shallow depression in Ordovician conglomerate bedrock, a low nutrient yielding and highly erosion resistant rock type that is characteristic of western Tasmania (Woodward et al., 1993) and one that results in extreme oligotrophy.
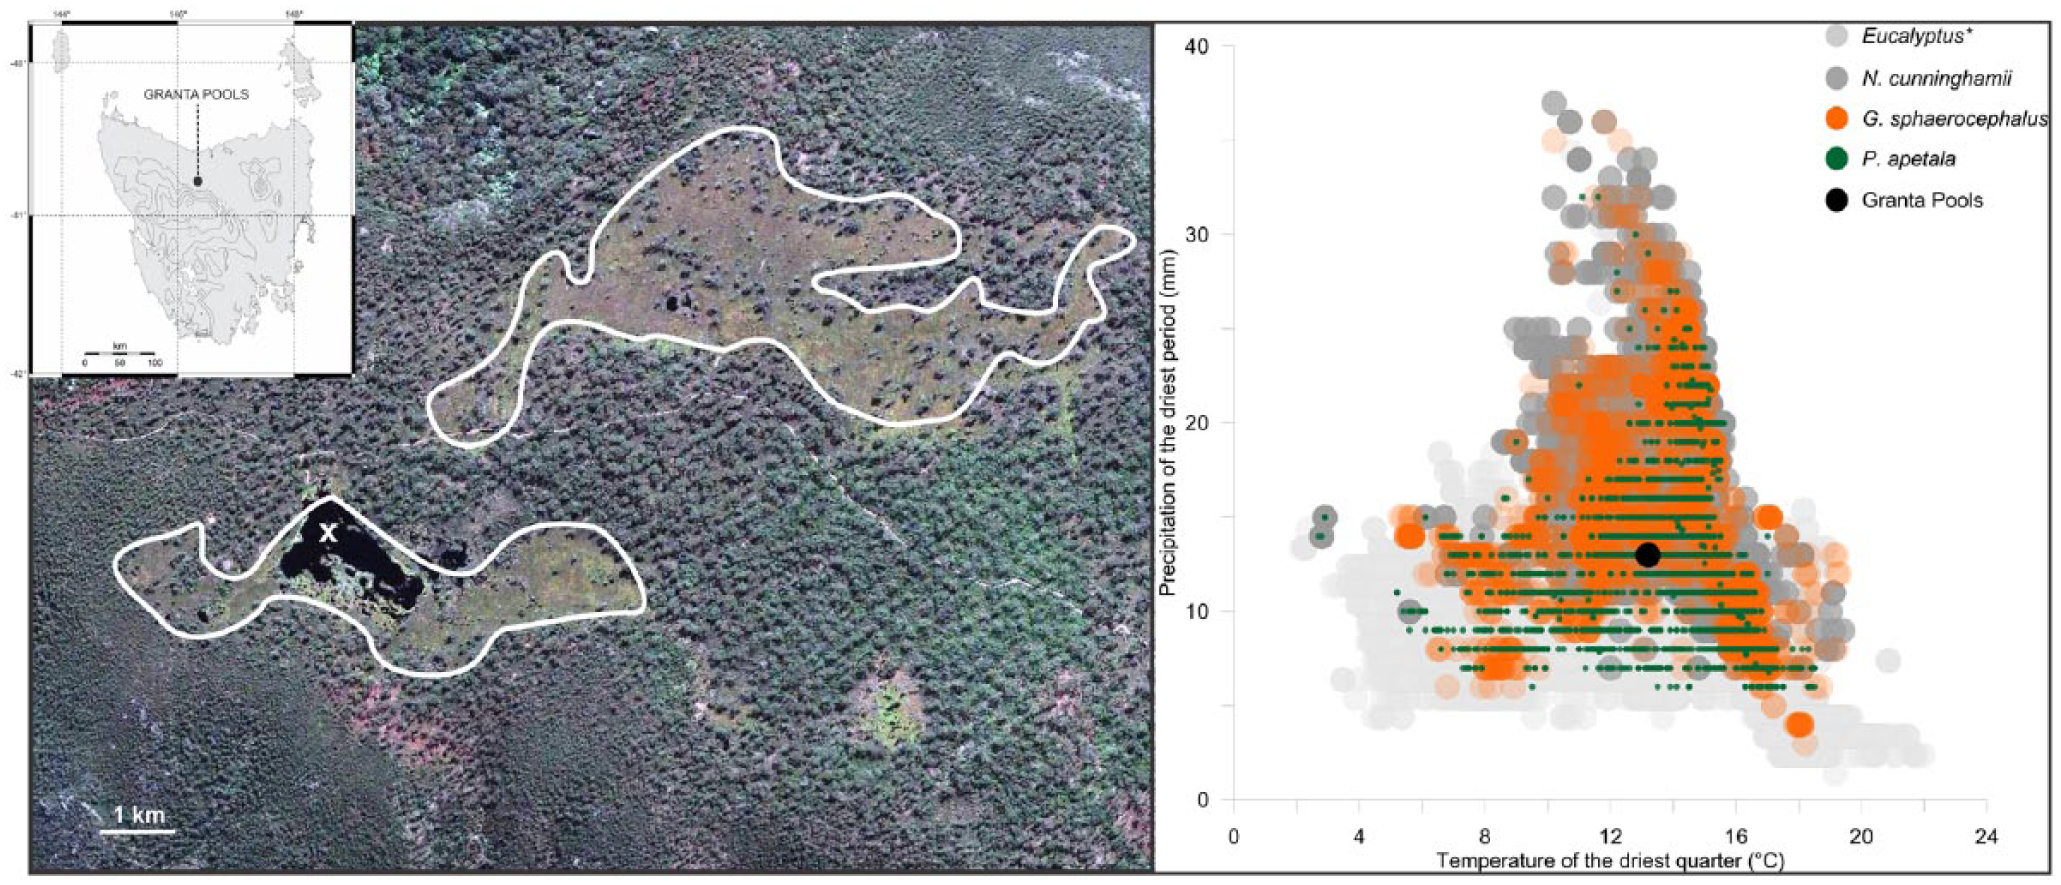
Map showing the location of Granta Pools in Tasmania (inset), a satellite image of Granta Pools depicting non-forest vegetation (circled) and the coring site (X). The panel on the right is the climate space of key plant taxa representing rainforest and wet sclerophyll forest (N. cunninghamii, P. apetala and Eucalyptus spp. (this includes Eucalypt species common to the local area today)) and moorland (G. sphaerocephalus) and the location of Granta Pools in this climate space.
Methods
Field and laboratory methods
A 94 cm peat core was removed from the centre of Granta Pools in overlapping 50 cm sections. The composite peat core was sub-sampled in the laboratory at 1 cm continuous, contiguous sections for pollen, spore and charcoal analysis. Pollen extraction followed the standard procedure outlined by (Faegri and Iversen, 1989) on volumetrically measured samples. The basic pollen sum for each level includes at least 300 pollen grains of terrestrial taxa. Percentages of aquatic and fern taxa were calculated from a super-sum that included the basic pollen sum, the sum aquatic taxa and the sum Pteridophytes. Pollen zones were identified using the aid of a stratigraphically constrained CONISS ordination (Grimm, 1987). We analysed the macroscopic charcoal content (>125 µm) of sediment samples (2 cc) to document the local fire history. The sediment samples were disaggregated in bleach and sieved using 125 and 250 µm mesh diameters (Whitlock and Larsen, 2001). Charcoal particles were individually analysed and tallied under a stereomicroscope. Analysis of organic carbon (C) and nitrogen (N) content of the peat was conducted at 2 cm intervals using an elemental analyser on samples that were pre-treated with 10% (by volume) HCl at 60°C to remove carbonate minerals and shells, followed by freeze-drying and sieving (500 µm) to remove coarse organic debris. C and N values are expressed as percentage weight values and the carbon:nitrogen ratio (C:N) is expressed as a weight ratio. The chronology is based on 4 AMS radiocarbon determinations performed on bulk sediment at the Research School of Earth Science, Australian National University. Radiocarbon ages were converted to calendar years (cal. yr BP) using the southern hemisphere calibration curve (Hogg et al., 2013). An age-depth model was created using Bayesian modelling in Bacon (Blaauw and Christen, 2011).
Statistical methods
Trends in the fossil pollen data were interrogated using Detrended Correspondence Analysis (DCA) of the terrestrial pollen data (Hill and Gauch, 1980). We performed time-series analysis on the charcoal data using the CharAnalysis software (Higuera et al., 2009) by interpolating charcoal counts to the median sample resolution to produce equally spaced intervals and then calculated charcoal accumulation rates (CHAR = particles cm−2 yr−1). Charcoal peaks, a statistically robust proxy for local fire episodes (Higuera et al., 2010), were identified as the positive residuals exceeding the 95th percentile threshold of a Gaussian mixture CHAR background model. Fire-episode frequency (number of fire episodes per 1000 years) was calculated to estimate long-term (multi-centennial) fire trends and is based on a locally weighted regression (tricubic). Finally, charcoal peak magnitude, possibly related to fire size, fire intensity and/or taphonomic processes, represents the total accumulation of charcoal for statistically significant charcoal peaks (Higuera et al., 2007).
Fletcher and Thomas (2007) conducted a numerical analysis of modern pollen-vegetation relationships in western Tasmania, revealing that arboreal pollen taxa were uniformly over-represented in the modern pollen rain, while non-forest taxa were uniformly under-represented. We use this analysis to calculate forest threshold pollen values – that is, the minimum amount of arboreal pollen required to indicate extant forest – and moorland threshold values – the minimum amount of moorland pollen required to indicate extant moorland vegetation. Similarly, we use the carbon and nitrogen analysis of western Tasmanian surface peat horizons by Di Folco and Kirkpatrick (2013) to identify average peat nitrogen content (and 2-sigma errors) of forest and non-forest peat horizons.
Results
Chronology
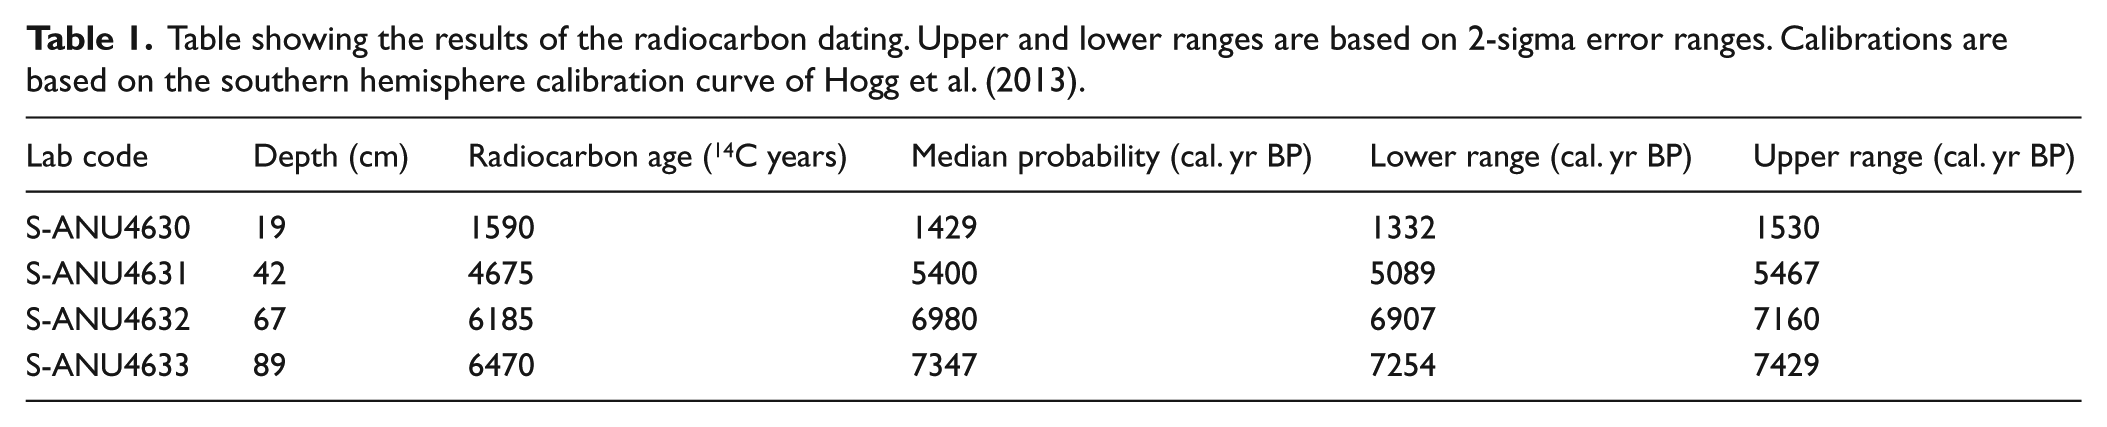
The results of the radiocarbon analyses are presented in Table 1. The age-depth model was developed using Bayesian modelling in Bacon (Figure 2). The model shows two distinct phases of peat accumulation. The rate of peat accumulation between 95 and 42 cm is an average of 24 cm 10−3 yr−1. This rate slows to an average of 8 cm 10−3 yr−1 between 42 and 0 cm depth.
Table showing the results of the radiocarbon dating. Upper and lower ranges are based on 2-sigma error ranges. Calibrations are based on the southern hemisphere calibration curve of Hogg et al. (2013).
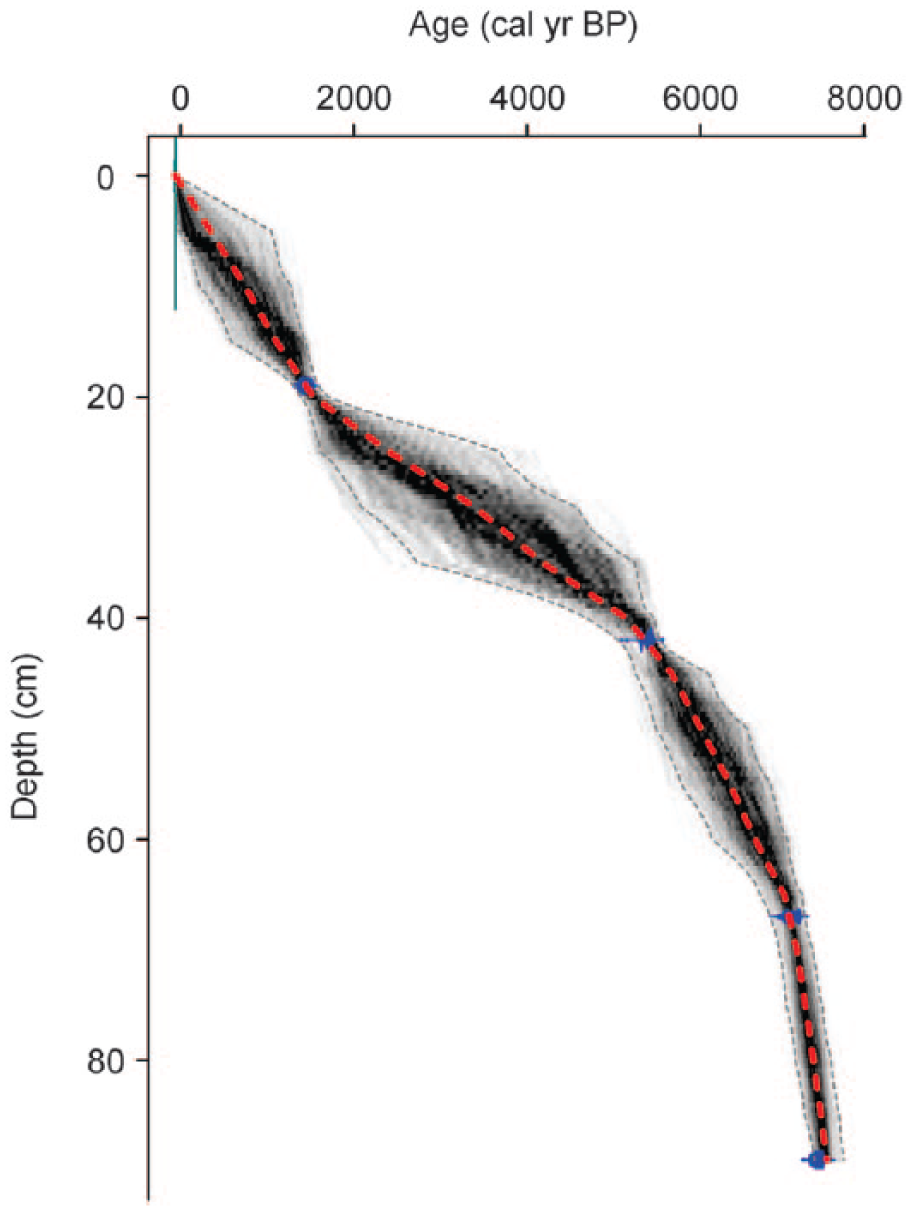
Bayesian age-depth model for Granta Pools produced using Bacon (Blaauw and Christen, 2011). Calibrations are based on the southern hemisphere calibration curve of Hogg et al. (2013).
Palynology
Zone 1: (ca.7400–7000 cal. yr BP)
Arboreal pollen types dominate the terrestrial pollen component of Zone 1: Pomaderris (11–31%, minimum and maximum values for the zone, respectively), Eucalyptus (25–57%), Nothofagus cunninghamii (4–21%), Allocasuarina (3–11%) and Astereaceae (2–4%; Figure 3a). The wetland pollen component is dominated by Cypeaceae (3–62%), which decreases towards the top of the zone, and Sphagnum (1–15%). Sphagnum values decrease sharply at ca. 7150 cal. yr BP, displaying an inverse relationship with Botryococcus spores, which peak briefly at this time (Figure 3b).

Pollen and spore diagram from Granta Pools showing (a) terrestrial tree and shrub taxa and (b) aquatic and gramminoid taxa. Note the changes in scale on the axes. The dendrogram represents a stratigraphically constrained sum-of-squares analysis (CONISS) that was used to guide pollen diagram zonation (Grimm, 1987).
Zone 2: (7000 cal. yr BP–present)
Subzone 2a
Pomaderris (5–17%) and Eucalyptus (11–35%) pollen decline sharply at the beginning of Zone 2, concomitant with a sharp rise in a number of shrub taxa (Monotoca (2–22%), Melaleuca (2–17%), Ericaceae (0–12%), Amperea xiphoclada (0–21%) and Leptospermum/Baeckea (1–19%)) and graminoids (Restionaceae (1–11%) and Gymnoschoenus sphaerocephalus (0–14%); Figure 3a). Pomaderris values remain consistently low (relative to Zone 1) throughout the remainder of the record, while Eucalyptus values initially increase before decreasing towards the end of this subzone. Monotoca values peak through the central part of Subzone 2a, becoming highly variable towards the upper part of the subzone in apparently inverse relationship with G. sphaerocephalus. Melaleuca and Restionaceae values decrease after an initial peak and also become variable towards the top of Subzone 2a. Discrete A. xiphoclada peaks occur at ca.470, 5200, 6500 and 6800 cal. yr BP (Figure 3a). In the wetland flora, Sphagnum (1–15%) initially peaks before declining and peaking again at the top of the subzone in an inverse relationship with Myriophyllum (0–22%; Figure 3b).
Subzone 2b
Eucalyptus (21–41%) values increase steadily through this subzone, while other tree taxa remain constant (Figure 3a). Initially high Monotoca (5–24%) values decline to the end of this subzone. Values for other shrub taxa (excluding Leptospermum/Baeckea (6–51%)) remain consistently low through most of this subzone, with Leptospermum/Baeckea increasing sharply towards the end. Initially high Myriophyllum (1–11%) values display a steady decline through this zone, while Sphagnum (0–8%) values remain consistently low (Figure 3b).
Subzone 2c
N. cunninghamii (2–10%) decreases sharply at the top of this zone and remains low through to the present, while values for other tree taxa remain relatively constant (Figure 3a). Monotoca (1–6%) values decrease sharply at the start of this subzone and remain low through to the present, while Melaleuca (1–20%) and, later, Ericaceae (0–9%) increase and remain relatively high through to the present. Leptospermum/Baeckea (6–75%) values peak at the beginning of this subzone, along with Bauera rubioides (0–22%), with both taxa sharply decreasing and then remaining relatively low through to the present. G. sphaerocephalus (1–20%) increases sharply at the start of this subzone and displays highly variable values through to the present. Restionaceae (3–15%) increases as Leptospermum/Baeckea and B. rubioides decrease, remaining high through to the present. Myriophyllum (0–1%) virtually disappears at the start of this subzone, while Sphagnum (1–15%) values increase and remain high (Figure 3b).
The ordination axis (DCA axis 1), which accounts for 47% of the variance in the terrestrial pollen dataset, reveals a discrete change in the composition of the pollen dataset that is coincident with the charcoal peak at ca. 7000 cal. yr BP (Figure 4). Linear regression of the DCA axes with the terrestrial pollen data reveals strong negative correlations between forest pollen taxa (Pomaderris − r2 = 0.84 and Eucalyptus − r2 = 0.2) and DCA axis 1, while non-forest taxa (G. sphaerocephalus − r2 = 0.416, Melaleuca − r2 = 0.68 and Monotoca − r2 = 0.25) are all positively correlated with this axis.
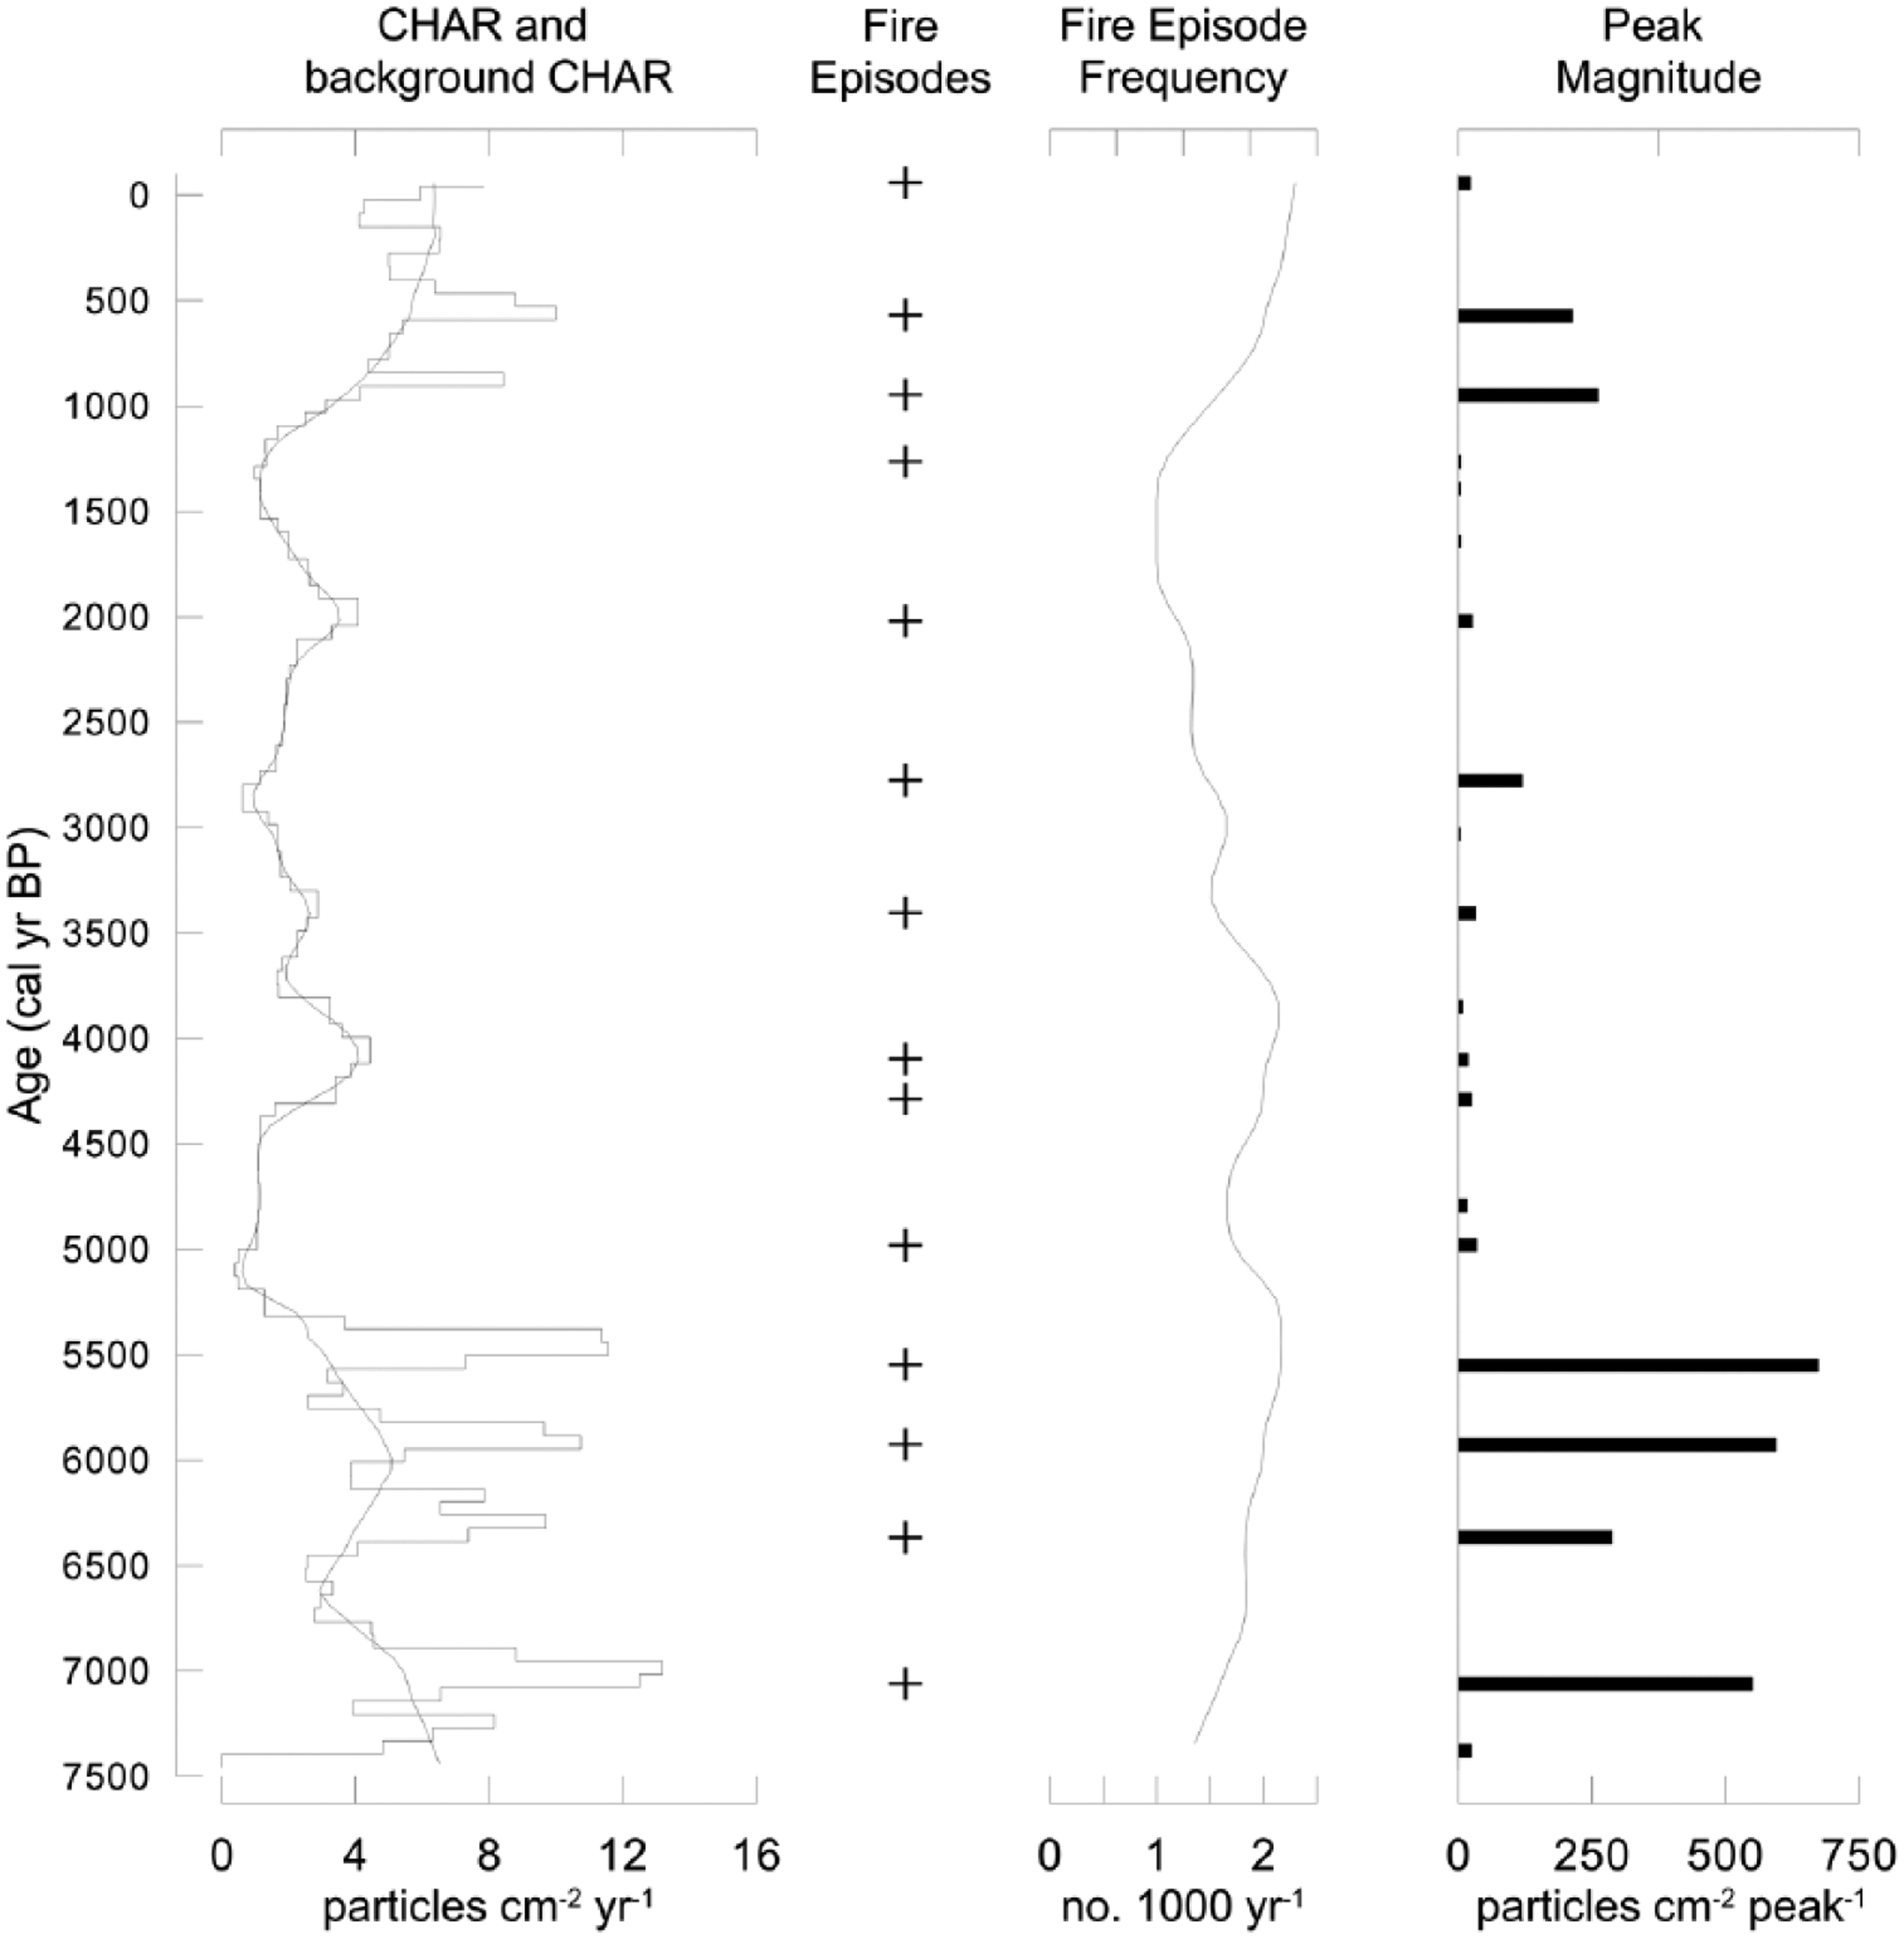
Charcoal accumulation rate (CHAR) for the last 7500 years at Granta Pools. Accumulation rates were decomposed into background CHAR (the slowly varying solid curve overlying the accumulation rate curve; window-width = 500 yr) and peaks or fire episodes. Fire episodes are charcoal events that exceed the locally defined threshold (the slowly varying dashed curve overlying the accumulation rate curve). The fire-episode frequency shows the number of peaks 1000 yr−1, based on a 500-year smoothing window. Peak magnitude (particles cm−2 peak−1) measures fire size, fire intensity and/or charcoal delivery.
Charcoal
A moderate magnitude CHAR peak occurs at ca. 6900 cal. yr BP, while two large magnitude CHAR events occur at ca. 5900 and 5550 cal. yr BP (Figure 4). A series of low magnitude CHAR peaks and comparatively low charcoal accumulation rates occur over the succeeding 4500 years, followed by a prolonged (700 years) period of decreasing CHAR between ca. 2000–1300 cal. yr BP. A sharp increase in CHAR occurs between 1300 and 880 cal. yr BP and CHAR values are highly variable through to the present, with discrete peaks occurring at ca. 570, 250 and −58 cal. yr BP (Figure 4).
Elemental organic carbon and nitrogen analysis
The overall content of nitrogen steadily increases towards the present (Figure 5b), displaying variable values between 7500 and 7000 cal. yr BP, a dip between ca. 6900–6600 cal. yr BP and generally increasing values towards the present (with notable dips at ca. 6300, 5500, 1300 and 550 cal. yr BP; and notable peaks at ca. 5600, 2300 and 900 cal. yr BP; Figure 5b). The C:N weight ratio is persistently above 20 throughout the record (Figure 5a), indicating a terrestrial source (Meyers and Teranes, 2002) and giving us confidence that analysis of the peat section will produce results comparable to studies on terrestrial peat horizons in the region (Di Folco and Kirkpatrick, 2013). Initial C:N values sharply increase to the peak value for the record at ca. 6800 cal. yr BP, dipping to a low at ca. 5900 cal. yr BP, peaking again at ca. 5500, 1200 and 550 cal. yr BP and dipping at ca. 5900 and 900 cal. yr BP (Figure 5a).

Summary plot showing (a) carbon:nitrogen weight ratio; (b) peat nitrogen content with average and upper and lower 95% confidence intervals of nitrogen content in western Tasmanian soils formed under both moorland and forest (Di Folco and Kirkpatrick, 2013); (c) relative pollen values of forest taxa with the threshold above which extant forest can be inferred (sensu Fletcher and Thomas, 2007) indicated – ‘forest threshold’; (d) relative pollen values of moorland taxa with the threshold above which extant moorland can be inferred (sensu Fletcher and Thomas, 2007) indicated – ‘moorland threshold’; (e) composite graph showing macroscopic CHAR (black line with circles) CHAR peak magnitude (grey vertical bars) and fire episodes per 1000 years (red solid curve – no symbols).
Figure 6 shows the position of the Granta Pools peat samples within the biplot of nitrogen versus carbon in peat underlying forest and non-forest in western Tasmania produced by Di Folco and Kirkpatrick (2013). Peat growth through the forest phase at Granta Pools is characterised by low nitrogen and moderate carbon content and is associated with peat samples collected from both moorland and forest vegetation in western Tasmania (Figure 6). Peat growth through the moorland phase at Granta Pools is characterised by generally higher nitrogen and carbon content relative to the forest phase and is most closely associated with peat usually found under rainforest vegetation (sensu Di Folco and Kirkpatrick, 2013; Figure 6). Regression of the carbon, nitrogen and carbon:nitrogen weight ratio with all three DCA axes scores reveals no correlation between pollen (vegetation) compositional change over the 7500-year record and trends in carbon and nitrogen.

The position of the Granta Pools samples within the carbon versus nitrogen matrix of Di Folco and Kirkpatrick (2013) for soil nutrient characteristics of soils formed under forest and non-forest in western Tasmania. Forest samples are indicated by green diamonds. Nonforest samples are represented by orange diamonds.
Environmental reconstruction
The dominance of the pollen spectra by Eucalyptus and Pomaderris (Figure 3a) and the absence of sclerophyll shrubs between ca. 7500 and 7000 cal. yr BP (Figure 3a) indicate the presence of wet sclerophyll forest at Granta Pools through this time (Fletcher and Thomas, 2007). A fire at ca. 7000 cal. yr BP (Figure 5) destroyed the extant forest system and the site was colonised non-forest taxa (Figure 5) and the loss of nitrogen from this system (likely via volatilisation; sensu Raison, 1979; Figure 5). This transition is characterised by a switch from a Cyperaceous-Sphagnum association to a Restionaceous-Cyperaceous-Gymnoschoenus association (Figure 3b), an association that is typical of moorland vegetation. This wetland transition is punctuated by a brief (ca. 30 years) phase in which Botryococcus algae became abundant (Figure 3b), reflecting the development of a transient open water system following the destruction of the local forest by fire at ca. 7000 cal. yr BP.
The transition to moorland at the site was permanent (Figures 3, 5 and 7). Despite the meta-stability of the moorland vegetation state at the site for the remaining ca. 7000 years, our data reveal a dynamic vegetation system over this time. A Gymnoschoenus-Melaleuca-Monotoca chronosequence is evident from the pollen data and is remarkably consistent with space-for-time observations of the effects of fire on moorland in southwest Tasmania (Brown and Podger, 1982; Brown et al., 2002). Tree pollen (principally Eucalyptus) and peat nitrogen content increase between ca. 7000 and 5900 cal. yr BP, despite a moderate CHAR peak at 6300 cal. yr BP. At no stage through this period (ca. 7000–5900 cal. yr BP) does tree pollen content exceed the threshold above which values indicate extant forest (Figure 5; Fletcher and Thomas, 2007).
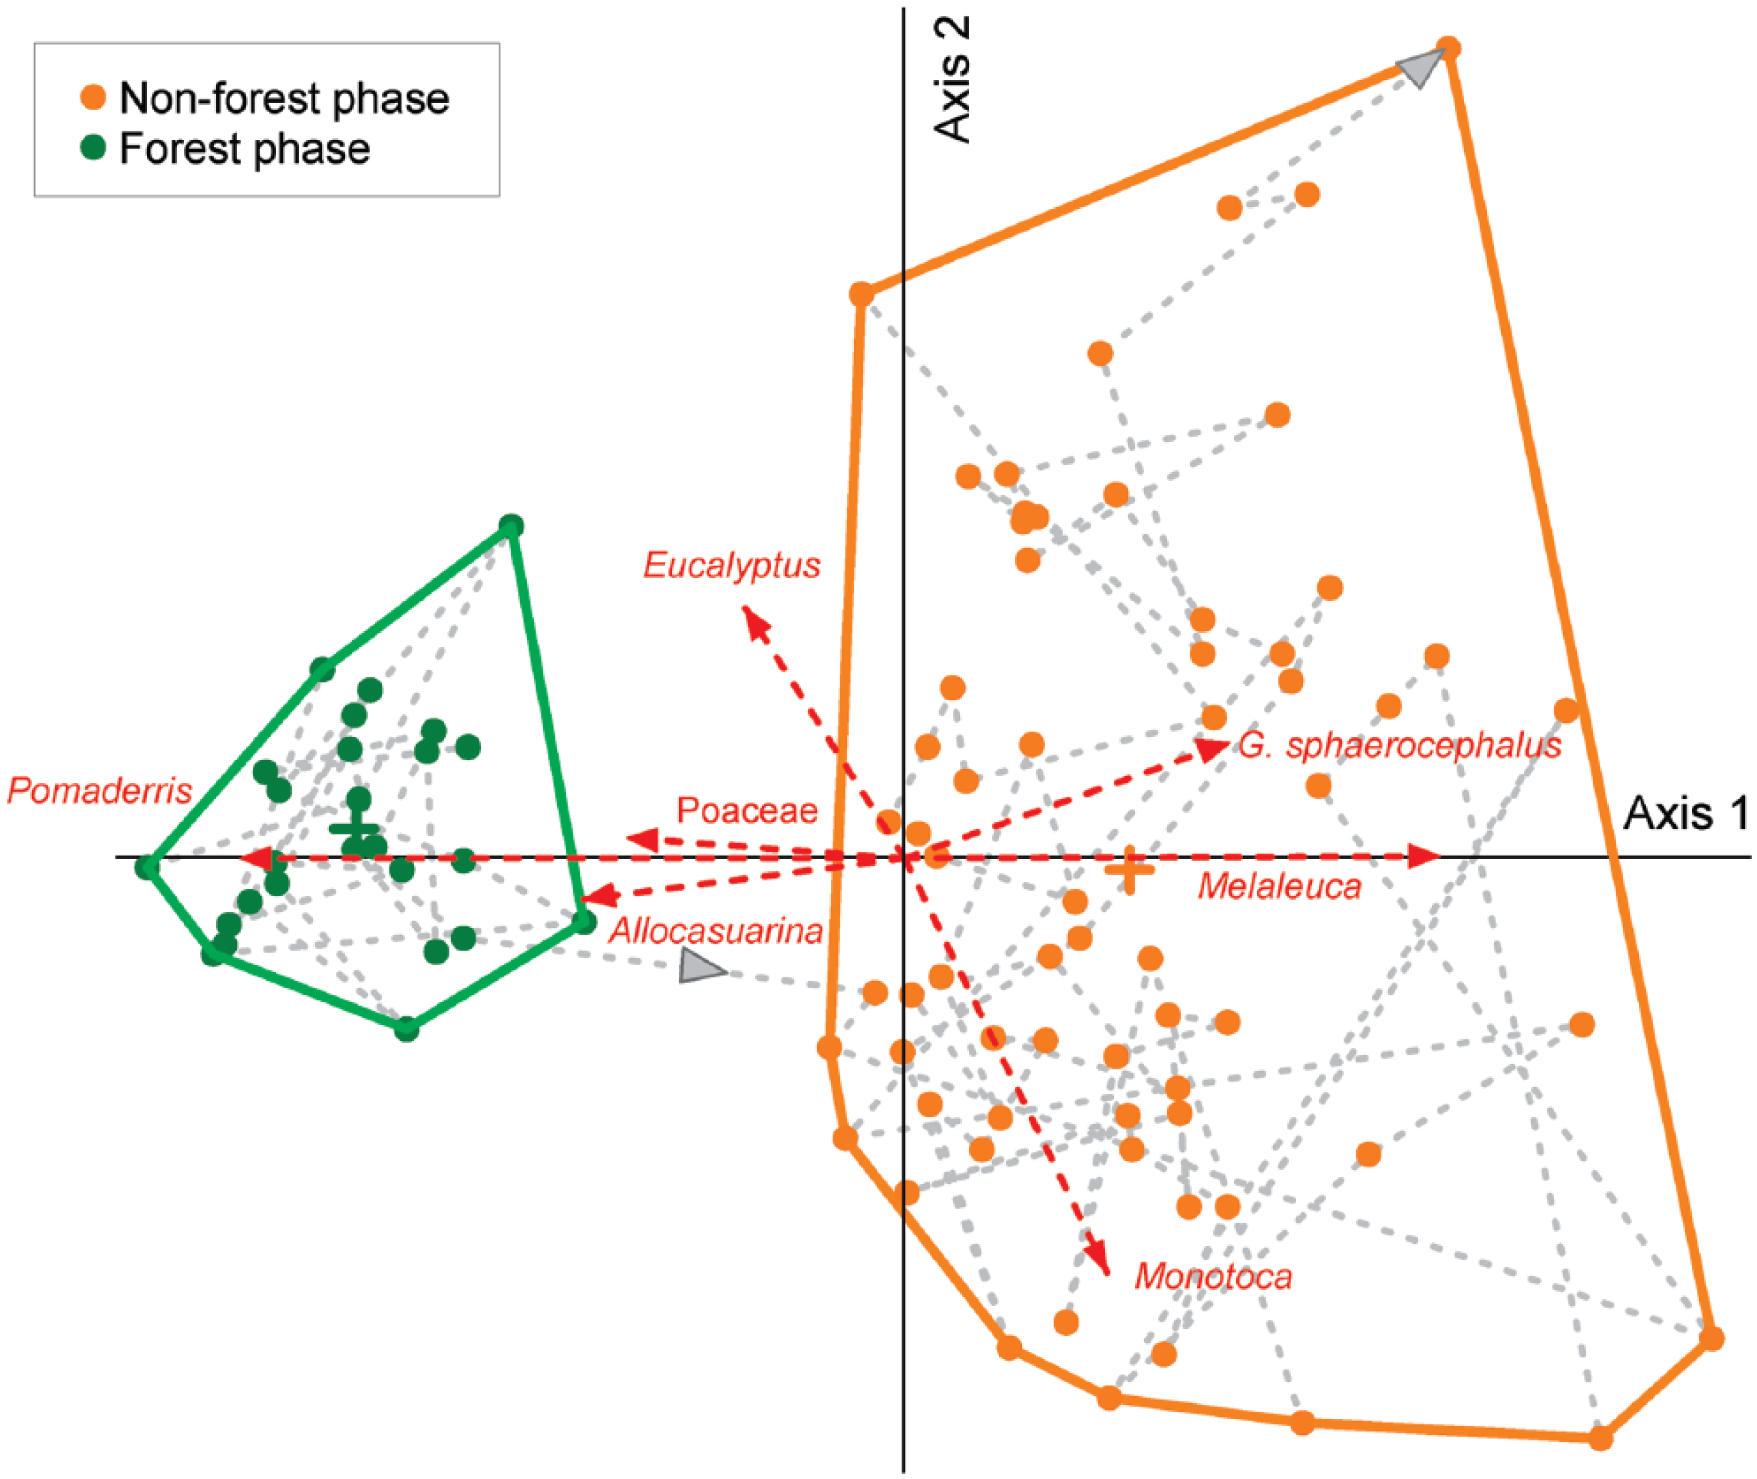
DCA ordination biplot of the Granta Pools terrestrial pollen data. The grey dashed line links samples points in stratigraphic order, with grey arrowheads indicating the direction of time from oldest to youngest samples. Red dashed arrows show the direction of correlation between terrestrial pollen taxa and the ordination axes for taxa with correlations with DCA Axis (r2 > 0.2). The length of the arrow indicates the relative strength of correlation. Forest samples (green) were identified as the cluster of samples with low DCA Axis 1 scores – high correlation with forest pollen taxa (Pomaderris and Eucalyptus). Non-forest samples (orange) were identified as the cluster of samples with high DCA Axis 1 scores – high correlation with non-forest pollen taxa (G. sphaerocephalus, Melaleuca and Monotoca).
The high magnitude CHAR peaks at ca. 5900 and 5400 cal. yr BP both drove negative (positive) responses in tree (moorland) pollen taxa and a sharp decline in peat nitrogen content, reflecting a high impact on the local peatland system. A repeat of the Gymnoschoenus-Melaleuca-Monotoca chronosequence observed earlier occurs after these fires. A subsequent long (ca. 3300 years) period of low CHAR values and low magnitude CHAR peaks corresponds to a gradual increase in both tree pollen (principally Eucalyptus) and peat nitrogen content. These trends reflect a long period of low-impact burning of the local moorland and a substantial increase and/or thickening of extra-local and regional forest vegetation in the absence of what may be considered stand-replacing fires in the forest surrounding Granta Pools.
The prolonged (800 years) period of decreasing CHAR that occurs between 2000 and 1200 cal. yr BP is associated with a massive increase of Leptospermum/Baeckea pollen. This pollen type likely represents Leptospermum scoparium, a shrub present at the site today that predominates in both long unburnt moorland/scrub vegetation and in forest in the early stage of recovery from fire. A CHAR peak at ca. 1190 cal. yr BP and the overall increase in CHAR thereafter reflects local fires at the site and more frequent burning of the local vegetation, driving a decrease in Leptospermum/Baeckea at the expense of other non-forest taxa common to more recently/frequently burnt sites (e.g. G sphaerocephalus, Melaleuca and Restionaceae).
Discussion
Our analysis of nitrogen and carbon composition of the peat section at Granta Pools allows us to assess (1) the widely accepted role of these nutrients in facilitating vegetation change in this region (Bowman et al., 1986; Jackson, 1968) and (2) the suitability of this data for predicting vegetation in western Tasmania (Di Folco and Kirkpatrick, 2013). The nutrient content of soils can have a major impact on the ability of trees to establish at a site with nitrogen, a key limiting nutrient for forest development in many biomes – particularly temperate forests such as those in Tasmania (LeBauer and Treseder, 2008). The role of nutrients in the vegetation dynamics of western Tasmania is explicit in the dominant ecological model (Bowman et al., 1986; Jackson, 1968). We identify periods of increasing nitrogen in concert with increasing tree pollen at our site (principally between ca. 7000–5900 cal. yr BP). This increase occurs despite a moderate fire episode (ca. 6300 cal. yr BP) and, while this trend provides tentative support for the proposed link between vegetation development and nutrient accumulation in this oligotrophic environment (Jackson, 1968), it is also consistent with increased soil nitrogen accumulation following low intensity burning (Raison, 1979).
Wood et al. (2011) found that, while there was a systematic increase in nitrogen, carbon and phosphorous across non-forest/forest boundaries in southwest Tasmania, nutrient capital was not a barrier to forest development. Critically, while tree and moorland pollen content fail to cross thresholds indicative of forest development at our site, peat nitrogen content increases to values well in excess of those found typically in peat under forest vegetation in western Tasmania (Figures 5 and 6; Di Folco and Kirkpatrick, 2013). The failure of forest to become established at the site despite the accumulation of an adequate nutrient capital and periods of prolonged low to absent fire activity challenge the central role of nutrients and fire in governing vegetation development in this region (Jackson, 1968).
While nitrogen-limitation and fire are clearly barriers to forest development (LeBauer and Treseder, 2008), the ability of forest to establish and maintain a presence at sites is dependent on a range of factors. Hydrology, for example, is an important control of vegetation at local and regional scales. The removal of forest vegetation from a site can alter the transpiration balance of a site and can inhibit tree development via either a decrease in effective moisture (Scheffer and Carpenter, 2003; Scheffer et al., 2001) or an excess of water from rising water tables (Díaz and Armesto, 2007; Fletcher et al., 2014). Fletcher et al. (2014) argue that lower transpiration rates under the treeless vegetation that captured Granta Pools effectively excluded forest from the site. Our data reveal that this exclusion occurs despite the removal of nitrogen-limitation and fire as a barrier. The decoupling between peat nutrient content at Granta Pools challenges the key assumption employed by Di Folco and Kirkpatrick (2013) that peat nutrient content is dependent on vegetation type. Indeed, the carbon and nitrogen content of the Granta Pools peat section display no trend consistent with vegetation type or the regional analysis of Di Folco and Kirkpatrick (2013; Figure 5). Thus, we cannot support their contention based on peat nutrient content that European arrival resulted in substantial vegetation change. We strongly recommend that any attempt to characterise and quantify vegetation change should employ robust and proven palaeoecological techniques.
Footnotes
Acknowledgements
We thank Phil Roberts for assistance with charcoal analysis and Graeme Haberle for help in the field. Thanks to Bree Fletcher for assistance with laboratory work.
Funding
M-SF was supported by ARC project DI110100019, Fondecyt project 3110180 and the Institute of Ecology and Biodiversity, Chile, through the life of this project. Funding was also provided by Comisión Nacional de Investigación Científica y Tecnológica, (Grant/Award Number: ‘3110180’) and Australian Research Council, (Grant/Award Number: ‘DI110100019’, ‘IN140100050’).