



Abstract
A gravity core collected from the East China Sea (ECS) inner shelf was analyzed for elemental and stable isotopic composition, lignin-phenols, and sedimentary pigments to investigate changes of organic carbon (OC) inputs during the past two centuries. In particular, we examined the linkages between terrestrial and marine OC inputs with climate variability and anthropogenic activities. The decrease of terrestrial OC contribution (from 41% to 28%) and increasing diagenetic indices of lignin-phenols (P/(S + V): from 0.12 to 0.22; 3,5-Bd/V: from 0.03 to 0.09) after the 1970s were possibly attributed to intensified deforestation, dam construction, and channel erosion. Lignin content (Λ8) ranged from 0.35 mg/100 mg OC to 6.92 mg/100 mg OC, with lower values corresponding to the worst flooding events in the Changjiang watershed and weaker East Asian Winter Monsoon (EAWM), while higher Λ8 was more correlated to the strengthening of EAWM. This indicates that terrestrial inputs to Zhe-Min Coast are different from those in Changjiang Estuary during flooding events and strongly linked with regional climate variability. The total contents of sedimentary chloropigments (i.e. pheophorbide-a, pheophytin-a, pyropheophytin-a, sterol chlorin esters, and carotenol chlorin esters) ranged from 663.4 to 74.9 nmol g−1 OC, and decreased exponentially downwards. Sedimentary chloropigments that were used to document historical change of phytoplankton biomass were decoupled with historical changes of Changjiang riverine nutrient inputs but corresponded well to the fluctuation of regional climate variability. Higher phytoplankton biomasses usually were observed during positive phases of Pacific Decadal Oscillation (PDO) and/or warm El Niño-Southern Oscillation (ENSO) events, and lower algal biomass usually corresponded to the negative phase of PDO and/or cold ENSO events.
Keywords
Introduction
Large-river delta-front estuaries are unique coastal environments receiving high inputs from both terrestrial (e.g. nutrients, sediments, and organic matters) and marine (primary production) sources, making them natural ‘recorders’ of anthropogenic activities and regional climate change (Bianchi and Allison, 2009). In past decades, increasing dam construction in river catchments worldwide has significantly reduced riverine sediment supply to the coast, causing coastal erosion, wetland losses, and changes in the composition and abundance of benthic and pelagic algae in large-river delta-front estuary systems (e.g. Bianchi and Allison, 2009; Duan and Bianchi, 2006; Gong et al., 2006; Xu and Milliman, 2009). In fact, coastal eutrophication has become one of the most important issues in coastal management across the globe, which is largely linked with human activity (e.g. fertilizers, sewage) in watersheds (Conley et al., 2009). For example, a disproportional enrichment of nutrients due to increasing anthropogenic activities in river drainage basins has resulted in serious ecological consequences such as harmful algal blooms (HABs) and increased frequency of hypoxia in large-river delta-front estuaries and adjacent shelves (e.g. Caballero-Alfonso et al., 2015; Carpenter, 2005; Lewitus et al., 2012; Li et al., 2011; Savage et al., 2010). Regional climate variability, such as the Pacific Decadal Oscillation (PDO) and El Niño-Southern Oscillation (ENSO), has also affected the coastal and open ocean primary production via variations in sea water temperature, current circulation, and nutrient supply (Barange and Perry, 2009; Chavez et al., 2010; Gregg et al., 2003). The eco-environmental evolution of large-river delta-front estuary systems is a complex function of all the aforementioned drivers, and distinguishing differences between the role of anthropogenic activities and regional climate variability remains a key challenge.
As the largest continental marginal sea in the West Pacific, the East China Sea (ECS) is a region that has suffered from significant anthropogenic influences (Tian et al., 1993). During recent decades, the Changjiang watershed has experienced rapid urbanization with extensive usage of chemical fertilizers and discharge of domestic waste, which resulted in more frequent HABs and seasonal hypoxia in the Changjiang Estuary and adjacent ECS shelf (Dai et al., 2011; Li et al., 2011; Zhao et al., 2012; Zhou et al., 2008). Moreover, more than 50,000 dams (including dams on farmers’ fields and dams higher than 100 m) have been constructed in the Changjiang catchment since the 1950s, which has led to significant decreases of riverine sediment discharge and changes in the aquatic ecosystems (Yang et al., 2005, 2011b; Zhang et al., 2014). Also, there has recently been an increase in the number of studies on historical reconstruction of eco-environmental evolution of the Changjiang Estuary and adjacent ECS shelf, including the history of eutrophication, phytoplankton community changes, hypoxia, Changjiang flooding and drought events, and the response to monsoons (Hu et al., 2014; Jiang et al., 2014; Li et al., 2011, 2013; Liu et al., 2015; Wang et al., 2014a, 2014b; Zhao et al., 2012). However, little remains known about the relative importance of anthropogenic activities and regional climate variability on eco-environmental evolution in different areas of the Changjiang Estuary and adjacent ECS shelf.
The primary objectives of this study were to (1) reconstruct the historical trends of organic carbon (OC) inputs from both terrestrial and marine sources in the ECS inner shelf during the past two centuries, and (2) distinguish the relative importance of regional climate variability and human activities on the eco-environmental evolution of this region. In general, we measured grain size composition, elemental and stable isotopic composition, lignin-phenols, and sedimentary pigments in a 210Pb-dated gravity core collected from the Zhe-Min coastal mud area to characterize the basic properties of sediments and OC. A three end-member mixing model based on Monte-Carlo simulation was employed to estimate the relative contribution of OC from different sources. Finally, we collectively examined the linkages between OC inputs and eco-environmental changes in this region for the first time, such as eutrophication, HABs, and the effects of anthropogenic activities and regional climate variability.
Materials and methods
Study area and sample collection
As the longest river (6300 km) in China, the Changjiang originates from the Qinghai-Tibetan Plateau, stretches across 11 provinces (municipalities), and drains into the ECS (Milliman and Farnsworth, 2011; Yang et al., 2011b). Large amounts of riverine terrestrial matters are transported into estuarine and coastal areas by the Changjiang resulting in the formation of coastal mud areas along the ECS inner shelf (Figure 1; Guo et al., 2002; Liu et al., 2006, 2007). The dispersal of the eutrophic Changjiang Diluted Water (CDW) plume is largely dominated by the physical oceanography of this region, which is governed by the seasonal varied Taiwan Warm Current (TWWC), Yellow Sea Coastal Current (YSCC), Zhe-Min Coastal Current (ZMCC), Changjiang River discharge, and tidal cycle (Figure 1; Rong and Li, 2012; Wang et al., 2007). Although characterized by high water discharge, most of the CDW is restricted at the estuarine area due to the barrier and/or shear effect of strong northward TWWC during flood season (Guo et al., 2002). The Kuroshio Subsurface Water (KSW) and TWWC can intrude into the ECS inner shelf and form upwelling due to wind driven current and orographic uplift (Chen et al., 2004; Shi et al., 2013), which has become an important nutrient source to the coastal region (Chen, 2008; Chen and Sheu, 2006). The intrusion of KSW and TWWC to the ECS inner shelf are highly influenced by the shift of North Equatorial Current bifurcation latitude that is dominated by regional climate variabilities (e.g. PDO and ENSO; Chang and Oey, 2012; Wu, 2013). Generally, the Zhe-Min coastal region has a sedimentary environment that suffers from less physical disturbance compared with the shallower Changjiang estuarine area. The Zhe-Min coastal region is also largely influenced by the CDW, ZMCC, TWWC, and KSW, making it a better place to study the relative influence of regional climate variability and anthropogenic activities on the eco-environmental changes in this region.

Location of Core D2 in the ECS inner shelf. Arrows indicate the direction of the currents (from Liu et al., 2007). Red dot indicates the sample location.
A sediment core was collected onboard R/V Runjiang 1 (Zhoushan Runhe Co., Ltd, China) using a gravity corer at site D2 (122.17° E, 28.50° N, water depth: 40 m) from the Zhe-Min coastal mud area on 3 June 2011 (Figure 1). This core was split in half vertically, and half core was sliced at 2- to 5-cm intervals throughout the core using stainless-steel cutter. Sub-samples were transferred into pre-combusted aluminum boxes and stored at −20°C freezer. The other half-core was sliced at 0.5- to 50-cm intervals and transferred into clean plastic bags for the determination of the particle reactive radionuclide 210Pb. In the lab, the first half-core was freeze-dried and stored at −20°C for further analysis.
Sediment chronology
The 210Pb activities in core sediments have been widely used to determine the chronology of coastal sediments in this region (e.g. Li et al., 2013; Liu et al., 2007; Zhu et al., 2014). The detailed analytical method for down-core activity of 210Pb is provided in Xu et al. (2014). Briefly, about 50-g freeze-dried and homogenized sub-samples were sealed into a Perspex container, and were determined for the total 210Pb content at 46.5-keV gamma emission by germanium gamma spectrometer (Canberra Be3830). After 3–4 weeks’ growth of radon daughter, 214Pb at 295- and 351-keV and 214Bi at 609-keV gamma emissions were counted in order to determine the content of 226Ra. All samples were counted for at least 24 h in order to assure the counting efficiency and to reduce standard errors below 15%. The excess 210Pb activity was calculated by subtracting the activity of 226Ra from the total 210Pb activity. Errors were calculated taking account of counting statistics and propagation with a confidence interval of 1σ. Detector efficiencies for this geometry were calculated using a natural sediment standard (GBW04304) and detector backgrounds were determined using vessel blanks at the energies of interest.
Elemental and stable carbon isotope
The detailed analytical methods for elemental and stable carbon isotope composition are described in Yao et al. (2014). Briefly, approximately 50 mg of homogenized dry sediments were fumigated with hydrochloric acid vapor to remove the carbonate fraction prior to instrumental analysis. This fumigation method has been shown to be efficient in decarbonation and suitable for determining the OC content and stable carbon isotope ratio (δ13C) in coastal sediments with low carbonate (Komada et al., 2008; Wang et al., 2015), and has been widely used in previous studies of ECS inner shelf (Li et al., 2011, 2012, 2013, 2014a; Wang et al., 2015). Total organic carbon (TOC) and stable carbon isotope ratios were then analyzed using a Carlo Erba NA 1500 Series 2 nitrogen/carbon analyzer (Fisons Instruments, USA) interfaced to a DELTA PLUSXP continuous flow isotope ratio mass spectrometer (Thermo Finnigan Instruments, USA). Analytical precision of TOC was ±0.02 wt% (n = 6). δ13C is expressed in δ notation in per mil relative to the international standards Vienna Pee Dee Belemnite. The precision based on replicatemeasurements for δ13C was better than ±0.1‰ (n = 6).
Grain size composition and specific surface area
Grain size analysis was conducted using a laser particle size analyzer (Mastersizer 2000; Malven Instruments Ltd, UK) after the method of Hu et al. (2009b). The relative standard deviation of replicate samples was less than 3% (n = 6). Particles less than 4 µm in size were classified as clay, 4–63 µm as silt, and those greater than 63 µm as sand. The sediment specific surface area (SSA) was measured based on the method reported by Waterson and Canuel (2008), and the detailed analytical steps are provided in Yao et al. (2014). Briefly, about 1 g of freeze-dried sediment was heated at 350°C for 12 h in order to remove organic matter using muffle furnace. Then, the SSA of organic matter–free sediment was determined by nitrogen adsorption according to 5 point BET method using automatic surface area analyzer (3H-2000BET-A; Beishide Instrument-ST Co., Ltd, China).
Sedimentary pigments
Sedimentary pigments were extracted according to the method of Zhao et al. (2012). Briefly, approximately 2-g homogenized freeze-dried sediments were weighed into a centrifuge tube containing 6 mL acetone. The tube was vibrated by vortex stirrer, ultrasonicated in an ice bath for 1 min, and then stored at −20°C for 12 h. The extract was separated from sediment by centrifugation (5 min, 5000 r min−1, 4°C), and the supernatant was transferred to a large glass tube. After that, the extraction procedure was repeated several times, without storage, until the supernatant was colorless. The extracts were combined together, dried under gentle N2 stream, re-dissolved with 100 µL acetone, and filtered with a syringe filter (0.45 µm PTFE; Whatman, UK) before injection. The whole extraction processes were performed under low light conditions.
Pigments were analyzed using high performance liquid chromatography based on the method of Wright et al. (1991), as modified by Chen et al. (2001). Briefly, 50 µL of the extract was injected into a Waters 610 solvent delivery system coupled with a Waters 996 photodiode array detector and a Shimadzu RF 535 fluorescence detector (excitation set at 440 nm and emission set at 660 nm, for identification purposes only). The separations were performed using a reverse phase C18 column (5 µm, 250 mm × 4.6 mm i.d.; Alltech Adsorbsphere) and the gradient program (1 mL min−1) described by Chen et al. (2001).
The qualitative and quantitative examinations of pigments were based on the retention time, absorption spectra, and area of the peaks in each sample chromatogram (at 666 nm) comparing with those of authentic standards (chlorophyll-a, chlorophyllide-a, divinyl chlorophyll-a, pheophytin-a, and pheophorbide-a, purchased from DHI Water & Environment, Denmark) and literature values (Chen et al., 2005; Zhao et al., 2012). The degradation products of chlorophyll-a without commercial standards (e.g. pyropheophytin-a, sterol chlorin esters, and carotenol chlorin esters) were quantitatively examined based on the response factor of pheophytin-a (Zhao et al., 2012). The precision (coefficient of variation) for measured pigments of interest was better than 3% (Chen et al., 2001). The detection limit of this high performance liquid chromatography instrument was about 1 nM g−1 OC if assuming an OC content of about 1% sediment dry weight (dw; Li et al., 2011).
Degradation model
The early diagenetic degradation processes of organic matter (e.g. sedimentary pigments) are a function of time (Chen et al., 2005; Sun et al., 1991; Zimmerman and Canuel, 2000), and the first-order G-model has been widely used to model the early dia-genesis of sedimentary organic matter in the environments with steady-state mixing and sedimentation rates (Chen et al., 2005; Fujii et al., 2002; Zhu et al., 2014). It has been shown that a fraction of this organic matter is closely associated with mineral matrices, which protect it from being degraded (Stephens et al., 1997; Sun et al., 1991). Since the use of a single degradation rate constant is clearly an oversimplification of decay dynamics in this large-river delta-front estuary, we used a two component equation that resulted in an improvement in fitting the organic matter profiles in most cases (Stephens et al., 1997)

where C0 (nmol g−1 OC) is the content of organic matter in surface sediment, C∞ (nmol g−1 OC) is the asymptotic organic matter content at the infinite depth, and Ct (nmol g−1 OC) is the organic matter content at certain time t (years), k1 (yr−1) and k2 (yr−1) are the degradation rate of different parts of organic matter, a (0 < a < 1) is the percentage of refractory portion in organic matter, d (cm) is the sediment layer depth, s (cm yr−1) represents the sedimentation rate, and t can be expressed as the quotient of d divided by s.
The multi-G diagenetic model of decomposition is usually established within the steady-state profile of sedimentary OC; however, an ideal steady-state distribution of sedimentary OC is hard to find. Therefore, when the time-scales of steady-state profiles are much longer than these of OC inputs’ changing period and/or degradation half-life of sedimentary OC, the OC profile can be seen as steady-state distribution (Stephens et al., 1997). The remineralization of metabolized organic matter is assumed to be at a constant k at any time, and the organic matter was regarded as two portions with different reactivities (Stephens et al., 1997; Zimmerman and Canuel, 2000). As one part of sedimentary organic matter pool, the preserved chloropigments usually follow this equation and exhibited exponential degradation trend in the sediment profile (Chen et al., 2005; Stephens et al., 1997; Zimmerman and Canuel, 2000). In this study, we defined the term ‘residua’ as the difference between measured contents and modeled values of sedimentary chloropigments at certain depth. The sum of residua of all sedimentary chloropigments, that is, the net change of chloropigments is assumed to reflect the historical change of phytoplankton biomass in the water column in this region. Based on the work by Zhao et al. (2012), where certain stable chloropigments were integrated over time, this assumption seems reasonable for an estimate of a ‘rough’ index of past phytoplankton inputs. Negative residua can occur if the phytoplankton biomass was lower than that of modern inputs (or surface interval), and positive residua indicates higher phytoplankton biomass.
Lignin-phenols
Lignin-phenol analyses were conducted based on the alkaline CuO method of Hedges and Ertel (1982), as modified by Bianchi et al. (2002), and the detailed analytical steps are provided in Li et al. (2014a). Briefly, appropriately 1 g of homogeneous freeze-dried sediments containing about 4 mg OC was placed into stainless-steel reaction vessel with 330 ± 4 mg CuO and about 4 mL 2 mol L−1 NaOH under nitrogen atmosphere. Then the vessels were heated at 150°C for 3 h in an oven. After that, 50 µL ethyl vanillin was added to each reaction vessel as internal standard before the aqueous reaction products were separated from sediments. Oxidation products were derivatized with bis-(trimethylsilyl)-trifluoroacetamide, and then the analysis of derivatives was conducted on an Agilent 7890A GC with an Equity-5 capillary column (30 m, 0.25 mm i.d., 0.25-µm film thickness; SUPELCO). The quantification of lignin-phenols was based on the recovery of internal standard ethyl vanillin and external calibration curve of lignin-phenol standards containing known amounts of compounds of interest.
A total of 12 compounds were quantified and used as indicators for tracing the sources and diagenetic state of terrestrial vascular plant tissue: V (vanillin, acetovanillone, and vanillic acid), S (syringaldehyde, acetosyringone, and syringic acid), C (p-coumaric acid and ferulic acid), P (p-hydroxybenzaldehyde, p-hydroxyacetophenol, p-hydroxybenzoic acid), and 3,5-dihydroxybenzoic acid (3,5-Bd; Goñi and Hedges, 1995; Hedges and Mann, 1979). The relative standard deviations for the individual compound and the sum of lignin-phenols were less than 8% based on replicate analyses (Li et al., 2014a). The OC normalizedlignin-phenols (Λ8) are defined as the sum of C, S, and V phenols normalized to 100 mg OC. Degradation/humification state of lignin tissues can be characterized by the usage of different diagenetic indexes: the ratios of P phenol to the sum of S and V phenols (P/(S + V)) and the ratio of 3,5-Bd to V (3,5-Bd/V; Houel et al., 2006; Louchouarn et al., 1999).
Mixing model and Monte-Carlo simulation
Various end-member mixing models have been successfully used to study the variation of different sources of OC inputs and paleoenvironmental changes at the centenary even millennium timescale in aquatic systems around the world (e.g. Carreira et al., 2002; Hu et al., 2009a, 2014; Yang et al., 2011a). Here, we employed a three end-member mixing model using δ13C and Λ8 as source markers and based on Monte-Carlo simulation strategy to distinguish the relative contribution of three different sources of OC in the ECS inner shelf sediments: marine (OCmar), soil-derived (OCsoil), and vascular plant–derived (OCVP)



where fmar, fsoil, and fVP are the fractions of OCmar, OCsoil, and OCVP in sedimentary OC, respectively. Another important assumption here is that end-member values have not changed significantly over the period of time examined in this study. Although the Changjiang watershed has suffered from certain degree of deforestation, agriculture, and erosion during recent decades, the old age of the riverine particular OC (around 800–1060 years old) and sedimentary OC in the ECS inner shelf (around 2000–5000 years old; Li et al., 2012; Wang et al., 2012) probably indicated that the influence of recent changes on isotopic composition of terrestrial OC would be very limited. Additionally, although the selection or changes of end-member values would result in some uncertainty in thecalculated contributions of different components, the variation trends of relative contributions of different sources of OC remained to be convincing to interpret the environmental changes (Hu et al., 2014).
A detailed description of the mixing model and the Monte-Carlo simulation strategy is provided by Li et al. (2014a). The end-member values of δ13C for OCmar, OCsoil, and OCVP are −20.0‰ ± 1.0‰, –26.3‰ ± 2.96‰, and −28.1‰ ± 1.68‰, and Λ8 for OCmar, OCsoil, and OCVP are 0 mg/100 mg OC, 1.64 ± 0.89 mg/100 mg OC, and 6.00 ± 5.22 mg/100 mg OC, respectively (Li et al., 2014a). The Monte-Carlo simulation was performed in MATLAB (version R2013a; Math Works, USA) based on a modified script by August Andersson (2011). The mean relative contributions and standard deviations of the three OC sources are calculated for each sample from the Monte-Carlosimulation solutions.
Statistical analysis
Relationships between the measured parameters were determined using SPSS 20 by performing Pearson correlation analysis with a two-tailed test of significance. The program SPSS was also used to run the one-way analysis of variance (ANOVA) to examine the significance of differences in data between two or more groups.
Results
Sediment chronology
A constant initial concentration (CIC) model was used to estimate the sediment accumulation rate in our study. In Core D2, the content of 210Pbexcess activities generally showed an exponentially decreasing trend throughout the whole core (R2 = 0.84) as the typical 210Pbexcess profiles in the CIC model, although there were some 210Pbexcess activity fluctuations (Figure 2a; Meng et al., 2015). The sediment accumulation rate indicated by 210Pbexcess activities is 1.05 cm yr−1, which is close to the values reported by other studies from nearby regions (e.g. Gao, 2002; Huh and Su, 1999; Liu et al., 2006, 2007; Xia et al., 1999; Yu et al., 2012; Table A.1 and Figure A.1, available online). In fact, an apparently faster decrease in 210Pbexcess activities did exist at 40 cm below. If we separately calculated the sediment accumulation rates of the two sections with 40-cm depth as the dividing line, similar sediment accumulation rates were observed with 1.13 cm yr−1 for upper 40 cm and 1.05 cm yr−1 for the whole core. The data of 210Pbexcess activities for lower section (below 40 cm) were rather limited, which was insufficient for further age estimation. Here, the CIC model was used for whole Core D2, which provided a 225-year historical reconstruction (from AD 1785 to 2011).
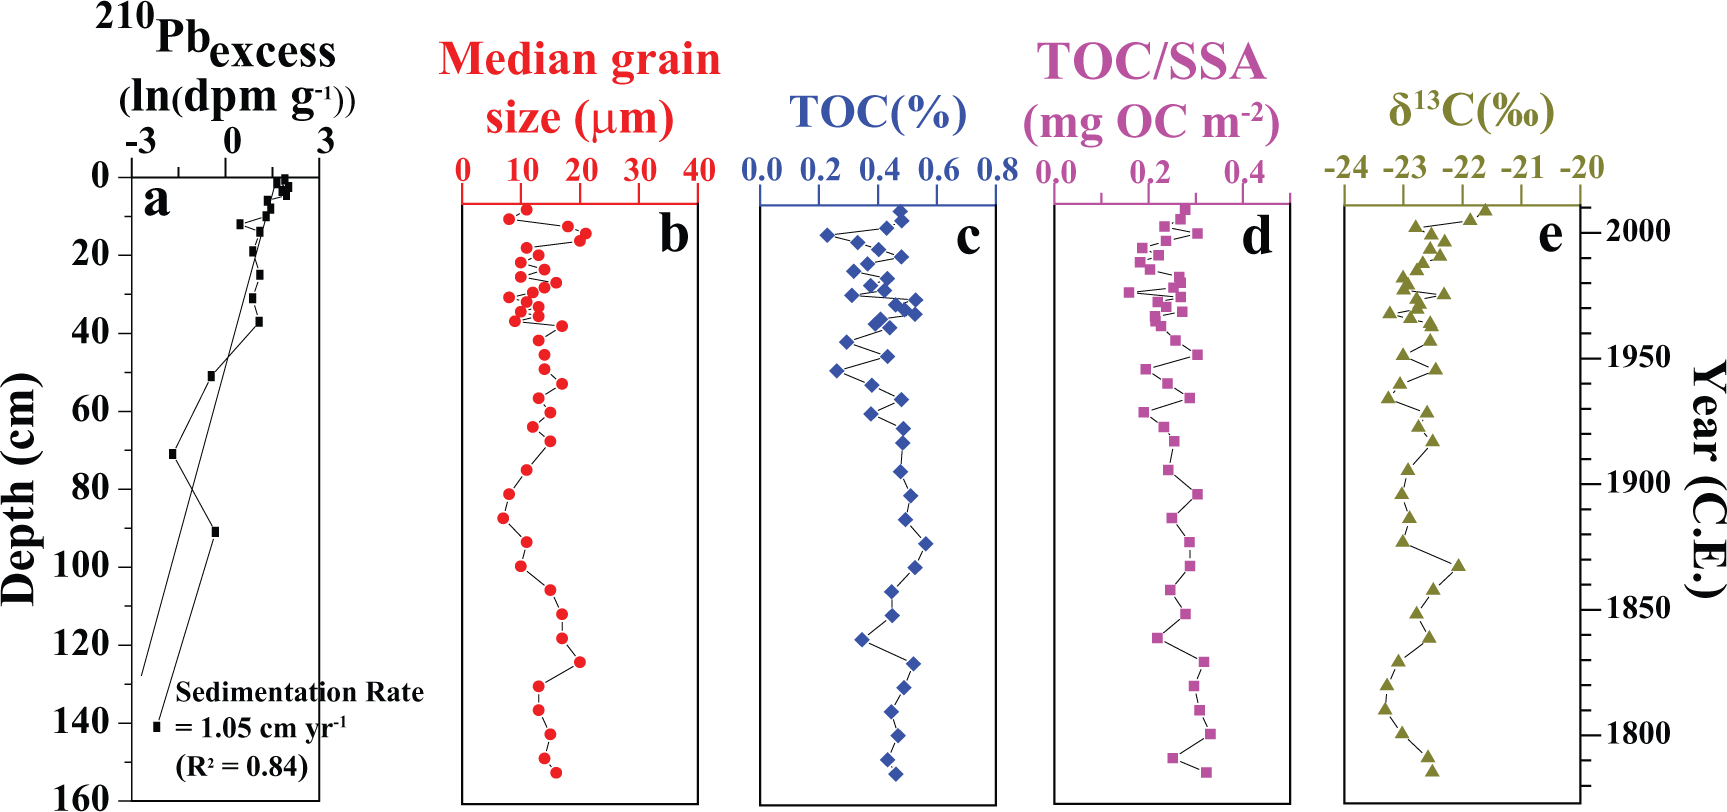
Vertical profiles of (a) 210Pbexcess (black squares), (b) median grain size (red dots), (c) %TOC (blue squares), (d) total organic carbon/specific surface area (TOC/SSA, pink squares), and (e) δ13C‰ (green triangles) in Core D2.
Grain size composition and SSA
In general, the fine-grained sediments, silt (from 68.2% to 86.9%, avg. 76.8% ± 3.9%) and clay (from 10.0% to 30.4%, avg. 20.1% ± 4.8%), dominated the sediments in Core D2, with sand (from 0.6% to 9.9%, avg. 3.1% ± 2.0%) contributing the least (Figure A.2, available online; Meng et al., 2015). The median grain size ranged from 7.0 to 21.0 µm with an average of 13.3 ± 3.3 µm (Figure 2b). SSA ranged from 7.5 to 21.7 m2 g−1 with an average of 17.3 ± 2.9 m2 g−1 (Meng et al., 2015).
TOC, TOC/SSA, and stable carbon isotope
TOC contents ranged from 0.23% to 0.56% (avg. 0.43% ± 0.08%), and showed no clear trends in variation, with some obvious fluctuations around certain years (e.g. 1830, 1930, 1970, 1990, and 2000; Figure 2c; Meng et al., 2015). TOC/SSA ratios ranged from 0.16 to 0.33 mg OC m−2 with an average of 0.25 ± 0.04 mg OC m−2, and were pretty stable throughout the core (Figure 2d). The δ13C ranged from −23.3‰ to −21.6‰ with a mean of −22.7‰ ± 0.4‰, and generally increased after 1970 with a fluctuation around 2000 (Figure 2e; Meng et al., 2015).
Sedimentary pigments
Chlorophyll-a was not detected in all samples, while the derivatives of chlorophyll-a, such as pheophorbide-a, pheophytin-a, pyropheophytin-a, sterol chlorin esters, and carotenol chlorin esters, were abundant throughout the core (Figure A.3, available online). All chloropigments showed high concentrations in the surface layer, and decreased sharply to a very low content at around 50-cm depth, remained relatively constant with depth (Figure A.3, available online), and all chloropigments showed significant correlations with each other (p < 0.001). Sterol chlorin esters had the highest surface concentrations among all chloropigments and ranged from 175.8 to 19.4 nmol g−1 OC (avg. 49.4 ± 32.4 nmol g−1 OC). Pyropheophytin-a had the highest mean content of 58.9 ± 27.1 nmol g−1 OC (from 166.9 to 29.7 nmol g−1 OC). Pheophytin-a varied from 169.9 nmol g−1 OC in the surface to 10.9 nmol g−1 OC in the bottom of the core with an average of 34.6 ± 30.8 nmol g−1 OC. The contents of pheophorbide-a and carotenol chlorin esters were much lower than pyropheophytin-a, pheophytin-a, and sterol chlorin esters, and varied from 94.6 to 4.2 nmol g−1 OC (avg. 21.0 ± 18.9 nmol g−1 OC) and 63.2 to 1.9 nmol g−1 OC (avg. 8.8 ± 10.6 nmol g−1 OC), respectively.
Based on our degradation model, the half-lives of different chloropigments ranged from several years to hundreds of years, and had a good fit with our model (R2 > 0.84; Table A.2, available online). This indicated that the vertical profiles of chloropigments can be viewed as having a steady-state distribution over the past 225 years (Stephens et al., 1997), something that would not be expected closer to the highly dynamic Changjiang LDE. The residua of each chloropigment showed significant correlations with each other (p < 0.05), and showed higher values around the yearsof 1910s, 1920s, and 2000s, and lower value around the years of 1990s and 1890s. No obvious changing trends were observed for the residua of all chloropigments (Figure A.4, available online). As mentioned earlier, we mainly focused on the variation of the sum of residua of all chloropigments that were hypothesized to represent a rough index of total algal biomass in the water column.
Lignin-phenols
The OC normalized lignin-phenols (Λ8) ranged from 0.35 to 6.92 mg/100 mg OC (avg. 1.49 ± 0.94 mg/100 mg OC), with the highest value detected at a layer corresponding to 1933/1934, and decreasing trends after the 1980s (Figure 3a). The absolute content of lignin-phenols (Σ8) ranged from 0.01 to 0.33 mg g−1 dw with an average of 0.07 ± 0.05 mg g−1 dw, and showed similar variation trend with that of Λ8 (Figure 3b). The P/(S + V) ratios ranged from 0.06 to 0.26 (avg. 0.13 ± 0.03) and showed a decreasing trend with increasing depth (Figure 3c); the 3,5-Bd/V showed similar trends with P/(S + V; Figure 3d).

Variations of (a) Λ8 (mg/100 mg OC), (b) Σ8 (mg g−1 dw), (c) P/(S + V), (d) 3,5-Bd/V, (e) peak discharge during flooding events in the Changjiang watershed, and (f) EAWM index in Core D2. The data of peak discharge during flooding events were collected from Shi et al. (2004), Li et al. (2013), and Meng et al. (2015). The gray dotted lines represent the years of the worst flooding events in the Changjiang catchment. The EAWM index data were collected from D’Arrigo et al. (2005).
Three end-member mixing model
Monte-Carlo simulation results of a three end-member model showed that marine OC was the dominant component of sedimentary OC in Core D2, and varied from 41% to 72% with a mean of 58% ± 6% (Figure 4a). The contribution from soil-derived OC ranged from 13% to 33% with an average of 28% ± 4% (Figure 4b). By contrast, the terrestrial vascular plant–derived OC contributed least to the fraction of sedimentary OC (from 7% to 47%, avg. 14% ± 6%; Figure 4c). Generally, the relative contributions from different sources were generally stable before the 1970s, except for higher contributions from vascular plant–derived OC (47%) during years 1933/1934 (Figure 4). After the 1970s, the contribution of terrestrial OC showed a decreasing trend while the relative contributions from marine OC increased (Figure 4b and c). The marine OC content (
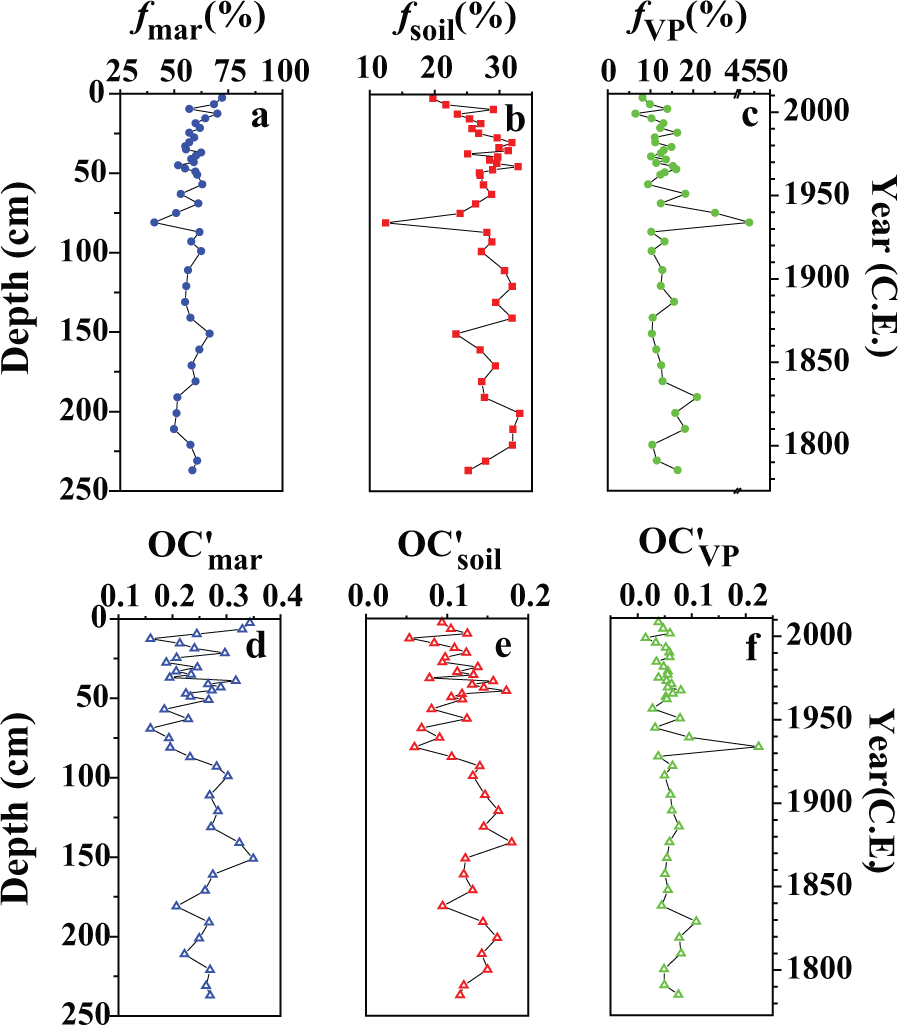
Variations of OC fractions from (a) marine (fmar (%)), (b) soil (fsoil (%)), and (c) vascular plant (fVP (%)) and different source OC contents from (d) marine (
Discussion
Sedimentary environment
The profiles of 210Pb, grain size composition, and chloropigments all indicated a relatively uniform sedimentary environment in the region. A significant correlation between 210Pb activities and sediment depth (R2 = 0.84, p < 0.01), in the absence of surface mixing (Figure 2a), indicated that physical and/or biological disturbances were minor in this core, once again unlike those found closer to the Changjiang Estuary (Duan et al., 2005). The increasing frequency and extent of serious hypoxia events during summer in recent years in the Changjiang Estuary region and adjacent ECS inner shelf (Wang et al., 2012; Zhu et al., 2011) may have inhibited the widespread presence and bioturbation activity of benthic fauna (Schüller et al., 2014); however, this remains purely speculative. Relatively low median grain sizes at this site (avg. 13.3 ± 3.4 µm) and the dominance of fine-grained particles (silt and clay) of sediment compositions also indicated lower energy hydrodynamic conditions (Figure 2b; and Figure A.2, available online; Li et al., 2014a). Additionally, the good model fit strongly indicated that the decay processes of sedimentary chloropigments closely followed first-order decay dynamics; therefore, the supply of phytoplankton chloropigments, and diagenetic processes generally played a more important role than physical mixing in this core (Chen et al., 2005). Exponential losses of sedimentary chloropigments without any obvious change in grain size composition and median grain size throughout this core further implied diagenetic loss of sedimentary chloropigments during progressive burial under steady-state sedimentation (Mayer et al., 2007; Figure 2b; and Figures A.2 and A.3, available online). TOC/SSA ratios have been shown to remain stable for sediments withsimilar sources and have proved to be an effective parameter indicating efficient OC remineralization due to post-depositional disturbances of sediments (Blair and Aller, 2012; Yao et al., 2014). TOC/SSA ratios were very stable throughout Core D2 without obvious fluctuations (Figure 2d), indicating limited post-depositional disturbances.
Although the Changjiang watershed has suffered from severe land-use change and dam construction, its influence on the sedimentation rate in the Zhe-Min coastal mud area, south of the Changjiang Estuary proper, has been limited. This is surprising when considering such dramatic alterations in the Changjiang watershed such as the Three Gorges Dam, which we would have expected to significantly reduce the flux of coarse riverine particles to this region, even when considering the more limited trapping effect on the fine-grained sediments (Xu et al., 2011). The relatively stable and small median grain size (around 13.3 µm) throughout Core D2 further supports any clear effects of the Three Gorges Dam in this region. Second, due to the strong sediment carrying capacity of the Changjiang River, riverbank and delta region downstream of the Three Gorges Dam have been significantly eroded (Yang et al., 2011b). For example, sediments supplied from the river channel to the suspended particle load are around 60–70 Mt yr−1 after the operation of Three Gorges Dam (Luo et al., 2012; Xu and Milliman, 2009). Similarly, the delta front has also devolved from around 125 Mm3 yr−1 of sediment accumulation in the 1960s to around 100 Mm3 yr−1 of erosion in recent years (Yang et al., 2011b). The increasing median grain size of riverbed sediments and decreasing median grain size of suspended particles, after the operation of Three Gorges Dam, are further support for the role of resuspension of sedimentary fine particles (Chu et al., 2007; Xu and Milliman, 2009; Xu et al., 2011). These resuspended fine sediments are probably important supply sources for the riverine sediment discharge and occupy a significant proportion of riverine suspended sediments, particularly after the operation of Three Gorges Dam. Third, the sand–mud boundary in the ECS showed a landward retreating trend (around tens of kilometers) in the Changjiang River mouth region but has expanded seaward in the Zhe-Min coastal area (Luo et al., 2012). This is likely due in part to the increasing proportion of finer grain-sized particles in Changjiang riverine particles. Although the influence of anthropogenic activities on sedimentation rate in this region was probably limited, the terrestrial OC character recorded here indicated remarkable changes during past decades (more details can be found in the next section).
Overall, we found this site to be an excellent location for recording both inputs from the drainage basin and marine primary production, and for testing the relative importance of anthropogenic activities and regional climate variability on eco-environmental evolution in the Changjiang Estuary and adjacent ECS shelf.
Human activity, flooding events, and climate variability effects on terrestrial OC inputs
Human activities (e.g. land-use changes, deforestation, and dam construction) in the Changjiang drainage basin have significantly changed the character of riverine terrestrially derived materials over past decades. As mentioned above, although the damming activity has limited influence on the sedimentation rate in the Zhe-Min coastal area, its influence on the terrestrial OC character remains compelling. The decreasing trend of lignin content and terrestrial OC fractions after the 1970s (Figures 3a, b, 4b, and c) in Core D2 is likely attributed to more river channel and delta erosion accompanied by greater resuspension of fine-grained riverbed sediments (Luo et al., 2012; Milliman and Farnsworth, 2011; Xu et al., 2011; Yang et al., 2011b). This appears to have resulted in the transport of more lignin-poor fine-grained terrestrial OC from deeper soils, due to more intense erosion in the drainage basin, to the Zhe-Min Coast. Higher P/(S + V) and 3,5-Bd/V ratios and lower lignin concentrations after the 1970s further support this notion of sources from deeper soil horizons (Figure 3c and d). For example, Heim and Schmidt (2007) reported that lignin decomposition in soils was very fast and generally showed higher diagenetic state and lower lignin content with increasing depth.
Records of terrestrial OC inputs to coastal sediments, after flooding events in the Changjiang watershed, were remarkably different between the Zhe-Min coastal mud area and the Changjiang estuarine region. For example, lignin parameters in Core D2 varied around flooding years, especially when the worst floods occurred in the Changjiang catchment (e.g. 1954 and 1998; Shi et al., 2004; Figure 3). However, more terrestrially derived materials with very different soil-derived OC character (e.g. lower lignin content and higher degradation state) were delivered to the Zhe-Min Coast during floods (Figure 3), in contrast to more lignin-rich fresher terrestrial-derived OC to the Changjiang Estuary (Li et al., 2013). Hydrodynamic sorting of soil OC and vascular plant debris during transport across the Changjiang Estuary and adjacent ECS inner shelf may explain for these differences (Li et al., 2012, 2014a; Zhu et al., 2013). For example, the Λ8 value (0.35 mg/100 mg OC) in year 1998 (which corresponded to a worst flood in the entire basin) in Core D2 was relatively lower than that deposited in the Changjiang Estuary (around 0.74–0.95 mg/100 mg OC; Li et al., 2011). Also, the Λ8 value (0.35 mg/100 mg OC) was much lower than that of surface soils in the Changjiang catchment (around 0.59–3.26 mg/100 mg OC; Yu et al., 2007), which again may be suggestive of a more prominent terrestrial OC contribution from deeper soils. This is consistent with the older radiocarbon age of fluvially derived inputs during flooding events (Li et al., 2012). Such extreme flooding events that occurred in the entire Changjiang watershed would have likely delivered more terrestrially derived materials from upstream with lower Λ8 values and higher diagenetic state compared with those from midstream and/or downstream (Yu, 2007). Although there is no doubt that more terrestrial OC (including both coarse and fine particles) would be delivered into estuarine areas during flooding events (Li et al., 2013), most of lignin-rich coarse detrital particles would be expected to be deposited in the lower river and delta region, with more soil-derived lignin-poor finer particles being transported further south along the coast (Li et al., 2014a). However, not all flooding events in the Changjiang drainage basin were recorded by organic proxies in Core D2 (Figure 3). Lignin has been shown to be more reactive than previously thought, and diagenetic processes in sediments may obscure the terrestrial OC signals of ancient flooding events (Eadie et al., 1994; Ward et al., 2013). Nevertheless, we did not find significant decrease of TOC/SSA ratios and terrestrial OC contents during ancient flooding events, which probably indicated limited influence of digenetic processes on the terrestrial OC signal of flooding events. The addition of marine OC has been shown to affect the bulk OC signatures in these coastal sediments (Liu et al., 2010), which would probably also mess the difference of terrestrial OC between flooding events and normal period. Moreover, the long distance from Changjiang River mouth may also enhance the temporal decoupling between riverine sediment flux and sedimentary records (Li et al., 2013).
The greater further dispersal and transport of the Changjiang riverine fine sediments in the ECS inner shelf is more dominated by the coastal hydrodynamic conditions (Li et al., 2014a), with the Zhe-Min Coast more highly linked with regional climate variability. Former studies have demonstrated that the deposited fine-grained sediments (<65.5 µm) in the Zhe-Min Coast were mainly derived from the resuspended materials in the estuarine region during winter periods (Guo et al., 2002). Moreover, these fine-grained sediments are more susceptible to the variations of coastal currents affected by the East Asian Winter Monsoon (EAWM; Liu et al., 2010). The lignin content generally showed consistent trends with EAWM (Figure 3a, b, and f). For example, the long period of strong EAWM from the 1920s to 1940s (D’Arrigo et al., 2005) corresponded to the enhanced alongshore transport of Changjiang-derived terrestrial OC and higher Λ8 value in the Zhe-Min Coast (Figure 3a, b, and f). Conversely, a generally decreasing EAWM since the 1930s may have contributed to the slight decreasing of Λ8 values (Figure 3a, b, and f). However, if we calculate the correlation between lignin content and strength of EAWM during the same year or adjacent years (±5 year), a fairly weak correlation was observed (R = 0.37, p < 0.05, n = 32).
The most likely reasons for weak statistical linkages between our proxy and regional climate data are the multitude of other anthropogenic changes that have occurred in the Changjiang River watershed. Interestingly, there are many factors which may have contributed to this weak correlation, such as the changes of Changjiang water discharge, dam construction in the Changjiang watershed, sectioning precision, and possible errors of core chronology (Meng et al., 2015). Thus, it is not surprising that there was no significant correlation between lignin-phenol parameters in Core D2 and strength of EAWM. However, we did find that lignin parameters corresponded well to the strength of EAWM (Figure 3). For example, during the strongest EAWM period (around the 1930s), the highest lignin content (Λ8: 6.92 mg/100 mg OC) and lowest degradation parameter values (P/(S + V): 0.06; 3,5-Bd/V: 0.03) were observed. Conversely, during the weakest EAWM period (around the 1990s), the lowest lignin content (Λ8: 0.35 mg/100 mg OC) and highest degradation parameter values (P/(S + V): 0.26; 3,5-Bd/V: 0.09) occurred. Moreover, during the periods from the 1780s to 1830s, 1850s to 1910s, 1920s to 1970s, and 1980s to 2000s, the Λ8 and lignin decay parameters generally showed similar and opposite variation trends with strength of EAWM, respectively. Thus, we conclude that variations of lignin parameters were highly dominated by the strength of EAWM.
Response of phytoplankton biomass to regional climate variability
The intrusions of KSW and TWWC into the ECS inner shelf are key in controlling the historical change of phytoplankton biomass on the Zhe-Min Coast. Although there are no long-term HAB records, the sedimentary records of chloropigment residua corresponded well to the occurrence of HABs in the coastal area of ECS inner shelf after the 1970s (Figure 5). Similarly, the variation of
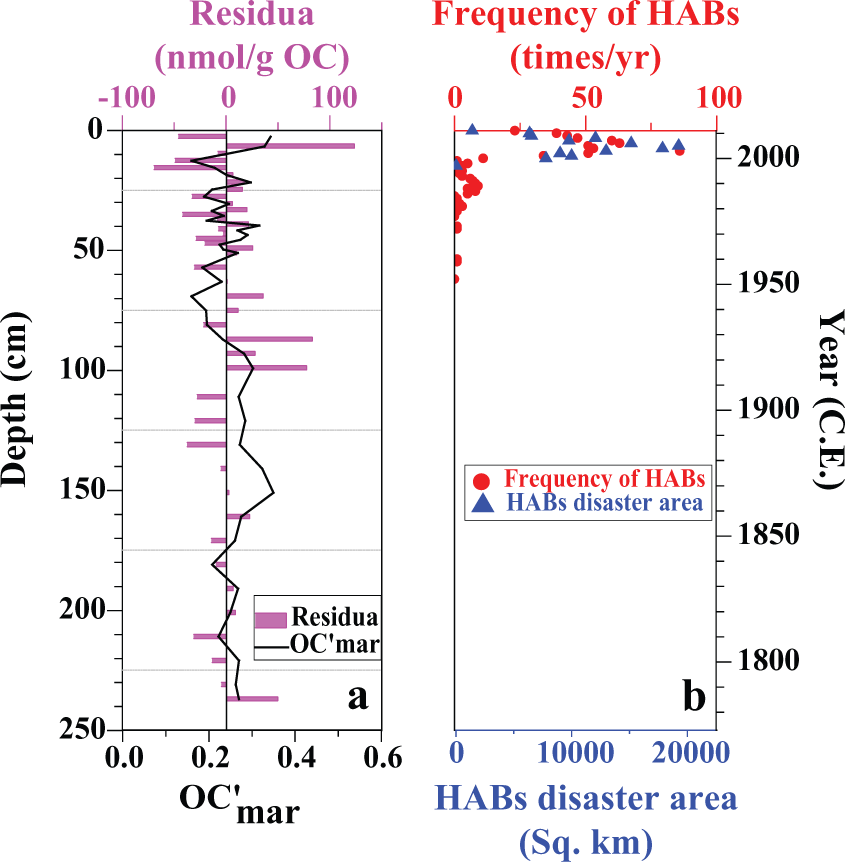
Variations of sum of residua of all chloropigments (pink bars),
Recent work has suggested that the Zhe-Min coastal area has become phosphate-limited for phytoplankton (Shi et al., 2013). It has been shown that most of the phosphates delivered by the Changjiang are quickly consumed by phytoplankton in the CDW plume (varying from >1 µmol L−1 in the river mouth to <0.2 µmol L−1 at the CDW plume front; Chen, 2008), which would obviously limit the effect of CDW on the phytoplankton growth in the Zhe-Min Coast. In contrast, the total annual dissolved phosphate flux from KSW and TWWC to the ECS (around 2.7 × 10¹⁰ moles) is almost two orders of magnitude higher than the total annual riverine input to the ECS (around 3.0 × 10⁸ moles) and ca. 30 times higher than the annual phosphate flux from ECS sediments to the water column (around 7.9 × 10⁸ moles; Zhang et al., 2007). A significant release of potentially bio-available particulate phosphorus from terrestrial particles to the water column with increasing salinity is another possible important source for the dissolved phosphate in the Changjiang Estuary and adjacent ECS inner shelf. However, its maximum annual particulate phosphorous flux (around 6.3 × 10⁷ moles, roughly calculated from He et al. (2009)) is considerably lower than from the KSW and TWWC, and thus not likely as important. Therefore, the intrusions of phosphate-rich KSW and TWWC appear to have dominated the evolution of phytoplankton biomass in the Zhe-Min Coast, in contrast to inputs from the Changjiang and/or local biogeochemical processes.
Given that regional climate variability is closely linked with the KSW and TWWC, we here postulate that they are also significantly linked with phytoplankton biomass on the Zhe-Min Coast. For example, during the positive phase of PDO and warm ENSO events (e.g. 1940 and 2005), the chloropigment residua showed a positive value, indicating a higher phytoplankton biomass compared with normal years (Figure 6). In contrast, during the negative phase of PDO and cold ENSO events (around 2000, 1956, and 1894), the residua showed a relatively negative value, indicative of lower phytoplankton biomass (Figure 6). During the positive phase of PDO, a southerly anomalous wind off the Philippines is formed, which leads to a northward shift of the North Equatorial Current bifurcation latitude compared with a normal year (Chang and Oey, 2012; Wu, 2013; Figure 7b). Also, more abundant westward-propagating mesoscale eddies frequently approach east of Taiwan and strike the Kuroshio off east Taiwan in 20°–23° N region, which result in greater Kuroshio transport off northeast Taiwan into ECS (Chang and Oey, 2012; Hwang et al., 2004; Wu, 2013; Figure 7b). The occurrence and/or strengthening of a warm ENSO event in the low latitude equatorial area would also cause anomalous westerly winds in the equatorial area (5° S–10° N), strengthen the North Equatorial Current, and enhance the net northward transport of Kuroshio Warm Current (KWC) across 18° N (Kashino et al., 2009; Kim et al., 2004; Yang et al., 2014; Figure 7c). Although the occurrence of ENSO events would cause a shift of North Equatorial Current bifurcation latitude (Kim et al., 2004), its influence is limited and governed by PDO to some degree (Wu, 2013). Furthermore, monsoonal winds in the Changjiang watershed would also be influenced by the PDO and ENSO, which would result in variations in the precipitation and Changjiang water discharge. For example, larger amounts of precipitation and higher Changjiang runoff usually occur during the positive phase of PDO and/or warm ENSO events (Jiang et al., 2006; Xue and Liu, 2008; Wang et al., 2005; Wu, 2013). Higher Changjiang runoff would result in enhanced offshore and alongshore transport of low-density CDW, and lead to an intensified shoreward transport and upwelling of KSW in the Zhe-Min Coast due to the buoyancy effect (Chen, 2008; Wei et al., 2014). Interestingly, chloropigment residua do appear to follow these negative phase of PDO and cold ENSO events (Figure 6), indicating past linkages with phytoplankton biomass.

Historical variations of sum of residua of all chloropigments, PDO index, and ENSO index. The PDO index data were collected from Shen et al. (2006) and Wu (2013). Data about ENSO index were collected from Yin et al. (2009).

The schematic summaries of the regional oceanic responses to climate oscillations during (a) normal year, (b) positive phase of PDO, and (c) warm ENSO event (according to Chang and Oey, 2012; Kashino et al., 2009; Kim et al., 2004; Lukas et al., 1991; Wu, 2013; Yang et al., 2014). Arrows indicate the direction of the currents and winds. Orange circles represent eddies.
The statistical analysis between residua value and strength of climate phenomena during the same year or adjacent years (±5 year) showed that there were nearly no correlation between them (RPDO = 0.25, p = 0.11, n = 41; RENSO = 0.02, p = 0.91, n = 32). As previously discussed, many factors could result in this decoupling between residua value and strength of climate phenomena, such as the timeframe difference of our data and the climate data, sectioning precision, and possible errors of core chronology. Other factors such as nutrient inputs, sea surface temperature, and illumination intensity would affect the growth of phytoplankton, and the subsequent deposition and preservation of phytoplankton debris in the sediments would also affect the coupling between phytoplankton biomass in the water column and sedimentary phytoplankton pigment records. These complicated mechanisms and processes would probably enhance decoupling and weaken the correlation between climate phenomena (i.e. PDO and ENSO events) and the response of phytoplankton. The correlations between residua and PDO and/or ENSO events were weaker than between lignin content and strength of EAWM. This was probably due to a more direct physical forcing from the southward delivery of terrestrial materials by the southward flowing coastal current dominated by EAWM.
Previous studies have indicated that the Changjiang water discharge would increase during positive phase of PDO and warm ENSO events (Jiang et al., 2006; Wang et al., 2005; Wu, 2013; Xue and Liu, 2008), and that the CDW is critical in affecting the dynamics of surface waters of Changjiang estuarine area (e.g. low salinity and density and high DIN/DIP ratios; Chen et al., 2004; Shi et al., 2013). Under these circumstances, the influence of the KSW on the phytoplankton biomass in the Changjiang estuarine area may be limited, even during positive phase of PDO and warm ENSO events. Moreover, although increasing Changjiang water discharge would enhance the upwelling of KSW in the Zhe-Min Coast to a certain degree (Chen, 2008; Wei et al., 2014), its influence on the upwelling and phytoplankton growth in this region was probably limited and weaker than the effects of climate variability. Previous studies have also indicated that upwelling in the Zhe-Min coastal area was mainly caused by the orographic uplift and offshore wind (Chen et al., 2004; Shi et al., 2013).
Conclusion
Intensified human activities in the Changjiang drainage basin (e.g. land-use changes, deforestation, and dam construction) post-1970s have enhanced the channel erosion of deeper soils from the watershed to the coast and changed the character of terrestrial OC entering the ECS inner shelf. This has further reduced the lignin content and increased the diagenetic state of terrestrial OC. Additionally, flooding events in the Changjiang basin, hydrodynamic forcing, and regional climate variability (through monsoonal circulation) also significantly influenced the terrestrial OC signature that is delivered to the ECS inner shelf. The low Λ8 of OC in the Zhe-Min coastal sediments was in part due to the occurrence of the worst flooding events in the Changjiang watershed, which was different from inputs of terrestrial lignin (high Λ8) to Changjiang estuarine sediments. This difference was likely due to the selective transport of terrestrial lignin detrital materials by hydrodynamic sorting processes. The higher Λ8 in the Zhe-Min Coast was more correlated to the strengthening of EAWM, which enhanced the southward delivery of lignin-rich materials from Changjiang estuarine sediments.
The intrusion of phosphate-rich KSW and TWWC to the ECS inner shelf is largely controlled by the regional climate variability (i.e. PDO and ENSO), and also had significant effects on the evolution of phytoplankton biomass on the Zhe-Min Coast. The high phytoplankton biomass was likely linked with enhanced intrusion of KSW and TWWC into the ECS inner shelf during the positive phase of PDO and/or warm ENSO events. In contrast, low phytoplankton biomass was more linked to the negative phase of PDO and/or cold ENSO events, during which the intrusion of KSW and TWWC into the ECS inner shelf was relatively weak. The occurrence of HABs and/or increase of phytoplankton biomass in the Changjiang Estuary during past decades may be attributed to the increasing anthropogenic activities in the watershed, but changes in the occurrence of HABs in the Zhe-Min Coast were likely from the intrusion of phosphate-rich KSW that can be linked with regional climate variability.
Footnotes
Acknowledgements

Funding
This study was supported by the National Natural Science Foundation of China (41176063 and 41221004), and the 111 project (B13030).