



Abstract
Pre-industrial human impacts on the past environment are apparent in different proxy records at different times in different places. Recognizing environmentally transformative human impacts in palaeoenvironmental archives, as opposed to natural variability, is a key challenge in understanding the nature of the transition to the Earth’s current ‘Anthropocene’ condition. Here, we consider the palaeoenvironmental record for Iceland over the past 2.5 ka, both before and after the late ninth century human settlement (landnám). The Scandinavian colonization of the island was essentially abrupt, involving thousands of people over a short period. The colonization triggered extensive changes in Icelandic ecosystems and landscapes. A volcanic ash known as the Landnám tephra was deposited over most of Iceland immediately before the settlement began. The Landnám tephra layer thus provides a uniquely precise litho-chrono-stratigraphic marker of colonization. We utilize this marker horizon as an independent definition of the effective onset of the local palaeoanthropocene (which is conceptually related to, but distinct from, the global Anthropocene). This allows us to evaluate proxy records for human impact on the Icelandic environment and to assess how and when they show transformative impact. Based on this analysis, we consider the implications for understanding and defining the Anthropocene in those areas of the Earth where such a clear independent marker of the onset of significant human impacts is lacking.
Introduction
In this article, we evaluate the history of environmental change in Iceland over the past 2.5 ka in order to better comprehend how pre-industrial human impacts on the Earth system are translated into patterns in the proxy environmental record, and in particular to understand how readily a distinct regional ‘Anthropocene’ may be defined in proxy records.
Following the introduction of the term by Crutzen (2002), debates about the Anthropocene have largely focused on the search for an unambiguous and readily identifiable boundary level for the start date of ‘significant’ human impacts on the Earth system. While there is an emerging consensus that the beginning of the Anthropocene should be defined at some point since the invention of the steam engine – for example, during the rapid industrialization and start of the increase in atmospheric CO2 levels of the late 18th century (Zalasiewicz et al., 2011) or the start of the ‘great acceleration’ of the mid-20th century (Steffen et al., 2015; Zalasiewicz et al., 2010, in press) – there are also arguments for pushing the onset further back in time (Rick et al., 2013; Ruddiman, 2003; Ruddiman et al., 2015) or even for merging the Holocene with the Anthropocene (Smith and Zeder, 2013) in recognition of the fact that ecosystems were often extensively modified by pre-industrial societies (Braje and Erlandson, 2013; Rick et al., 2013). Others have concluded that the diachronous nature of human impact on the environment will make a single start date unworkable (Edgeworth et al., 2015; Gale and Hoare, 2012) and that the standard criteria used by geologists to define a new ‘golden spike’ are unlikely to be met by any of the proposed Anthropocene sections (Zalasiewicz et al., 2011), at least not with useful chronological resolution. Foley et al. (2013) attempted to resolve this argument by proposing that the ‘Anthropocene’ could be used strictly as a label for the period since AD 1780 and that the ‘palaeoanthropocene’ could be used to designate a more weakly defined, transitional period of substantial human impact, which would not necessarily be synchronous everywhere. While this term is clearly related to the concept of the Anthropocene, it is distinct. The emerging consensus for the start date of the Anthropocene is either the start of the industrial revolution or in the 20th century (Lewis and Maslin, 2015; Zalasiewicz et al., 2015). As the focus of this paper is on pre-industrial human impacts, we use the more appropriate term of palaeoanthropocene throughout.
The new concept of the palaeoanthropocene therefore places the emphasis on understanding the history of human–environment interactions on a region-by-region basis (Foley et al., 2013). With the possible exception of the early modification of global atmospheric chemistry by rice farming and deforestation (Ruddiman, 2003), the timing of the onset of ‘substantial’ human impact necessarily varies from place to place, following the dispersal of humans and their technologies around the globe. Furthermore, the onset is often temporally diffuse, in the sense that the first settlers often have a very minor impact, but the human impact both intensifies and becomes more spatially extensive over time as populations grow and new technologies are adopted. There is therefore a special value in case studies where the onset of human impact in a region is comparatively abrupt, far-reaching in its environmental consequences, and well-bounded in space and time. Islands are particularly useful as bounded ‘natural laboratories’ (Edwards, 2005; Edwards and Bird, 2007; Rick et al., 2013). Among islands, Iceland has two significant advantages for this line of research: (1) human settlement came relatively late, which means that the palaeoenvironmental archive remains extensive and little-altered and is supplemented by a great deal of historical documentation and (2) human arrival can be clearly and unambiguously dated by the widespread occurrence of a volcanic ash (tephra) layer, the ‘Landnám’ (Old Norse: land-taking) tephra, which was fortuitously deposited across almost the whole island just before the arrival of the first major wave of Scandinavian settlers in the late ninth century (Vésteinsson et al., 2006).
Environmental changes in Iceland resulting from human settlement are widely acknowledged to have been extensive in the sense that they eventually affected almost the whole island to a substantial degree (Arnalds et al., 2001; Dugmore et al., 2000; Edwards et al., 2011; Erlendsson et al., 2009; Lawson et al., 2007), but they are also spatially complex in that the pattern of change through time varies from site to site (Dugmore et al., 2005; Edwards et al., in press; Streeter and Dugmore, 2014).
Our principal aim in this article is to assess the way in which the onset of the local palaeoanthropocene is represented in palaeoenvironmental archives. We assume that the Landnám tephra layer is an unambiguous chrono-litho-stratigraphic marker for the onset of human impact, at least within a decade or so. We compile proxy records of two key environmental parameters, soil erosion and forest cover change, and perform a quantitative analysis in order to assess how the local onset of the palaeoanthropocene would be interpreted in the absence of independent information (written records, extensive archaeological data and the Landnám tephra layer) about its timing, spatial extent and other properties. This provides a new insight into the degree to which the nature and timing of pre-industrial human impacts are likely to be visible in palaeoecological records more generally. The second aim is to investigate how initially small-scale changes coalesced to alter the environment substantially across an entire island.
Methods and rationale
The settlement of Iceland was a rapid event, probably involving 24,000 incomers settling much of the vegetated area (which forms a fringe around a central sub-arctic desert) within 20 years (Edwards, 2012; Vésteinsson and McGovern, 2012). They brought with them a complete ‘terraforming package’ of domesticated animals and plants, iron tools and other technologies and established practices for exploiting environmental resources that had been developed mainly in Scandinavia. It appears therefore that substantial human impacts on the environment would have begun within a few decades of the deposition of the Landnám tephra layer, though not necessarily everywhere in Iceland.
In order to determine the nature of changes associated with the arrival of people, we analyse two environmental indicators which have been used to reconstruct past environmental changes attributed primarily to human impact. These indicators are (1) rates of sediment accumulation in aeolian soils, which is interpreted as a proxy for soil erosion in the surrounding area (Dugmore and Buckland, 1991; Gísladóttir et al., 2010; Streeter and Dugmore, 2014; Thórarinsson, 1961) and (2) the percentage of Betula (birch) pollen in peat and lake (and marine) sediments, which can be interpreted as a proxy for woodland cover (Lawson et al., 2007). These proxies capture two important trends of environmental change in Iceland over the past 1200 years: increasing rates of soil erosion (Arnalds et al., 2001) and declining woodland cover (Hallsdóttir, 1996).
Tephrochronology at its best can provide distinct chrono-litho-stratigraphic marker horizons that precisely connect environmental archives of terrestrial, lacustrine, marine and cryospheric environments (Lowe, 2011). Tephrochronology was developed in Iceland by Thórarinsson (1944) and has been widely applied in subsequent palaeoecological research. One of the tephras we identified, the Landnám tephra layer, provides a useful marker for the regional onset of human modification of the environment (the landnám period; Vésteinsson and McGovern, 2012). The Landnám tephra has been identified in the Greenland Ice cores, allowing it to be dated precisely by annual layer counting to AD 871 ± 2 (Grönvold et al., 1995) or AD 877 ± 4 ( Zielinski et al., 1997). The Landnám tephra can be readily distinguished from other tephra layers on the basis of the combined indicators of geochemistry and crystal content, and it is found in soils, peats and lake sediments across most of Iceland (Grönvold et al., 1995; Larsen, 1984; Larsen et al., 1999; Figure 1).
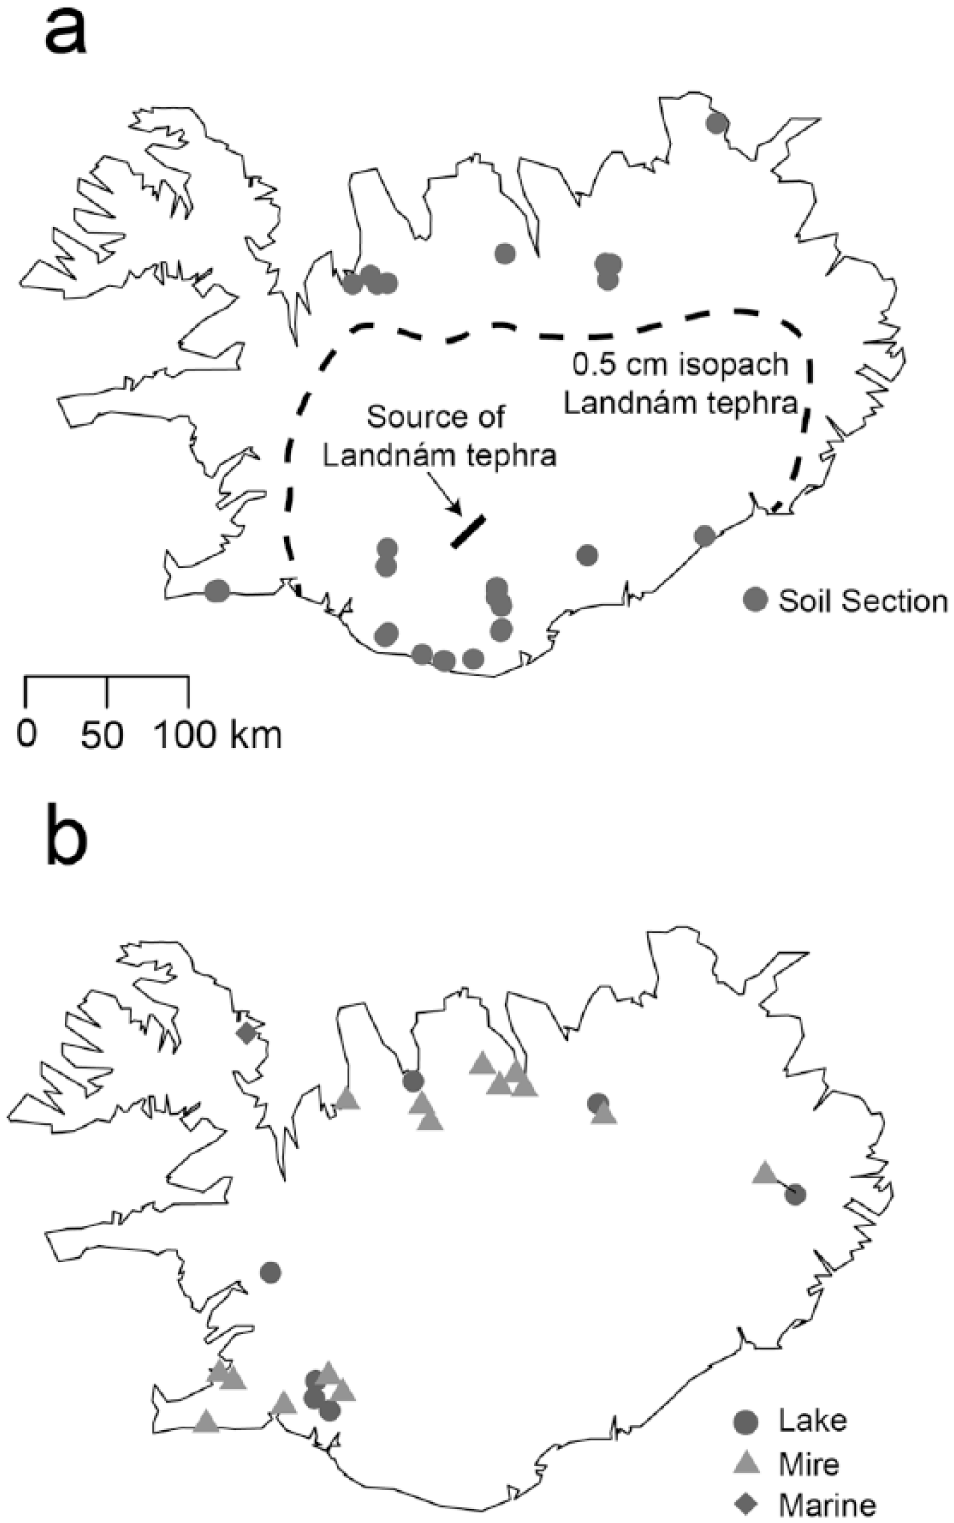
Locations of (a) SeAR and (b) pollen sites used in this study. The dashed line shows the 0.5-cm isopach of the basaltic component of the Landnám tephra layer (Larsen, 1984; Larsen and Gudmundsson, 2014).
All analyses were carried out in R 3.0.3 (R Core Team, 2013) and all dates are given in calendar years AD or BC.
Sediment accumulation rates
Changes in sediment accumulation rate (SeAR) in terrestrial soil sections reflect both local and regional sediment supply and therefore inferred rates of local and regional erosion (Dugmore and Erskine, 1994; Thórarinsson, 1961). Changing rates of soil erosion have also been inferred from lacustrine and marine records and these generally show more limited change over the settlement period (Andrews et al., 2001; Larsen et al., 2012). However, these records probably under-represent variations in local sediment supply, which may be significant and capable of responding rapidly to human pressures. Local sources of sediment are important and because of the strong spatial patterning inherent in Icelandic soil erosion, it seems likely that significant, widely dispersed local soil erosion frequently occurs without a concurrent signal in aggregate off-site records, as are to be found in lacustrine or marine contexts.
Stratigraphic sections from published and unpublished sources were collated. In total, there are SeAR records from 36 locations in Iceland (Figure 1; Table 1). To best reflect local environmental changes in areas where people lived, we selected only terrestrial sections from sites at low altitude (<450 m; virtually all permanently occupied farms are below this altitude). SeARs were calculated by measuring accumulated sediment, excluding discrete tephra layers, between marker tephras of known age, and converting to a rate of accumulation in mm/yr (following e.g. Dugmore and Buckland, 1991). Where the SeARs had been published, these values were used; otherwise, they were calculated from accumulation totals measured from published section drawings. For three sites, the published SeARs were a mean value from multiple soil sections; this is indicated in Table 1. Most post-settlement (after c. AD 870) Icelandic tephras are dated from surviving written sources dating from the 12th century, although they do refer to earlier events. The earliest post-settlement tephras (including the Landnám tephra itself) are, strictly speaking, from a pre-literate period and so are dated using other techniques such as ice core layer counting. Pre-settlement (before c. AD 870) most tephras are dated by radiocarbon analysis of associated organic material. The tephra horizons used in this study are listed in Table 2. For unpublished sections recorded by the authors, tephra layers were identified on the basis of stratigraphy, morphology, grain size and selected geochemical analysis.
Records of sediment accumulation rate (SeAR) analysed in this paper.

Records are mean values from multiple sections.
Tephra layers used as chronostratigraphical tiepoints in this paper. The method by which the tephra layer was dated is indicated where known.
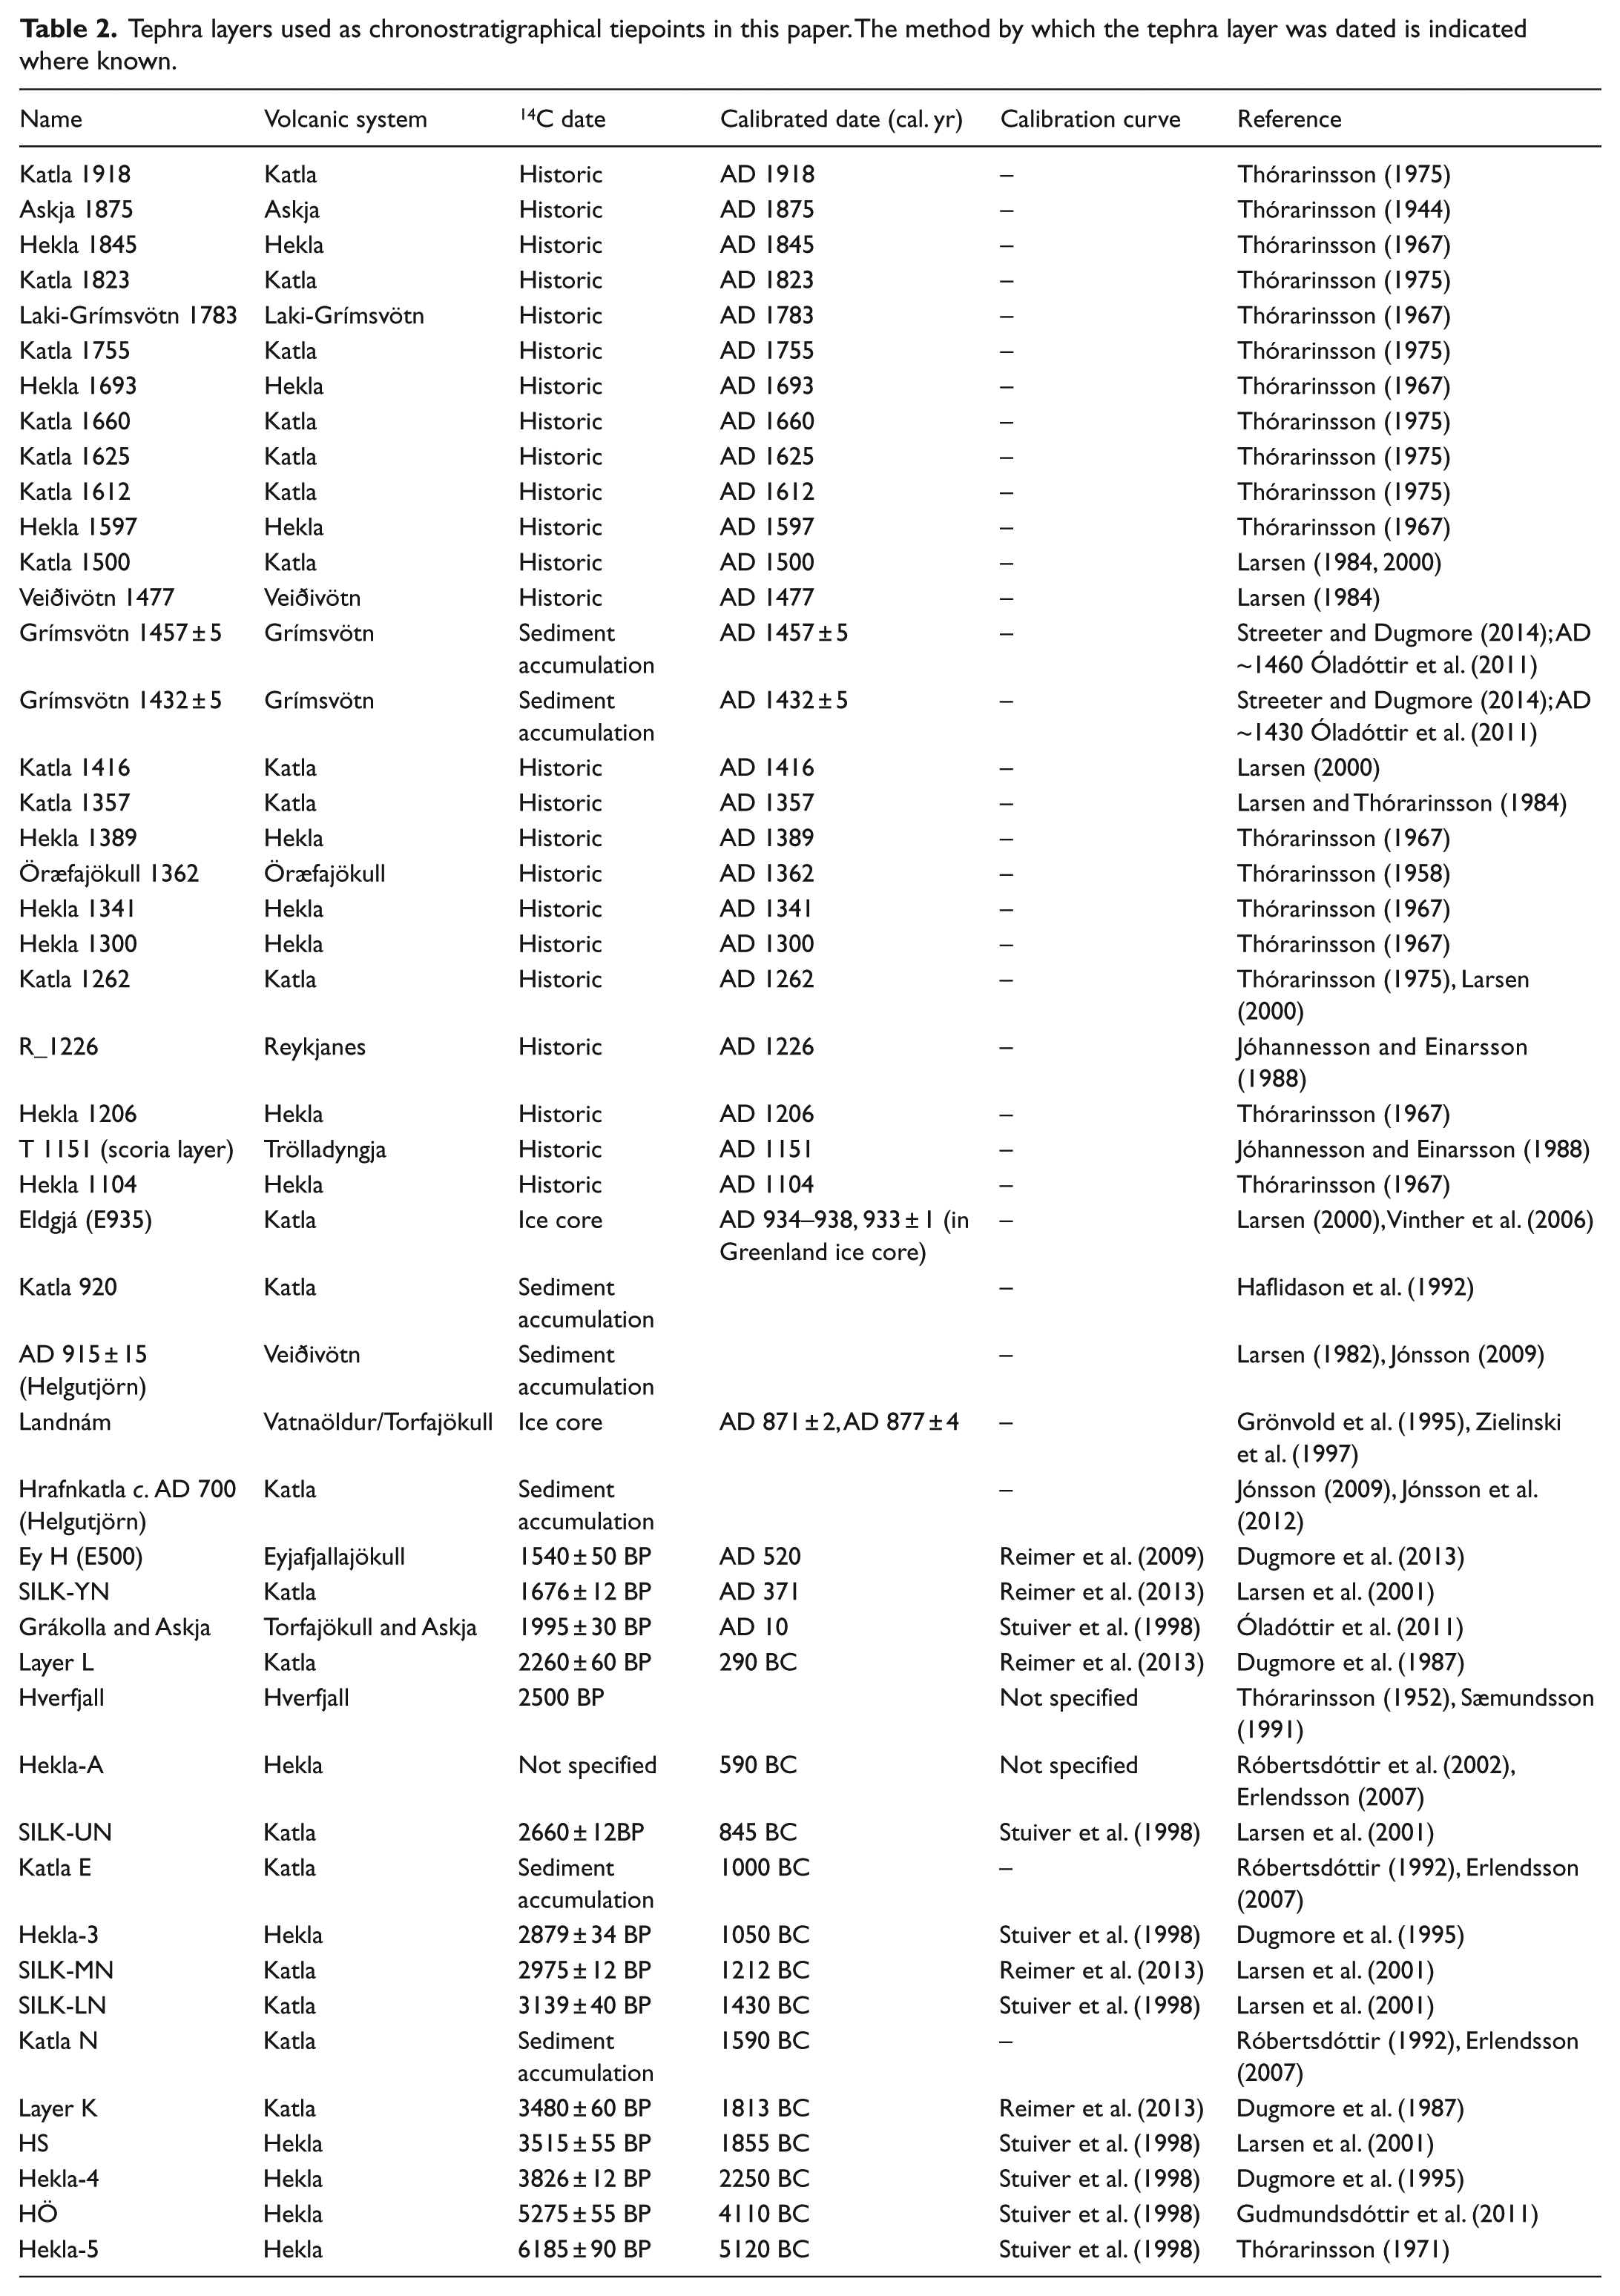
SeAR can tend to increase through time in sections in particular geomorphic settings such as the edge of soil erosion fronts (rofabards; Arnalds, 2000) and next to actively eroding slopes (Dugmore et al., 2009; Thórarinsson, 1961). In addition, the likely impact of mechanized farming practices from the early 20th century could be expected to increase the SeAR (Karlsson, 2000). For these reasons, in sections where there was a 20th century tephra (frequently Katla 1918), SeARs above this layer were excluded from the analysis. All of the sections used here extended downwards to at least one dated tephra layer prior to the Landnám tephra. Selected datasets used in this analysis are plotted in Figure 2 and all of the data points are plotted against time in Figure 4a.
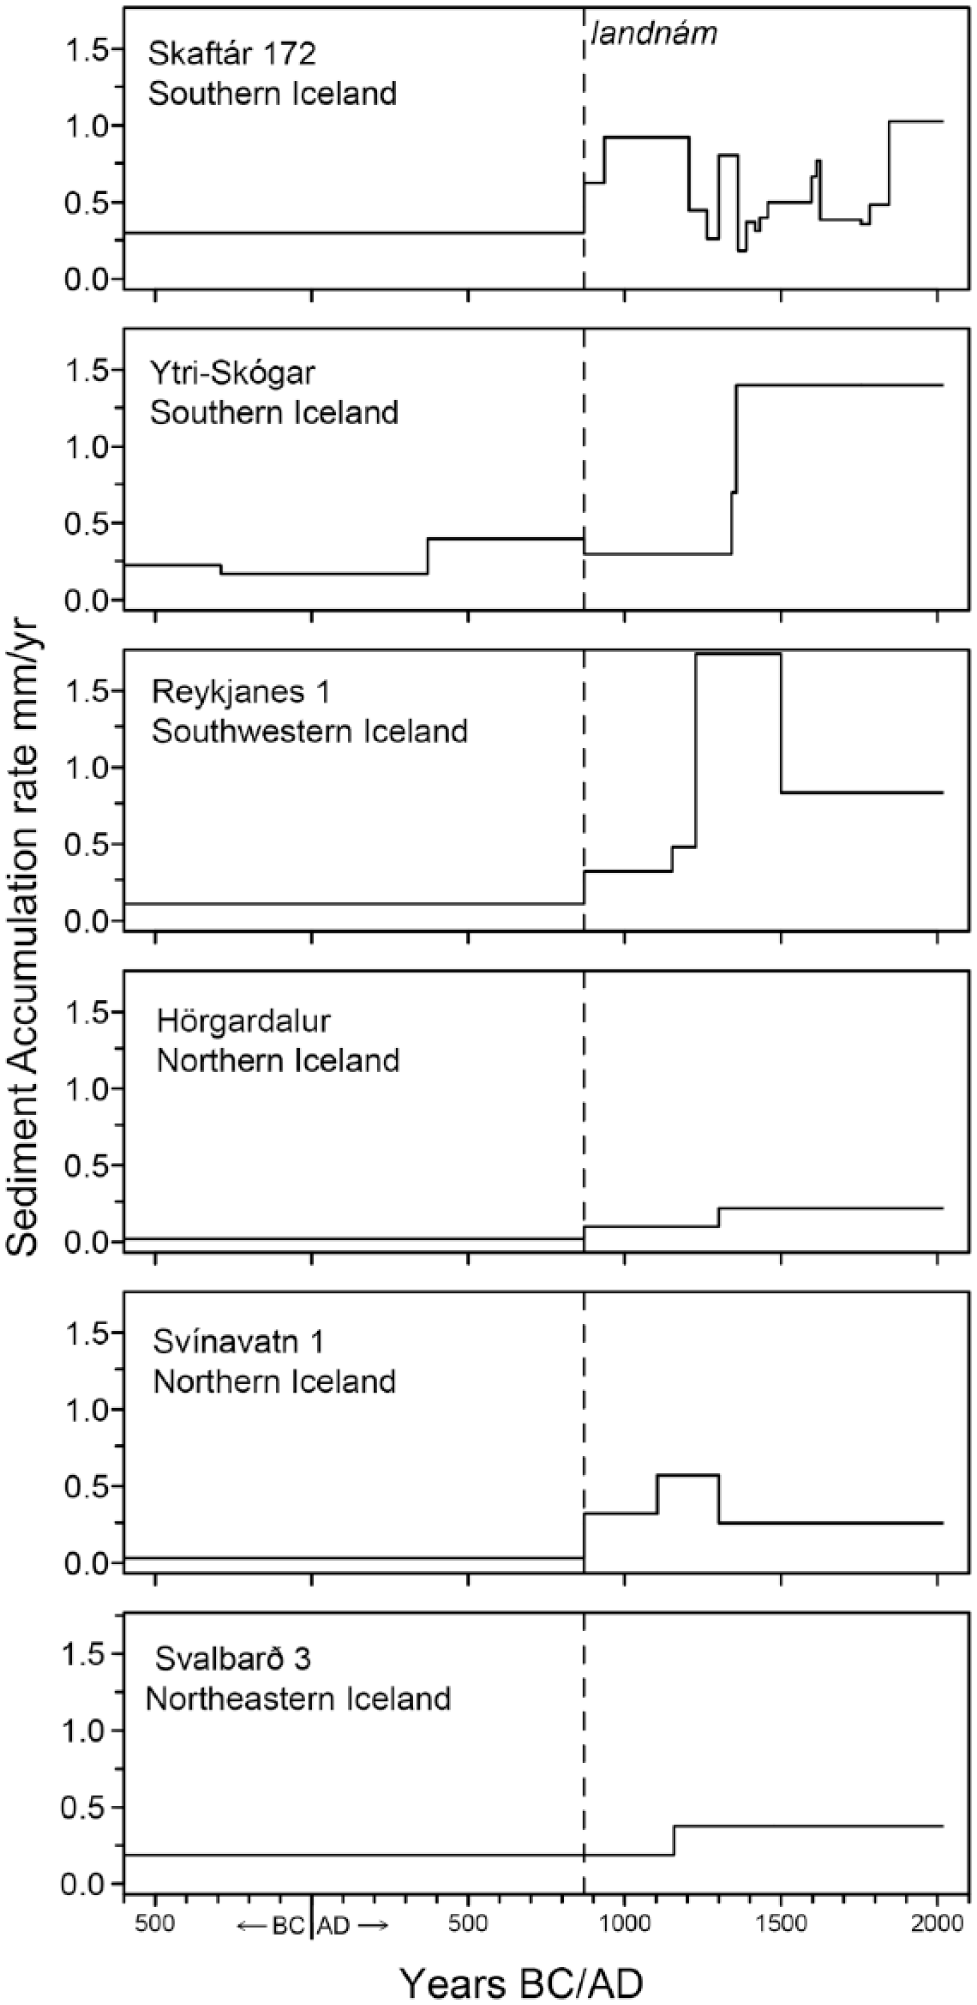
Examples of records of sediment accumulation rate (SeAR) as discussed in the text. For sources, see Table 1. Dashed line indicates landnám.
The SeAR values were rescaled so that they ranged from −1 to 1 in each section in order that trends from sections in different geomorphic and topographic situations could be compared and that the higher SeARs typical of southern Iceland did not obscure observed changes in northern Iceland.
The resulting irregular time series were converted to regular series by calculating the weighted average of SeARs within 100-year windows (Figure 4b and c).
Vegetation change
Whereas changes in forest cover in most parts of the world would involve many tree species; in Iceland, the only native forest-forming taxon is the downy birch, Betula pubescens. Rowan (Sorbus aucuparia) occurs as an accessory arboreal taxon, but being insect-pollinated, it is a rare component of pollen records. This means that the Betula pollen curve in pollen records can be (and has been) interpreted as a proxy for the changing abundance of woodland, albeit with caveats. One important issue is that another species of birch, the dwarf birch, Betula nana, also occurs in Iceland. The pollen of the two species (and their frequent hybrid intermediates: Karlsdóttir et al., 2012) can be separated on the basis of grain size, although such grain size distributions overlap slightly (e.g. Caseldine, 2001; Karlsdóttir et al., 2007; Mäkelä, 1996). Many older records do not routinely separate the two morphotypes, and hence, the Betula curve typically includes a proportion of B. nana. Subsequent work has shown that pollen attributable to B. nana is typically less abundant in Icelandic subfossil pollen spectra than pollen attributable to B. pubescens, so it is reasonable to assume, in most cases, that an undifferentiated curve for Betula pollen principally represents the woodland-forming species.
The second important issue is the taphonomic one of reworked pollen within the environment. This particularly applies to lake records, which can receive reworked pollen from old soils during periods of soil erosion. In some cases, it is possible tentatively to discriminate between ‘fresh’ and ‘reworked’ pollen, because the latter is often visibly damaged. Where this has been undertaken, the post-landnám birch curve has been shown sometimes (Gathorne-Hardy et al., 2009), but not always (Hallsdóttir, 1995; Lawson et al., 2007), to be increasingly dominated by reworked pollen.
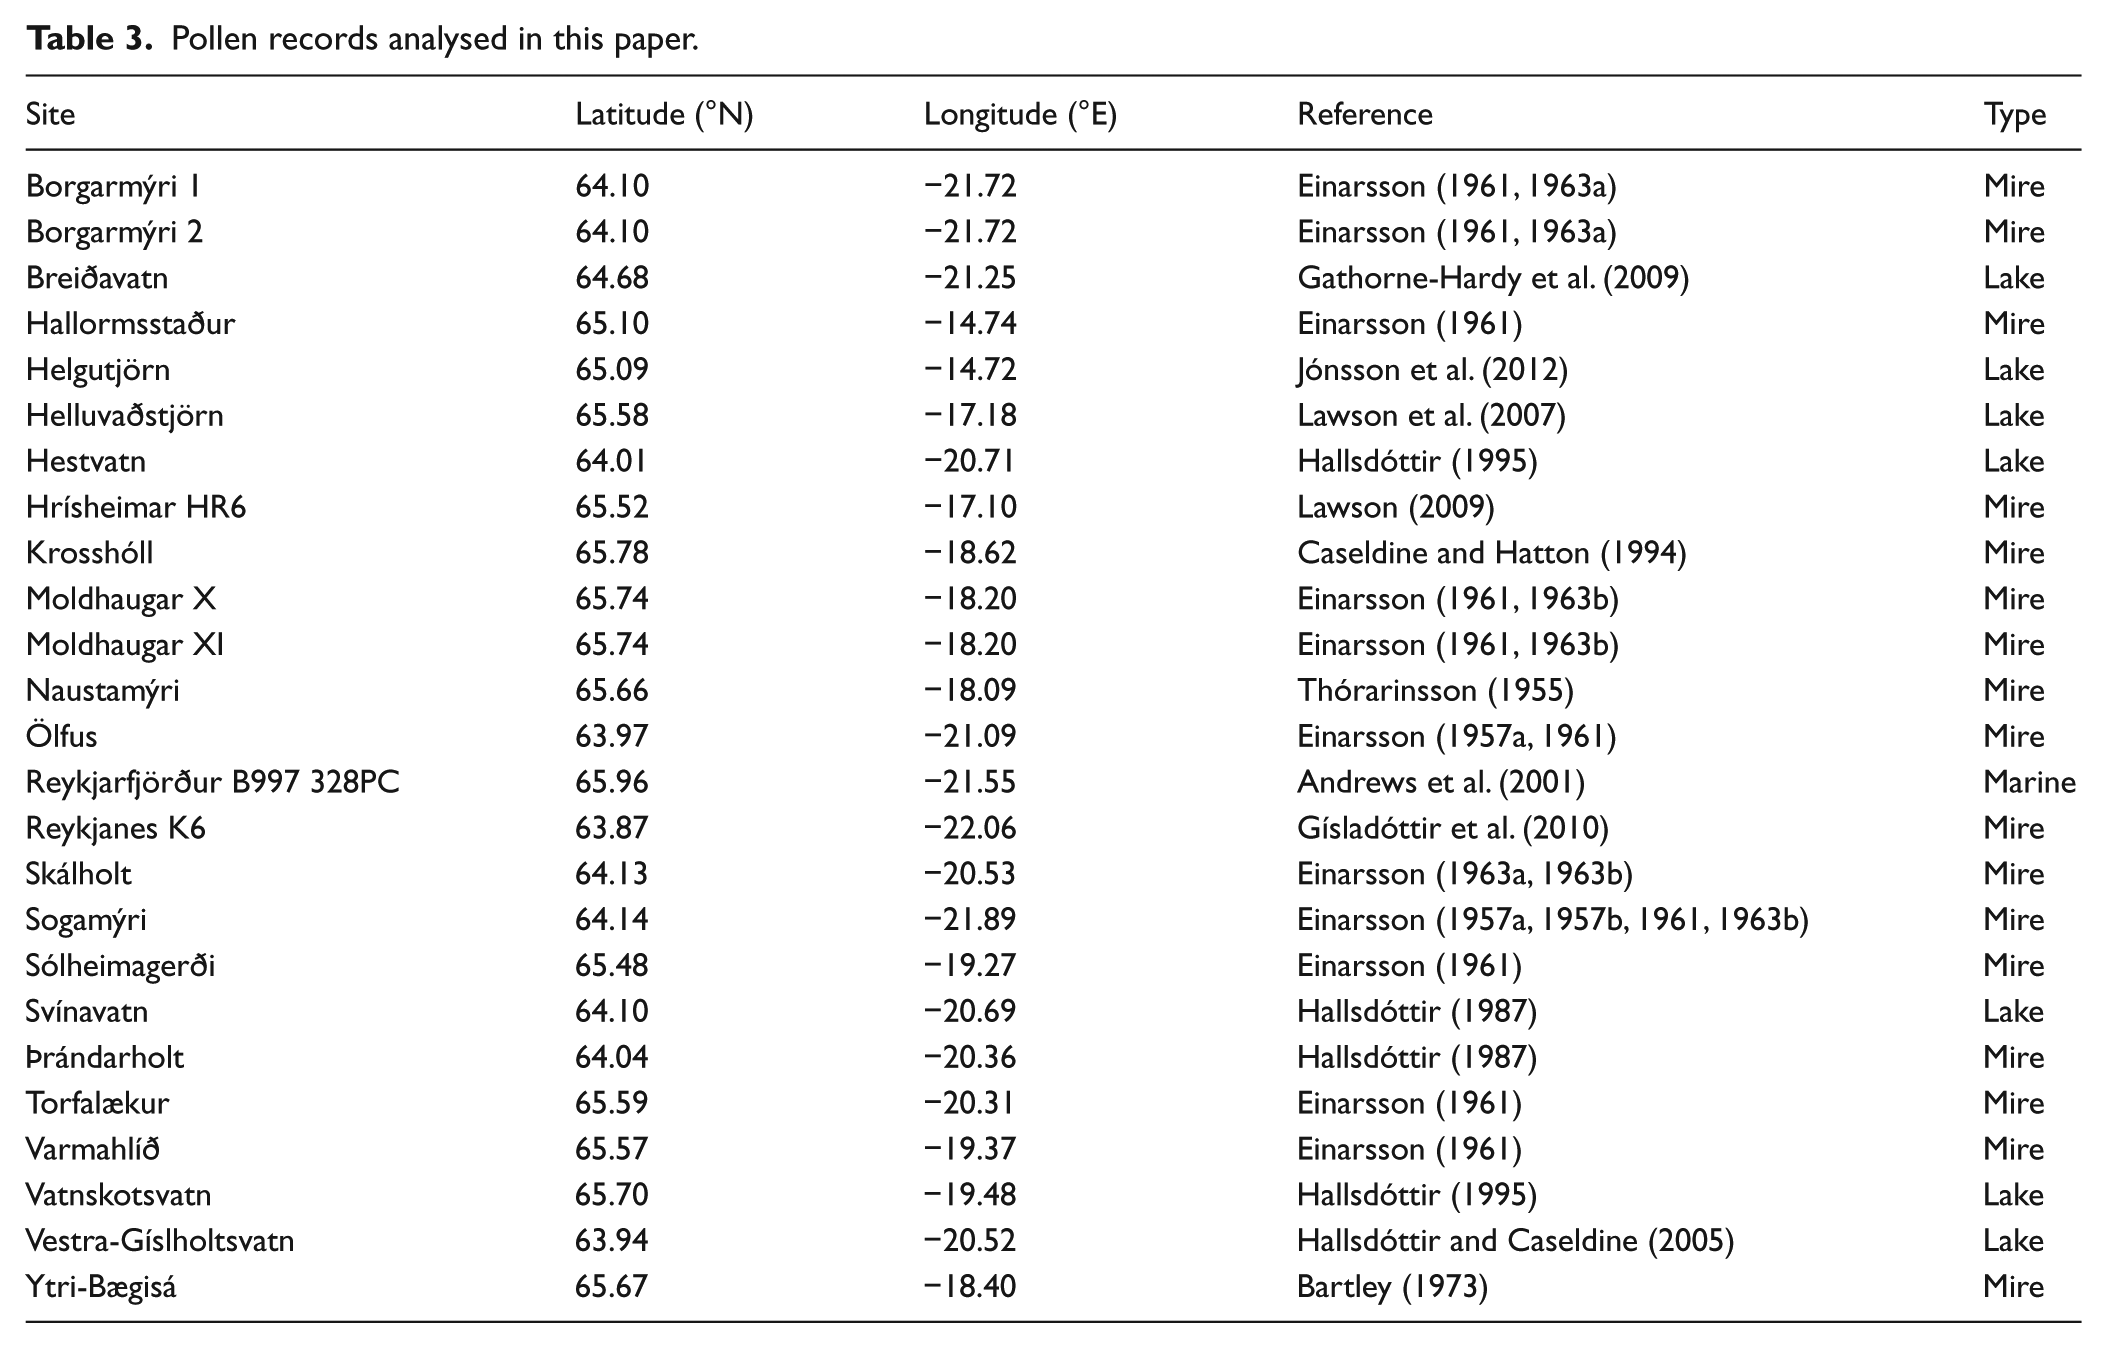
Time series of Betula pollen proportions in peat, lake sediment and (in one case) marine sediment sequences were compiled using data available through the European Pollen Database (EPD, 2014), datasets supplied by the original analysts or by digitizing published pollen diagrams. In total, 48 datasets were considered. Records from two offshore islands, Heimaey (Hallsdóttir, 1984) and Papey (Buckland et al., 1995; Edwards et al., 2004), were excluded because Betula pollen is never present in them in any abundance, meaning that they would not be capable of recording a deforestation event. A further 21 datasets were excluded because they did not extend sufficiently far (at least 500 years) before or after the Landnám tephra to yield a useful record of change across the inferred settlement period. A total of 25 datasets were consequently included in our analysis.
The datasets recorded Betula pollen abundance in many different ways and some recalculations were necessary in order to yield comparable records. In many cases, the original authors did not separate B. pubescens and B. nana. For this analysis, where Betula species were originally separated, they have been combined to give a comparable ‘Betula (undifferentiated)’ dataset. In the few cases where ‘fresh’ pollen grains were separated from ‘reworked’, the counts of ‘fresh’ grains were used in our analysis (Table 3).
Pollen records analysed in this paper.
In the original publications, the basis for calculation of Betula proportions varies from one site to another. The main source of variation is the inclusion at some sites of Cyperaceae in the sum. In mires, large variations in Cyperaceae pollen influx, probably related to small-scale fluctuations in the local abundance of Eriophorum and other species, can occur. In these cases, most authors argue that excluding Cyperaceae from the sum gives a better impression of temporal changes in tree birch populations in the landscape, although this might include tree (and dwarf) birch growing on the mire itself, as well as on the surrounding mineral soils. For this analysis, the Cyperaceae were excluded from the sum and Betula proportions recalculated if necessary, in order to allow a like-for-like comparison. As a consequence, the sum of grains on which the percentage calculations are based may now be below the conventional acceptable minimum of 300 in some cases (although the necessary information to make a judgment about this is rarely available in the literature). This would not affect the central estimate of birch percentage in a given sample, but may slightly increase the uncertainty in that estimate.
For some sequences, the original published age model has been used. For most older datasets, it was necessary to recalculate an age model owing to improvements in the dating of tephra layers and in the calibration of radiocarbon dates. Radiocarbon dates were recalibrated using the IntCal13 curve. Age models were generated using (for simplicity and consistency) linear interpolation between age control points using the clam package for R (Blaauw, 2010). In several cases, the surface of the mire or lake sediment was assigned a date corresponding approximately to the date when the site was sampled. In a few cases, basal dates were estimated by extrapolation where the base was not far below the lowermost age control point. Selected datasets used in this analysis are shown in Figure 3 and all of the data points are plotted against time in Figure 4d.
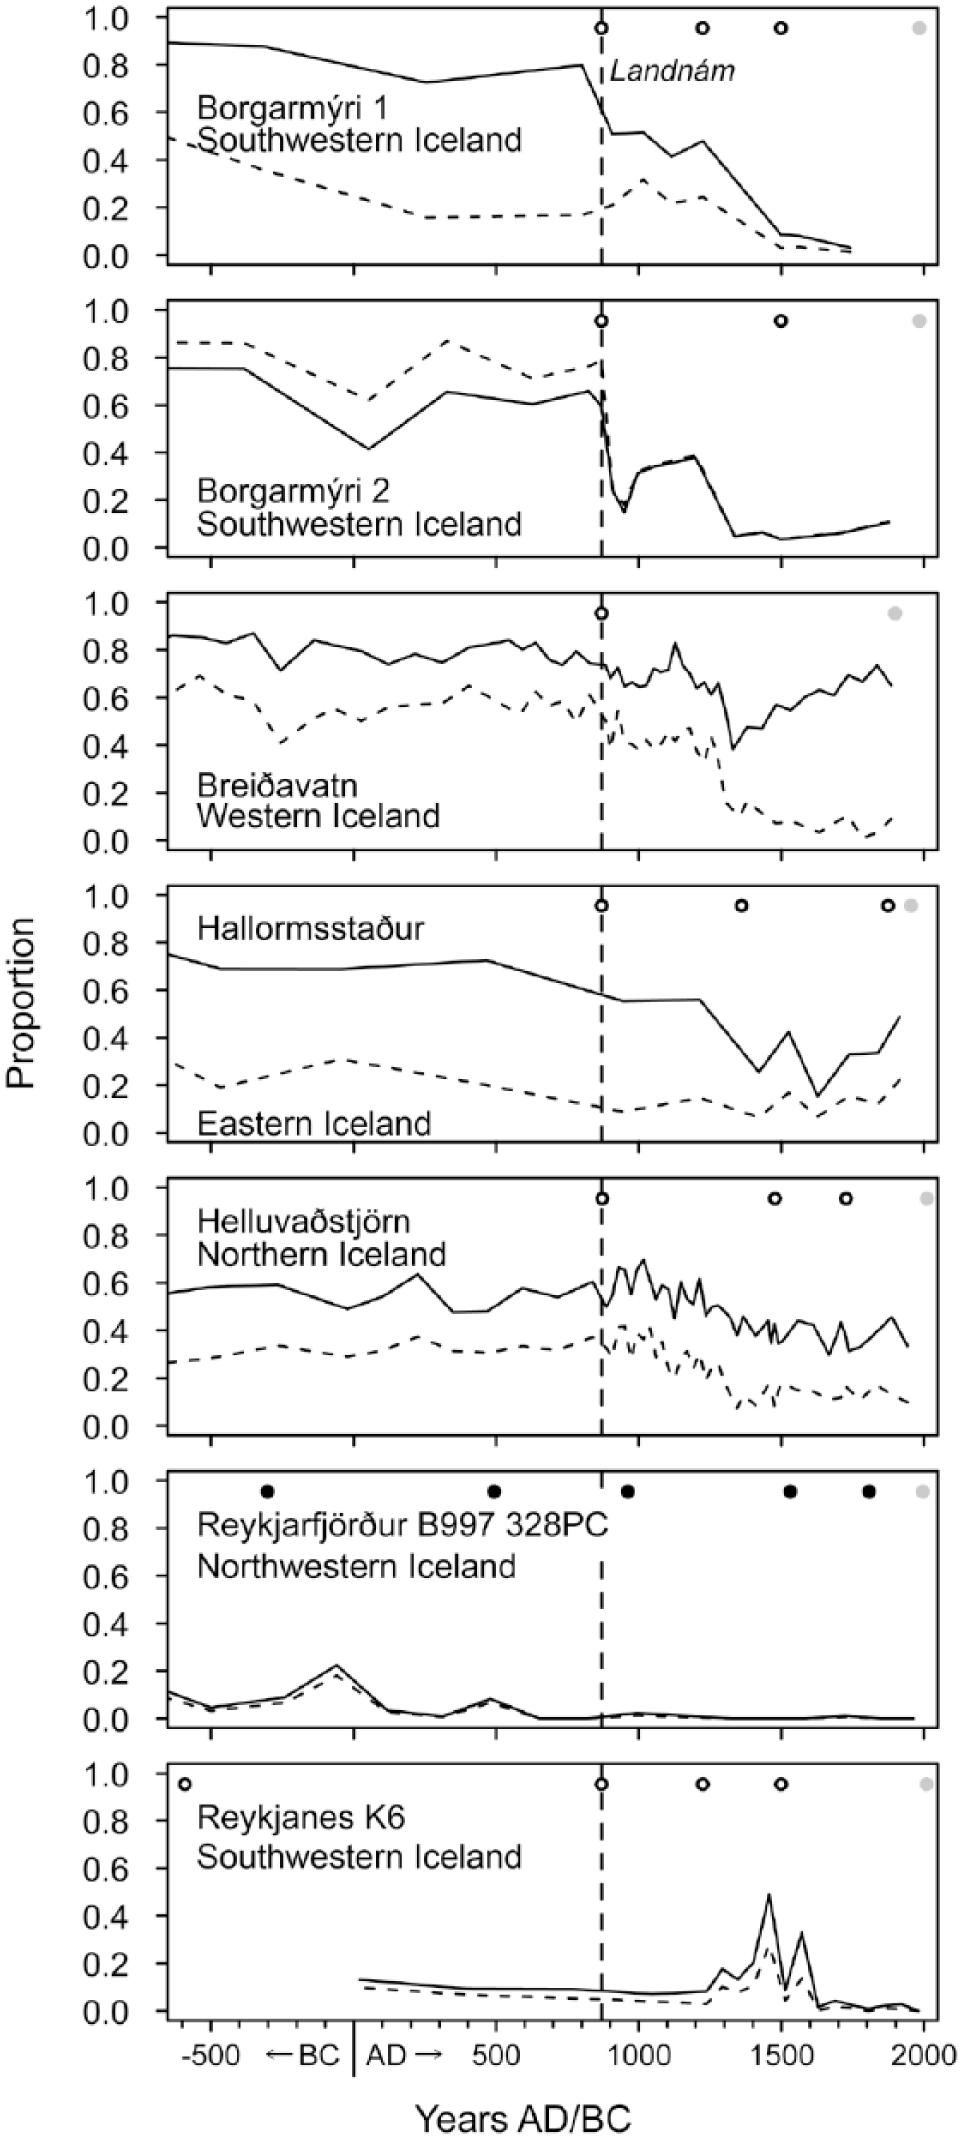
Examples of records of Betula pollen abundance as discussed in the text. For sources, see Table 2. Solid lines indicate the Betula proportions used in this analysis; where they vary, the Betula record shown in the original publications is indicated by a dashed line. Circles indicate age control points (grey circles: inferred modern surface; filled black circles: radiocarbon dates; unfilled black circles: tephra layers of known age). In all cases except Reykjanes K6, additional, older age control points lie beyond the limits of the diagram.
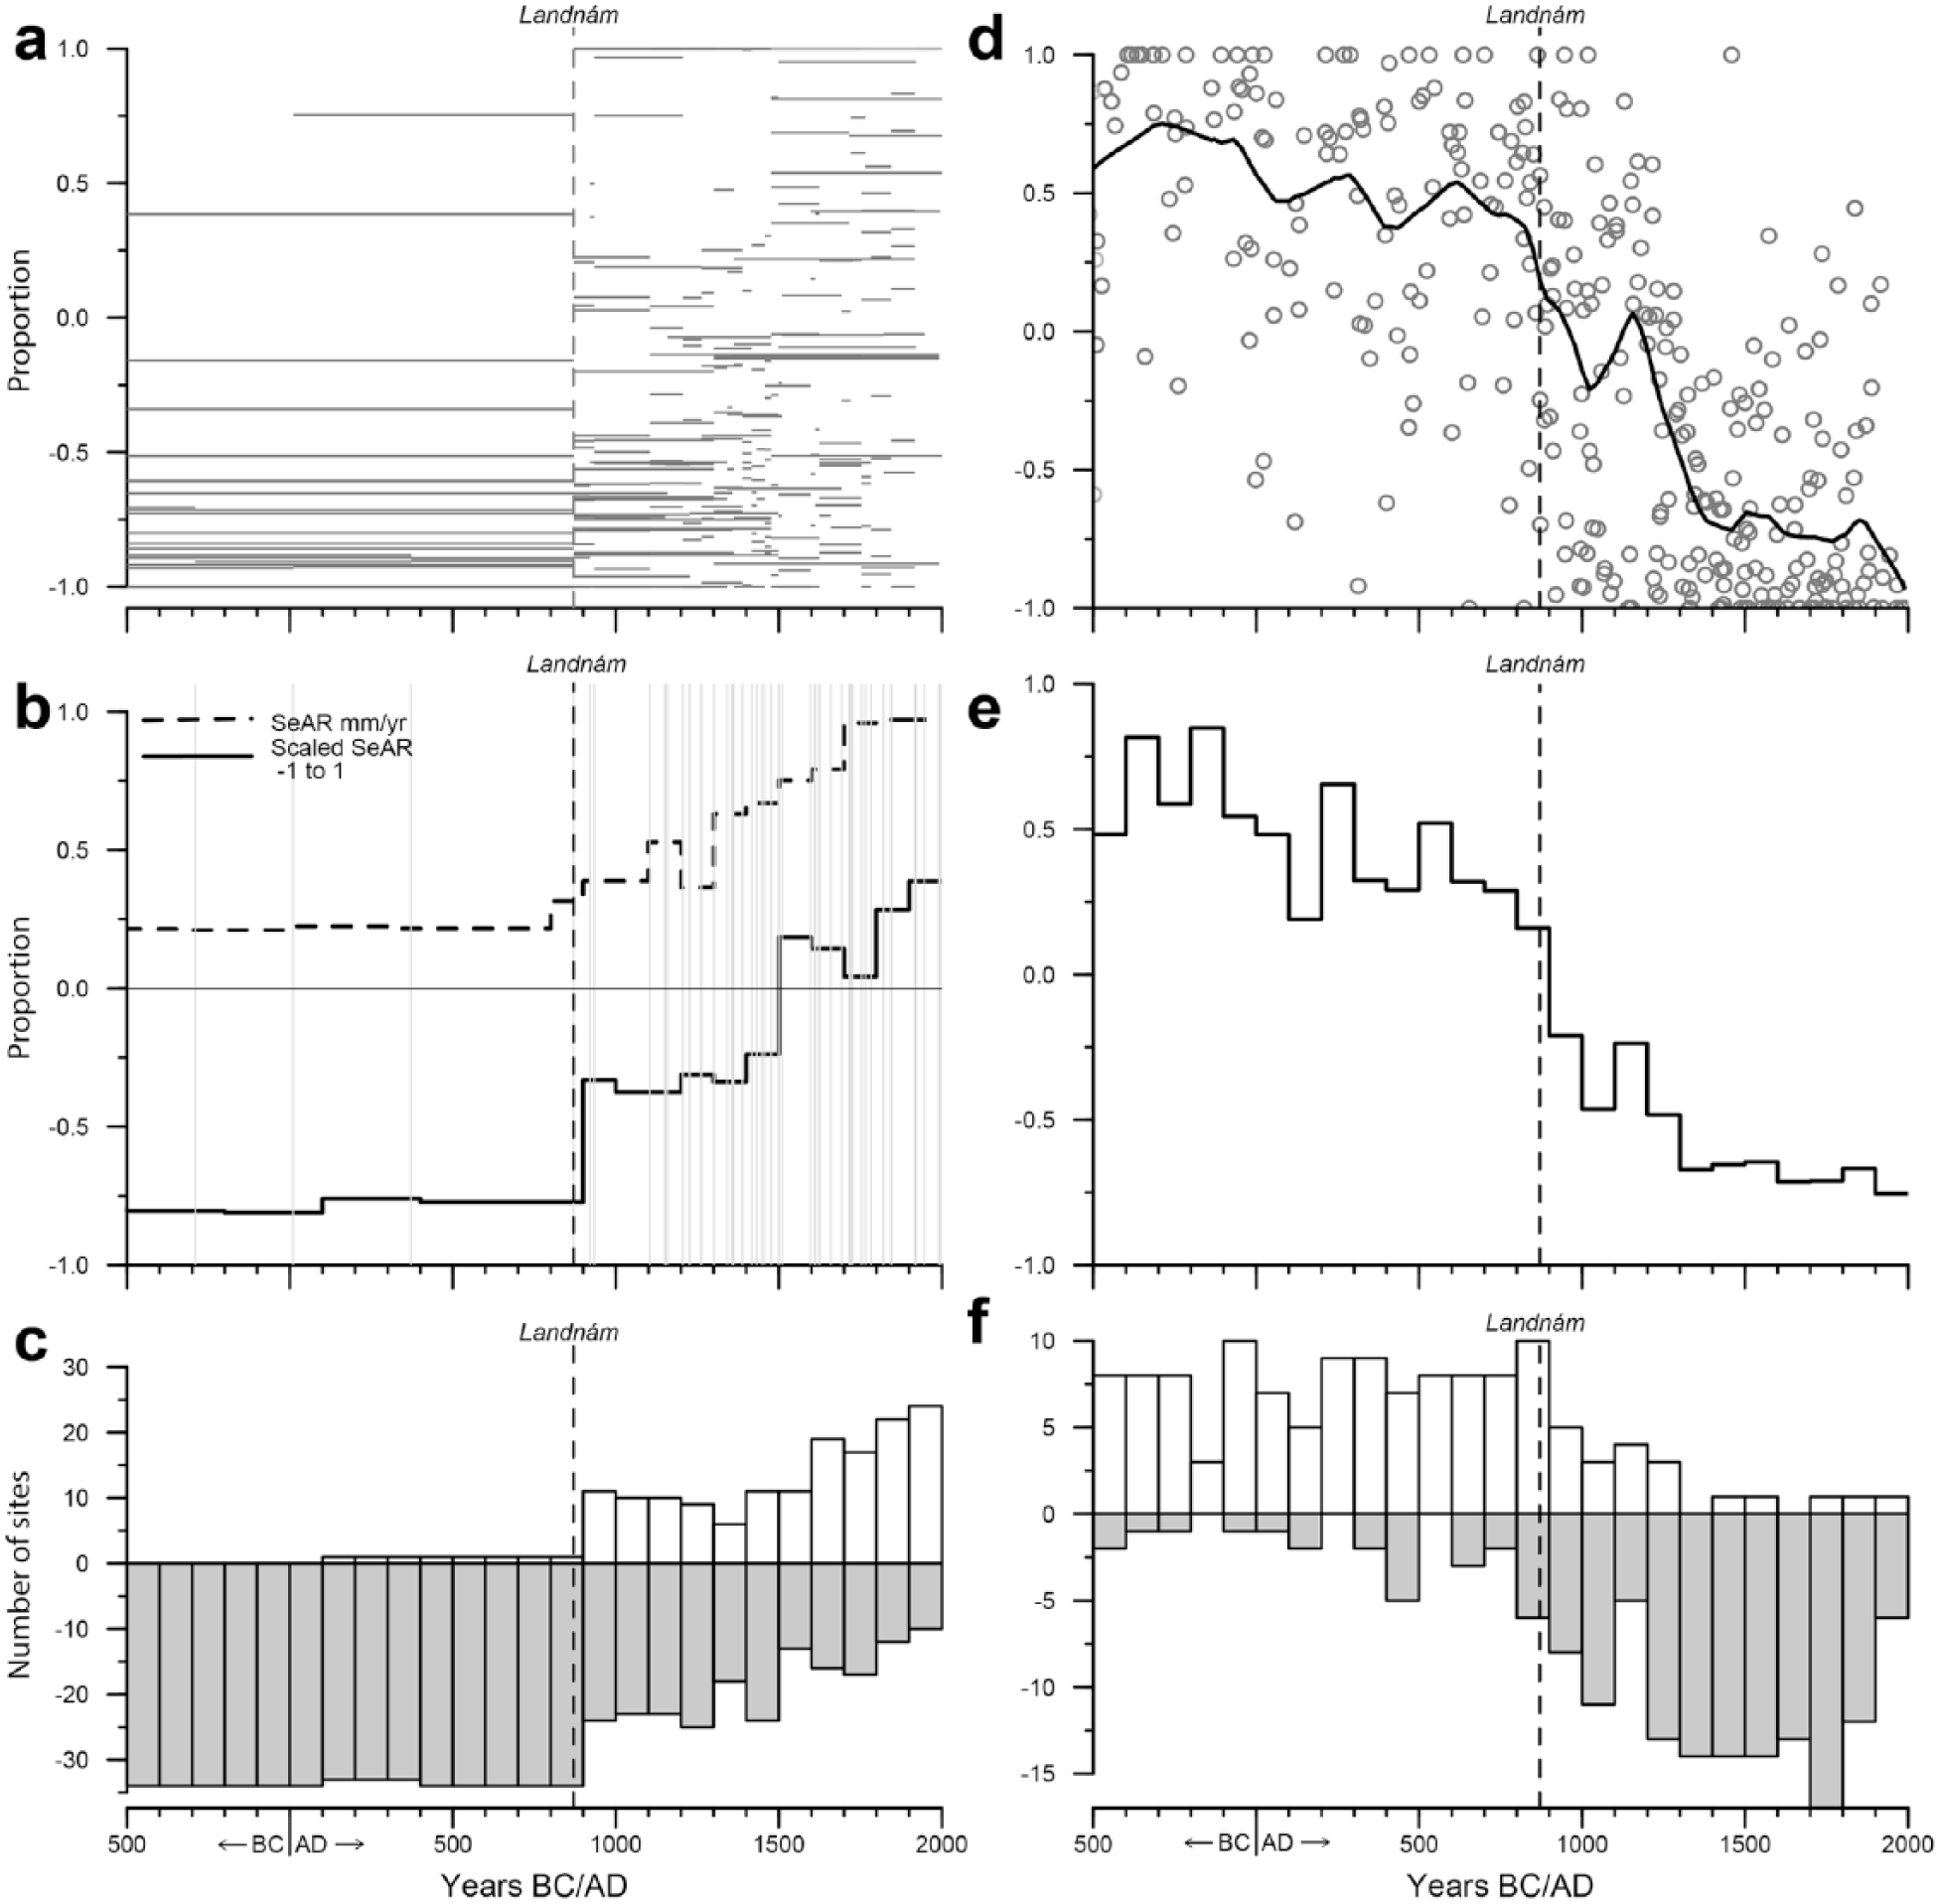
(a) SeAR scaled to range between −1 and 1, in order to account for between-site differences in susceptibility to soil accumulation. Each grey horizontal line represents the mean SeAR estimated between two age control points at a given site. The increase in data points post-landnám reflects a greater number of dated tephra layers. (b) Mean SeAR from 36 stratigraphic sections, averaged over 100-year windows. Grey vertical lines indicate the tephra layers used to calculate rates of accumulation. The dashed line shows absolute SeAR values and the solid line shows scaled SeAR. (c) Frequency histogram showing, for each 100-year window, the number of sites showing (for that site) above-average (white bars) or below-average (grey bars) scaled rates of sediment accumulation. (d) Betula proportions from 25 sites, calculated as described in the text. The solid line is a Lowess curve through the data. (e) Betula proportions scaled to range between −1 and 1, with the data from each site averaged in 100-year windows. (f) Frequency histograms showing, for each 100-year window, the number of sites showing (for that site) above-average (white bars) or below-average (grey bars) Betula pollen proportions.
To facilitate comparisons between sequences, the Betula undiff. time series were rescaled so that Betula proportions ranged from −1 to 1 in each case. This step was intended to compensate for the fact that some sites have a smaller range of Betula proportions than others, which presumably reflects ecological realities in many instances, but in other cases, it may be an artefact of the taphonomy of the site (e.g. lake records such as Breiðavatn, and the marine record from Reykjarfjörður, typically have lower maxima for Betula than are found in many peat records).
Some records are better resolved than others, meaning that they contribute more data points to Figure 4d (e.g. compare older datasets such as Borgarmýri 1 and 2 with more recent datasets such as Breiðavatn and Helluvaðstjörn in Figure 3). To compensate for this, the irregular time series were converted to regular time series by calculating the weighted average of the data points within contiguous 100-year-long windows. Figure 4e shows the mean of these scaled values against time. Figure 4f further summarizes the data by plotting, for each window, the proportion of records where the Betula proportion is above (white bars) or below (grey bars) its long-term mean at that site.
Results
Palaeoenvironmental records are unevenly distributed within Iceland (Figure 1). Sediment sections are concentrated in the south and north and are concentrated around volcanic zones. This pattern reflects the broad distribution of current deep soils and the more frequent occurrence of tephra layers, which are used to determine rates of sediment accumulation. These areas also tend to have experienced the highest levels of erosion due to the greater depth of sediment available to erode and the low cohesion of the andisols, which are the dominant soil type in these areas. Pollen records are concentrated in the north and the west of the country, with a large gap in the central highland desert and another in southeastern Iceland which partly reflects the scarcity of lakes and mires on the well-drained sandur plains of this region; the few sites that do exist here (e.g. Ketilstaðir: Erlendsson et al., 2009; Papey: Buckland et al., 1995; Edwards et al., 2004) failed to meet the criteria for inclusion in our analysis.
SeAR
Figure 2 illustrates the range of geomorphic change over the 2.5 ka using selected records. The sites at Skaftár 172, Ytri-Skógar and Reykjanes located in the south of Iceland show generally higher SeARs than the northern sites of Hörgárdalur, Svínavatn 1 and Svalbarð both before and after landnám. This pattern is representative of a general difference between sites in southern and northern Iceland. The period of highest SeAR in the six records shown in Figure 2 always occurs after c. AD 1200. Where there is no Landnám tephra present, as at Svalbarð, increases in SeAR appear to occur later than in other sections where there is better chronological control. Profiles where there is relatively limited change until several centuries after landnám, after which there is an order-of-magnitude increase in SeAR (Ytri-Skógar, Reykjanes 1), may represent the crossing of site-dependant local slope-stability thresholds.
Figure 4a is a plot of all of the SeAR data from the 35 sites against time. The chronological resolution of the data is markedly better after landnám than before. Site-to-site variability in SeAR (indicated by the scatter of grey horizontal lines) is quite substantial even prior to landnám, with a few sites showing high SeAR, but the individual trajectories of SeAR become much more variable after landnám (as illustrated by the examples in Figure 2).
The solid curve in Figure 4b shows the century-by-century variation in the mean SeAR. There is little variation in mean SeAR before landnám, but immediately after there is a rapid increase in SeAR which is sustained right through to the late 19th century. The sharp increase in SeAR during the 10th century AD and subsequent accelerations during the 16th and 19th centuries stand out above the overall rising trend.
Figure 4c shows the proportion of sites during each time window which are above or below average for that site. This confirms that before c. AD 900, almost every site shows low SeAR relative to its long-term mean. After AD 900, the proportion of sites showing above-average SeAR increases, and this proportion climbs more or less steadily towards the present day. However, even in the 20th century AD, 10 out of 32 sites show below-average SeAR. This reflects high site-to-site variation in the temporal pattern of SeAR, as illustrated in Figure 2.
Betula pollen
Figure 3 shows selected Betula pollen records. While most records show a decline in Betula pollen proportions after settlement, a small number of records behave differently. For example, Reykjanes shows low Betula proportions before settlement followed by higher proportions from c. AD 1300–1600. Another exception is the record from Breiðavatn, where Betula undiff. proportions decline after settlement but begin to increase again after AD 1400. In this case, this pattern is clearly an artefact of the reduced taxonomic precision of our analysis; in the original publication, Gathorne-Hardy et al. (2009) demonstrated that the increase is due to enhanced inputs of damaged grains, inferred to have been reworked from catchment soils. The dashed line in Figure 3 shows their published curve, which excluded damaged grains. A similar explanation may account for comparable trends at Borgarmýri, Hallormsstaður and two other records not shown in Figure 3 (Moldhaugar and Sólheimagerði), but in these cases, the analysts did not discriminate between pristine and damaged grains.
Figure 4d shows the Betula pollen values drawn from the 25 usable records, scaled from −1 to 1 within each record, with a Lowess curve (bandwidth = 250) indicating the general trend in the data. This curve over-represents sites that are well-resolved, that is, that contain a large number of samples. Figure 4e accounts for this bias by giving each site equal weight in calculating the mean century-by-century change in Betula pollen abundance. This curve shows a declining trend in birch pollen proportions beginning well before settlement. There is a small step-like decline between the 9th and 10th centuries AD, followed by a slight resurgence during the 12th century, then a further decline during the 13th century. Thereafter, Betula pollen proportions remain low on average. In comparison with the equivalent SeAR curve (Figure 4b), the decline in Betula proportions is more gradual in the centuries after settlement but slows down after the 13th century, whereas SeARs continue to rise.
There is very substantial noise throughout the dataset with many records indicating high (even maximal) proportions of Betula pollen within the last 500 years, but during that period, there is a comparatively large number of records showing minimal presence of Betula pollen, which reduces the overall average. Figure 4f illustrates this site-to-site variation. Before landnám, most records show above-site-average Betula proportions, although in most centuries, there are a small number of sites which disagree. During the 8th–12th centuries AD, the balance shifts and by the 13th century, almost all sites show below-average Betula proportions.
Figure 5 shows mean scaled SeARs for each century plotted against mean scaled Betula proportions. Before the 9th century AD, SeARs are low and change little, but there is an overall downward trend in Betula proportions. Between AD 800 and 1000, there is a rapid transition to higher SeARs and lower Betula proportions. Increases in SeAR precede large declines in Betula by approximately 100 years. Betula gradually declines until AD 1400, accompanied by a small increase in SeAR. From the 15th century onwards, SeAR increases substantially, but there is little further reduction in Betula proportions. There is a clear separation between the two main areas occupied on Figure 5 (indicated by dashed ovals), an earlier, pre-landnám period of high Betula proportions and low SeARs, and a later, post-landnám period of lower Betula proportions and high SeARs.

Discussion
Our analysis allows us to address four main questions, which provide the structure for our discussion:
Is the degree of environmental change at colonization sufficient to define the start of the palaeoanthropocene in Iceland?
What processes are capable of creating legacies in environmental records?
How will these changes be preserved in the long-term geological record?
How comparable is Iceland to other islands?
These questions allow us to address wider debates about the best spatial and temporal scales at which we should seek evidence for anthropogenic impacts and the importance of defining ‘start dates’ (cf. Foley et al., 2013; Smith and Zeder, 2013).
Rapid increases in SeAR have been correlated with the arrival of humans in southern Iceland, although with local-scale chronological differentiation (Dugmore and Buckland, 1991; Dugmore et al., 2007, 2009; Streeter et al., 2012). In contrast, despite its colonization at the same time and the broadly similar pattern of settlement, this correlation is absent in northern Iceland, where large increases in soil erosion occur later, although this may reflect the poorer chronological control there due to fewer tephra layers (Brown et al., 2012; Ólafsdóttir and Gudmundsson, 2002). Rapid reductions in woodland cover over Iceland as a whole, from an estimated 27% immediately before landnám to today’s c. 1%, have typically been attributed to clearance for grazing by the first few generations of colonists (Hallsdóttir, 1996; Vickers et al., 2011), but some studies have shown that woodland cover in some areas away from settlement sites remained in place until at least AD 1300, four centuries after the advent of settlement (Church et al., 2007; Gathorne-Hardy et al., 2009; Lawson et al., 2007; Sigurmundsson et al., 2014).
Defining the start of the palaeoanthropocene in Iceland
Our analysis of two proxy indicators of environmental change in Iceland (Figure 4) shows that they do respond to the arrival of humans, but the pattern is noisy and complex. The SeAR record (Figure 4b) has a comparatively strong signal of landnám impacts with, on average a sharp increase in SeAR during the century following settlement, but there is significant variation from site to site and a sizeable minority of records show no change until several centuries after landnám (Figure 2). The Betula pollen data are still more equivocal. Betula proportions were steadily declining at the majority of sites over several centuries prior to settlement, but this was not true everywhere, and there were short-term fluctuations at some sites (e.g. the AD 600–800 increase in Betula proportions discussed by Erlendsson and Edwards, 2009, which they attributed to both increased pollen production and to increased density and areal extent of woodland in response to favourable climatic conditions). Although there is, on average and at many individual sites, a pronounced fall in Betula proportions in the century after landnám at many sites, falls of similar magnitude occur prior to landnám. There is also a great deal of site-to-site variation in the pattern of Betula proportions over time. Well-resolved lake records such as Helluvaðstjörn (Lawson et al., 2007), recruiting pollen from a large catchment with minimal reworking, are perhaps most representative of the overall trend, but in Iceland, pollen records at lake sites are outnumbered by those from mire sites (Figure 1) which, having more local taphonomic signatures, are perhaps more revealing of the true spatial heterogeneity of the process of woodland decline.
Based on the case of Iceland, we can suggest two reasons why it may be difficult to recognize the onset of the palaeoanthropocene in environmental records. First, spatial and temporal patterns of environmental change vary widely, even when humans arrive within a very short interval of time. This makes defining a precise start date for the onset of major human modification of environments over large areas difficult, perhaps even counter-productive, as it risks underestimating more localized impacts. Second, long-term underlying environmental trends may affect our ability to identify unequivocal human impacts. For example, the changes in Betula proportions before settlement may be related to a century-scale periods of climatic change (Erlendsson and Edwards, 2009; Geirsdóttir et al., 2013; Larsen et al., 2012) overlaid on long-term patterns including declining northern hemisphere summer insolation, and perhaps the progressive paludification of the landscape (Hallsdóttir and Caseldine, 2005).
The record from Iceland, which represents an unusually favourable place in which to study past human impacts, suggests it may be futile to try to define a start date for significant human impacts based on changes in individual environmental proxies. However, one potential way to separate natural and human signals is to look for differences in spatial patterns. For example, we would expect woodland decline as a result of climatic cooling to affect areas that are marginal for Betula growth. By contrast, woodland clearance around settlements would produce a pattern of greatest change around ecologically more favourable areas. On detailed inspection, this is bourne out in the palynological, archaeobotanical and historical data from at least some regions of Iceland (Church et al., 2007; Dixon, 1997; Hallsdóttir, 1987; Sigurmundsson et al., 2014), which do indeed suggest that deforestation was most rapid close to landnám-era farms, and that it proceeded more slowly in more remote districts.
Processes capable of recording the Anthropocene in palaeoenvironmental records
There are a variety of ways in which people can create alternative environmental states, typically for the purpose of ‘niche’ construction (Smith and Zeder, 2013). The processes may be broadly grouped into introductions, extirpations and changes in environmental patterns. The creation of these alternative environmental states, such as the one seen in Figure 5, could be considered an indicator of a local onset of the Palaeoanthropocene.
In Iceland, people introduced a suite of domestic animals including cattle, horses, sheep, goats, pigs and dogs, and their commensals and parasites such as the dung beetle Aphodius lapponum and sheep louse Damalinia ovis (Buckland and Panagiotakopulu, 2005; cf. Erlendsson et al., 2009). Some plants have been deliberately introduced, such as barley (Hordeum vulgare) in earliest times (which can only survive with active human intervention) and the Nootka lupin (Lupinus nootkatensis) in modern times (an invasive species capable of extensive dispersal without human assistance). Norse-age (after c. AD 870) anthropogenic introductions created a terrestrial mammal island fauna, something that had been absent (with the exception of the Arctic fox and occasional Polar Bear) probably since the Pliocene Epoch, c. 3.5–3 Ma, when there is fossil evidence for the presence of a small deer (Grímsson and Símonarson, 2008).
Due to the lack of endemic species, limited local extirpations as a result of human settlement have generally involved an alteration of range rather than the demise of a species. Thus, walrus (Odobenus rosmarus) once occupied some Icelandic beaches, but now its range has contracted across the Atlantic to the north and west. Perhaps the most infamous extirpation (and indeed worldwide extinction) took place in 1844, when the last known great auks (Pinguinus impennis) were killed on Eldey, a small offshore island (Crofford, 1989).
People can modify existing environmental patterns and create new habitats through, for example, forest clearance. This may be achieved with low levels of technology involving axe or fire (although there is little definitive evidence of woodland clearance by burning in the palaeoenvironmental record in Iceland). Animal husbandry may have provided a continuing mechanism for environmental change in Iceland through the introduction of domestic stock in general and pigs, sheep and goats in particular – cattle and horses were present, but they were less abundant (Lucas, 2009; McGovern et al., 2007; Zori et al., 2013). Once established, introduced species could drive long-term modifications of the quality and distribution of both surface vegetation patterns and they could influence slope and erosion processes. In Iceland, anthropogenic vegetation change combined with climatic deterioration has reduced woodland from c. 27% of the land area to c. 1% today. Grazing pressures have played a key role in soil erosion, the second great pattern of environmental change in Iceland since human colonization. Some 15–30% of Iceland’s pre-settlement soil and vegetation cover has been removed by enhanced surface erosion (Arnalds et al., 2001). In Iceland, soil erosion tends to proceed as a total loss of soil in discrete areas, rather than as a more diffuse loss of soil quality, and erosion is thus most usefully measured in hectares rather than as a loss of tonnes per hectare. In terms of area affected, it is probably equivalent to that of woodland removal, but it is a process that is more difficult to recognize in the environmental record because of the selective removal of potential ‘archives’ from the system.
Preserving records of change
The longevity (in geological terms) of archives recording the onset of the Anthropocene, or even regional Palaeoanthropocenes (Foley et al., 2013), has been much debated as a criterion for acceptance of one or more ‘golden spikes’. In Iceland, our record shows a change from an environment with high incidence of Betula pollen and low levels of aeolian sediment accumulation to low incidences of Betula pollen and high levels of aeolian sediment accumulation, with the main transition between these two states lasting about a century (Figure 5). During the Quaternary, superficial deposits across the whole of Iceland have been repeatedly eroded by ice sheets and, on the few nunataks, periglacial processes (Hubbard et al., 2006), suggesting that marine records will have the best chance of survival on geological timescales. However, marine records are likely to be insensitive to spatially dispersed human impact. The one marine pollen record considered here (Reykjarfjörður; Figure 3) comes from a fjord which was likely glaciated (Andrews et al., 2001). Perhaps surprisingly given its inshore location, it shows an atypical pattern of change, probably due to taphonomic issues. Likewise, marine records of sediment accumulation appear more sensitive to climatic changes than anthropogenic impacts (e.g. Jennings et al., 2001). Predicted temperature changes could result in the effective disappearance of all major Icelandic glaciers within two centuries (Björnsson and Pálsson, 2008). In that warmer world, terrestrial and lacustrine environmental records of the impacts of landnám could conceivably survive for centuries to millennia as part of the geological record. There would also be a reversion to pre-Quaternary Earth surface processes; an effective lack of new glacial landforms, glacial or glaciofluvial sediments, very limited formation of palagonite and a reversion to a geological record dominated by the accumulation of subaerial lava flows and reduced volcanic explosivity. These changes would perhaps leave a more enduring geological legacy than the more direct changes as a result of human impacts represented by the records discussed here. This suggests that if our main concern in defining the Palaeoanthropocene is to understand the nature of human change then a geological criterion for the preservation of records may be too rigorous.
Comparisons with other islands and continents
The final point of our discussion is to consider the extent to which our analysis of the visibility of the onset of the (Palaeo-)Anthropocene in Iceland is specific to this particular case, and how it compares with other islands, or indeed more widely to continental regions. In this context, the recognition of pre-existing vulnerabilities is vital. Particular human activities such as pastoralism, agriculture or industrialization may ultimately drive wholesale environmental change, but the pace at which these processes bring about alternative environmental states depends on the intrinsic properties of natural systems that condition their response to such drivers.
The small spatial scale of many islands, their lack of internal barriers and the exaggerated ecological release of anthropogenic introductions means that human impacts can rapidly affect the whole ecosystem and become a dominant process in Earth surface systems, such that a distinct Anthropocene may subsequently be recognizable in local palaeoenvironmental records (Rick et al., 2013). In Iceland, the capability of humans to modify the environment was delivered abruptly and as a fully formed package. The long-term ecological context of Iceland is important to understanding what happened next.
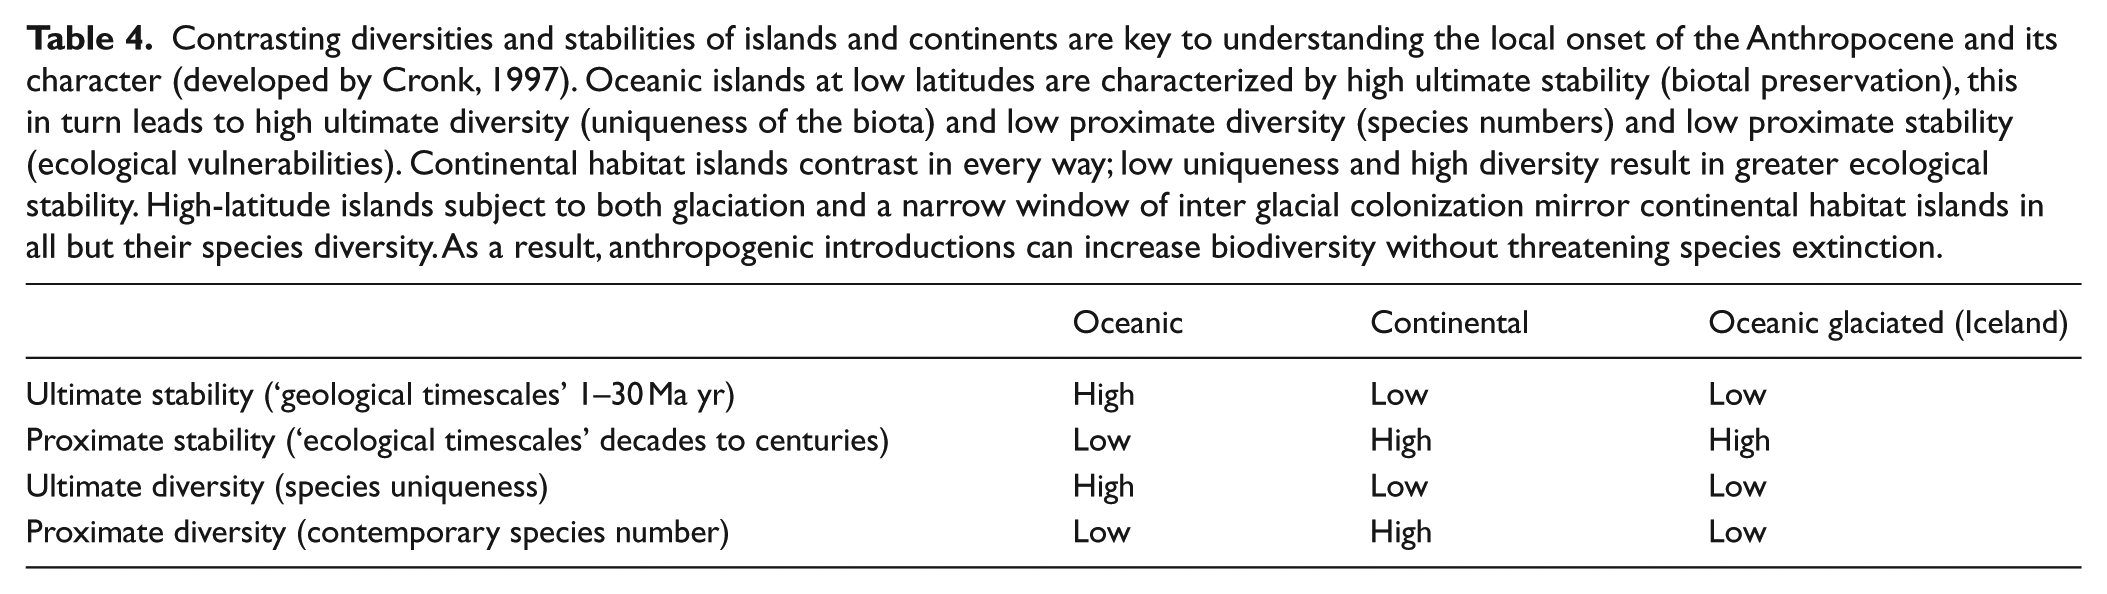
Islands are not simple microcosms of continental areas, for example, remote oceanic islands in low latitudes are characterized by their ecological isolation which has resulted in low immigration rates and species poverty. Very low chances of colonization mean that few species arrive on the islands, interspecies competition is limited and the chances of new introductions of vigorous invasive species are low. Combining this with thermal buffering from the surrounding ocean, the result is high ultimate stability (biotal preservation over 1–30 Ma), high ultimate diversity (uniqueness of the biota) and low proximate diversity (species numbers; Cronk, 1997; Table 4). When island isolation is broken by human intervention, the interplay of contrasting diversities and long-term stability can result in very low levels of proximate stability (or high levels of ecological vulnerability; Table 4).
Contrasting diversities and stabilities of islands and continents are key to understanding the local onset of the Anthropocene and its character (developed by Cronk, 1997). Oceanic islands at low latitudes are characterized by high ultimate stability (biotal preservation), this in turn leads to high ultimate diversity (uniqueness of the biota) and low proximate diversity (species numbers) and low proximate stability (ecological vulnerabilities). Continental habitat islands contrast in every way; low uniqueness and high diversity result in greater ecological stability. High-latitude islands subject to both glaciation and a narrow window of inter glacial colonization mirror continental habitat islands in all but their species diversity. As a result, anthropogenic introductions can increase biodiversity without threatening species extinction.
Iceland has ecological vulnerabilities which differ from those of low-latitude islands such as those in the Central Atlantic, Polynesia, the Caribbean and California (e.g. Cronk, 1997; Edwards and Bird, 2007; Flenley and Bahn, 2002; Rick et al., 2013). Perhaps the most significant is that in comparison with continental areas at similar latitudes, Iceland has a depauperate biota which is a small subset of that found in North West Europe and which lacks endemic species (Buckland and Dugmore, 1991; Buckland et al., 1998). This is as a result of repeated Quaternary glaciations that both extirpated species within Iceland and allowed only a brief window for recolonization during interglacials, as a consequence of meltwater pulses, which lowered ocean salinity and ice-rafting. This contrasts with the ecological uniqueness of low-latitude oceanic islands that could be considered so sensitive to anthropogenic disturbance that their histories of human impact offer little in wider assessments of vulnerabilities to human drivers of change in continental areas.
Thus, we can observe the stepwise change in some environmental indicators at landnám due to the rapid introductions of domestic animals, but we can also understand the delay of noticeable change in environmental processes and their proxy records. Owing to their different histories of environmental change and colonization, North Atlantic islands in general and Iceland in particular had greater eve-of-settlement resilience compared to low-latitude oceanic islands. Contrasting resilience is likely to be a major factor in the contrasting delays between the arrival of humans and the manifestation of change in environmental records.
Conclusion
The human colonization of Iceland resulted in changes which lie outside the ambit of natural environmental change, such as the introduced mammalian biota, the maintenance of artificially high numbers of livestock and the creation of artificial structures. In contrast, some island-wide effects such as soil erosion and deforestation have similarities with natural change produced by climate fluctuations. The pattern of change may be different, with, for example, trees cleared earliest from the most favourable areas for cultivation and grazing, but detection of such subtle patterns demands a dense network of well-placed records, which barely exists in Iceland despite seven decades of palynological research.
Furthermore, our analysis shows that the pattern and timing of the onset vary depending on the particular palaeoenvironmental proxy in question. A clear transitional boundary does not obviously exist in the Icelandic record taken as a whole, and it would be difficult to identify the beginning of human impact without additional information (in this case, historical and archaeological information and the fortuitous presence of the Landnám tephra). Consequently, a type site for the onset of the palaeoanthropocene in Iceland at a particular time has limited use, because the change is time-transgressive even within Iceland. Furthermore, most of our records are unlikely to be preserved over geological timescales. Those changes that are preserved are likely to tell future generations more about the geomorphological consequences of climatic changes that have yet to play out, than about the first millennium or more of human impacts on Iceland.
We have also argued that some of the proxy records incorporated in our analysis are likely to be compromised, for example, by the presence of reworked Betula pollen that was not identified as such. The inevitable noise in palaeoecological reconstructions can hinder attempts to identify objectively any thresholds of human impact. To argue for a clear definition of the palaeoanthropocene based on observable characteristics of the geological record alone, even locally and even in the favourable case of Iceland, would therefore appear to be a lost cause.
In Iceland, made resilient by the impact of glaciations which resulted in island ecologies that are a subset of continental ones, we see delay between the change of process and the manifestation of those changes in a majority of our environmental archives, despite the nature, scale and speed of human colonization. This is in contrast to small, remote low-latitude oceanic island environments where changes in process brought on by people can cause rapid changes in environmental indicators.
People introduce new processes to the environment (by direct and indirect actions) that may create a lasting legacy. The roots of historical impact on the Earth lie in a change of process, which may not immediately manifest itself in the planetary record. Although in Iceland the consequences of this change in process (enhanced erosion) become most apparent in the 18th century, it was the introduction of grazing animals some 900 years previously which initiated the change. We would argue that ‘reference sites’ that exemplify the change of process that defines the Anthropocene may have value in understanding the extent and character of human impact over the long term, thereby underpinning the argument for erecting the Anthropocene as a distinct geochronological unit, even if there is little practical value in focusing on defining the onset of major impacts, which is in general likely to be gradual and diachronous.
Footnotes
Acknowledgements
The authors would like to thank the constructive comments of two anonymous reviewers.
Funding
This study was financially supported by the Carnegie Trust for the Universities of Scotland, the National Science Foundation of America (through grant 1202692 ‘Comparative Island Ecodynamics in the North Atlantic’ and grant 1249313 ‘Tephra layers and early warning signals for critical transitions’) and the Leverhulme Trust (Study Abroad Fellowship to AJD).