
Abstract
The Sanjiang Plain (SJP) wetland is the largest freshwater marshland in China. Peatlands were initiated early and are widely distributed across the SJP and form a large carbon (C) pool. Consequently, there is a growing interest in understanding past, present, and future peatland dynamics. Most studies on peatland dynamics have been carried out on boreal and subarctic region; however, there are limited data about peatland dynamics on temperate region, such as SJP wetland, which is sensitive to climate change and human disturbance. Here, we presented a data synthesis of basal peat ages, peatland area, and peat C accumulation rate in the SJP to examine Holocene peatland dynamics and climate sensitivity, along with total C storage and their future fate. We show that peatland initiation in the SJP started in the early Holocene, but the most intense period of peatland initiation occurred during the late Holocene, when the climate was colder and drier than the early and mid-Holocene. And the C accumulation rate also continued to increase during the late Holocene. Our results suggest that insolation and monsoon intensity as well as the local topographic characteristics and hydrology during the late Holocene in the SJP might have played an important role in causing the highest rates of peatland initiation and C accumulation. Based on the Second National Wetland Resources Survey data, we estimated that the total peatland covered an area of about 10,520 km2 on the SJP and currently stores ~0.26 Pg C. However, human activities, together with the widespread warming on the SJP over the past 60 years, not only reduce the area of wetlands but also have switched it from being a net C sink to a significant C source.
Keywords
Introduction
Despite covering only 6–8% of the world’s land surface, peatlands contain a large amount of carbon (C), which accounts for one-third of the global organic soil C pool (Gorham, 1991; Limpens et al., 2008; Mitra et al., 2005); this is about 612 Pg C since the Last Glacial Maximum in the global peatlands (Yu, 2011). Thus, these ecosystems have played a significant role in the global C cycle as either important sinks of carbon dioxide (CO2) or major sources of methane (CH4) to the atmosphere (Frolking and Roulet, 2007). However, there is a growing concern that peatlands would return the previously captured C to the atmosphere via releasing CO2 and/or CH4 under intensified global climate change and human activities (Davidson and Janssens, 2006), which would possibly accelerate the present global warming (Knorr et al., 2005). In order to analyze C dynamics and their feedback to global climate change, increasing attention has been paid to the development of peatland and the related carbon budgets over recent decades. Several syntheses on peatland development and carbon dynamics during the Holocene have been carried out, such as in Alaska (Jones and Yu, 2010), North America (Gorham et al., 2007; Ruppel et al., 2013), West Siberia (Smith et al., 2004), Southeast Asia (Dommain et al., 2011), and China (Wang et al., 2014; Xing et al., 2015; Zhao et al., 2014). There are also some similar researches addressing the peatland dynamics on either northern or the whole global peatlands (MacDonald et al., 2006; Yu et al., 2010). However, relatively few studies on the peatlands in more temperate parts of the world have been done (Cai and Yu, 2011). Due to the significant areas and C stocks in these temperate climate regions, the peatlands there could be more vulnerable to future climate change because they are closer to the climatic limit of northern peatland distribution. Therefore, data from temperate climate regions, particularly influenced by monsoons (Zhao et al., 2014), would contribute to deeper understanding of peatland development histories and climate controls.
The Sanjiang Plain (SJP), located in the temperate climate region, is the largest area of freshwater marshlands in China (Liu et al., 2007). These peatland are mainly located at the southern limit of northern peatlands (Yu et al., 2009). Despite its importance, this region still represents a major data gap of the global peatland synthesis (Yu et al., 2010). Owing to the fact that peatlands in SJP are strongly influenced by the East Asian summer monsoon, their accumulation histories would provide insight into the effects of climate on peatland development under monsoon climates (Zhao et al., 2014). Research has showed that SJP peatlands are relatively young geologic deposits that mostly initiated during the Holocene (Liu et al., 2002), but spatially and temporally explicit information on their initiation and development is poorly documented. Currently, estimates are only available for (1) the current C pool that is stored in the SJP peatlands, (2) the age of initiation for selected peatlands, and (3) the historical rates of C accumulation for an even more limited number of sites. Therefore, how this rapid peatland initiation relates to climate has not yet been understood in the SJP. Partly because of the broad geographic reach and variable regional climate histories of these studies, several previous data synthesis studies did not identify climatic mechanisms of peatland development (Gorham et al., 2007; MacDonald et al., 2006; Zhao et al., 2014), hindering the understanding of climatic controls on peatland dynamics. A most recent synthesis study on China’s peatlands by Wang et al. (2014) makes the progress in understanding the relationships between climate and peat development in the SJP during the Holocene; however, the conclusion was hampered by the limited sites, that is, eight peat cores from the SJP were used. Therefore, a more detailed spatial and chronological context in the SJP region is necessary to achieve a more comprehensive understanding of peatland initiation histories, carbon dynamics, and climate controls.
In addition, the SJP is one of the important commodity grain bases in China (Wang et al., 2011). With increasing populations, wetlands have been heavily influenced by human activities in the SJP. About 80% of the natural wetlands have been destroyed and degraded since the 1950s, and much of the loss has occurred through the conversion of wetlands to the cultivation of rice (Huang et al., 2010). Furthermore, Liu et al. (2002) predicted that all of the natural wetlands in the SJP would disappear within 20 years because of these intensive human activities. Numerous studies have shown that wetland conversion and degradation result in the loss of soil organic carbon (Euliss et al., 2006; Lal et al., 2004) and releasing additional CO2 into the atmosphere, which would directly contribute to local and regional climate changes (Lin et al., 2009). Therefore, together with ubiquitous warming and these intensified human activities in the SJP, studies on the C dynamics of these wetlands appear particularly important.
In this paper, we report on the history of peatland initiation and development in the SJP, using a synthesis of basal peat ages and detailed peat C accumulation records in the literature along with our new records. With this new dataset, we illustrate the time series of Holocene peatland initiation in comparison with regional climate history in the SJP and analyze the connection between C accumulation variations and associated broad-scale climate controls in this region. Furthermore, we estimate the C pool of the SJP peatlands using a new approach based on peat C density and potential peatland area. At last, we compare the present C loss from wetland conversion and from peat decomposition with natural C storage in order to address the question whether SJP wetlands still function as a C sink in the future.
Materials and methods
Study area
The SJP lies in China’s far northeastern corner, with latitude 43°50′–48°27′N and longitude 129°11′–135°05′E covering a total area of 10.9 × 10⁴ km2. It includes an extensive low plain formed by three major rivers: the Heilong River, the Songhua River, and the Wusuli River, at an elevation of <200 m a.s.l. and a slope grade of <1:10,000 (Figure 1). The study area has a temperate humid to subhumid continental monsoon climate with long, cold winters and short, cool summers. The mean annual temperatures range from 1.4°C to 4.3°C, with the coldest month in January (mean temperature: −20.5°C) and the hottest month in July (mean temperature: 21.7°C). The mean annual precipitation is approximately 550–650 mm, and more than 80% of rainfalls occur between May and September. These boreal climatic conditions and such a low-relief area are favorable for development of wetlands. A recent survey shows that over 70% of the plain has been dominated by freshwater wetlands developed in abandoned riverbeds and topographic depressions, and it has been well known as the largest concentrated area of the freshwater wetlands in China (Ma et al., 1993).
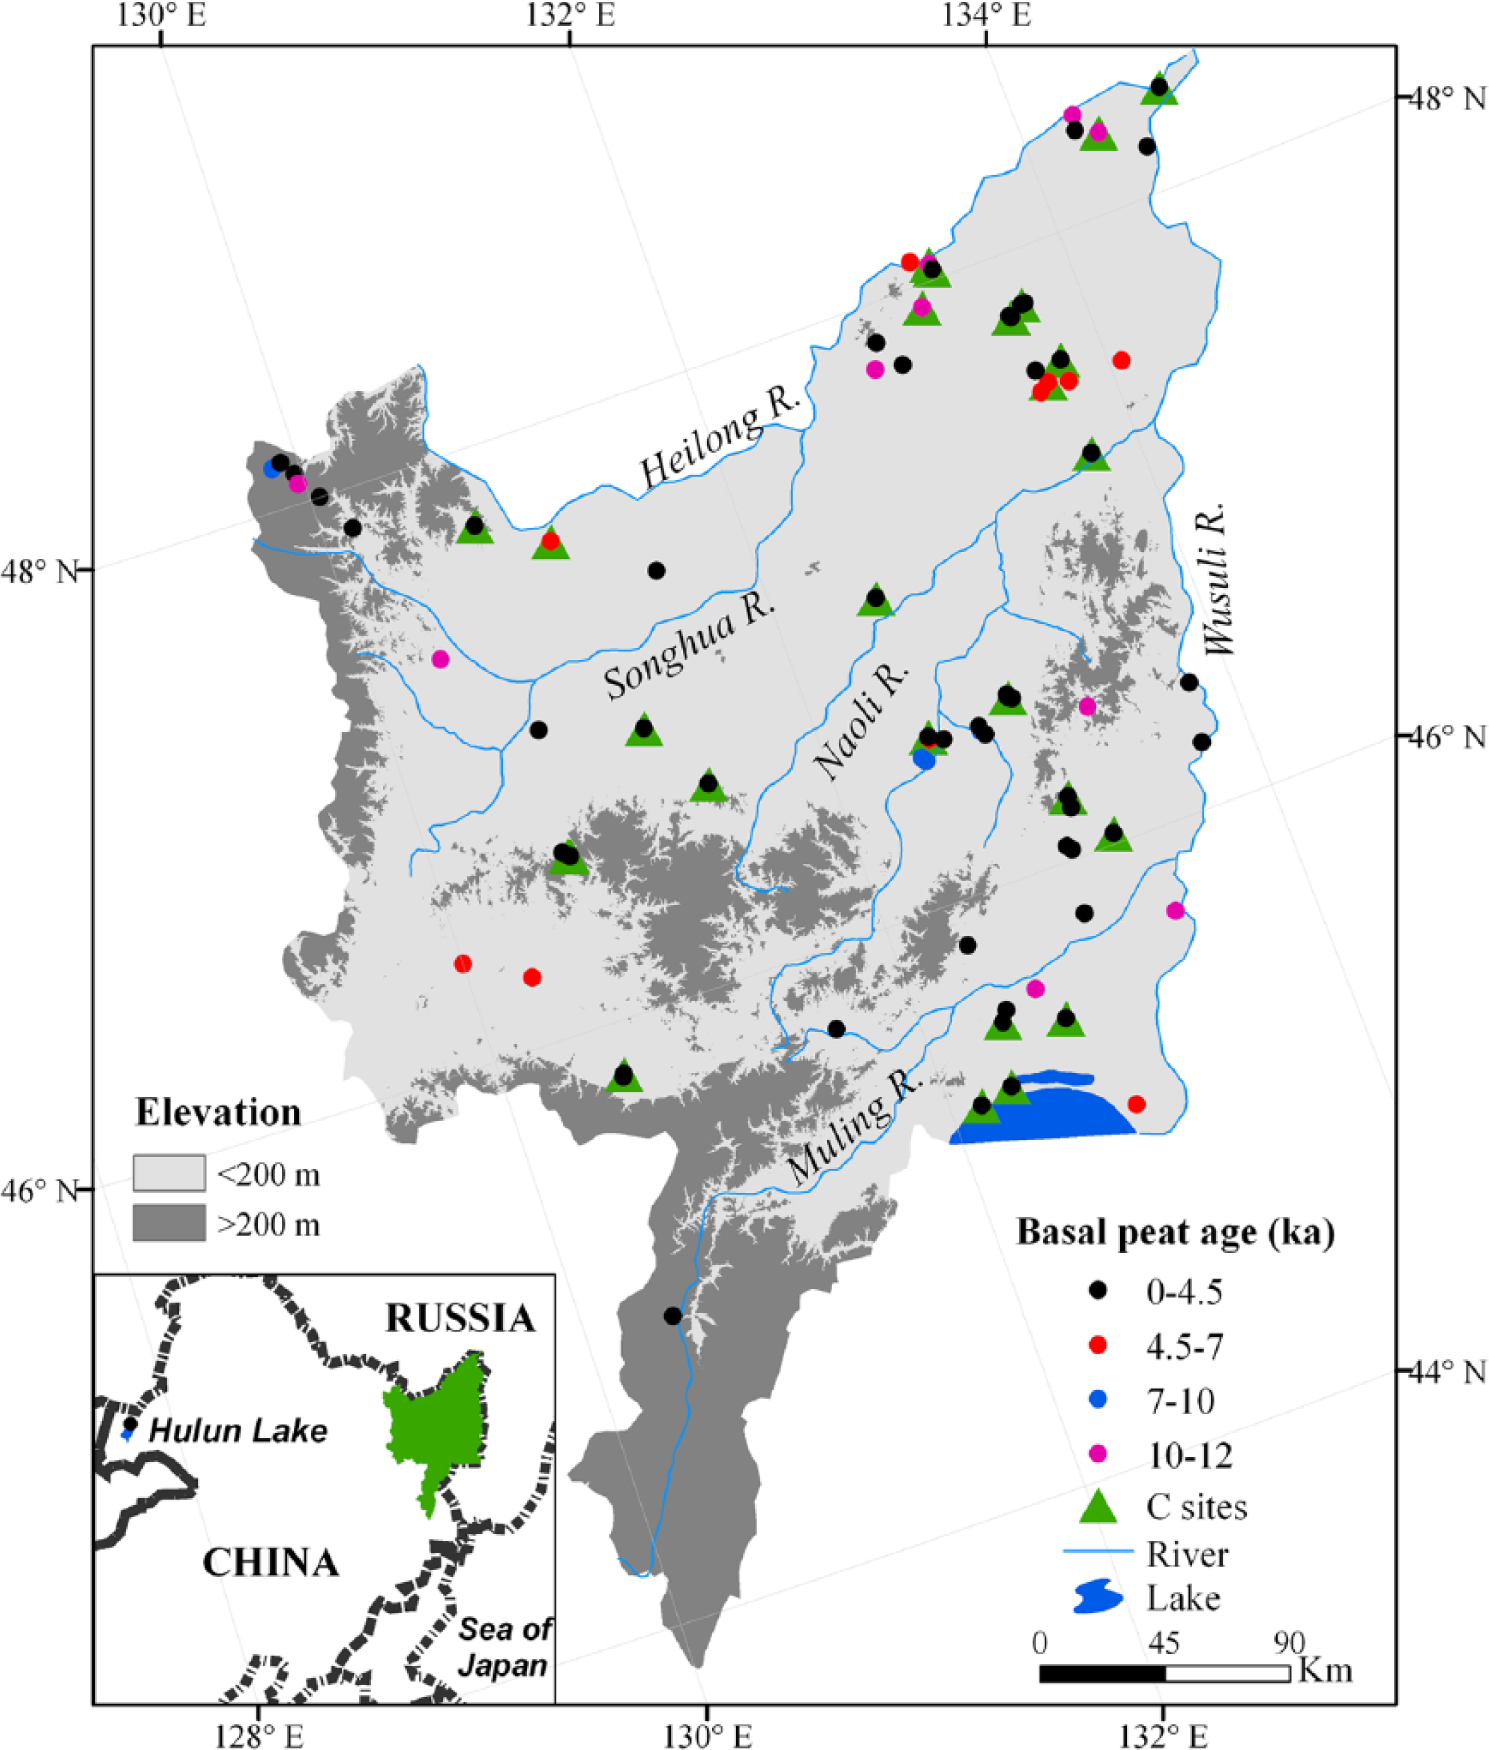
Map of the study region showing locations of sampling sites for basal peat 14C dates and C accumulation records in the Sanjiang Plain (see Table S1, available online, for location names and other information). Peatland study locations are color-coded by basal peat 14C age (1 ka = 1000 cal. yr BP) and grouped according to the trends in peatland initiation frequency (black: 0–4.5 ka; red: 4.5–7 ka; blue: 7–10 ka; pink: 10–12 ka). The green triangles indicate the C accumulation records.
Data synthesis and new peat records
We compiled a dataset of 86 basal peat 14C dates from previously published literature, unpublished data sources, and our own new dating results across the SJP (see Supplementary Table S1, available online). These records were compiled for the purpose of examining the relationship between peatland initiation and climate controls and served as the original data sources for the peatland map (Figure 1).
These 72 existing basal peat ages, representing the onset of peat accumulation conditions, were selected based on the following selection criteria: (1) the sites were located within the region of the SJP and the peat depth is thicker than 30 cm; (2) the peat profiles were mostly continuous peat and the availability of 14C basal peat ages is obtained from the peat–mineral interface; and (3) basal peat material sampled from an ecosystem current is classified as a peatland. To supplement the series of 72 peat ages, field sampling across the SJP in 2010–2012 resulted in 14 new peat records (Table S1, available online). Basal dates for these 14 new peat cores were generated using accelerator mass spectrometer (AMS) 14C dating of organic matter in the State Key Laboratory of Loess and Quaternary Geology, Institute of Earth Environment, Chinese Academy of Sciences.
Field sampling and laboratory methods
These 14 new peat cores were either collected with titanium (Ti) Wardenaar peat profile sampler (100 cm long × 10 cm × 10 cm) or a Russian peat sampler (5 cm diameter). These cores were subsampling in the field by slicing into 1 cm contiguous sample and then were stored in plastic bags separately until laboratory analyzes for dry bulk density and carbon content. The locations of these new peat cores were recorded in the field using a hand-held GPS receiver.
A subsample of peat from each 1 cm peat slice was dried at 105°C overnight, weighed, and subsequently combusted in a muffle furnace at 550°C for 4 h and reweighed to determine the dry bulk density and the organic carbon content (Heiri et al., 2001). The organic C content was estimated by multiplying the organic matter content by 0.5, based on previous data from this region (Bao et al., 2010, 2011; Yin et al., 1991). The dry bulk density was calculated as (dry weight (g)/field volume (cm−3)). Loss on ignition (LOI) and the dry bulk density analysis were performed at the Key Laboratory of Wetland Ecology and Environment, Northeast Institute of Geography and Agroecology, Chinese Academy of Sciences.
Holocene peatland initiation and C dynamics
All dates collected from previously published or unpublished literatures and reports, together with the new obtained dates described as above, were calibrated to calendar years before present year (cal. yr BP) using the program Calib Rev. 7.0.2 with the IntCal13 calibration dataset, and the calendar years were calibrated to their 2σ age ranges (95% probability; Reimer et al., 2013). Similar to other studies (Jones and Yu, 2010; MacDonald et al., 2006; Zhao et al., 2014), the calibrated 2σ age ranges were grouped into 500-year bins for calculating the frequency of peatland initiation, and the frequencies were then added to calculate the peatland initiation cumulative percentage.
To examine the temporal pattern of peatland C accumulation, we calculated the apparent C accumulation rates by the following equation (Lähteenoja et al., 2012) based on raw data, including multiple calibrated ages, dry bulk density and C content:

where CAR is the C accumulation rate (g m−2 yr−1), r is the peat accumulation rate (mm yr−1), d is the dry bulk density (g cm−3), and c is the C content (g C g−1 dry weight). Among them, peat accumulation rates (mm yr−1) for each profile were calculated for peat layers between the dated depths of the profiles.
In order to assess the temporal variations, the CAR was reconstructed for the subset of 34 peat cores (Tables S2, available online) for which physical properties were measured. Additionally, the mean of C accumulation rates from 34 sites was calculated for each 500-year bin using time-weighted averaged C accumulation rates for each core.
Estimating the total peatland area and carbon storage in the SJP
The total peatland area of SJP is estimated by the Second National Wetland Resources Survey data (State Forestry Administration, 2013), which were obtained from the State Forestry Administration Wetland Management Center, P.R. China. According to the previous studies, the total C storage was based on peat depth, C content, and dry bulk density, using standard methods (Chambers et al., 2011; Lähteenoja et al., 2012; Yu, 2012). However, the areal dry peat mass (g cm−2) was calculated by the product of incremental dry bulk density (g cm−3) and peat depth (cm). Previous researches have shown that areal dry peat mass for the peat profiles examined was strongly related to basal peat age in the northern peatland (Packalen et al., 2014; Turunen et al., 2002). Accordingly, we indicate the areal dry peat mass as peat C density (areal C mass; kg C m−2), as it is similarly correlated with peat age in the SJP. Linear regression analysis of peat C density and basal peat age shows that there is a significant relationship (F = 35.51, R = 0.72, p < 0.001, n = 34; see Supplementary Table S2, available online) following Eq. 2:

Eq. 2 was used to calculate peat C density for the remaining 52 peat cores that lacked peat physical properties (see Supplementary Tables S1 and S2, available online). The total C storage for the SJP was quantified by multiplying the mean peat C density (n = 86) and the total peatland area.
Results
Peatland initiation patterns and carbon accumulation rates
Our synthesis of 86 basal peat ages (14 new and 72 previously reported dates; Table S1, available online) indicates that peatlands began to form at the beginning of the Holocene across the SJP. The highest frequency of peatland formation occurred from 4.5 to 1 ka (1 ka = 1000 cal. yr BP), concomitant with the decreasing insolation and monsoon intensity, and two initiation peaks of peatlands in the SJP were found at around 4.5–3.5 and 2.5–1 ka (Figure 2a and b). Only 9.1% of the peatlands scattered in the SJP formed before 10 ka BP and the other 89.9% initiated after 10 ka. Among those formed after 10 ka, about 15.4% of the peatlands initiated at 10–6 ka and about 26.4% at 6–4 ka. The other 49.1% of the SJP peatlands (58% of total basal dates) formed after 4 ka (Figure 2b). It is worth noting that almost no peatland was developed in the SJP during the last one or two centuries (Figure 2b).
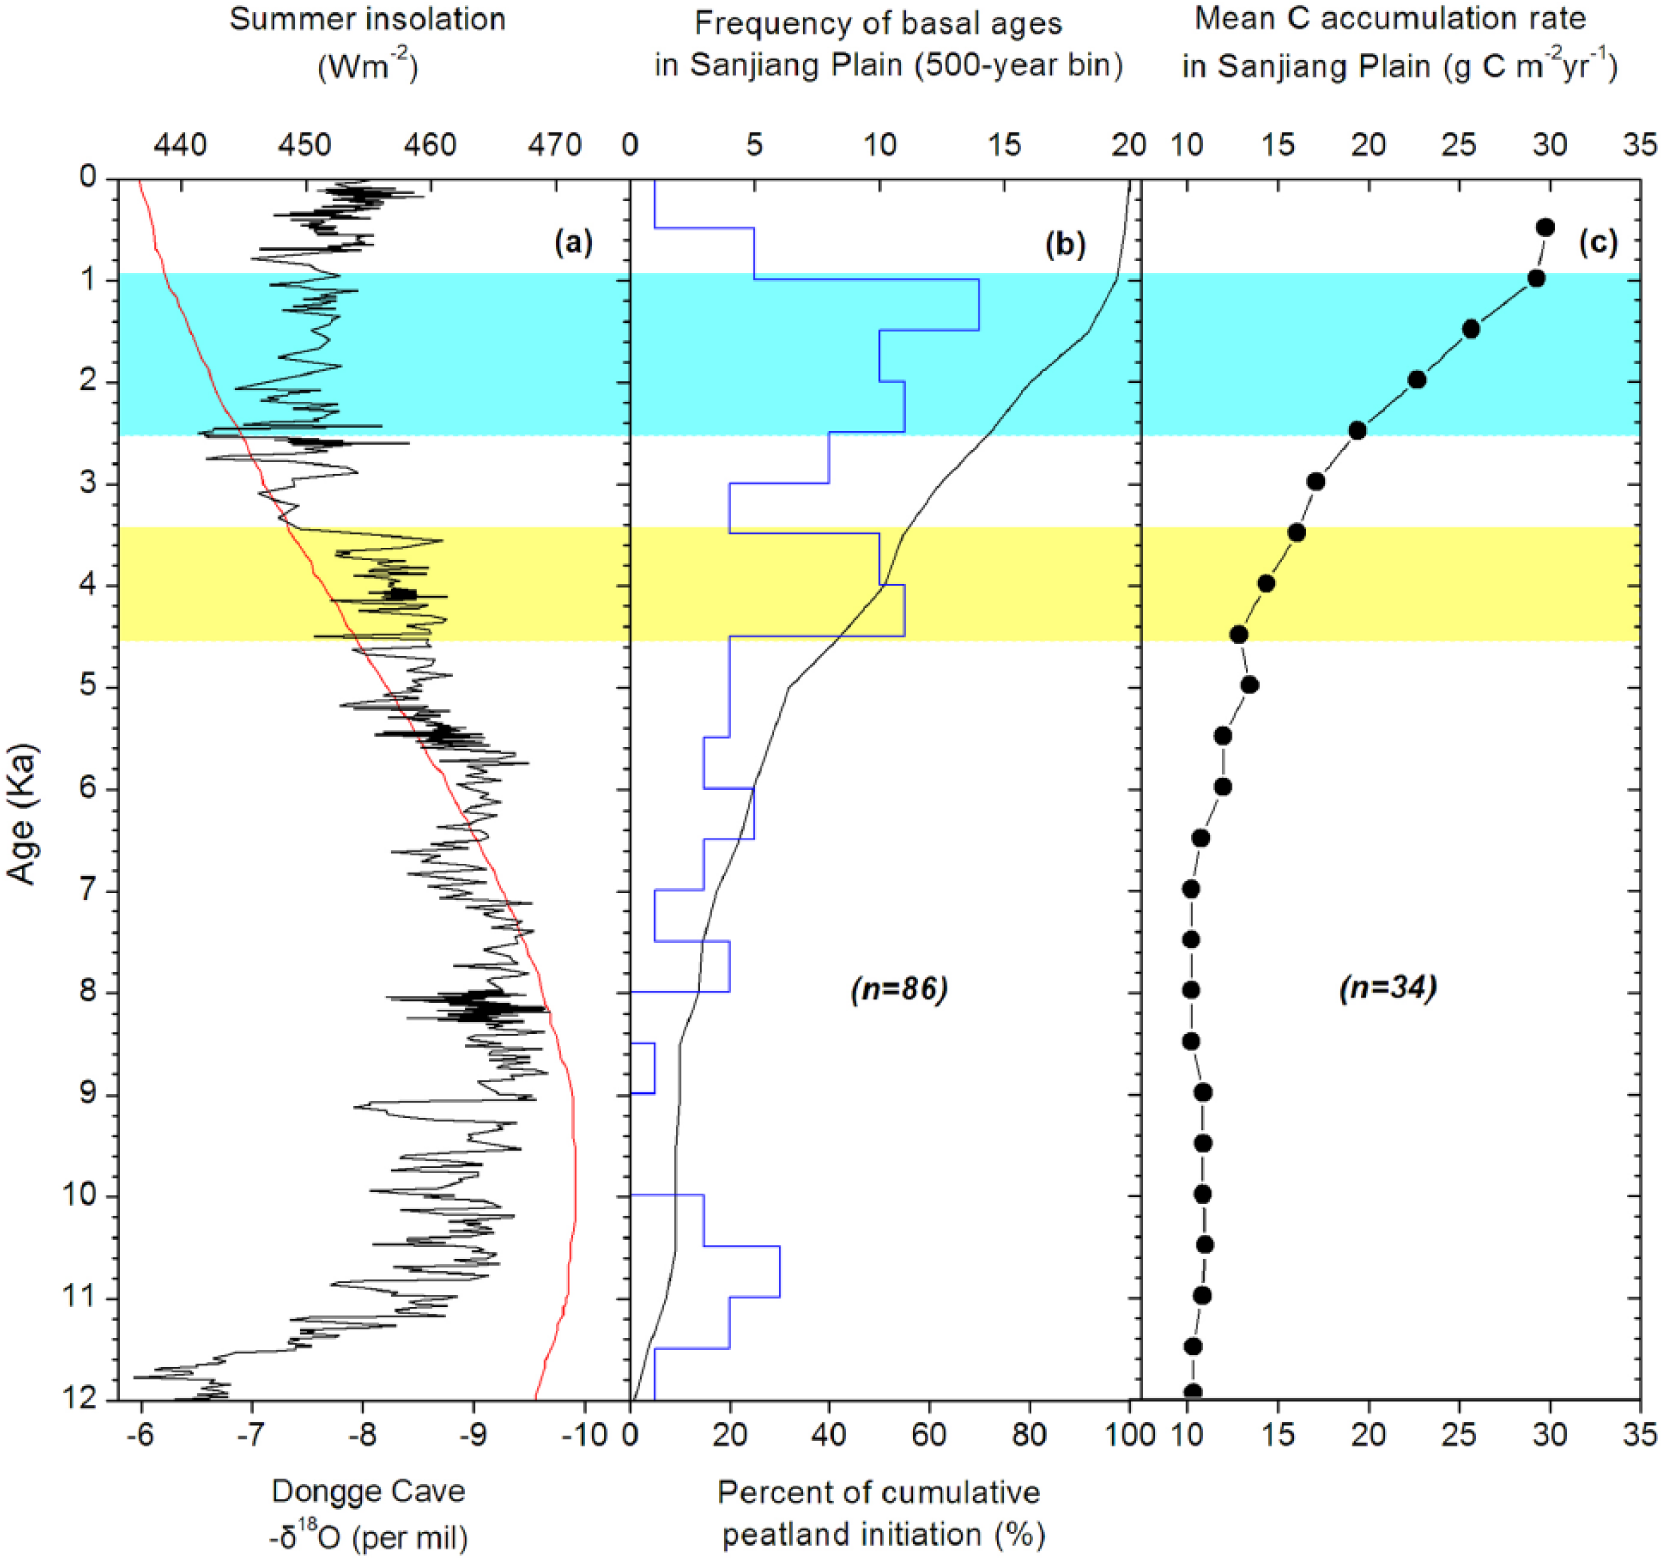
Peatland initiation and carbon dynamics in the Sanjiang Plain. (a) Summer insolation in the Northern Hemisphere (60°N; red curve; Berger and Loutre, 1991) and the oxygen isotope record at Dongge Cave (black curve), as a proxy of the intensity of summer monsoon (Dykoski et al., 2005). (b) Frequency of basal peat ages for 86 sites as expressed in 500-year bins of 2σ calibrated age ranges from the Sanjiang Plain and cumulative peatland initiation percentage (n = 100; smooth curve). Different color stripes indicate the intense period of peatland initiation. (c) Mean carbon accumulation rates for 34 sites in the Sanjiang Plain peatlands (showing means of the bins from various sites in this region; Table S2, available online).
Rates of peat accumulation in the SJP varied widely and ranged from 0.08 to 0.83 mm yr−1 (Table S1, available online), with a mean value of 0.35 mm yr−1. The peatland C accumulation rates in the SJP ranged from 4.4 to 64.5 g C m−2 yr−1 (Table S2, available online), with a mean value of 26.4 g C m−2 yr−1 during the Holocene. The synthesis curve of CAR from the SJP showed a very low C accumulation rate at around 12–7 ka, with the lowest rates occurring at 8 ka and then increased gradually from 6.0 to 3 ka, followed by an abrupt increase over the past 2 ka (Figure 2c).
Total area of potential peatlands and their C storage
Based on the Second National Wetland Resources Survey data, the total area of peatlands in the SJP was 10,520 km2. Our results reveal the mean peat C density (±standard error (SE)) of 24.5 ± 9.1 kg C m−2 (n = 86) for the SJP. Thus, the carbon pool in the SJP was approximately 0.26 ± 0.10 Pg C.
Discussion
Patterns and controls of peatland dynamics during the Holocene
The frequencies of peatland initiation show a slight increase during the early Holocene at 11.5–10 ka in the SJP (Figures 2b and 3b), consistent with the result of previous studies in northern China peatlands (Wang et al., 2014; Zhao et al., 2014) and other major northern peatland regions (MacDonald et al., 2006; Smith et al., 2004; Yu et al., 2010). This increased expansion corresponds to the higher summer insolation and stronger summer monsoons (Figure 2a; Dykoski et al., 2005), which could be mainly attributed to the higher temperature and precipitation in this region (Figure 3c), since high plant production and low peat decomposition could be achieved in this climate of warm summer and cold winter (Jones and Yu, 2010). However, syntheses of basal peat dates show lower frequencies of peatland initiation after 10 ka (Figure 2b). After that, the peatland initiation in the SJP entered into a rapid development period at around 6.5 ka, and the highest frequencies of peatland initiation in the SJP occurred between 4.5 and 1 ka, referred to here as the late Holocene (Figure 2b). These results indicate that the majority of the peatlands in the SJP was initiated by and developed during the late Holocene.
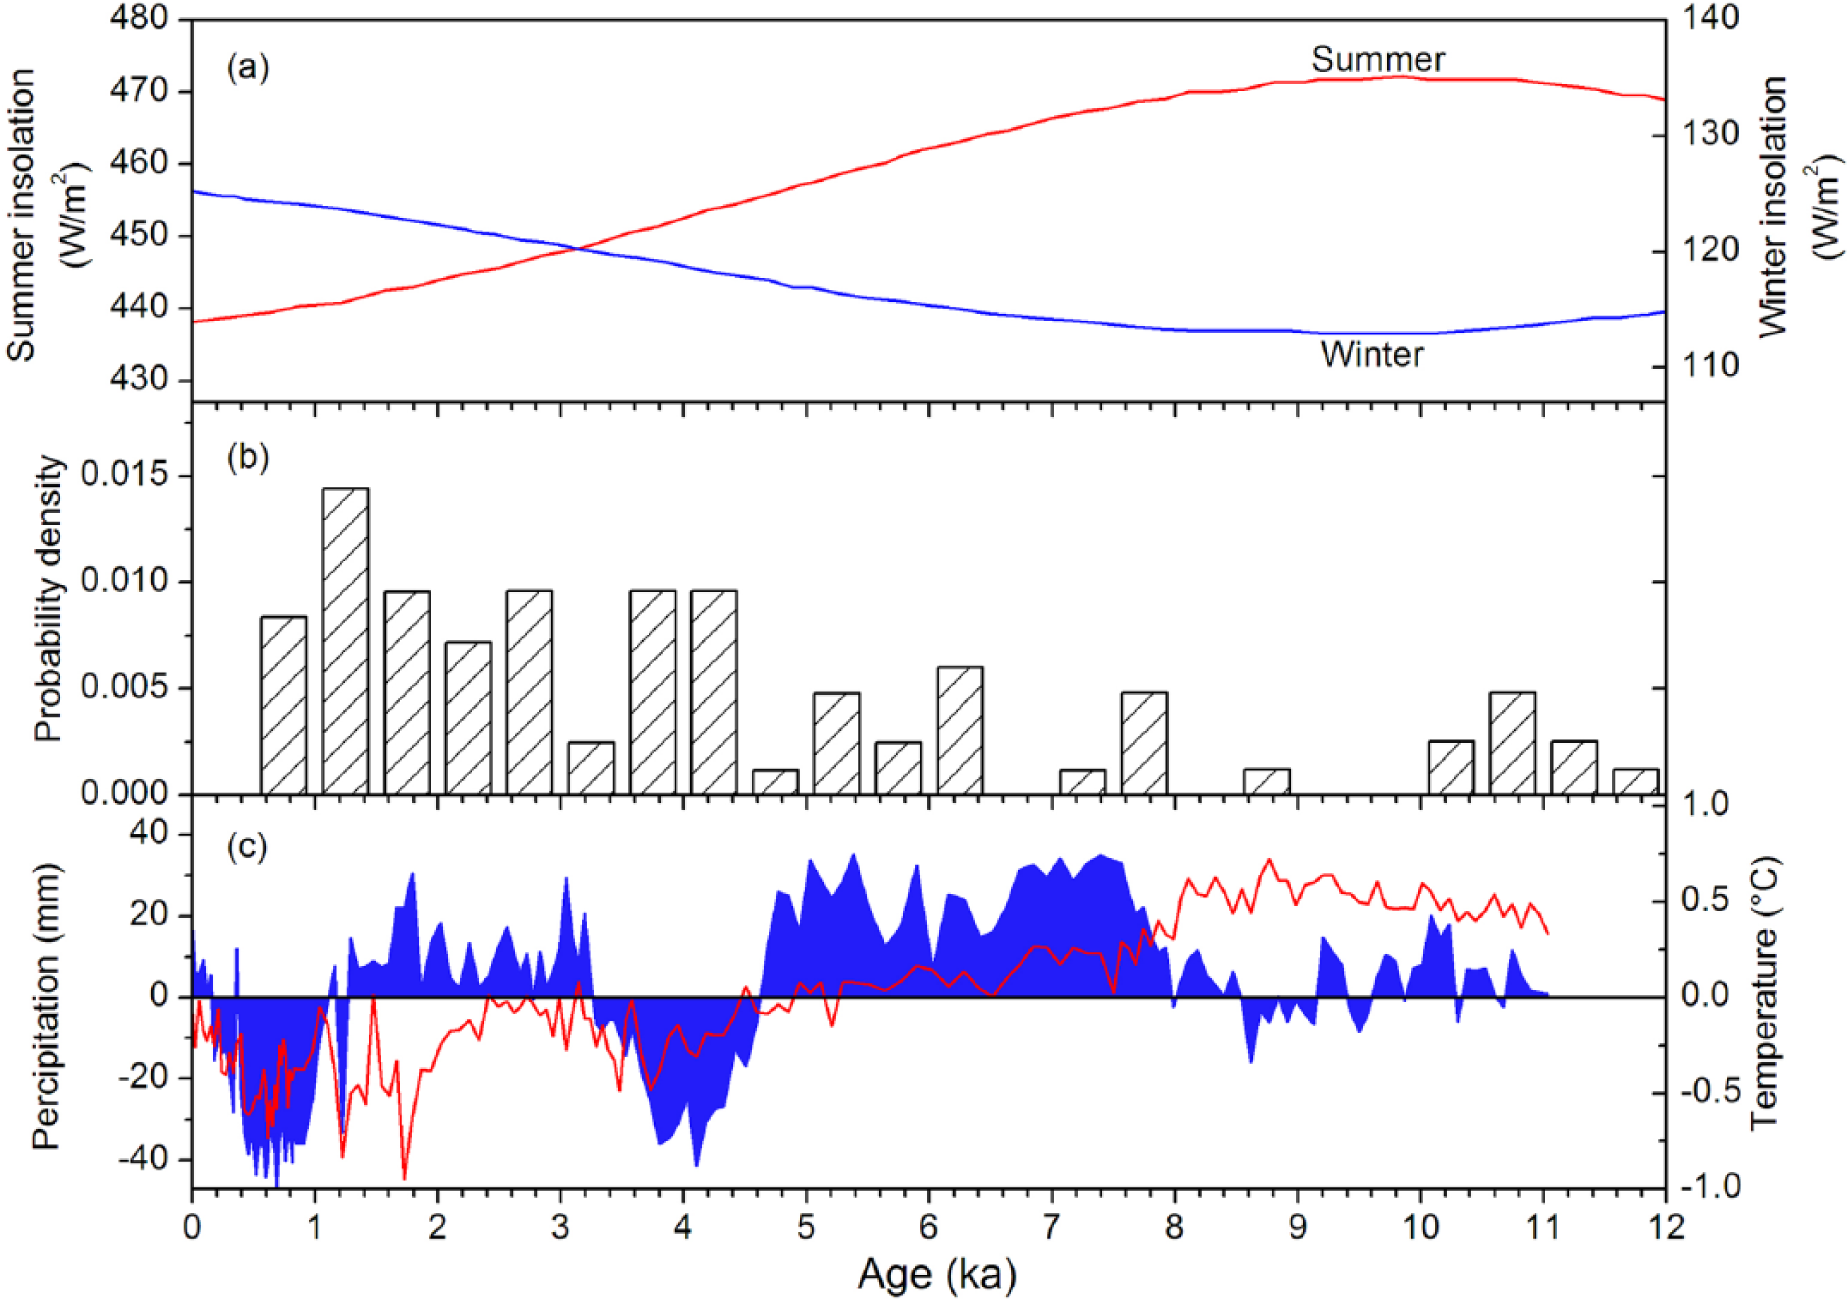
Peatland initiation dynamics, climate controls, and correlations with other paleorecords in the Sanjiang Plain. (a) Summer (red curve) and winter (blue curve) insolation in the Northern Hemisphere (60°N) during the Holocene (Berger and Loutre, 1991). (b) Probability density function of the basal peat dates plotted in 500-year bins. (c) Reconstruction of annual temperature (red curve) and annual precipitation (blue area) anomalies from the Hulun Lake pollen records (Wen et al., 2010).
Previous global peatland syntheses showed that the most intense period of northern peatland initiation has been driven by optimal climatic conditions, including higher summer insolation and seasonality, during the early Holocene (Jones and Yu, 2010; MacDonald et al., 2006; Yu et al., 2010; Zhao et al., 2014). In contrast, comparisons with available basal peat dates reveal an opposite trend in the SJP, such that the maximum frequency period of peatland initiation in the SJP occurred under less favorable conditions and corresponded to lower summer insolation and weaker monsoon in the late Holocene (Figure 2a and b). In northeast China, peatland formation can initiate via two processes: terrestrialization and paludification (Liu et al., 2005). Terrestrialization is an autogenic lake-infilling process, but it can be accelerated by dry climate shifts. However, wet climate tends to favor paludification process (Ruppel et al., 2013). Our results are in agreement with previous studies from the SJP showing that terrestrialization is the dominant peatland initiation process (Liu et al., 2005; Zheng, 1989).
Fossil pollen records at Hulun Lake (Wen et al., 2010) and the pollen records at Qindeli Farm in the SJP (Xia, 1988) showed that the regional vegetation changed from the conifer-dominated boreal forest to broadleaf shrub in the early Holocene. Both pollen records indicated an increase in temperature and precipitation on the SJP during the early Holocene (Figure 3c), when the East Asian summer monsoon was strongest as indicated by the δ18O record at Dongge cave (Figure 2a; Dykoski et al., 2005). With the increase in temperature and precipitation, Pingo Lake began to thaw and the water areas of river channel and lakes were expanded, which provided a favorable condition for peatland initiation (Yang, 1990). But the peatland initiation was mostly concentrated in the low-lying regions, such as in Pingo Lake and Crescent Lake, that the frequencies of peatland initiation were relatively low (Figures 2b and 3b). After that, there was a 1-ka apparent gap in peatland initiation which may be due to the lack of available peatland records in this dataset. Another study has attributed the similar peatland initiation gap during this period (Wang et al., 2014). The steady increase in the number of newly formed peatlands occurred from 7 to 4.5 ka (Figures 2b and 3b), which corresponded to the Holocene thermal maximum (HTM) in northeast China. During the HTM, this region was 2.0–3.0°C warmer and wetter than at present (Yang and Wang, 2003), and the pollen assemblage records at Hulun Lake (Figure 3c; Wen et al., 2010) in northeast China also reported a warmer and wetter climate during this period. This warmer and wetter climate condition provided favorable conditions for further development of peatland in the SJP. After that, decrease in summer insolation and increase in winter insolation (Figure 3a) together with the period receiving the relatively more precipitation occurred between 4.5 and 1 ka in this region (Figure 3c), synchronous with the maximum frequencies of peat initiation (Figures 2b and 3b). That the most intense of peatland initiation in the SJP during this period was probably a response to the decrease in summer insolation and the subsequent cooling climate after the HTM, which coincides with drier and colder conditions based on pollen records paleoclimate reconstructions (Figure 3c; Wen et al., 2010). In addition, the river channels extended extensively in the SJP (Liu et al., 2002), and the sea level rise to the maximum after the post-glacial period at 6–5 ka (Saito et al., 1998; Steinke et al., 2003), which probably led to a higher groundwater table. Increased water flow on the ground surface and belowground generally moistened the soil condition, promoting the establishment of peatland vegetation around the existing peatlands. For this reason, peatland development began to expand from the confined low-lying areas to the broad flat floodplains and terraces, and then the peatland development entered the optimum period in the SJP (Figures 2b and 3b). These regional variable climate, local hydrology, and topography appeared as the main trigger of the highest frequencies of peatland initiation during the late Holocene in the SJP, where local conditions favored immediate terrestrialization as a consequence of a dry and cold climate.
A clear slowing down in peatland development can be seen during the last few centuries (Figure 2b). The main reason for this shift could be caused by the increasing human activities (Li et al., 2005; Wang et al., 2011; Yang and Wang, 2003), such as deforestation, agricultural production, and peatland exploitation.
Climate controls on the carbon accumulation rate
Based on the various peatland sites (Table S2, available online), the mean CAR in the SJP exhibits a synchronous increase with the peatland expansion since 4.5 ka (Figure 2c), which indicates that the mechanisms controlling peatland initiation and C accumulation were probably similar in our study region. To our knowledge, although the climate became drier and colder during the late Holocene in this region, it was still characteristic with moist and cold condition (Zhu, 1973). The cold and moist climate resulted in low peat decomposition, thereby giving rise to more peat accumulation. Furthermore, the highest values of CAR occurred around 0.5 ka in the SJP (Figure 2c), which was consistent with the highest CAR in the uppermost meter of the peat in the Changbai Mountain and SJP (Bao et al., 2010, 2011). This could be partly explained by less decomposition of the newly formed peat in the past few centuries, as the newer peat layers have been subjected to more peat mineralization for a shorter time than their older counterparts (Clymo, 1984).
For the SJP peatlands, we have estimated the CAR as 26.4 g C m−2 yr−1, which was higher than that of 22.0 (Bao et al., 2011) and 13.3 g C m−2 yr−1 (Wang et al., 2014) in previous studies. The differences in the estimated CAR results showed that the uncertainty still exists for the SJP peatlands, probably because of the relative low number of sites and different numbers of sites for different studies. Compared with the previous studies, ours have more peat cores to cover the whole SJP, about 34 peat cores (Table S2, available online), and some of these peat cores were newly collected. Therefore, we provide a more accurate statement and a comprehensive error analysis of CAR estimate in the SJP peatlands. In addition, the CAR of the SJP was significantly higher than that of most subarctic and boreal peatlands. For example, Gorham et al. (2012) estimated an overall rate of 17.2 g C m−2 yr−1 for North American peatlands using observations from 2061 peatlands, while Borren et al. (2004) estimated the Holocene C accumulation rates in western Siberia ranging between 10 and 85 g C m−2 yr−1, with an average of 16.2 g C m−2 yr−1. The overall average carbon accumulation rates from boreal, subarctic, and arctic peatlands are 18.6 g C m−2 yr−1 based on 33 sites in the Northern Hemisphere (Yu et al., 2010).
The high CAR in the SJP, compared with other northern peatlands, could be the result of the high primary production in this region. It has been reported that the net primary productivity (NPP) of peatlands in the SJP is approximately 590–1260 g m−2 yr−1 (Liu et al., 2002), which is three times higher than the estimated production of 100–400 g m−2 yr−1 from sites in North America and Siberia peatlands (Peregon et al., 2008; Vitt et al., 2000). Meanwhile, research also has shown that most peatlands occur in the appropriate ranges of annual temperature versus precipitation, with mean annual temperature between 0°C and 2.5°C and annual precipitation at 450–550 mm (Yu et al., 2009). However, most SJP peatlands formed when the mean annual temperatures range from 1.4°C to 4.3°C and the mean annual precipitations range from 550 to 650 mm (Liu et al., 2002). These distinct differences in climate conditions between the SJP peatlands and other subarctic and boreal peatlands could provide more favorable conditions with a long growing season and short freezing period for plant growth and thus show higher C accumulation rates. Although higher precipitation might be offset by increased evaporation under high temperature and result in high decomposition (Davidson and Janssens, 2006), we found that peatlands were mainly distributed in the flat floodplains and terrace in the SJP so that such special terrain could collect more precipitation to ensure peatland humidity and depress the peat decomposition. Therefore, higher temperatures would not produce excessive peat decomposition, and higher primary production probably overcomes the higher decomposition rate.
Total peatland area and current carbon storage in the SJP
This study estimated that the potential total peatland area in the SJP was about 10,520 km2, much larger than previous studies (Huang et al., 2009; Liu et al., 2012; Wang et al., 2014). Previous evaluations of the peatland area in the SJP were achieved through the extrapolation of remote sensing images; however, it contained several uncertainties. A typical problem encountered here was the classification errors, due to lack of detailed field survey data (Weissert and Disney, 2013). In addition, the use of aboveground vegetation as a proxy for peatlands is also likely to lead to the omission of some peatland areas. Contrarily, the data source we used, the Second National Wetland Resources Survey data, is the most recent and authoritative spatial data on the SJP wetlands, which combine remote sensing and field investigation and include all wetlands with an area more than or equal to 0.08 km2 in extent.
In this study, we used a new approach based on the peat C density and peatland area to calculate the total C stored in the SJP and results in a C pool of approximately 0.26 Pg C in the SJP. Our estimates are lower than that of 0.36 Pg C (Bao et al., 2011) but higher than that of 0.15 (Liu et al., 2012) and 0.07 Pg C (Zhang et al., 2008) in previous studies. One main reason of the relatively low value in Liu et al. (2012) was probably that their estimate was based on the China Peat Resources Report Schedule data (Yin, 1988), which used less extensive data on peat depth, bulk density, and LOI, causing a less accurate estimate of the C stored in the SJP peatlands. Bao et al. (2011), in contrast, seem to have overestimated the C stored in the SJP peatlands because only 10 peat cores were used to calculate the C stock which was limited and unrepresentative, that errors may be introduced when the data from one peatland region are extrapolated to the entire SJP peatlands. In addition, Wang et al. (2014) used the time history approach to estimate the SJP peatland C pool, their estimate was 0.03 Pg C; much lower than our estimate. We think the major uncertainties are the history of peatland area change over time as well as the representative of the C accumulation records used. For example, likely peatland expansion is highly nonlinear after initiation, as documented on the site-scale studies (Yu et al., 2010). Therefore, the assumption of linear peatland expansion used in Wang et al. (2014) might have greatly underestimated the peatland area in their early expansion history and the overall C storage.
As mentioned above, we can conclude that it is difficult to provide a more reliable estimate of peatland C storage, due to lack of basic data such as peat depth, peatland area, bulk density, and C content (Yu, 2012), which limits the accuracy of C stock estimates. Detailed field investigation and remote sensing would undoubtedly contribute to a more robust estimation of the peatland area and C stocks. Although refined estimates of peatland area and C mass are necessary for the SJP, our results provide the most comprehensive assessment of the SJP peatland C storage and prove that the SJP represents a regionally significant C sink during the Holocene.
Fate of carbon storage in peatlands on the SJP
Our results indicate that the SJP peatlands cover an extensive area and store ~0.26 Pg C, which is significant at both northeast China and China. Due to sensitivity and fragility of peatlands itself (Chen et al., 2014), carbon storage in peatlands is highly vulnerable to climate change and anthropogenic activities.
During the past six decades, the SJP has experienced intensive human activities (e.g. agricultural development, widespread drainage, and mining), which caused extensive wetland loss and degradation (Song et al., 2014; Wang et al., 2011). Agricultural developments, especially cropland reclamation, have been the major threats to marshland of the SJP (Zhang et al., 2010). Over the 60-year period, the net decrease in marshland area was concomitant with the substantial increase in cropland because of the population pressure (Figure 4). Wetland conversion or degradation results in the loss of soil organic carbon and releasing additional greenhouse gases to the atmosphere (Song et al., 2009) as well as the flow of dissolved organic carbon in the hydrosphere (Song et al., 2011). It has been estimated that the conversion of marshland into cropland in the SJP over the period 1950s–2000s resulted in the loss of 204 Tg of soil organic carbon (Huang et al., 2010). In addition, the SJP has undergone a widespread and significant warming over the past six decades (Liu et al., 2007). Future climate scenarios for the SJP indicate 2.4–4.8°C temperature increases over the next century (Yin, 2013). Meanwhile, temperature is also a critical climatic factor that controls the distribution of crops in the SJP, and climate warming could enhance crop growth and stimulate the conversion of marshland into croplands (Wang et al., 2011). Therefore, warming could increase peatland C storage; however, intensified human activities may augment peatland C decomposition and CO2/CH4 emissions.
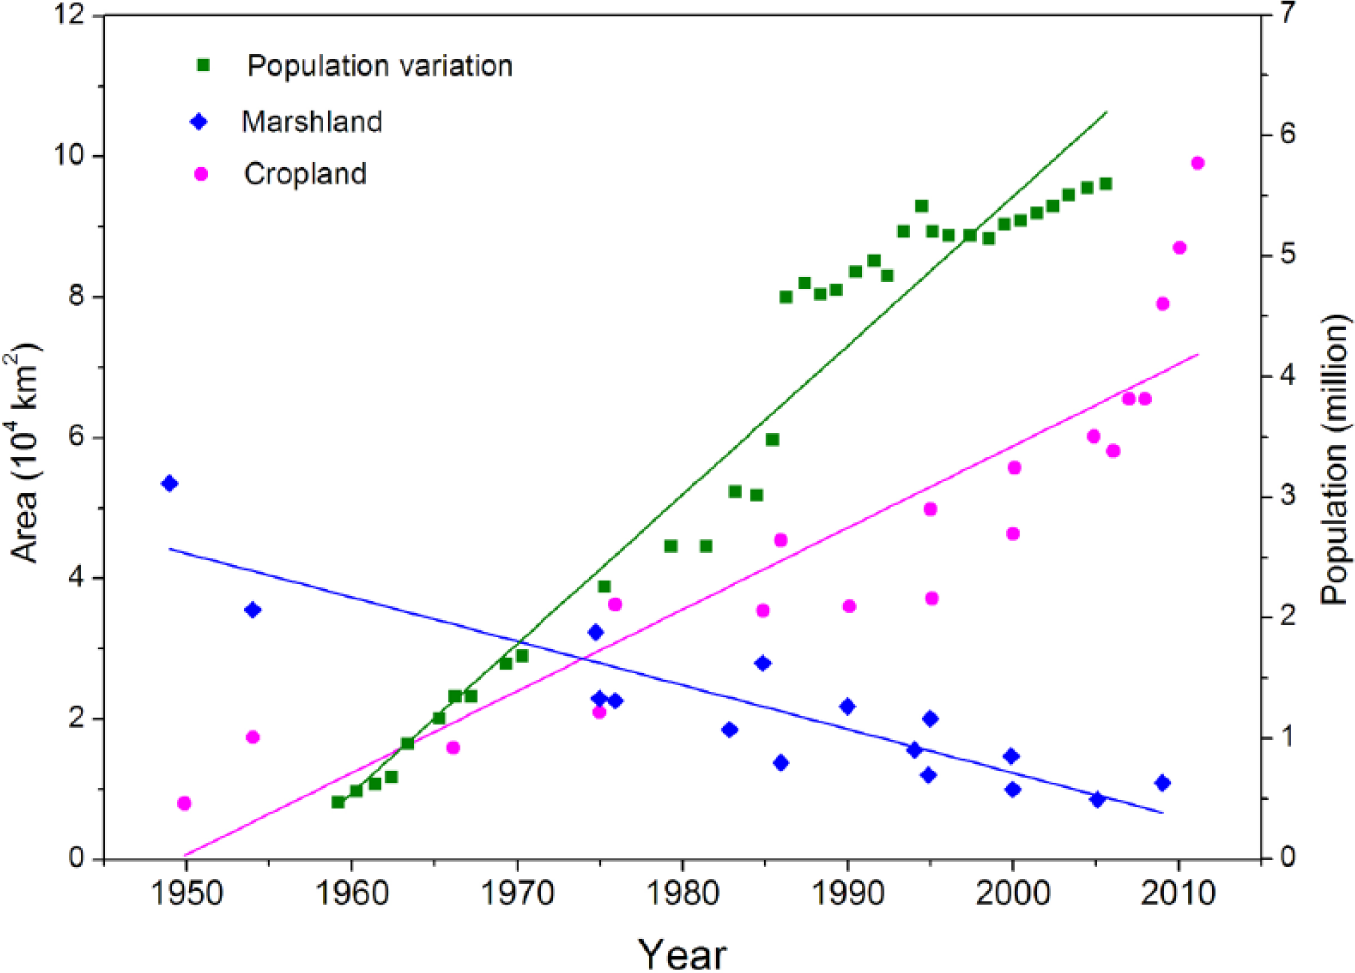
Changes in the area of marshland and cropland in the Sanjiang Plain, and their population variation since the founding of the People’s Republic of China (Huang et al., 2010; Song et al., 2014; Wang et al., 2011). Note that data are unavailable for some specific years.
At present, SJP peatlands have released massive amounts of carbon as a consequence of agricultural development, widespread drainage, and mining (Huang et al., 2010; Song et al., 2014; Wang et al., 2011). Huang et al. (2010) estimated that the conversion of marshland into cropland resulted in the soil organic carbon loss of 4.8 Tg C yr−1 in the SJP in 2000. Natural carbon release from aerobic peat decomposition in the SJP was about 0.26 Tg C yr−1 in 2000 (Bao et al., 2011). If current soil organic carbon losses and natural carbon release continue at the same rate in the SJP, the annual loss rate would rise to 8.6 Tg C yr−1 in 2012, while the natural carbon release was only 0.12 Tg C yr−1 in 2012 (Figure 5). The conversion of marshland into cropland would lead to the greenhouse gas emissions. Based on the recent observation (Wang et al., 2008), greenhouse gas emissions in cropland were estimated to be ~0.32 Tg C yr−1 in the SJP in 2000 and 0.56 Tg C yr−1 in 2012 (Figure 5). Furthermore, considering the remaining wetlands today, the annual rate of carbon storage in the SJP has been reduced to 0.28 Tg C yr−1 in 2012. Based on the Markov Process, Zhang et al. (2009) projected that the wetland area will further decrease to 8230 km2 in 2020 and 5369 km2 in 2030 in the SJP. Assuming all the loss of wetlands are turned into cropland, and carbon release and soil organic carbon loss kept constant in the SJP, this would cause an increase in carbon emissions to 0.59 Tg C yr−1 in 2020 and to 0.63 Tg C yr−1 in 2030, while the soil organic carbon loss is estimated to be 2.34 Tg C yr−1 in 2020 and 2.30 Tg C yr−1 in 2030 (Figure 5). As mentioned above, the entire SJP region has switched from a carbon sink to a significant carbon source (Figure 5).
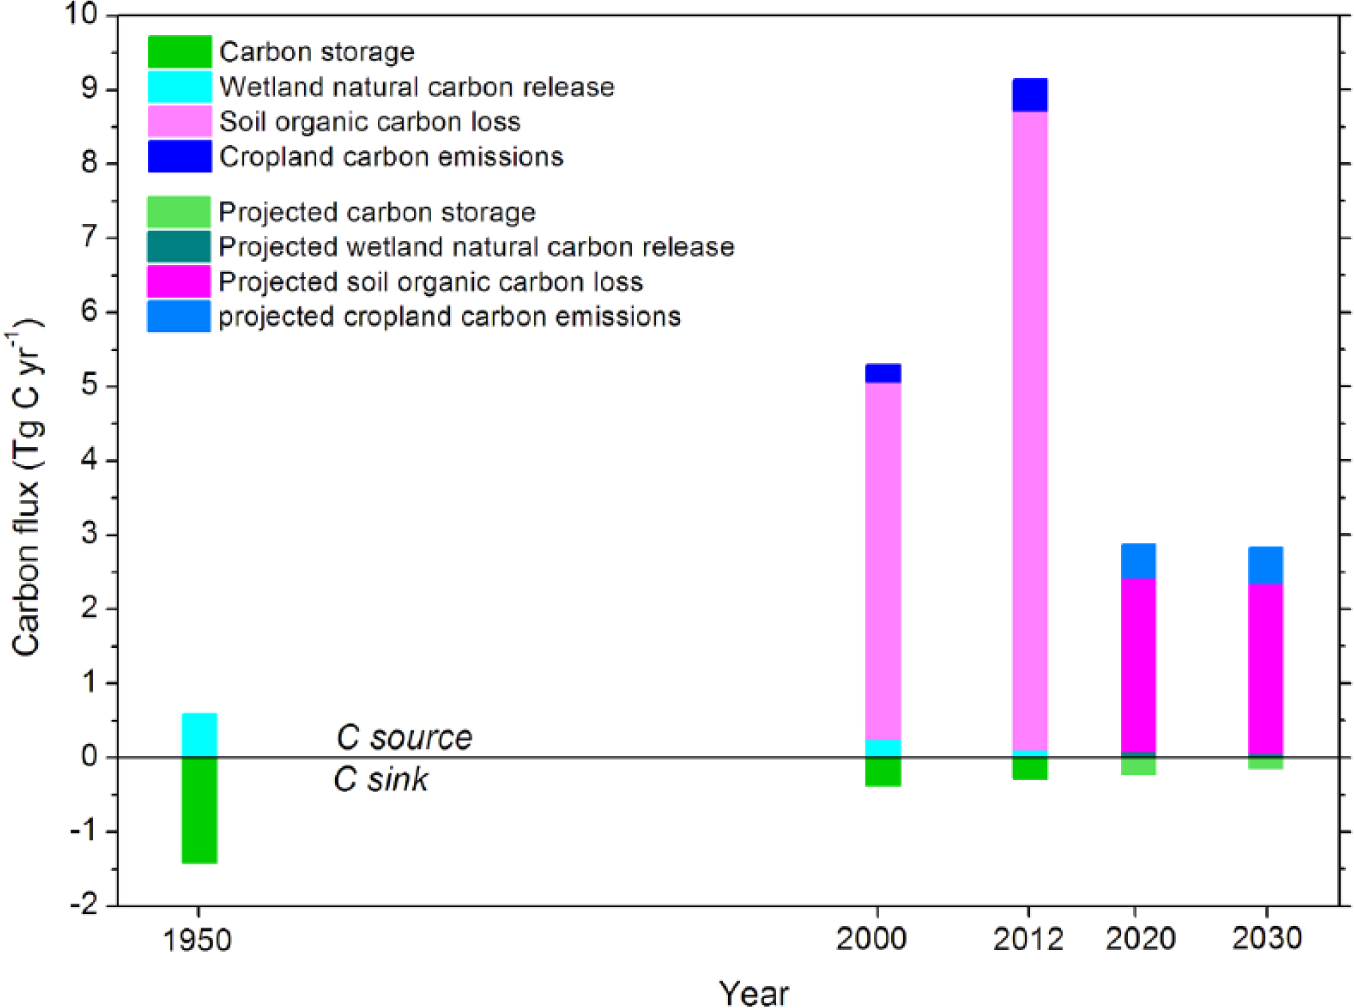
Modern human activities’ influence on the carbon flux of the Sanjiang Plain wetlands. Fluxes from 1950 (before large-scale human activities impact) are compared with present fluxes and future projections.
Human activities, together with the widespread warming on the SJP, may not only reduce the area of wetlands but also augment peatland C decomposition and CO2/CH4 emissions to the atmosphere and result in a positive feedback to climatic warming (Song et al., 2014; Wang et al., 2011). In addition to changes in C storage, the ecosystem services have also been degrading significantly (Bao et al., 2011). Therefore, it is essential to protect the remaining wetlands in the SJP. Fortunately, China has begun restoring the degraded wetland since the early 1990s (An et al., 2007) and the rate of degradation of the wetlands in the SJP has also decreased in recent years (Figure 4). Meanwhile, from 1985 to 2003, 17 National or Provincial Wetland Reserves was established in the SJP (Wang et al., 2011). Since 2005, the Chinese government has been implementing the National Wetland Conservation Program (NWCP) and the Degraded Wetland Restoration Program (DWRP), and their aims are to conserve natural wetlands and convert reclaimed low-yield croplands to natural wetlands (Wang et al., 2012). Furthermore, in the SJP, a number of wetland museums and wetland education centers have also been established and attracted millions of visitors, greatly enhancing public awareness of the ecological goods and service that wetland provides.
Conclusion
Using a synthesis of basal peat ages and detailed peat C accumulation records, we reconstruct the history of peatland development in the SJP since the Holocene. Our data synthesis indicated that peatlands began to form at the beginning of the Holocene across the SJP, followed by a general increase in the middle Holocene. However, our findings confirm that the most intense period of peatland initiation in the SJP occurred in the late Holocene, when the climate was colder and received less precipitation than the early and mid-Holocene. We attribute the delay of this most intense period of peatland development to the regional climate change and the local hydrology and topography characteristics that most peatlands in the SJP were initiated from terrestrialization. Due to this climate combination, the C accumulation rate has continued to increase since 4.5 ka, suggesting that the mechanisms controlling peatland initiation and CAR were probably similar in this region.
Furthermore, according to the Second National Survey of Wetland Resources data and new detailed records of peat C density, we estimated that the potential peatlands covered an area of about 10,520 km2 on the SJP and currently stores ~0.26 Pg C. Although the SJP peatlands have persisted as a carbon sink during the Holocene despite extensive changes in climate, they cannot withstand the pressure of modern human activities. Within recent decades, this important carbon sink has switched to a significant carbon source. If we do not protect the wetlands, it will further reduce in the SJP, and more carbon would be released into the atmosphere.
Footnotes
Acknowledgements
Sincere thanks to Yuedong Guo and Qian Cui for their useful help in study region map formatting. We are grateful to Dr Kunshan Bao for his useful help in peatland initiation process discussions. We also thank Zhenqing Zhang, Chuanyu Gao, and Haiyang Zhao for their laboratory and field work assistance. We also want to thank the editor and the anonymous reviewers for their constructive comments and suggestions that helped us improve this manuscript.
Funding
This research was supported by the National Basic Research Program of China (grant number: 2012CB956100), the National Natural Science Foundation of China (grant number: 41271209), the CAS/SAFEA International Partnership Program for Creative Research Teams (grant number: KZZD-EW-TZ-07), and the Knowledge Innovation Program of the Chinese Academy of Science (grant number: KZCX2-EW-319).