
Abstract
Mesic tree species such as Fagus grandifolia and Tsuga canadensis experienced multiple abundance declines in eastern North America during the last 8000 years, but the causes remain unclear. This paper presents a new sub-centennial record of Holocene vegetation, fire and sedimentological changes at Spicer Lake, IN, to test hypotheses about the role of fire and hydrological variations on shifts in vegetation composition. Four pollen zones are reported: Abies–Picea forests (15–11.8 ka BP), Pinus-dominated mixed forest (11.8–10.6 ka BP), transitional mixed forest (10.6–6.8 ka BP), and deciduous forest characterized by the expansion and high variability of F. grandifolia (after 6.8 ka BP). Macroscopic charcoal indicates five to seven fires between 6.1 and 4.4 ka BP and no fires between 4.4 and 2 ka BP, despite several large declines in F. grandifolia, and more fires after 1.8 ka BP likely linked to declining F. grandifolia abundances after 1.1 ka BP. Six peaks in mineralogenic sediments are suggestive of hydroclimate variability, but do not consistently correspond to shifts in F. grandifolia abundances. A Bayesian change-point analysis of 15 regional F. grandifolia pollen records identifies peak probabilities of events at 4.8 and 1.1 ka BP, similar in timing to variations in T. canadensis at other sites. Hence, fire can be ruled out as a driver of the mid-Holocene declines of F. grandifolia, but more work is needed to confidently establish the regional timing of F. grandifolia declines and to link them to past droughts and T. canadensis declines in eastern North America.
Introduction
The Holocene paleoecological record provides an opportunity for evaluating the sensitivity of ecosystems to hydrological variability during a warm state of the earth system (Ireland et al., 2012; Shuman, 2012; Wanner et al., 2008; Williams et al., 2011), which is critically needed given that hydrologic variability in the 21st century will exceed historical observations (Cook et al., 2010). In eastern North America, Holocene hydrological variations appear to have substantially affected forest ecosystems. During the early to mid-Holocene, forest-prairie ecotones and the composition of forest and grassland communities (Nelson et al., 2006; Shuman et al., 2002; Williams et al., 2010) shifted in response to a series of hydroclimatic changes ranging from orbitally paced changes in mid-continent aridity (COHMAP Members, 1988; Mason et al., 2004; Miao et al., 2007; Shuman et al., 2009a; Williams et al., 2010) to multi-decadal to centennial-scale mega-droughts (Booth and Jackson, 2003; Cook et al., 2007, 2010; Marsicek et al., 2013; Newby et al., 2014). In eastern North America, growing evidence indicates that hydrological variability during the Holocene facilitated a series of large and often abrupt shifts in abundances of mesic tree species in the northern United States and southern Canada (Booth et al., 2012a; Shuman et al., 2002, 2009b). In eastern North America, abrupt declines of mesic tree species during the Holocene have been best studied for eastern hemlock (Tsuga canadensis), with most hypotheses focusing on pest outbreaks or drought as the primary causal agents (Allison et al., 1986; Booth et al., 2012a; Davis, 1981; Marsicek et al., 2013; Shuman et al., 2001, 2004; Yu et al., 1997). However, the patterns of the T. canadensis declines were complex and the linkages between climate variability, disturbance agents such as fire or pathogens, and tree population dynamics remain unclear (Booth et al., 2012a). Fully understanding the patterns and causes of past abrupt declines in mesic tree species requires a network of well-resolved and well-dated paleoecological and paleoclimatic records that span the Holocene.
Here, we focus on the dynamics of American beech (Fagus grandifolia), a mesic temperate tree species that shares similar climatic tolerances and life history strategies with T. canadensis. It is either a dominant or co-dominant in the deciduous forests of the northeastern United States, and is often co-associated with T. canadensis (Graham and Grimm, 1990). F. grandifolia is well adapted to mesic soils, with a network of shallow roots, but experiences reduced growth rates under more xeric conditions, while its thin bark makes it sensitive to fire (Bennett, 1985; Burns and Honkala, 1990; Fritts, 1956; Nowacki and Abrams, 2008). F. grandifolia is distributed across the northeastern United States and southeastern Canada, reaching its western range limit in eastern Wisconsin and the Upper Peninsula of Michigan (Figure 1). The species arrived in the eastern Great Lakes region in the early Holocene and became widely abundant between 8.0 and 7.0 ka BP (Bennett, 1985; Shuman et al., 2002, 2009a; Williams et al., 2004), expanding into Wisconsin and northern Michigan during episodes between 7.5–5.0 and 3.0–2.5 radiocarbon ka BP (Woods and Davis, 1989). Prior work has shown widespread and sometimes abrupt declines in F. grandifolia pollen abundances in the Great Lakes region during the Holocene (Ogden, 1966). The available Holocene records for F. grandifolia suggest that the timing of declines were spatially complex: some studies in the Great Lakes region report declines in F. grandifolia during the mid-Holocene (Shane and Anderson, 1993; Williams, 1971), while other studies report increasing abundances of F. grandifolia in the Great Lake region (Bailey and Ahearn, 1981; Kerfoot, 1974) and coastal New England (Foster et al., 2006). This complexity contrasts with the mid-Holocene collapse of T. canadensis throughout its range, albeit with heterochronous timing (Booth et al., 2012a; Davis, 1981; Williams et al., 2004). However, most Holocene pollen records from the Great Lakes region were collected 30–40 years ago with inaccurate radiocarbon dates (Grimm et al., 2009) and low sampling resolution. This high temporal uncertainty leaves open the question of whether Holocene F. grandifolia declines were regionally synchronous or heterochronous at decadal- to centennial-time scales.

Fossil pollen sites in central or Midwest North America discussed in this study (red dots) overlaid on the distribution of Fagus grandifolia distribution at the time of early Euroamerican settlement (green shading) from the PalEON project (Goring et al., in review). Darker green indicates higher densities of F. grandifolia. The F. grandifolia distribution data are from PalEON Project. Fossil pollen sites were downloaded from the Neotoma Paleoecology Database, in May 2014: Silver Lake (1): 40.35°N, 83.80°W; East Twin Lake (2): 41.20°N, 81.33°W; Ladd Lake (3): 41.42°N, 84.75°W; Pretty Lake (4): 41.58°N, 85.25°W; Hudson Lake (5): 41.67°N, 86.53°W; Chippewa Bog (6): 43.12°N, 83.24°W; Demont Lake (7): 43.48°N, 85.00°W; Frains Lake (8): 42.33°N, 83.63°W; Vestaburg Bog (9): 43.42°N, 84.88°W; Wintergreen Lake (10): 42.40°N, 85.38°W; Seidel Lake (11): 44.45°N, 87.52°W; Gass Lake (12): 44.05°N, 87.73°W; Kellners Lake (13): 44.24°N, 87.85°W; and Irwin Smith Bog (14): 45.03°N, 83.61°W. Inset panel shows the image of Spicer Lake, IN, from Google Earth, and the red star indicates the core position in the lake.
Of these declines, the decline at 1.0–0.7 ka BP is the best documented (Booth and Jackson, 2003; Booth et al., 2012b; Campbell and McAndrews, 1993; Gajewski, 1987). Explanations for the late Holocene decline in F. grandifolia have invoked regional cooling (Gajewski, 1987), hydrological variability (Booth et al., 2012b), or Native American management of fire regimes (Clark and Royall, 1995). The regional extent of the late Holocene F. grandifolia decline and independent paleohydrological proxies in Michigan suggest that this decline may have been caused by enhanced hydrological variability (droughts) during the Medieval Climate Anomaly (Booth and Jackson, 2003; Booth et al., 2012b; Woods and Davis, 1989). A meta-analysis of pollen records in Ontario showed late Holocene F. grandifolia declines at all sites, but steeper rates of decline at sites near to archaeological sites (Munoz and Gajewski, 2010), suggesting that, at some locations, F. grandifolia declines may have been caused by increasing fire regimes by Iroquoian burning (Clark and Royall, 1995).
The causes of the abrupt declines of F. grandifolia (and T. canadensis) thus are still in discussion, and so far most work has focused on the last millennium rather than the earlier declines of the Holocene. More work is needed to assess and date these variations in the abundances of F. grandifolia; to put them in context of the moisture, temperature, and other environmental changes; and to evaluate the range-wide dynamics for comparison with those of T. canadensis and other mesic tree species in eastern North America.
Here, we present a new sub-centennial fossil pollen and decadal-scale charcoal and loss-on-ignition (LOI) records from Spicer Lake, IN (41°44′52″N, 86°31′19″W, 237 m elevation). The most notable features of these records are the pronounced variability in F. grandifolia during the middle and late Holocene, very low charcoal abundances prior to 1.8 ka BP and steadily increasing thereafter, and repeated spikes in mineralogenic sediments, suggestive of hydroclimate variability at Spicer Lake. We conduct a Bayesian change-point (BCP) analysis of the Spicer Lake record and other F. grandifolia records from the region to search for regional congruences in timing and compare the F. grandifolia dynamics in the Great Plains region to the history of hydroclimate variability and T. canadensis declines in New England (Marsicek et al., 2013; Newby et al., 2014). This work rules out fire as the cause of at least some of the mid-Holocene declines of F. grandifolia while providing suggestive but not conclusive evidence that the F. grandifolia declines were forced by hydrological variability. However, to test this hypothesis, more work is needed to better constrain the regional timing and patterns of declines in the abundance of F. grandifolia and to obtain additional proxies of hydroclimate variability during the Holocene.
Methods
Site description
Spicer Lake (41°44′52″N, 86°31′19″ W, 242 m) is located in New Carlisle, St Joseph County, northern Indiana, near the border with southwestern Michigan (Figure 1). It is a kettle lake formed by stagnant ice embedded in the glacial till left behind when the Lake Michigan Lobe of the Laurentide Ice Sheet retreated in Indiana ca. 15,000 years ago (Dyke et al., 2003). Much of the kettle has filled in, leaving 5 ha of open water remaining in the center, surrounded by swamp and wetland forests. Acer rubrum (red maple) constitutes the largest portion of the forest in the swamp (~80%) with some Salix nigra (black willow) and Fraxinus nigra (black ash). In the uplands, the most common trees are A. rubrum accompanied by Quercus rubra (northern red oak), Q. alba (white oak), Fraxinus nigra, Carya spp. (hickory), and Acer saccharum (sugar maple). Fagus grandifolia is present but uncommon. Sediments in the lowlands are mainly composed of silts, while in the upland forests, soil texture ranges from silts to coarse sands. Climates at Spicer Lake are continental, with a lake effect of heavy winter precipitation influenced by cold air passing over warmer lake water of Lake Michigan (Henne and Hu, 2010).
Basin bathymetry is somewhat asymmetrical (Figure 2), with the bathymetric center closer to the west side of the lake. We collected two 11-m gap-overlapped sediment cores in summer 2006 from the deepest portion of the lake using a modified 5-cm Livingston corer from an anchored floating platform. The sediment–water interface was 5.2 m below the water surface and was captured using a polycarbonate Bolivian tube adaptor on the Livingston. Cores were taken to the Limnological Research Center at the University of Minnesota for longitudinal splitting and photographing at high resolution. In Madison, the working half was cut into 1-cm thick segments to preserve the stratigraphic integrity of the sediments. All samples used in this analysis were subsampled from those segments.
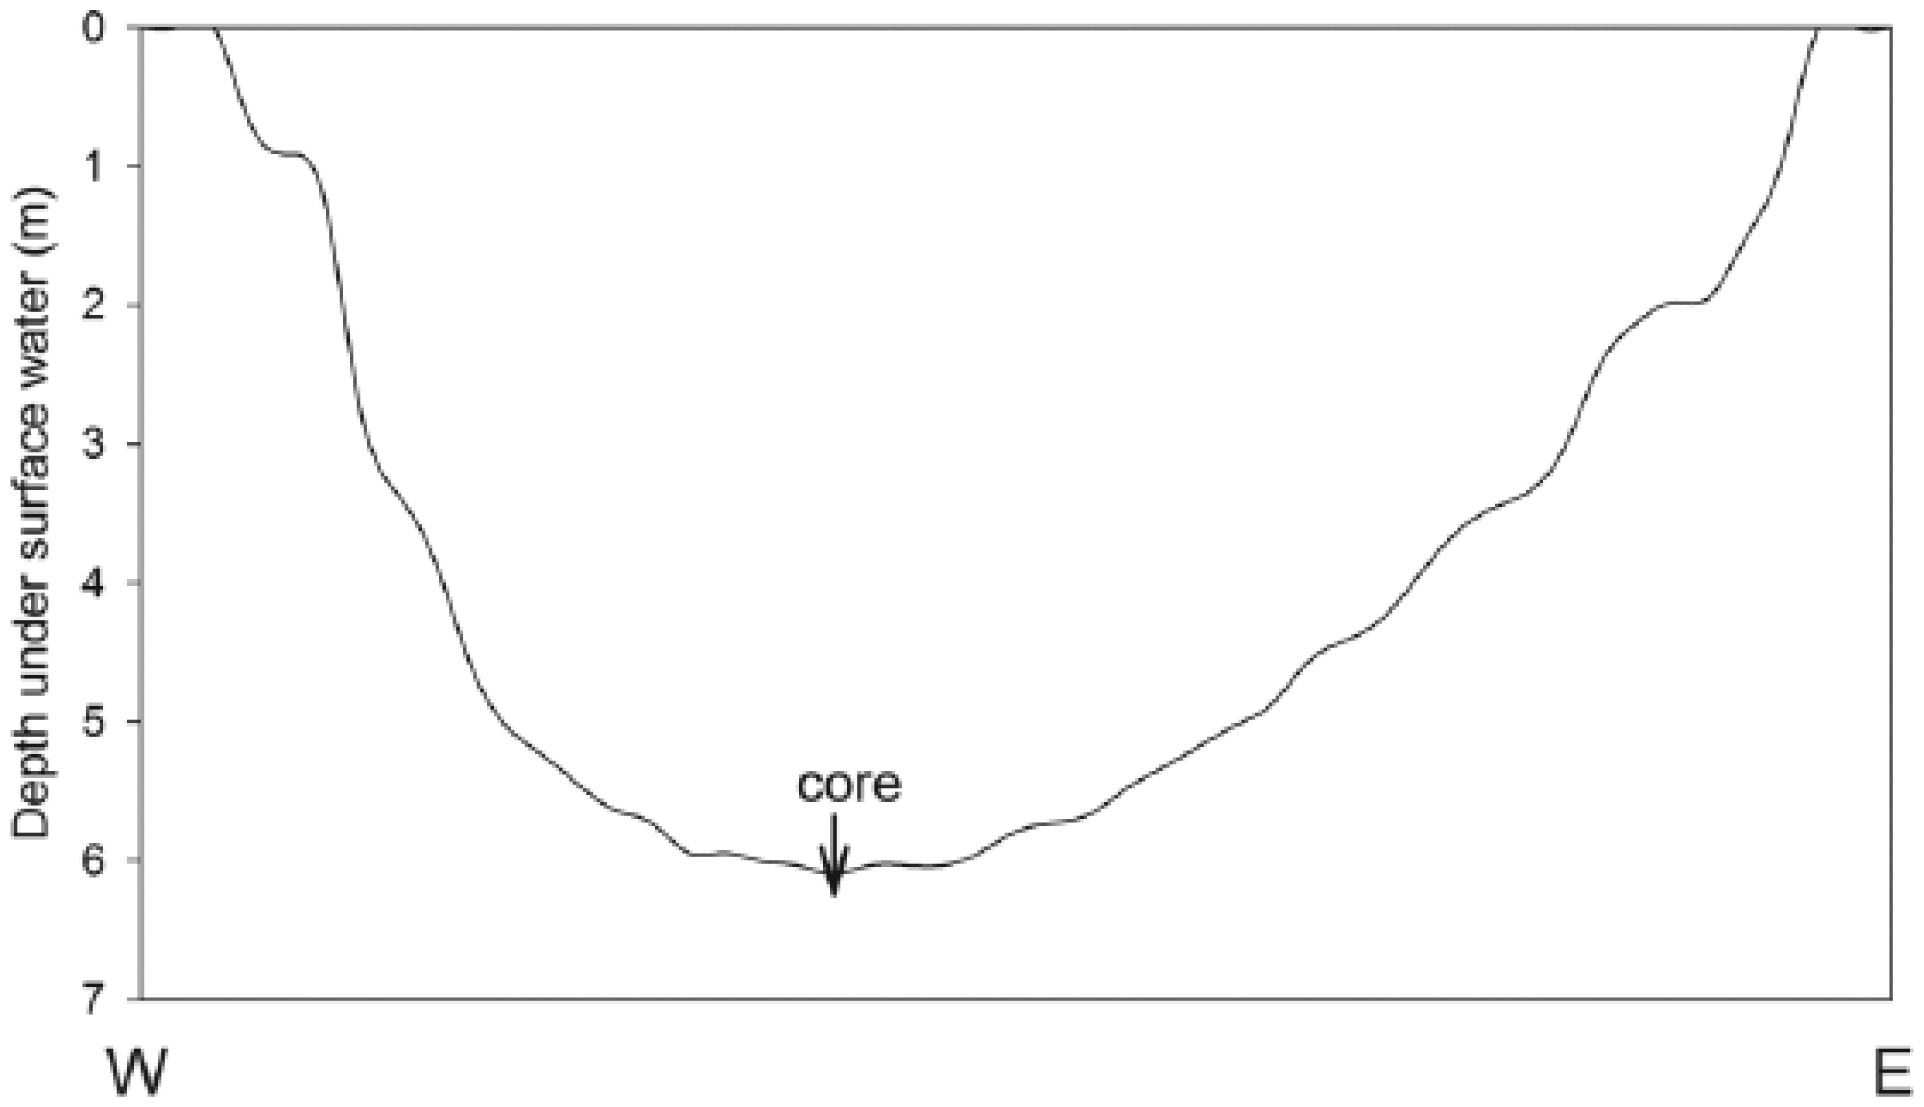
Bathymetric profile of Spicer Lake, based on field measurements. The core was taken from the bathymetric center of the lake.
Radiocarbon dates and age–depth model
We submitted 15 samples for accelerator mass spectrometry (AMS) radiocarbon dating at Spicer Lake (Table 1), from plant macrofossils, macroscopic charcoal, and pollen extracts. For plant macrofossil samples, sodium hexametaphosphate ((NaPO3)6) was used to disaggregate the sediments and macrofossils >1 mm were collected and viewed under the stereoscope to identify terrestrial ones for dating. For charcoal samples, we heated the samples in 6% hydrogen peroxide and picked particles using a synthetic fine-tipped paintbrush into DI water. Obtaining sufficient sample mass for accurate radiocarbon dating was a challenge with macroscopic charcoal and several samples were <5 µg. For pollen samples, we heated samples in 10% KOH to remove organic matter, separated particles heavier than 2 g/cm3 by sodium polytungstate (SPT), heated samples in HF to remove silicate mineral and sieved to retain pollen grains between 45 and 106 µm. Seven dates were acquired from the Center for Applied Isotope Studies (CAIS) at the University of Georgia, Athens; four from the Woods Hole Oceanographic Institution (WHOI); and four from the Keck Carbon Cycle Accelerator Mass Spectrometry Laboratory (Keck-CCAMS) at the University of California, Irvine. The Ambrosia increase at 32.5 cm was also used as a biostratigraphic age (Figure 4), which is interpreted to indicate European settlement in Indiana at 1820 AD (Whitney, 1996).
List of all radiocarbon dates at Spicer Lake.
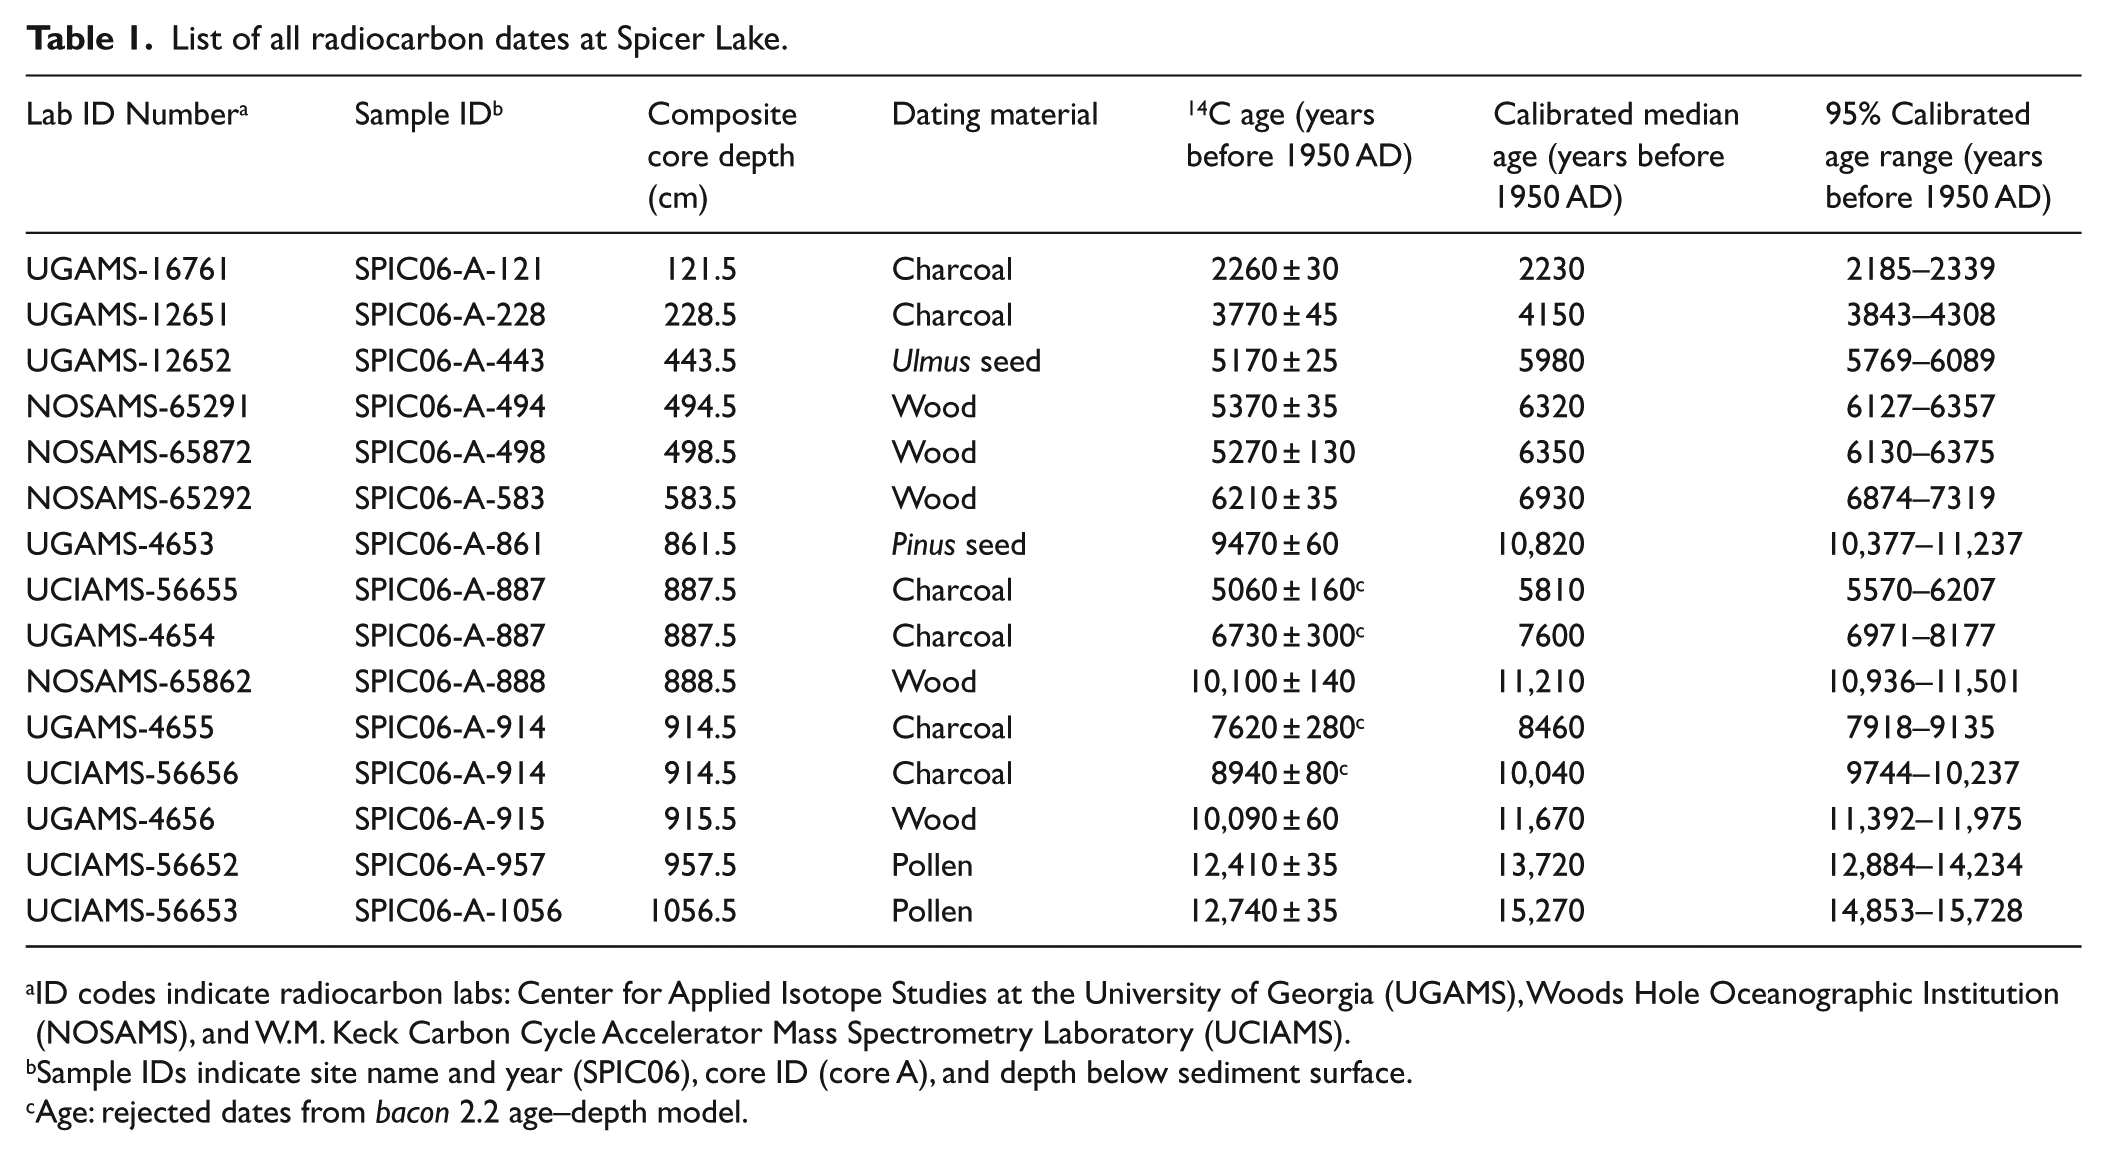
ID codes indicate radiocarbon labs: Center for Applied Isotope Studies at the University of Georgia (UGAMS), Woods Hole Oceanographic Institution (NOSAMS), and W.M. Keck Carbon Cycle Accelerator Mass Spectrometry Laboratory (UCIAMS).
Sample IDs indicate site name and year (SPIC06), core ID (core A), and depth below sediment surface.
Age: rejected dates from bacon 2.2 age–depth model.
An age–depth model, generated using bacon 2.2, was used to infer the time of deposition for sediments not directly associated with a 14C date (Blaauw and Christen, 2011). Parameters and priors include the IntCal13 calibration curve, postbomb curve as NH1, minimum year as −100 BP and maximum year as 50,000 BP in the model, sediment accumulation rate, and section length. The prior sedimentation accumulation rate (0.1 cm/yr) was based on rates from other lakes in eastern North America (Goring et al., 2012). Section length, which affects model complexity and computational speed, is set to 20 cm in this paper. All AMS radiocarbon dates were provided as inputs to bacon.
We also used bacon to recalculate the age–depth models for other pollen records in the Great Lakes region. For these records, the bacon model is based on the age controls provided by the Neotoma Paleoecology Database (http://www.neotomadb.org) – including all radiocarbon dates, core tops (set at the age of core collection), and the Ambrosia indicator of Euroamerican settlement. The radiocarbon dates are too old because of hardwater effects on bulk-sediment dates in Silver Lake, East Twin Lake, Ladd Lake, Frains Lake, Hudson Lake, Pretty Lake, and Wintergreen Lake (Grimm et al., 2009), but most of the original publications included corrections for hardwater effects. These corrections are included in the Neotoma database except for Frains Lake, where the hardwater effect was corrected in the publication (Kerfoot, 1974) but not in Neotoma. We used all hardwater corrections included in Neotoma and added the correction for Frains Lake. Hardwater corrections are helpful but imperfect because they assume that the size of the hardwater effect is constant through time. Bacon returns estimated calendar ages at a 1-cm interval. All ages reported here are calendar years before radiocarbon present (1950 AD).
Loss-on-ignition
Loss-on-ignition (LOI) is widely used to estimate the organic and mineral content in lake and mire sediments (Heiri et al., 2001). 1 cm3 samples were taken with volumetric syringes at continuous 1-cm intervals throughout the core. All samples were heated in a muffle furnace at 100°C overnight, at 550°C for 4 h, and at 1000°C for 2 h to calculate the fraction of weight loss from water, organic carbon, and carbonates at each temperature, respectively. The residue was weighed to calculate the mineral proportion.
LOI-measured peaks in mineral content in closed-basin kettle lakes often indicate past changes in lake level. Usually, peaks in mineralogenic sediments indicate lowered water levels, which cause increased rates of shoreline erosion and lowering of the depth at which fine organic sediments are deposited (Digerfeldt et al., 1992; Shuman et al., 2001). However, the relationship between LOI and lake level within single cores can be complex because shifts in basin morphology and water level can alter patterns of sediment focusing and deposition within a basin, causing some deposition sites within lakes to experience locally high rates of organic deposition during lowered lake-level stands (Shuman, 2003). Transects of cores and geophysical surveys can illuminate the relationship between within-core variations in LOI and lake level (Digerfeldt et al., 1992; Marsicek et al., 2013; Shuman et al., 2001). However, this study was not originally intended as a lake-level study, so here, we simply report LOI variations from a single core.
Charcoal
Charcoal is a paleoecological proxy for past fire activity (Higuera et al., 2007; Marlon et al., 2012). Here, we took 1 cm3 samples every centimeter from the top to 666 cm in the core for charcoal analysis during and prior to the period of F. grandifolia expansion, except for depths where all sediments were used up during sieving to find macrofossils for radiocarbon dating (41–52 and 161–163 cm). Samples were treated with hydrogen peroxide to destroy most organic matter, leaving charcoal intact. The fraction >125 µm were kept, dried, and counted. Macroscopic charcoal is mainly deposited in lakes via slopewash and short-distance aerial transport, and so offers a proxy of fires within the watershed around the lake (Peters and Higuera, 2007).
Charcoal peaks are interpreted to indicate one or several closely spaced fire events, while shifts in the background component of charcoal are interpreted to indicate longer term shifts in the rate of biomass burning, through increased fire frequency or severity (Brunelle and Whitlock, 2003). CharAnalysis program was used to find charcoal peaks of fire events in the paper (Higuera et al., 2009), and the windows to smooth charcoal records for estimating background charcoal accumulation was set as 500 years, while the time windows for picking up fire peaks was set as 50 years. The peaks were picked up from the background by the locally defined threshold in the ratios between interpolate rates and background rates using a Gaussian mixture model, with the probability larger than 0.95.
Pollen
Sediment samples for pollen analysis were taken using volumetric metal syringes. A total of 130 1-cm3 samples were taken at 8-cm intervals for pollen and spore analysis. All samples were scanned at 400× magnification (1000× magnification with oil immersion was used as necessary) and counted to at least 300 pollen grains. Identification was based on McAndrews et al. (1973) and Kapp et al. (2000), and reference materials in the lab. Aquatic types were rare and are not reported here. Most herbs were identified to the family level, except for Ambrosia and Plantago, which were identified to genus. Pollen abundance was expressed as percentage of the total of all arboreal taxa and terrestrial herbs.
Other pollen records from the western Great Lakes region (Ohio, Indiana, Wisconsin, and Michigan) with F. grandifolia were obtained from the Neotoma Paleoecology Database (http://www.neotomadb.org). Illinois was excluded because F. grandifolia is present only in NE Illinois, and in that region, only Volo Bog has a Holocene record and F. grandifolia has <2% abundances. Age–depth models for these records were updated using bacon as described above. All raw pollen counts were converted to pollen percentages in the same way as for Spicer Lake.
Change-point analysis: Changes in abundance of F. grandifolia
A combination of BCP analysis and the bacon age–depth model was used to identify the timing of changes in abundance in F. grandifolia at Spicer and other lakes in the region and to assess synchrony. The R package BCP (Erdman and Emerson, 2007) was used to identify the probability of change points in F. grandifolia abundances, defined as the probability that two adjacent data points have different mean values. We ran 1000 Markov Chain Monte Carlo (MCMC) iterations with a burn-in period of 100 iterations. The prior variance for BCP was set based on the average variance from all the Neotoma cores used in this study.
BCP assigns to each sample a probability of being a change point. This output was then passed to bacon to calculate the probability of a change point occurring within a 100-year time window, given the uncertainty in the age–depth model. A moving window of 100 years width was run every 10 years to calculate the mean probability of events for each window at Spicer and all regional cores. To analyze the likelihood of changes in F. grandifolia abundances occurring synchronously across records, we then calculated the geometric mean of a change-point event occurring across all records. We calculated a geometric mean rather than an arithmetic mean because the geometric mean is insensitive to differences among records in the baseline probability.
Results
Age–depth model at Spicer Lake
The bacon age–depth model ran successfully, with convergence (Figure 3). Bacon calculated a posterior accumulation mean rate of 0.1 cm/yr (i.e. 10 yr/cm) and a mean memory of 0.8, implying 80% autocorrelation in sedimentation rate between adjacent 1-cm depths (Blaauw and Christen, 2011). Four radiocarbon dates were identified by bacon as outliers because of their too-young ages (Table 1). These were all charcoal dates with very small sample size (<5 mg), and so at the edge of AMS detection levels (5 mg for charcoal) and susceptible to contamination by modern carbon. The top 10 m of the core extend back to 15.27 ka BP, with a sharp increase in accumulation rate at 13.7 ka BP, and a decrease at about 11.5 ka BP. The increase in accumulation rate occurs during a sedimentary transition in which mineral proportions decrease and organic carbon increases at about 11.5 ka BP too (Figures 3 and 4).
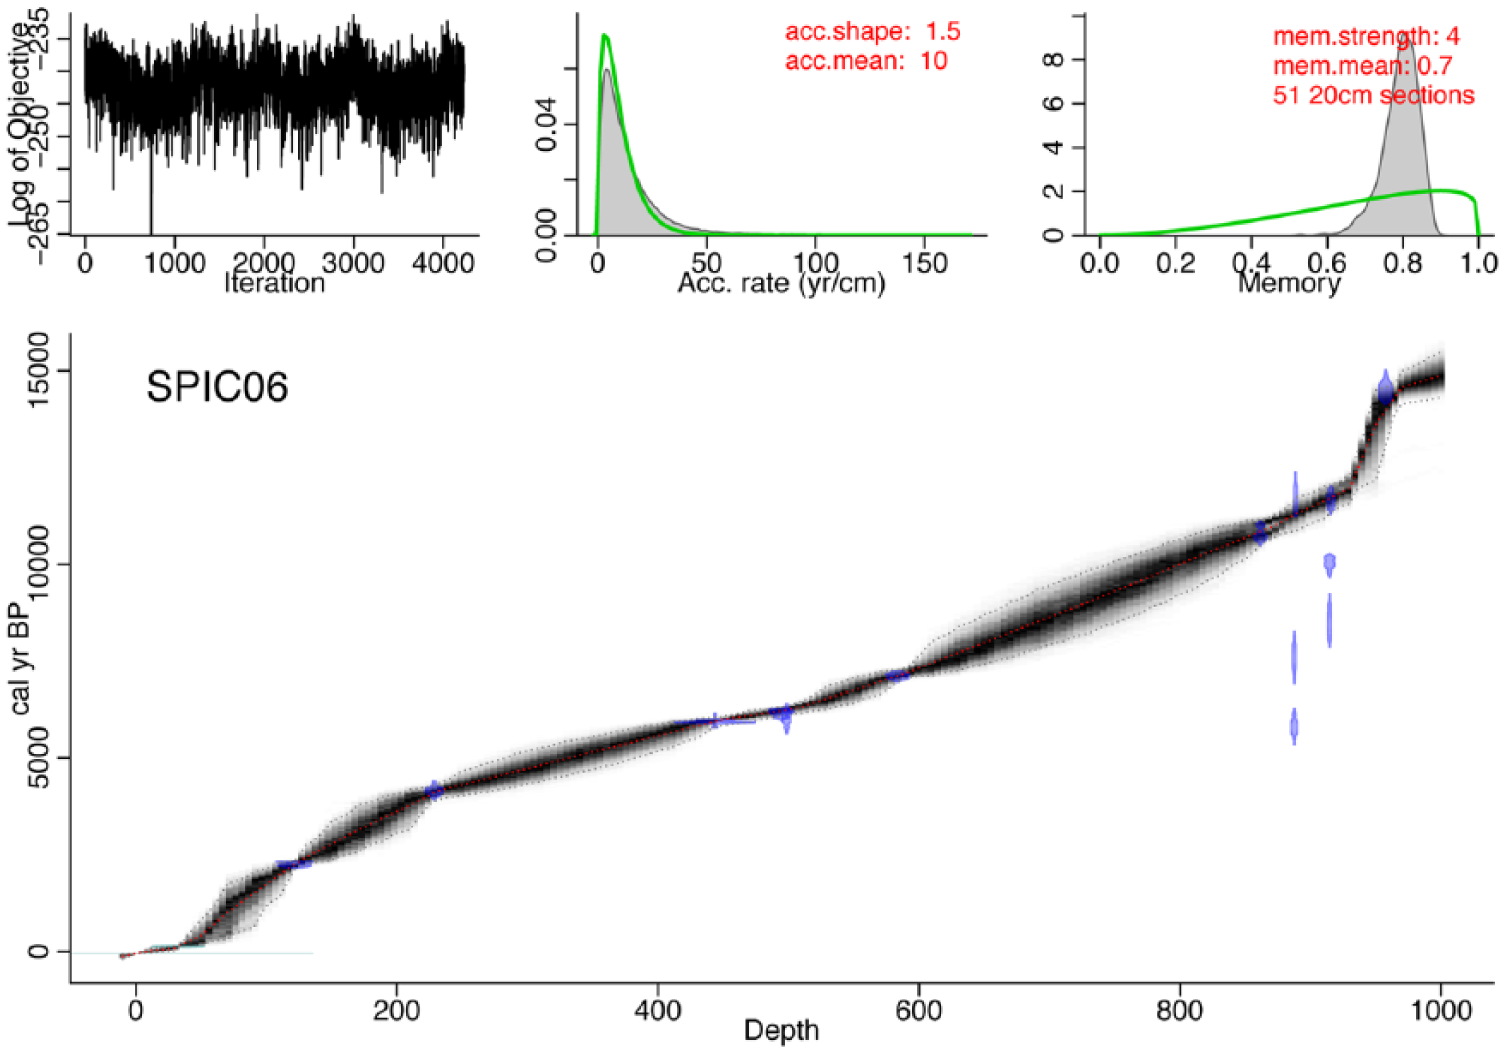
Age–depth model for Spicer Lake based on bacon (Blaauw and Christen, 2011). Upper left: the MCMC iterations, showing a stationary distribution with little structure among iterations. Upper middle: prior (gray curve) and posterior (filled gray curve) distribution of accumulation rates. The mean accumulation rate was set to 10 yr/cm. Upper right: the prior and posterior probability distributions for memory (i.e. autocorrelation strength). Lower plot: the bacon age–depth model. Individual radiocarbon dates are shown in probability density functions of calibrated ages. Four radiocarbon dates on small samples of charcoal were rejected by bacon as outliers, and likely are because of low weight under detection limits. The gray area indicates the uncertainty envelope of the age model with dashed lines indicating 95% confidence intervals.
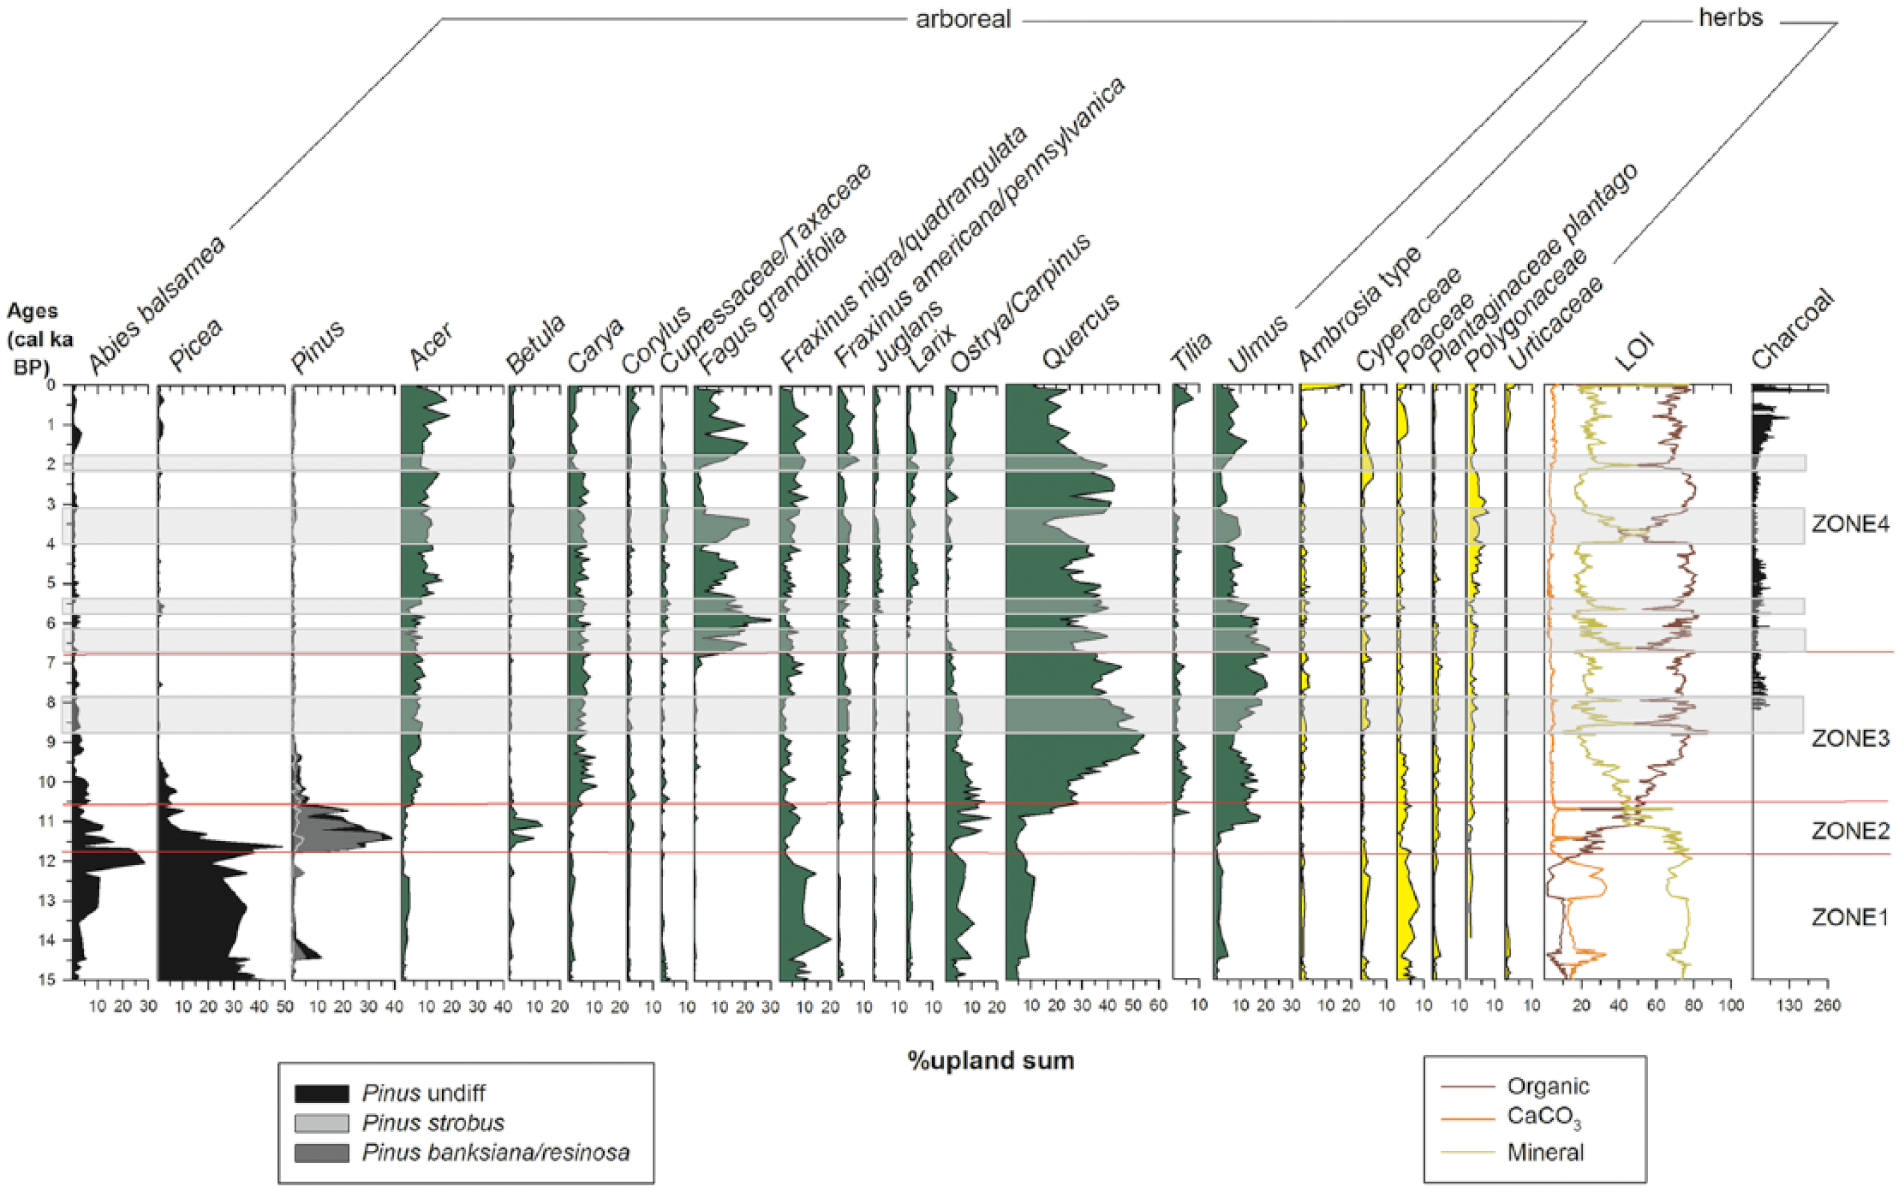
Stratigraphically constrained zonation of pollen percentages based from CONISS in the R package rioja (Juggins, 2012), LOI, and charcoal during the past 15,000 years at Spicer Lake. Only pollen types with percentages of at least 5% are included in the pollen diagram. Gray bars indicate periods when there is a mineral peak. Pollen analysts: Yue Wang and Jacquelyn Gill. LOI analysts: Shannon Hernandez, Jeremiah Marsicek, and Dominique Alhambra. Charcoal analyst: Anna Dierking.
Pollen and vegetation history at Spicer Lake
Eighty-six pollen and spore types were identified in the Spicer Lake sediments. Four zones were identified from the pollen abundances using CONISS in the rioja R package (Figure 4):
Zone 1: Abies–Picea, conifer forest, from about 15.0 to 11.8 ka BP. This zone had high abundances of pollen from conifer trees such as Abies and Picea. Among them, Picea was the most abundant, with pollen percentages close to 30%. Pollen from deciduous trees was rare: only Acer, F. nigra type, and Ostrya/Carpinus type were moderately abundant, with percentages that were lower than for conifer trees. Poaceae is abundant during this time period, with pollen percentages close to 10%. This zone is interpreted to represent a conifer forest or woodland with deciduous elements under mesic conditions.
Zone 2: Pinus–Abies–Picea–Ulmus, a mixed coniferous forest with high Pinus abundances from 11.7 to 10.6 ka BP. Conifer pollen types that were abundant during the previous interval, Abies and Picea, declined abruptly during this time period. Pinus pollen increased rapidly from less than 5% to near 40%, becoming the most abundant type. For deciduous trees, pollen taxa that were relatively abundant during the previous interval – Quercus, F. nigra type, and Ostrya/Carpinus – decreased during this time period, while Betula and Ulmus increased, Ulmus in particular, reaching about 20% of the total terrestrial taxa. Poaceae decreased to less than 5%.
Zone 3: Quercus–Ulmus–Abies, interpreted to represent a transitional mixed conifer–deciduous forest and deciduous forest from 10.6 to 6.8 ka BP. Pollen abundance of conifer trees – Abies, Picea, and Pinus – decreased to a relatively small component with less than 5% of the total terrestrial pollen sum, indicating fewer conifer trees during this time period. Quercus and Ulmus pollen abundances increased and gradually became the most abundant tree pollen taxa with relatively less abundant and more stable Ostrya/Carpinus-type, Acer, and Carya pollen. Herbaceous pollen remained rare. F. grandifolia began to appear in the pollen record at about 7.3 ka BP in low abundances.
Zone 4: Quercus–Ulmus–F. grandifolia, interpreted to represent a deciduous forest with the expansion of F. grandifolia from 6.8 ka BP to the present. High and fluctuating abundances of F. grandifolia pollen abundances was the defining feature of this interval, from less than 5% before 6.8 ka BP to near 30% at its maximum with several abrupt changes during the period. Other deciduous pollen types were still abundant: Quercus pollen abundance remained high but variable, with troughs corresponding to peaks in F. grandifolia; Ulmus pollen declined at about 6.0 ka BP and became relatively uncommon, near 7%, by the present; Ostrya/Carpinus type decreased gradually to less than 5%. Herbaceous pollen was still rare. This zone is inferred to represent a landscape dominated by stands of F. grandifolia, Quercus, and Ulmus, with F. grandifolia becoming an increasingly important but variable component.
The pronounced variability of F. grandifolia is the most striking signal of vegetation change at Spicer Lake during the middle and late Holocene. F. grandifolia abundances began to increase at 7.1 ka BP and rapidly increased to 18% between 6.8 and 6.7 ka BP, then remained high but fluctuating until 5.3 ka BP, when there is a large decline to near 5% in F. grandifolia abundances that persists for several centuries. F. grandifolia abundances then rose to about 15%, and declined to below 5% again between 4.3 and 4.0 ka BP. A third rise in F. grandifolia abundances began at 4.0 ka BP, peaked to 20% at 3.4 ka BP, then terminated with an abrupt crash to nearly 3% at 3.2 ka BP. F. grandifolia abundances then remained low below 3% between 3.2 and 2.0 ka BP. F. grandifolia abundances then rose again beginning at 2.0 ka BP, peaking to about 20% at 1.5 and 1.0 ka BP with a quick decline and increase at 1.2 ka BP, then quickly declined to about 10% after 1.0 ka BP until the EuroAmerican settlement era, when F. grandifolia pollen abundances decline to below 2%. Pollen accumulation rates were also calculated (Supplementary Figure 1, available online) but are not discussed further here because the pollen accumulation rates showed quite similar peaks and declines across all taxa, indicating a strong influence of background sedimentation rate on pollen accumulation rates.
LOI analysis
Organic carbon percentages in the lake sediment were low during the late-glacial period, then increased and remained high during the Holocene except when interrupted by brief declines (Figure 4). The general increase in organic carbon content during the Pleistocene–Holocene transition is consistent with other sites in the Great Lakes region and indicates increased lake productivity as temperatures rose (Shane and Anderson, 1993). During the Holocene, there are six sharp increases in mineral content and decreases in organic carbon (the gray bars in Figure 4): at 8.5–8.0, 6.6–6.4, 5.7, 4.0–3.3, 2.1 ka BP, and after European settlement (ca. 50 years BP). These LOI declines tend to be characterized by an abrupt initial peak in mineral content, followed by a gradual return to baseline values and are interpreted as decadal-to-centennial-scale pulses of mineralogenic sediments into Spicer Lake followed by settling and mixing into the sediment column.
Some of these peaks in mineral content were associated with shifts in the abundances of mesic elements such as F. grandifolia and Ulmus (Figures 4 and 7), although the correspondence is variable and more suggestive than conclusive. The first period of high mineral content (8.5–8.0 ka BP) occurred prior to expansion of F. grandifolia and forest composition was largely stable over this interval. The next peak of high mineral content (6.6–6.4 ka BP) was preceded by a rapid increase of F. grandifolia at 6.8 ka BP (Figures 4 and 7) with Quercus decreasing. This increase represents the first major expansion of F. grandifolia in the region, although this rapid rise in F. grandifolia was preceded by an earlier but more modest rise ca. 7.1 ka BP. A third and smaller peak in mineral content began at 5.7 ka BP and continued to 5.3 ka BP, associated with small declines in F. grandifolia and increases in Quercus and Acer, and a sharp decline in F. grandifolia and Ulmus following the peak. The fourth mineral peak (4.0–3.3 ka) was the largest and longest in the core and associated with a peak in abundances of F. grandifolia and Ulmus approximately synchronous to the mineral rise (Figures 4 and 7) with a slight Acer decreased during this period. The last period of high mineral content began around 2.0 ka BP and was followed by a rapid increase in F. grandifolia abundances after a period of prolonged low abundances. Ulmus abundances also increased, shifting the forest mix from an Acer–Quercus dominant forest to an Acer–F. grandifolia–Quercus–Ulmus dominant forest.
Charcoal variability
There are nine peaks representing fire events in the charcoal records by CharAnalysis, at 6.1, 5.7, 5.4, 4.8, 4.6, 2.4, 1.8, 1.3, and 0.8 ka BP separately (Figure 7). All fires appeared in the middle and late Holocene after F. grandifolia settlement. The abrupt and large increase of charcoal at 0.2 ka BP is not identified as a fire peak by CharAnalysis, perhaps because of the general high abundance of charcoal after 0.2 ka BP or the gap depths (41–52 cm) where no charcoal was counted because all sediments were used up for other analyses. Note that the charcoal data are reported here as concentrations (particles/cm3) instead of accumulation rates (grains/cm2/yr) to avoid the influence of background sedimentation rate on charcoal deposition, as discussed above for pollen accumulation rates.
Macroscopic charcoal peaks and data suggest at least five stages to the Holocene fire history at Spicer Lake. Between 8.2 and 7.4 ka BP, prior to the expansion of F. grandifolia, background charcoal was relatively high (average 35 particles/cm3) with few distinctive peaks, suggesting a fire regime characterized by frequent but low-severity fires. Between 7.4 and 4.4 ka BP, background charcoal dropped to 19 particles/cm3, with five distinct peaks, suggesting a shift to a fire regime characterized by less frequent but more severe fires. Between 4.4 and 1.8 ka BP, background charcoal dropped again to 13 particles/cm3, with only one distinct peak, suggesting that fires were almost absent during this period. This sequence of declining charcoal levels between 8.2 and 1.8 ka BP is consistent with a reduction in fire frequency caused by the expansion of F. grandifolia and establishment of a moist litter layer, increased humidity, and cool subcanopy microclimates not conducive to fire spread in stands of F. grandifolia (Godefroid et al., 2006). After 1.8 ka BP, charcoal abundances steadily rose. This rise is possibly as a result of Native American activity (Abrams and Nowacki, 2008) or linked to regional drought (Booth et al., 2012b). Globally, charcoal abundances rose between 3 and 2 ka, for reasons that remain unclear (Marlon et al., 2012). The large increase of charcoal abundances at 0.2 ka BP coincided with the increase in Ambrosia-type pollen, indicating a sharp increase of fire activity around the lake associated with EuroAmerican settlement and land use. The decline after 0.1 ka BP is presumably linked to establishment of agricultural fields and fire suppression.
‘Fagus grandifolia’ variability in the Great Lakes region
Using standard deviation as a simple index of temporal variability across these records (Table 2), Spicer Lake has a higher variability in F. grandifolia than all other sites except East Twin Lake. The high variability at Spicer Lake results from the high maximal abundances in F. grandifolia and the higher sampling resolution of the Spicer Lake record relative to most of other records in the area. This higher resolution allows the Spicer Lake record to pick up centennial- to millennial-scale variability in F. grandifolia that may be aliased in other records.
Standard deviation of Fagus grandifolia pollen abundance over the past 10 ka BP in the lakes across the Great Lake region.

The site listed in bold is the new site from this paper.
High variability in F. grandifolia pollen percentages during the Holocene appears to be a general but underappreciated phenomenon in this region; many other pollen records from the Great Lakes states (here, Ohio, Indiana, Michigan, Wisconsin) also show substantial variations of F. grandifolia pollen abundance during this time (Figure 5). Some of these events may correspond to events seen at Spicer Lake, although age uncertainties and wide sampling intervals at these other records (most of which were collected in the 1960s and 1970s with sampling resolutions ranging from 5 to 50 cm, Figure 5) make it difficult to confidently correlate events. The 5.3 ka BP decline at Spicer Lake may correspond to brief declines in F. grandifolia abundances at Ladd and Pretty Lakes in Indiana and possibly the low points in the coarse-resolution pollen records at Frains Lake, Vestaburg Bog, and Wintergreen Lake in Michigan. The second decline around 4.3 ka BP may correlate to F. grandifolia declines in Ladd Lake, Pretty Lake, Chippewa Bog, Demont Lake, Seidel Lake, and Kellners Lake pollen records, and may correlate to the 4.2 ka BP drought reported elsewhere (Booth et al., 2005; deMenocal, 2001; Marsicek et al., 2013; Newby et al., 2014; Stahle et al., 2000). The prolonged period of low F. grandifolia abundances at 3.3–2.0 ka BP at Spicer Lake has no clear counterpart in the Great Lakes region, but other sites show similar periods of prolonged low F. grandifolia abundances lasting more than 1000 years, but the apparent timing of these lows varies among sites (Pretty, Ladd, Frains, Demont, and Hudson Lake) (Figure 5).

Fagus grandifolia pollen abundances from Holocene records in the north-central United States (see Figure 1 for locations). F. grandifolia pollen data were obtained from the Neotoma Paleoecology Database (http://www.neotomadb.org); the original citations are Silver Lake (Ogden, 1966), East Twin Lake (Shane and Anderson, 1993), Ladd Lake (Shane and Anderson, 1993), Spicer Lake, Pretty Lake (Ogden, 1969), Hudson Lake (Bailey, 1973), Chippewa Bog (Bailey and Ahearn, 1981), Demont Lake (Neotoma database), Frains Lake (Kerfoot, 1974), Vestaburg Bog (Gilliam et al., 1967), Wintergreen Lake (Manny et al., 1977), Seidel Lake (West, 1961), Gass Lake (Webb, 1983), Kellners Lake (Goodwin, 1976), and Irwin Smith Bog (Booth et al., 2012b). Gray bars suggest declines in F. grandifolia at Spicer Lake.
The decline after 1.5 ka BP corresponds to the late Holocene decline in F. grandifolia across the region (Booth et al., 2012b), although the western distribution front of F. grandifolia was also expanding in upper Michigan and eastern Wisconsin during this interval (Davis et al., 1986). Note that the absence of F. grandifolia pollen in Chippewa Bog during this time interval is because of a gap in the pollen record, caused by sand deposition on top of the bog (Bailey and Ahearn, 1981).
Assessing synchrony of changes in ‘Fagus grandifolia’ in Great Lake region
The probability of change-point events varies widely in magnitude and pattern across the region, except for a uniformly high probability of a change-point event in the 1800s, because of European settlement (Figure 6). At Spicer and Ladd Lakes, the probability of events increased at 7 ka BP and peaked at ca. 6.3 and 4.0 ka BP. A peaked probability of change points roughly centered on 4 ka BP was apparent at Spicer, Ladd, Pretty, Hudson, Chippewa, and Demont Lakes. Spicer and several other sites (Pretty, Hudson, Kellners, Chippewa, and Frains) show an increase in the probability of change-point events after 2 ka BP, suggesting increased variability in F. grandifolia over the last two millennia.

Probability of change points in the abundances of Fagus grandifolia occurring within a moving 100-year window, at all sites in the Great Lakes region during the past 10,000 years. Change-point probabilities are calculated using the BCP package in R (Erdman and Emerson, 2007) then passed to bacon to calculate the probability of a change-point event occurring within a 100-year window, given both the BCP probability of event and the bacon estimate of temporal uncertainty.
Across all sites, the geometric mean probability of change points (Figure 7d) shows peaks centered at 4.8 ka BP, 2.1 ka BP, 1.1 ka BP, and the last 150 years. The last peak (150 years ago) is clearly because of Euroamerican land use. The peaks at 4.8 and 1.1 ka BP correspond to periods of widespread declines in F. grandifolia, while the peak at 2.1 ka BP corresponds to increases in F. grandifolia in some sites. These regional peaks may be signals of common climatic forcing, which we discuss further below. The mean probability of detecting an event across all sites is not very high, with peaks around 20% (Figure 7d). This probability is low in part because of the high temporal uncertainty in most of the other Holocene records and because of the use of a narrow window (100 years).

Events across sites during the past 10,000 years: (a) Charcoal records at Spicer Lake; (b) Mineral content at Spicer Lake; (c) Fagus grandifolia pollen abundance at Spicer Lake; (d) Geometric mean probability of a change point in the abundances in F. grandifolia within a 100-year window during the past 10,000 years, calculated across all records shown in Figures 5 and 6; (e) Relative pollen abundances of Tsuga canadensis at Deep Pond, MA (Marsicek et al., 2013). The gray bars indicate periods when there is a mineral peak, and dashed lines indicate fire events.
Discussion
‘Fagus grandifolia’ variability in Great Lakes region
The Spicer Lake record demonstrates strong variances in abundances of F. grandifolia and other tree genera during the middle and late Holocene in the Great Lakes region (Figure 4). Hence, this record suggests that the well-known decline in F. grandifolia during the late Holocene (Booth et al., 2012b) is not a unique event, but rather part of a series of rises and declines in F. grandifolia since its early Holocene expansion. A similar degree of variability is apparent at records throughout the region, with repeated declines and expansions of F. grandifolia populations occurring throughout the middle and late Holocene (West, 1961) (Figures 5 and 6, Table 2). Some declines lasted for over a millennium, such as the decline at Spicer from 3.2 to 2.0 ka BP, and the low from 4.8 to 2.4 ka BP at Pretty Lake (Ogden, 1969); other declines lasted on the order of a few centuries, such as the decline at 6.3, 4.3, and 1.0 ka BP at Spicer Lake and other sites (Figure 5).
The synchrony and change-point analyses indicate peaks in the probability of change-point events at 4.8, 2.1, and 1.1 ka BP, which suggest a common forcing to these regional shifts in F. grandifolia abundances. However, as a general rule, the timing and duration of declines tend to vary across sites. Four hypotheses exist for this apparent asynchrony: (1) F. grandifolia declines were caused by local fire events and post-fire succession, with strong stochasticity and weak or no climatic forcing. (2) These declines were caused by other asynchronous agents of stand turnover such as pathogen outbreaks and wind disturbance, also unforced by climate. (3) Hydroclimate variability may be spatially variable and/or the sensitivity to climate variability may be governed by local thresholds (Williams et al., 2011). (4) These may in fact be synchronous events but offset because of different temporal resolutions (Liu et al., 2007), large gaps between radiocarbon dates, uncertainties of biostratigraphic dates, and potential radiocarbon errors – carbonate contamination of the bulk sediments used at some of the earlier records, for example – that limit our ability to evaluate the synchrony of the events across the sites. More well-dated Holocene records are critically needed to better assess the timing and spatial coherence of F. grandifolia declines, in combination with independent paleohydrological and fire proxies, and thereby understand the causes of these past F. grandifolia dynamics.
Role of fire in ‘Fagus grandifolia’ variability at Spicer Lake
F. grandifolia is a fire-sensitive species, highly vulnerable to injury by fires because of its thin bark and large shallow roots (Bennett, 1985; Nowacki and Abrams, 2008; Tubbs and Houston, 1990). The establishment of forests composed of Acer spp., Betula spp., and F. grandifolia can locally cast heavy shade and limit air movement, changing understory microclimate and thereby suppressing fires and producing fire regimes characterized by very rare frequency and low severity (Nowacki and Abrams, 2008). This is consistent with the decline in background charcoal and fewer fire events after the increase in F. grandifolia pollen abundances at Spicer Lake (Figure 4), suggesting that the middle Holocene expansion of F. grandifolia was an important regulator of regional fire regimes.
There is no evidence that the large abrupt declines in F. grandifolia at Spicer Lake during the middle Holocene were caused by fires. None of these declines match to fire events, and the F. grandifolia declines at 4.3 and 3.2 ka BP occur during an apparent fire-free interval at Spicer Lake (Figure 7). There is some evidence, however, that the five peaks in charcoal abundance between 7.4 and 4.4 ka BP (interpreted to indicate fire events) do correspond to small and transitory declines in F. grandifolia (Figure 7). If so, this may indicate that fires between 7.4 and 4.4 ka did trigger local mortality and successional recovery of F. grandifolia populations, but were not responsible for the larger declines in F. grandifolia populations (Figure 7). The decline in F. grandifolia after 1.1 ka BP closely corresponds to rising charcoal abundances. We are unaware of any archaeological studies in the vicinity of Spicer Lake, but this pattern of rising charcoal abundances and declining F. grandifolia is consistent with other sites where anthropogenic shifts in fire regime are invoked as a cause of late Holocene F. grandifolia declines (Clark and Royall, 1995; Munoz et al., 2010). Hence, fire appears not to have been the driver of the large F. grandifolia variations at Spicer Lake during the middle Holocene, but may have been an important agent from 1.8 ka BP onwards.
Role of hydrological variability in ‘Fagus grandifolia’ variability
Several lines of evidence suggest (but do not conclusively demonstrate) that the large variations in F. grandifolia during the Holocene in the Great Lakes region were caused by hydrological variability: (1) the known sensitivity of F. grandifolia to soil moisture availability (Burns and Honkala, 1990; Fritts, 1956); (2) the peaks in mineralogenic sediments at Spicer Lake; (3) the evidence of multiple declines in F. grandifolia at other sites, with apparent peaks in probability of events at 4.8, 2.1, and 1.1 ka; and (4) growing evidence linking past declines in T. canadensis, another mesic tree species, to hydrological variability (Marsicek et al., 2013; Shuman et al., 2004, 2009b).
The peaks in mineralogenic sediments at Spicer are suggestive of lowered lake levels or enhanced eolian activity, but the relationship between these peaks and F. grandifolia declines is complex (Figure 7). Typically, high proportions of mineralogenic sediments and low proportions of organic carbon within Holocene portions of kettle lakes are indicative of lowered water levels with relatively lower vegetation productivity, lowered sediment limit, and higher eolian activity in the lake region (Digerfeldt et al., 1992; Shuman et al., 2001). However, in some lakes, a wide perimeter of wetland vegetation can limit near-shore erosion during low-water phases, while lowered lake level can enhance sediment focusing and rates of deposition of organic sediments in lake centers (Shuman et al., 2004). Hence, it can be difficult to reconstruct hydrological changes from LOI changes in a single core. The correspondence varies between LOI changes and F. grandifolia shifts at Spicer Lake. Some mineral peaks correspond to increases in F. grandifolia, such as the peak from 6.6 to 6.4 ka BP and from 4.0 to 3.3 ka BP, while other mineral peaks correspond to decreases in F. grandifolia, such as the peak at 5.7 ka BP and decreases in F. grandifolia following. The inconsistent correspondence between LOI changes and F. grandifolia variability and the complex relationship between LOI variations and hydrological events together make it difficult to confidently determine climate events at Spicer Lake, although the LOI record is suggestive of past hydrological variability.
The peaks in the probability of change-point events at 4.8, 2.1, and 1.1 ka BP suggest a common forcing driving regional shifts in F. grandifolia abundances in the Great Lakes region. At sites in Michigan, the decline at 1.1 ka BP ago has been linked to episodes of dryer conditions, based on independent testate amoebae records at Minden and Irwin Smith Bogs in Michigan (Booth et al., 2012b). Tree-ring records and other high-resolution proxies also indicate enhanced hydroclimatic variability during the Medieval Climate Anomaly in North America (Booth et al., 2006; Cook et al., 2004, 2010). However, enhanced fire regimes may still explain some of these declines, as discussed before, either as a separate driver of F. grandifolia variability at individual sites or in synergy with regional drying, similar to the declines in F. grandifolia and T. canadensis in Northeast at 0.6 ka BP likely driven by a regional, multi-decadal drought and associated fires (Clifford and Booth, 2015).
High-resolution records of hydroclimatic variability in the Great Lakes region during the mid- to late Holocene are scarce. At Crawford Lake in Ontario (Yu et al., 1997) and Irwin Smith Bog in Michigan (Booth et al., 2012a), declines in T. canadensis at 4.8 ka correspond to locally drier conditions, although at Irwin Smith Bog, the T. canadensis declines lead the amoebae signal of drying by 200 years (Booth et al., 2012a). Ogden (1969, 1977) linked mid-Holocene declines in F. grandifolia at Silver Lake, OH, and Pretty Lake, IN, to the ‘Xerothermic Interval’ and the eastward expansion of the prairie-forest border during the Holocene (Bennett, 1985; Ogden, 1969, 1977; Williams et al., 2009). OSL dates of dune sands in western Illinois indicate a peak in dune activity between 6 and 4 ka BP, possibly indicating dryer conditions (Wang et al., 2012) or enhanced variability. Rebound-corrected lake-level records from Lake Michigan show high water levels between 5 and 4 ka BP (the Nipissing II transgression), between 3.2 and 2.3 ka BP (the Algoma high-water stand) and between 1.8 and 1.3 ka BP (Baedke and Thompson, 2000); the first and third high-water stands of Lake Michigan correspond to peaks in F. grandifolia at Spicer Lake, while the Algoma HWS corresponds closely to the low in F. grandifolia abundances between 3.2 and 2.0 ka BP. However, given the large watersheds of the Great Lakes region, the Lake Michigan high stands may not represent the hydroclimate of the area near Spicer Lake. Records of δ18O of calcite from lake records in northern Michigan suggests the development of lake-effect snows between 9.5 and 5.5 ka BP (Henne and Hu, 2010), roughly coinciding with the expansion of F. grandifolia in the Great Lakes region (Figure 5).
In many ways, F. grandifolia variability in the Great Lakes region resembles T. canadensis variability in the Great Lakes and New England. T. canadensis was once thought to have a single major range-wide decline at 5.5 ka (Bennett and Fuller, 2002), but more recent evidence has demonstrated a series of abrupt declines in T. canadensis abundances that were particularly pronounced between 6 and 4 ka (Marsicek et al., 2013). Lake-level reconstructions, isotopic data, and testate amoebae have shown that these T. canadensis declines correspond to a transition to drier conditions, with strong correspondences between local drying and T. canadensis declines at some sites (Marsicek et al., 2013; Newby et al., 2014; Shuman et al., 2004, 2009b) and looser at others (Booth et al., 2012a). Some declines in T. canadensis may directly correspond to the observed declines in F. grandifolia. At Deep Pond, MA, the decline in T. canadensis at 4.9–4.5 ka BP corresponds to the 4.8 ka BP F. grandifolia decline across the Great Lake region, and the decline in T. canadensis at 1.2 ka BP corresponds to the 1.1 ka BP F. grandifolia decline (Figures 5 and 7c). However, some sites occupied by both F. grandifolia and T. canadensis show divergent dynamics; for example, at Crawford Lake, Ontario F. grandifolia abundances remain high when T. canadensis declines (Yu et al., 1997), while in southern New England, coastal abundances of F. grandifolia increase at the same time as T. canadensis declines inland (Foster et al., 2006). Overall, these similarities in F. grandifolia and T. canadensis dynamics suggest a common forcing, likely hydrological, but with complex ecological responses. More work is needed to understand whether these complexities are caused by spatial heterogeneity in hydrological variability; interspecific interactions between T. canadensis, F. grandifolia, and other species; or other factors.
Implications for contemporary climate impact assessments
Biogeographers and ecologists often assume that ecotonal populations are closer to their tolerance limits and hence are more sensitive to environmental variability than populations in the range center (League and Veblen, 2006; Wasson et al., 2013). Late-Quaternary paleoecological records, however, tend not to support this hypothesis (Gajewski, 1987). High variability in F. grandifolia abundances is apparent in all records from the Great Lakes region (Figure 5, Table 2). There is no indication that sites more centrally located within the species range (Figure 1) are more buffered than populations at the range margin (e.g. Gass and Seidel Lakes, WI). Instead, sites with higher abundances of F. grandifolia pollen and more centrally located within the range (Figure 1) have higher variability than marginal sites in Wisconsin (Table 2). Yet the higher variability is also potentially caused by higher abundance of F. grandifolia in distribution center, and it may also suggest that the current and future effects of hydroclimatic variability on tree population dynamics are not limited to ecotones (Allen et al., 2010).
Conclusion
Large variations in F. grandifolia are observed at Spicer Lake and at other lakes in the Great Lakes region. The timing and patterns of variability appear to vary substantially among sites, but low sampling resolution and uncertainties in the age–depth models from these other sites (most of which were collected 30–40 years ago) make it difficult to confidently establish or rule out synchrony. At Spicer Lake, F. grandifolia declines are observed at 6.3, 5.3, 4.2, 3.3 (with a low lasting until 2.0 ka BP), 1.5, and 1.1 ka BP. Charcoal records decline in background concentrations and frequency of fire events at F. grandifolia expansion, likely indicating suppression of fire by the establishment F. grandifolia stands and associated microclimates. Charcoal concentrations are near zero during the mid-Holocene declines of F. grandifolia, suggesting that fire is not a driver, but charcoal concentrations gradually increase before the late Holocene decline of F. grandifolia, suggesting that enhanced fire regime may have contributed to this decline. LOI variations at Spicer Lake and other research work indicate substantial hydroclimatic variability in the Great Lakes region, but more work is needed to link these events to F. grandifolia variability. Similar patterns of variability in other mesic tree species in eastern North America suggest common sensitivity to hydroclimatic variability that is pervasive across the range of these tree species, and not limited to range margins.
Footnotes
Acknowledgements
This manuscript was greatly improved by comments from three anonymous reviewers and by discussions with Jessica Blois, Simon Goring, Samuel Munoz, and other members of the Williams lab. Samuel Lucas and Tom Minckley helped with fieldwork, and Shannon Hernandez and Dominique Alhambra assisted with the loss-on-ignition analyses. We are particularly grateful to Michaele Klingerman and members of the St Joseph County Parks for enabling access to Spicer Lake and for transportation backup when our truck broke down.
Funding
This work was supported by the US National Science Foundation (DEB-0716471) and the University of Wisconsin–Madison’s Climate, People, and Environment Program at the Center for Climatic Research.