
Abstract
In this study, we reconstruct the recent environmental evolution of the inner Cadiz Bay using sedimentary records reaching back as far as AD 1700. We report lithological descriptions of the sediments and extensive mineralogical and geochemical analyses. An extraction technique that identifies different Fe phases provides an assessment of diagenetic alteration, which allows an estimation of the original organic matter inputs to the inner Cadiz Bay. Downcore variations in Corg/N ratios, δ13Corg and δ15N are related to changes in organic matter sources and the trophic state of the water column. The downcore records of selected trace metals (e.g. Pb, Zn and Cu) are interpreted to reflect changes in heavy metal pollution in the bay, while records of other elements (e.g. Mn and P) are likely overprinted by diagenetic alteration. Major environmental shifts took place during the 20th century, when the population around Cadiz Bay increased exponentially. Increases in sediment accumulation rates, organic matter inputs and heavy metal contents, in parallel with increases in δ13Corg and δ15N over this period, are interpreted as direct effects of the increasing anthropogenic influence in the area. The results of this study suggest that multiproxy approaches and detailed consideration of diagenetic overprinting are required to reconstruct past environmental conditions from coastal sediments.
Keywords
Introduction
Sedimentary records are valuable environmental archives, allowing reconstruction of ecosystem development over time. Fine-grained sediments from marine basins and sedimentary rocks are typically used to study climate and oceanographic changes in the geologic past (Sageman and Lyons, 2005, and references therein). In contrast, paleoecological studies more commonly use lacustrine (Giralt et al., 2011; Lami et al., 2010; Martín-Puertas et al., 2009) and coastal sediment records (Covelli et al., 2006; Di Leonardo et al., 2012; Lepland et al., 2010), which allow environmental changes to be studied on decadal to sub-decadal timescales. The high temporal resolution of such sediments allows natural changes to be distinguished from those produced by anthropogenic influence, for example, eutrophication, coastal hypoxia or metal contamination (Church et al., 2006; Ellegaard et al., 2006; Zimmerman and Canuel, 2000). However, historical paleoecological reconstructions are frequently applied to recent sediments that still contain significant amounts of potentially degradable organic matter (OM). Under these conditions, post-depositional processes related to OM remineralization often alter primary geochemical signals preserved in the sediment (Chen et al., 2008; Spencer et al., 2003; Tribovillard et al., 2006). Elements such as C, P, N and S, along with various metals, can be remobilized within the sediment column, potentially making their sedimentary records unreliable for paleoenvironmental reconstructions. Hence, complementary studies of early diagenetic processes and their effects are required in such sediments.
Coastal sediments are considered good inventories of historical contamination from both the hinterland and the coast (Ridgway and Shimmield, 2002). However, these areas are frequently affected by artificial reworking (e.g. shell fishing, dredging and harbour operations) that can create hiatuses in sedimentary records. The identification of such discontinuities requires specific geochemical techniques in addition to mineralogical and textural analyses (Lepland et al., 2010; Ridgway et al., 2000). In fact, the diagenetic overprint caused as a result of these discontinuities can be even more pronounced than that produced by steady-state early diagenetic processes (Deflandre et al., 2002; Mucci and Edenborn, 1992; Mucci et al., 2003). The recognition of secondary diagenetic alteration is crucial for a robust environmental interpretation.
Cadiz Bay (SW Spain), with a population of almost 700,000 people in its direct vicinity, has been an important industrial location for many years (e.g. shipbuilding, offshore structure and aerospace components manufacture). Eutrophication levels (Establier et al., 1990; Gomez-Parra and Forja, 1992) and heavy metal contamination (Ligero et al., 2002) increased in Cadiz Bay over the last few decades of the 20th century. However, in recent years, water column and surface sediment pollution has been reduced, following the regulation of sewage discharges into the coastal environment. Nowadays, the sediments and waters are considered moderately contaminated (Carrasco et al., 2003). However, there is a lack of information on the evolution of the trophic state of the bay over time, and little is known about the development of industrial contamination before 1900. Hence, the evaluation of sedimentary records from Cadiz Bay can be used to provide natural baseline conditions and determine the effects of anthropogenic activity on the area.
The motivation for this study is to analyse the sub-recent environmental evolution of the inner Cadiz Bay using sedimentary records reaching back as far as AD 1700. The analytical strategy includes the examination of lithofacies and mineralogical composition, geochemical analyses and radiometric dating techniques. Sedimentary profiles are interpreted within the geological context of Cadiz Bay and its sedimentary dynamics. Special attention is paid to post-depositional alteration, utilizing a sequential iron extraction procedure and other geochemical analyses in parallel. The multiproxy study presented here allows us to reconstruct major environmental changes that took place in the inner Cadiz Bay over the last few centuries and determine the environmental conditions of the pre-industrial period. In particular, our methodological approach enables environmental variations to be differentiated from those induced by diagenetic processes.
Materials and methods
The study area
The Bay of Cadiz, located in the south-west of Spain (36°30′N; 6°10′W; Figure 1), is defined by a bay or outer bay in its northern part, an island-barrier-lagoon or inner bay system in its southern part, and marshes and tidal planes in its western and eastern parts (Achab, 2011; Muñoz Perez and Sánchez de LaMadrid Rey, 1994). The outer bay (covering 118 km2), which directly connects to the Atlantic Ocean, is strongly affected by storms, waves and littoral currents, and its seabed is predominantly sandy. The inner bay (covering 34 km2) is more sheltered from erosive action and is characterized by shallow waters (80% of the area with <1 m water depth) and muddy sediments. The marshes and tidal planes (covering 227 km2) are drained by a network of tidal channels linking the distal zones of the inner bay with the marine environment. The Sancti Petri creek connects the inner bay with the Atlantic Ocean, while the Rio San Pedro creek is a former tributary of Guadalete River that today only acts as a tidal channel.
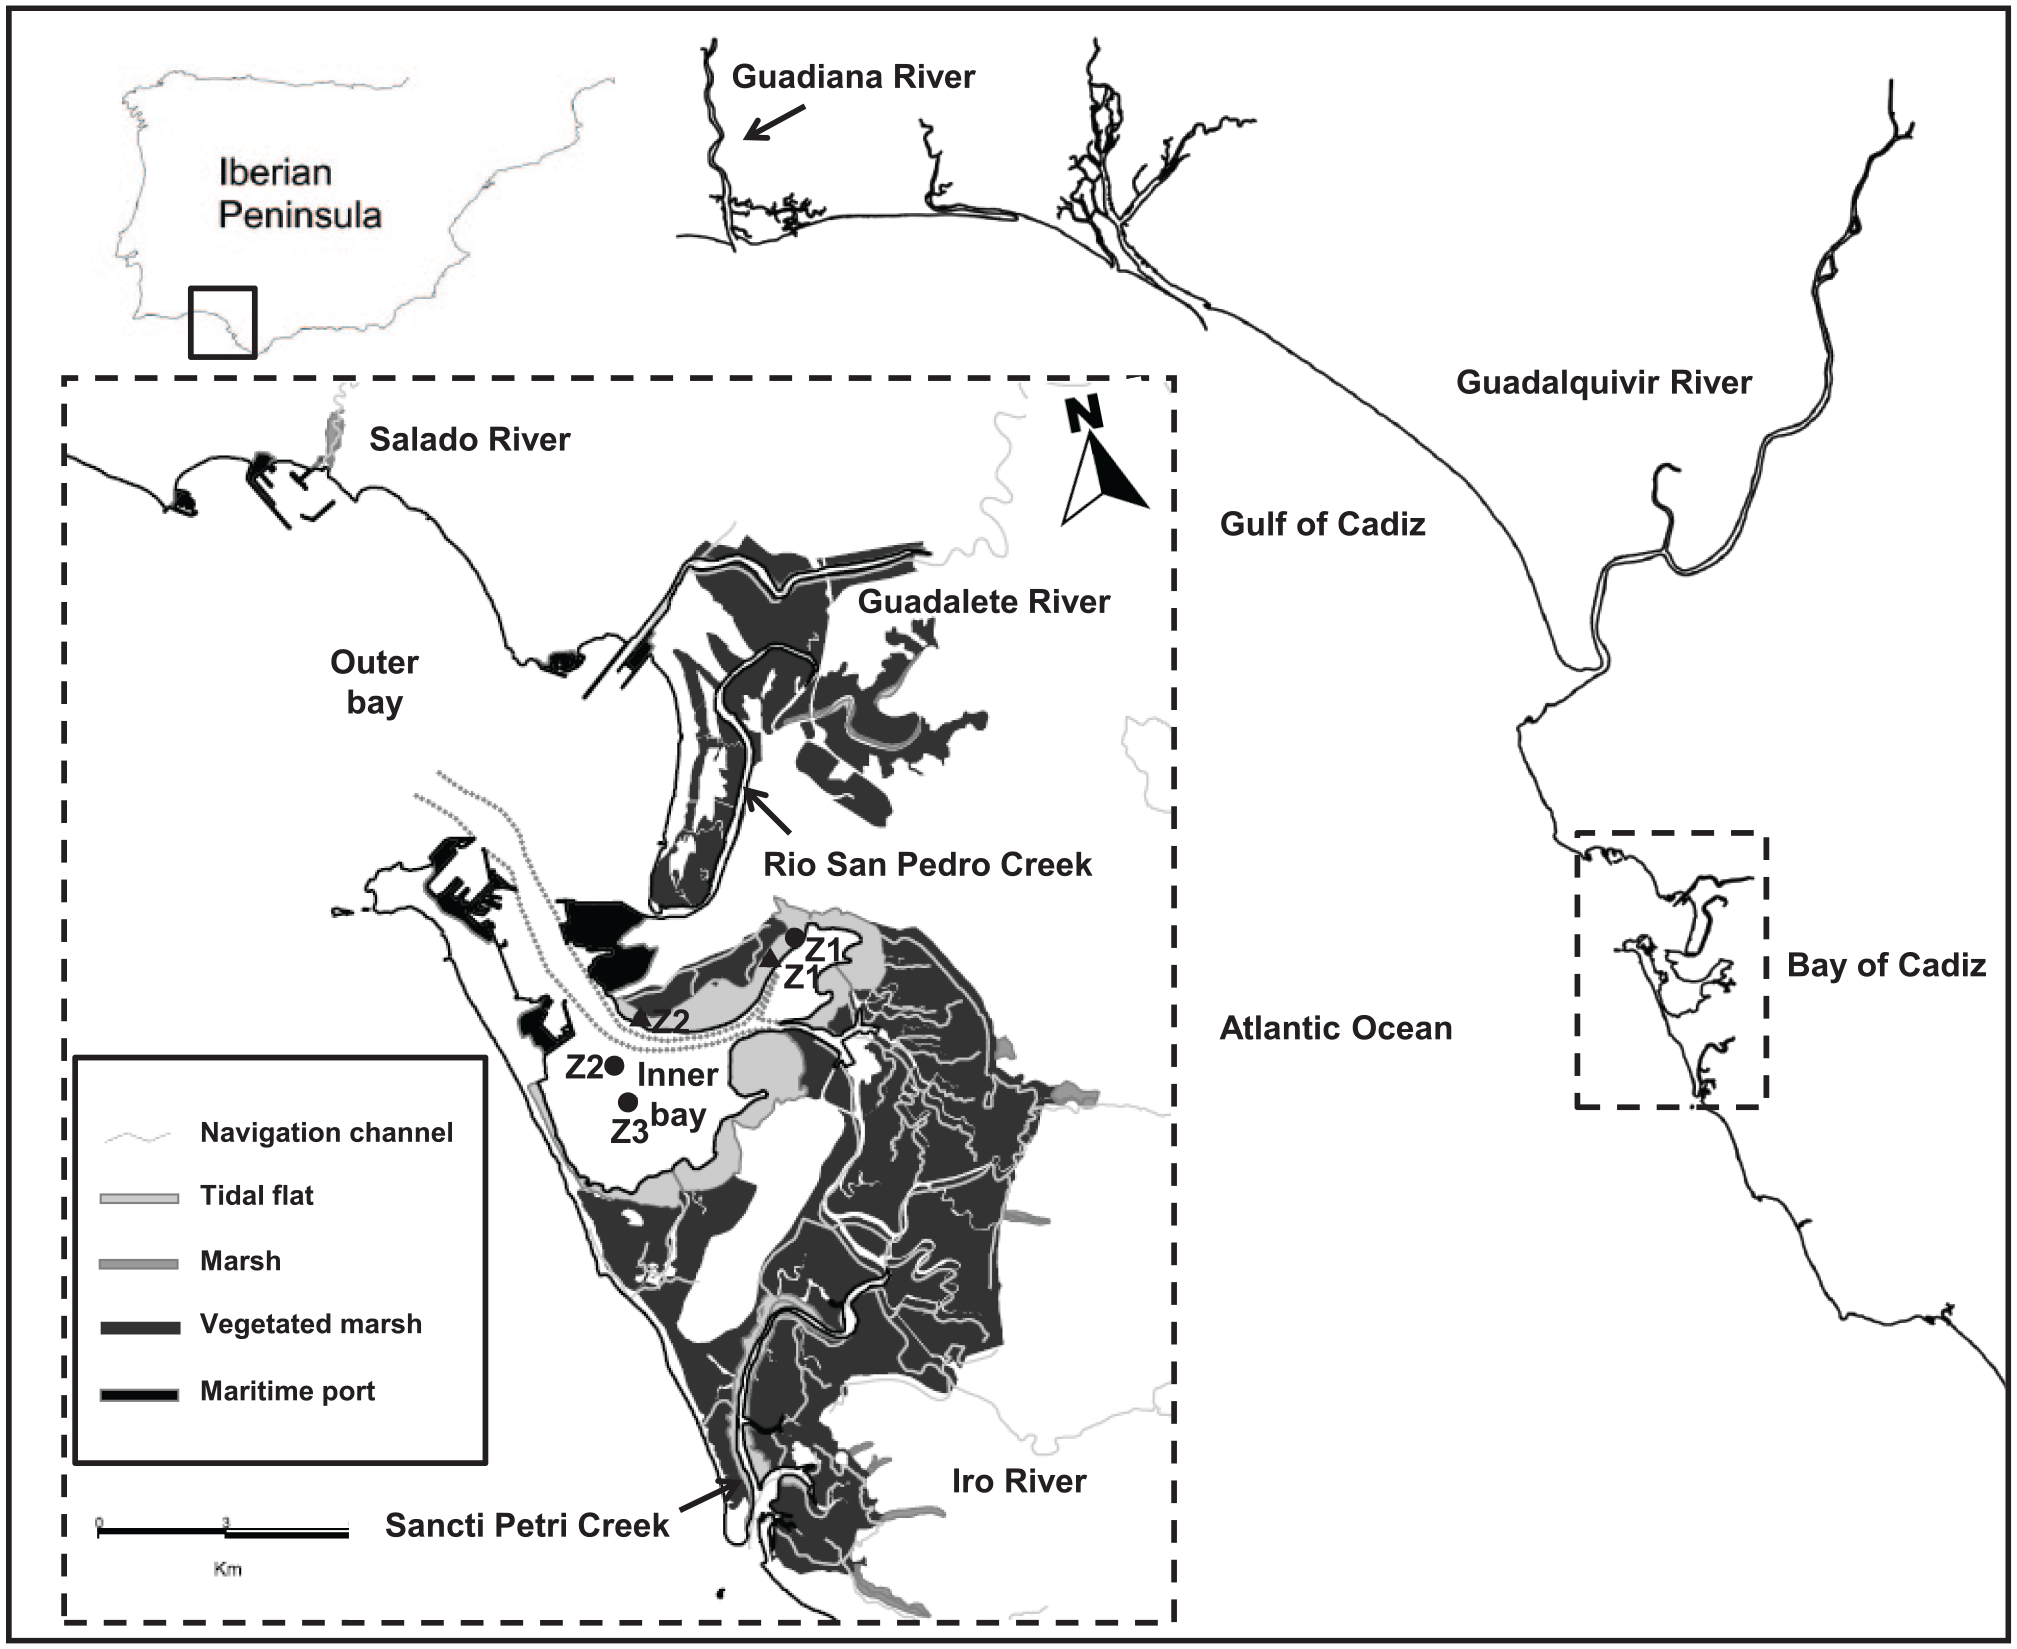
Map of Cadiz Bay area showing the locations of sampling sites (Z1, Z2 and Z3). Circles correspond to the position of cores in September 2009 and triangles of cores in April 2011 (detailed information about these samples is given in Table 1).
The marshes surrounding the inner bay are dominantly colonized by halophyte plants, whereas the vegetation in the tidal planes shows a vertical zonation in relation to tide height (Morris et al., 2009; Muñoz Perez and Sánchez de LaMadrid Rey, 1994). Spartina maritima (a cordgrass) grows in the upper part of the tidal plane, while seagrasses such as Zostera noltii, Cymodocea nodosa and Zostera marina inhabit the lower part. The middle part of the tidal plane has no vegetation although it is inhabited by diatom-dominated microphytobenthic communities. In addition, this zone of bare sediment is covered seasonally by tubular Ulva spp., a green macroalga that forms dense blooms throughout the inner bay (Corzo et al., 2009). The subtidal areas of the inner Cadiz Bay are inhabited almost entirely by Caulerpa prolifera, a rooted macroalga that forms extensive meadows.
The main sediment sources to the inner Cadiz Bay are the Guadalete, Salado and Iro Rivers (Gutiérrez-Mas et al., 1997). In addition, North Atlantic Surface Water (NASW) and littoral currents are considered to be responsible for carrying fine sediment from the Guadalquivir River into the bay (Gutiérrez-Mas et al., 2006). The tidal regime is mesotidal with a semi-diurnal cycle. The tidal currents are responsible for fine sediment dispersal into Cadiz Bay, although wind- and wave-driven currents are also important factors in the sedimentary dynamics (Achab, 2011; Gutiérrez-Mas et al., 2003).
Sample collection
Sediment cores (84–107 cm length, 5.6 cm diameter) were collected at three sites in the inner Cadiz Bay (Figure 1) in September 2009 and April 2011, using a modified UWITEC-core sampler (Table 1). In 2009, one core was recovered at each station (core 1MB09, core 2MB09 and core 3MB09). The cores were split lengthwise, photographed and described sedimentologically. One split half was capped and preserved at 4°C until further analysis by x-ray fluorescence (XRF); the other half was sliced in 1 cm resolution down to 20 cm sediment depth and in 2 cm resolution at greater depths. Each sediment slice was dried at room temperature and ground in an agate mortar for mineralogical analysis, discarding shells and other larger fragments of calcium carbonate during handling. In 2011, three sediment cores were taken from sampling site 1 and sampling site 2, respectively. One core of each station was kept at 4°C for XRF analysis (core 11MB11 and core 21MB11); the second core was immediately processed under an N2 atmosphere (see below) and used for further geochemical analysis of redox-sensitive elements (core 12MB11 and core 22MB11); the third core was frozen at −20°C and utilized for 210Pb dating (core 13MB11 and core 23MB11).
Summary of the geographical coordinates, sampling dates and water column depths for sampled cores.

XRF: x-ray fluorescence; XRD: x-ray diffraction; ICP-OES: inductively coupled plasma optical emission spectrometry.
Cores 12MB11 and 22MB11 were sliced every 2 cm for the first 60 cm depth and then every 4 cm under a N2 atmosphere. The sediment samples were freeze-dried and kept at −20°C. One subsample was used for partitioning of iron and total element contents in the solid phase; the second was used for bulk analysis of organic carbon, carbonate and nitrogen; the third was utilized for stable isotope analysis of organic carbon and total nitrogen (TN). Wet bulk density, dry bulk density and sediment porosity were calculated from the loss of weight during freeze-drying of each slice (see Supplementary Material, available online).
Sedimentary characteristics and mineralogical analysis
Features considered in the sedimentary description included texture, colour, sedimentary structures, bioclast content and grain size. The colour was determined on wet sediment, using Munsell Soil Color Charts. Mineralogical analysis was performed with a Bruker D8-Advanced Diffractometer using the crystalline powder technique. Diffractograms were obtained with scans = 2–60° 2θ, radiation Cu-Kα = 1.5405 Å, step size = 0.04° 2θ and time = 1 s. Mineralogical composition was determined by comparing the intensities of each mineral phase with the EVA© software database references. The semi-quantitative analysis of different mineral phases followed the reference intensity ratio (RIR) value method (Chung, 1974). Clay minerals were taken into account in the mineralogical analysis and quantified in total by the peak intensity of 20° 2θ. The following RIR values were chosen for each mineral phase: gypsum (1.8), clay minerals (0.1), goethite (2.7), rutile (1), barite (2.8), aragonite (1), quartz (3.1), orthoclase (0.8), albite (0.7), calcite (1), ankerite (2.8), dolomite (2.7), apatite (1), halite (4.7), pyrite (0.9) and haematite (3).
XRF core scanning
Energy-dispersive XRF core scanner measurements were carried out directly on the split core surface with an Avaatech XRF core scanner (Department of Marine Geosciences, University of Barcelona), and semi-quantitative element intensity records from Al through Ba were obtained. The XRF scanner was run at 1-cm-depth resolution with a scanning time of 10, 25 and 30 s for 10, 30 and 50 kV, respectively. Cores were imaged with a digital Color Line Scan Camera, using visible light with a resolution of 140 ppcm (350 dpi). Element profiles generated by XRF core scanning were used to correlate between sediment cores taken at the same locations during the two different cruises.
C-N analysis
Total carbon (TC) and TN contents were determined by combustion of untreated samples using an elemental analyser (LECO CHNS-932). The precision of analysis for the apparatus used was 0.3%. Inorganic carbon (Cinorg) was analysed on sample splits combusted at 550°C for 5 h before elemental analysis and was recalculated to the equivalent amount of CaCO3. Organic carbon (Corg) was calculated as the difference between TC and Cinorg. We report Corg/N as molar ratios.
Stable isotope analyses
Isotopic analysis of Corg and TN was performed on an elemental analyser (Flash EA 1112, Thermo Finnigan) attached to a stable isotope ratio mass spectrometer (DELTAplus, Thermo Finnigan). Results for C and N isotope compositions are reported in delta notation (‰) relative to Vienna PeeDee Belemnite (VPDB) and atmospheric air, respectively. The precision of analysis for the equipment used is 0.15‰. The δ13Corg isotope analyses were performed on samples decarbonated with 2 N HCl.
Major and trace element analysis
Major and trace elements in the sediment were extracted with an HF-HClO4-HNO3 solution. The digestion was performed in Teflon crucibles with approximately 50 mg of combusted samples (550°C, overnight). Then, H3BO3 (50 g L−1) was added to the samples to solubilize Al. Total Al, Mn, P, Cd, Cr, Cu, Ni, Pb, V and Zn were analysed by inductively coupled plasma optical emission spectrometry (ICP-OES; Varian Vista-MPX). The relative standard deviation (RSD) for ICP-OES analysis was below 10% for all elements. Total iron was measured by atomic absorption spectroscopy (AAS, SpectrAA Varian 400).
Sequential iron extractions
Sedimentary Fe speciation was determined using a modified version of the sequential extraction technique of Poulton and Canfield (2005). Approximately 100 mg of freeze-dried and homogenized sediment was subjected to a three-step extraction procedure using 10 mL of extractant in each step. First, samples were subjected to a 0.5 N HCl extraction for 1 h to release poorly crystalline hydrous ferric oxides (Fe(III)HFO) plus any Fe(II) associated with particle surfaces or FeS (Fe(II)red) (see Goldberg et al., 2012; Zegeye et al., 2012). Second, crystalline ferric oxyhydroxides, such as goethite and haematite (Feox), were extracted using a freshly prepared Na-dithionite solution (50 g L−1 buffered to pH 4.8 with 0.2 M Na-citrate and 0.35 M acetic acid) for 2 h. Finally, magnetite (Femag) was determined via a 6-h NH4+-oxalate (0.2 M NH4+-oxalate and 0.17 M oxalic acid) extraction. Fe(II) extracted in the first extraction step was analysed using the ferrozine assay (Stookey, 1970), and total Fe in each extract was determined via AAS, with a precision better than 3% for all steps. Iron bound to sulphides (Fesulf), including pyrite (FeS2) and acid-volatile sulphide (AVS), was determined via the two-step distillation technique of Canfield et al. (1986) in sample splits (approximately 500 mg freeze-dried sediment). First, AVS was extracted with hot 6 N HCl; then, chromium reducible sulphide (mostly FeS2) was extracted with hot 0.1 M CrCl2.The H2S released during the distillation was trapped in a 1 M AgNO3 solution. The precipitated Ag2S was retained on a pre-weighed nitrocellulose filter and weighed. Finally, Fesulf was calculated by converting the Ag2S weight to FeS and FeS2 equivalents. The sum of Fe(III)HFO, Fe(II)red, Feox, Femag and Fesulf forms the highly reactive Fe pool (FeHR; Poulton et al., 2004a, 2004b).
Dating of sediments and calculation of sedimentation rates
Sediment cores were sliced into samples of 2 cm thickness from the surface down to 50 cm in depth and dried at 55°C. Sedimentation rates and the ages of the different layers of sediments were determined using the 210Pb method following the constant rate supply (CRS) model (Appleby and Oldfield, 1978). The activity of unsupported 210Pb was obtained from the measurements of total 210Pb and 226Ra. 226Ra was measured by gamma spectrometry through the emissions of 214Bi and 214Pb, employing a coaxial HPGe detector with an energy resolution of 2 keV at 1332 keV and a relative efficiency of 20%. With the object of determining the activity concentration of total 210Pb, in secular equilibrium with 210Po, the latter was measured using alpha spectrometry. The analysis by alpha particles was performed with a CANBERRA Alpha spectrometer. 210Po was extracted from the samples using the TBP radiochemical method and its subsequent auto-deposition on silver discs in a thermostatic bath (Martin and Handcock, 2004). Finally, the CRS method was applied for calculating the sediment accumulation rates and for establishing the geochronology. Detailed method and model descriptions are presented in Ligero et al. (2002, 2010).
Results
Sedimentology and mineralogy
Cores collected from the inner Cadiz Bay during the first coring campaign contain mud, clayey mud and minor silt and sandy silt with bioclastic shell horizons (Table 1, Figure 2). Mineralogical compositions, sedimentary structures and bioclastic components show no clear downcore patterns, but colour and granulometry define three stratigraphic units from top to bottom. Unit H1 has a black colour, muddy texture and few shells. Unit H2 is characterized by variable texture, with sand, cobbles and many shells. Unit H3, which only occurred clearly in sampling site 3, is similar to unit H1 in texture but is light grey in colour.
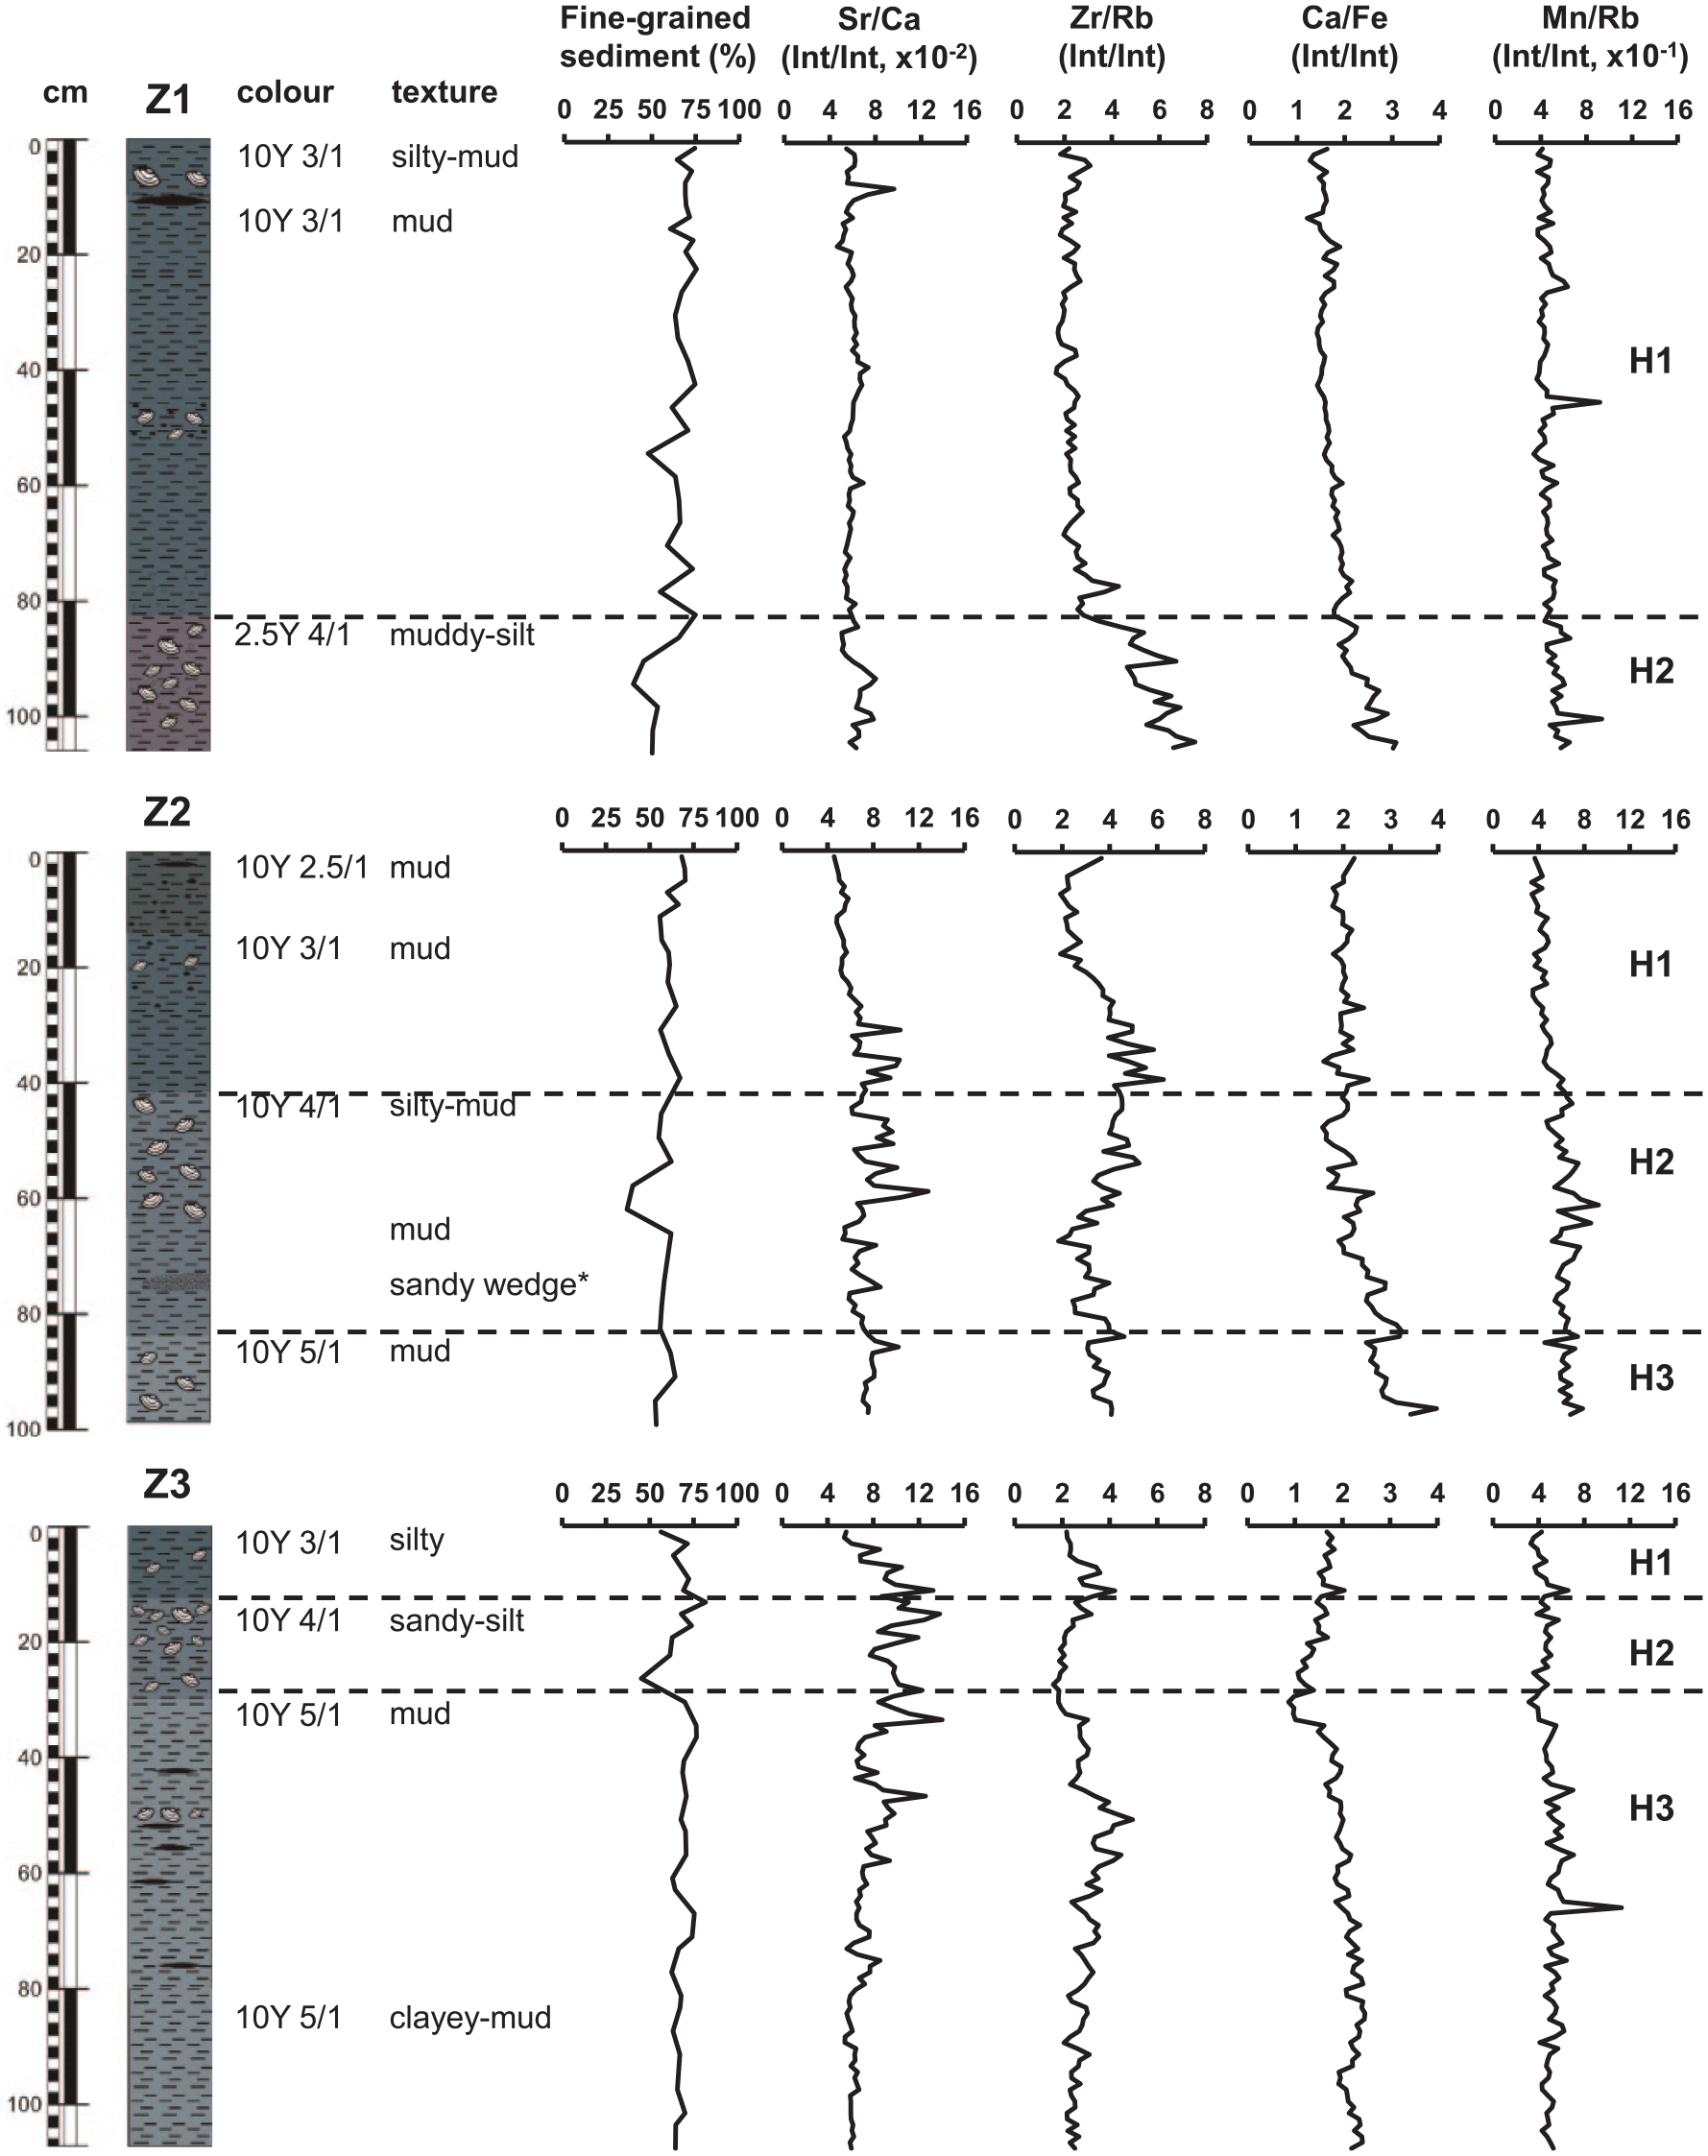
Stratigraphic diagram showing the main lithological features for Z1, Z2 and Z3 (from top to bottom). Vertical profiles of selected elemental ratios from the XRF core scanner and the proportion of fine-grained sediment obtained from the mineralogical data are shown for the same cores. Dashed horizontal lines indicate the division among stratigraphic units (H1, H2 and H3) for each sampling site.
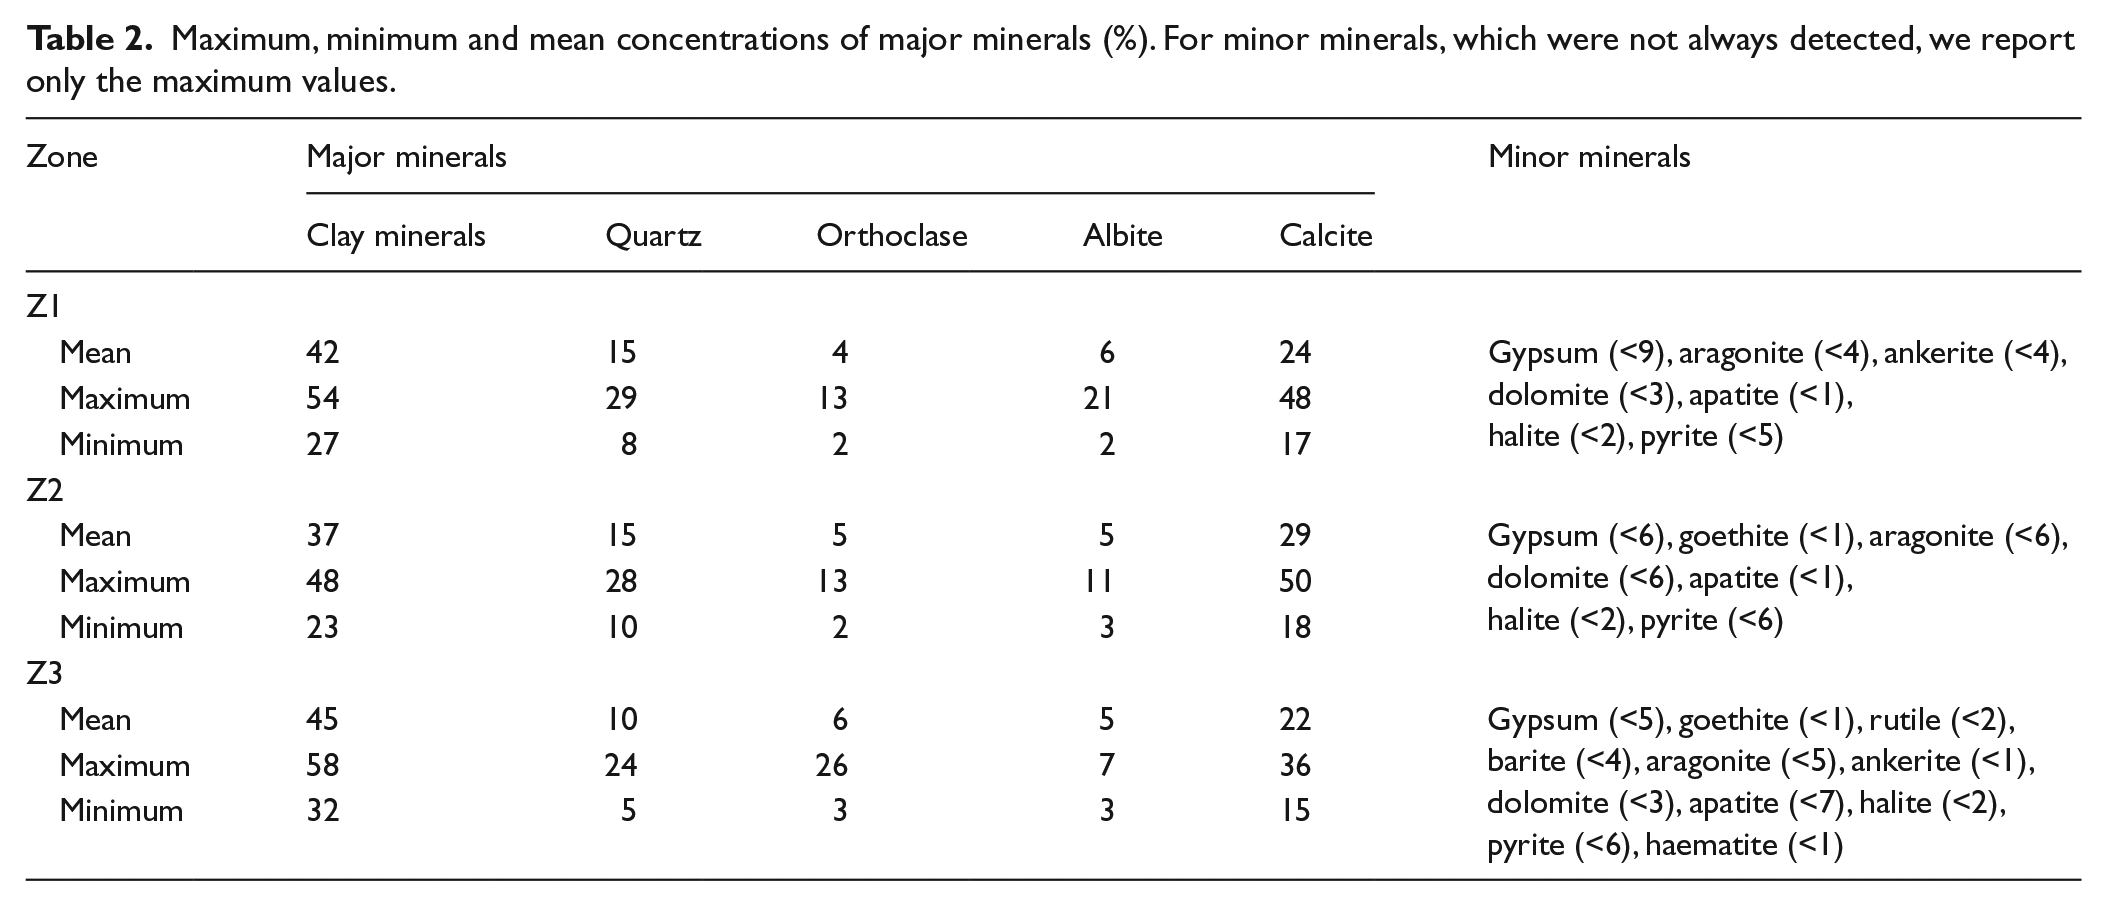
The mineralogical composition of the sediments is homogeneous along the cores and similar in the three sampling sites, showing a siliciclastic nature with abundant carbonate (Table 2). Five geochemical profiles were selected to provide an interpretation of the visible lithological subdivision in cores 1MB09, 2MB09 and 3MB09 (Table 1, Figure 2). The proportion of fine-grained sediment relative to the total fraction (%) declines markedly in layers with higher shell contents. This percentage, estimated from mineralogical composition, is obtained by the ratio of clay mineral content (representing the fine-grained fraction) and the sum of clays plus four phases commonly present in the coarse-grained fraction (quartz, feldspar, plagioclase and heavy minerals). The Sr/Ca and Zr/Rb ratios (XRF core scanning) increase in carbonate-rich layers and show an inverse pattern to the fine-grained fraction. The layers with high carbonate contents occasionally show bluish-black spots (10B 2.5/2) that could be related to OM accumulation. The Ca/Fe ratio (XRF core scanning) shows a pattern very similar to the lithologically determined stratigraphic units and increases from the onset of unit H2 towards the bottom of the core in sampling sites Z1 and Z2. The Mn/Rb ratio increases in layers with carbonate shells and/or bluish-black spots.
Maximum, minimum and mean concentrations of major minerals (%). For minor minerals, which were not always detected, we report only the maximum values.
Elemental composition
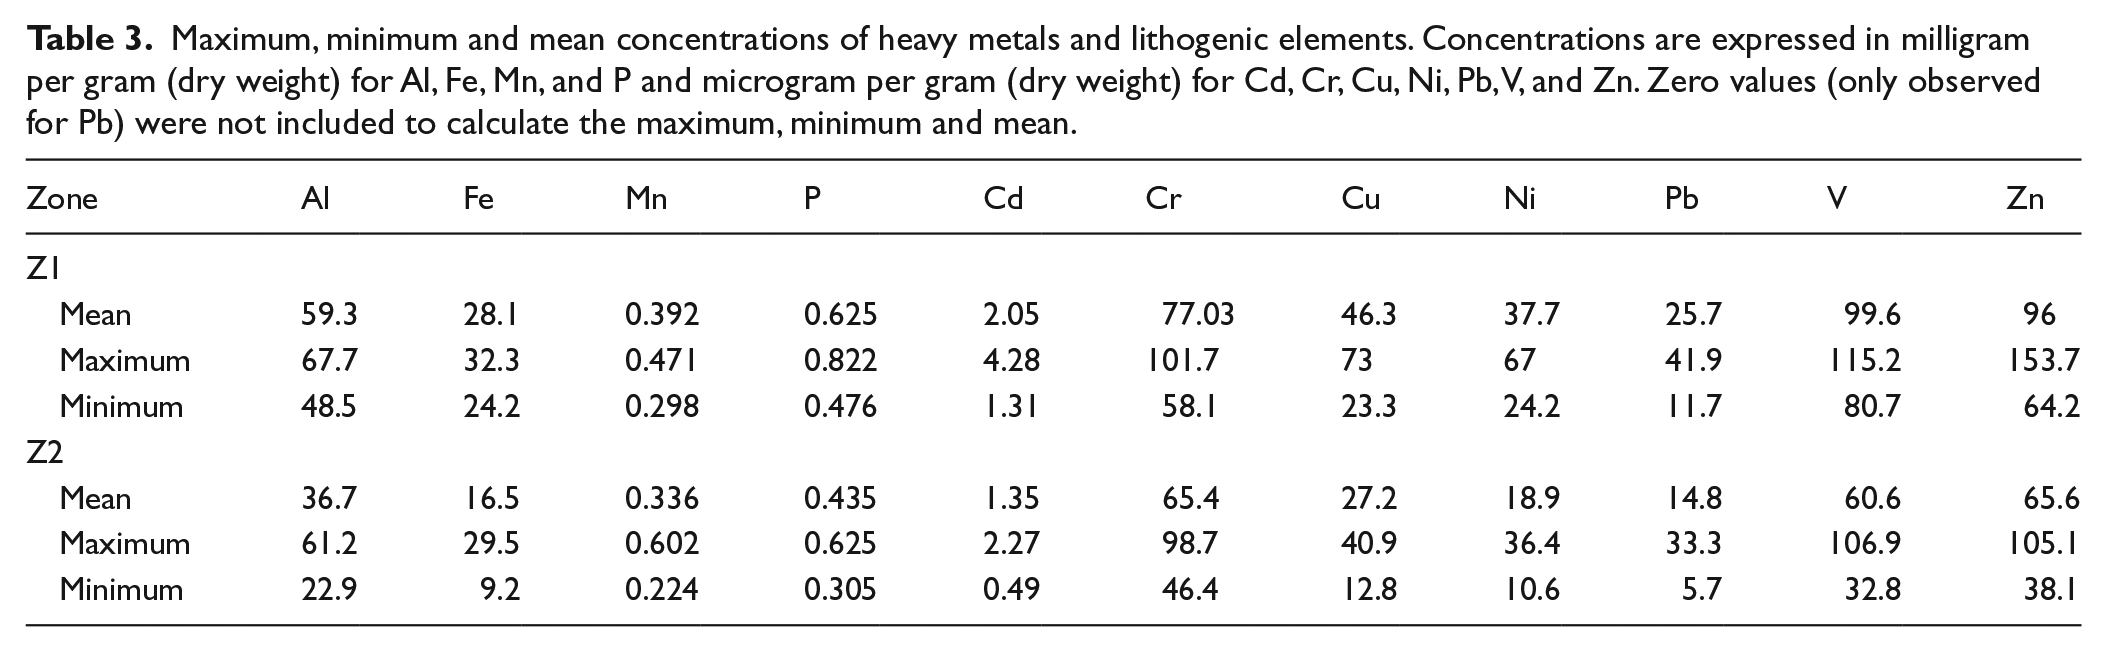
Trace metal and lithogenic element concentrations (ICP-OES) are higher in Z1 than in Z2 (Table 3). Fe, Mn, P, V, Cu and Zn contents were normalized to Al and are presented in Figure 3. Fe/Al and V/Al ratios do not show consistent patterns of change with depth at any of the sample sites. However, Cu/Al and Zn/Al ratios decrease steadily towards to the bottom of the core, particularly over the uppermost 60 cm. Mn/Al ratios decrease strongly in the first 5 cm at both sites but increase more steadily from 5 to 30 cm depth. Interestingly, in the layer between 35 and 65 cm depth, there are pronounced differences in the Mn/Al ratios at both sites (much higher Mn/Al in Z2). P/Al ratios are similar in both sites at the core tops and decreased over the top 5 cm in both cases. However, below the uppermost 15 cm, the P/Al ratio in Z2 tends to be consistent higher than in Z1, with a major P/Al peak at 40 cm depth in Z2.
Maximum, minimum and mean concentrations of heavy metals and lithogenic elements. Concentrations are expressed in milligram per gram (dry weight) for Al, Fe, Mn, and P and microgram per gram (dry weight) for Cd, Cr, Cu, Ni, Pb, V, and Zn. Zero values (only observed for Pb) were not included to calculate the maximum, minimum and mean.
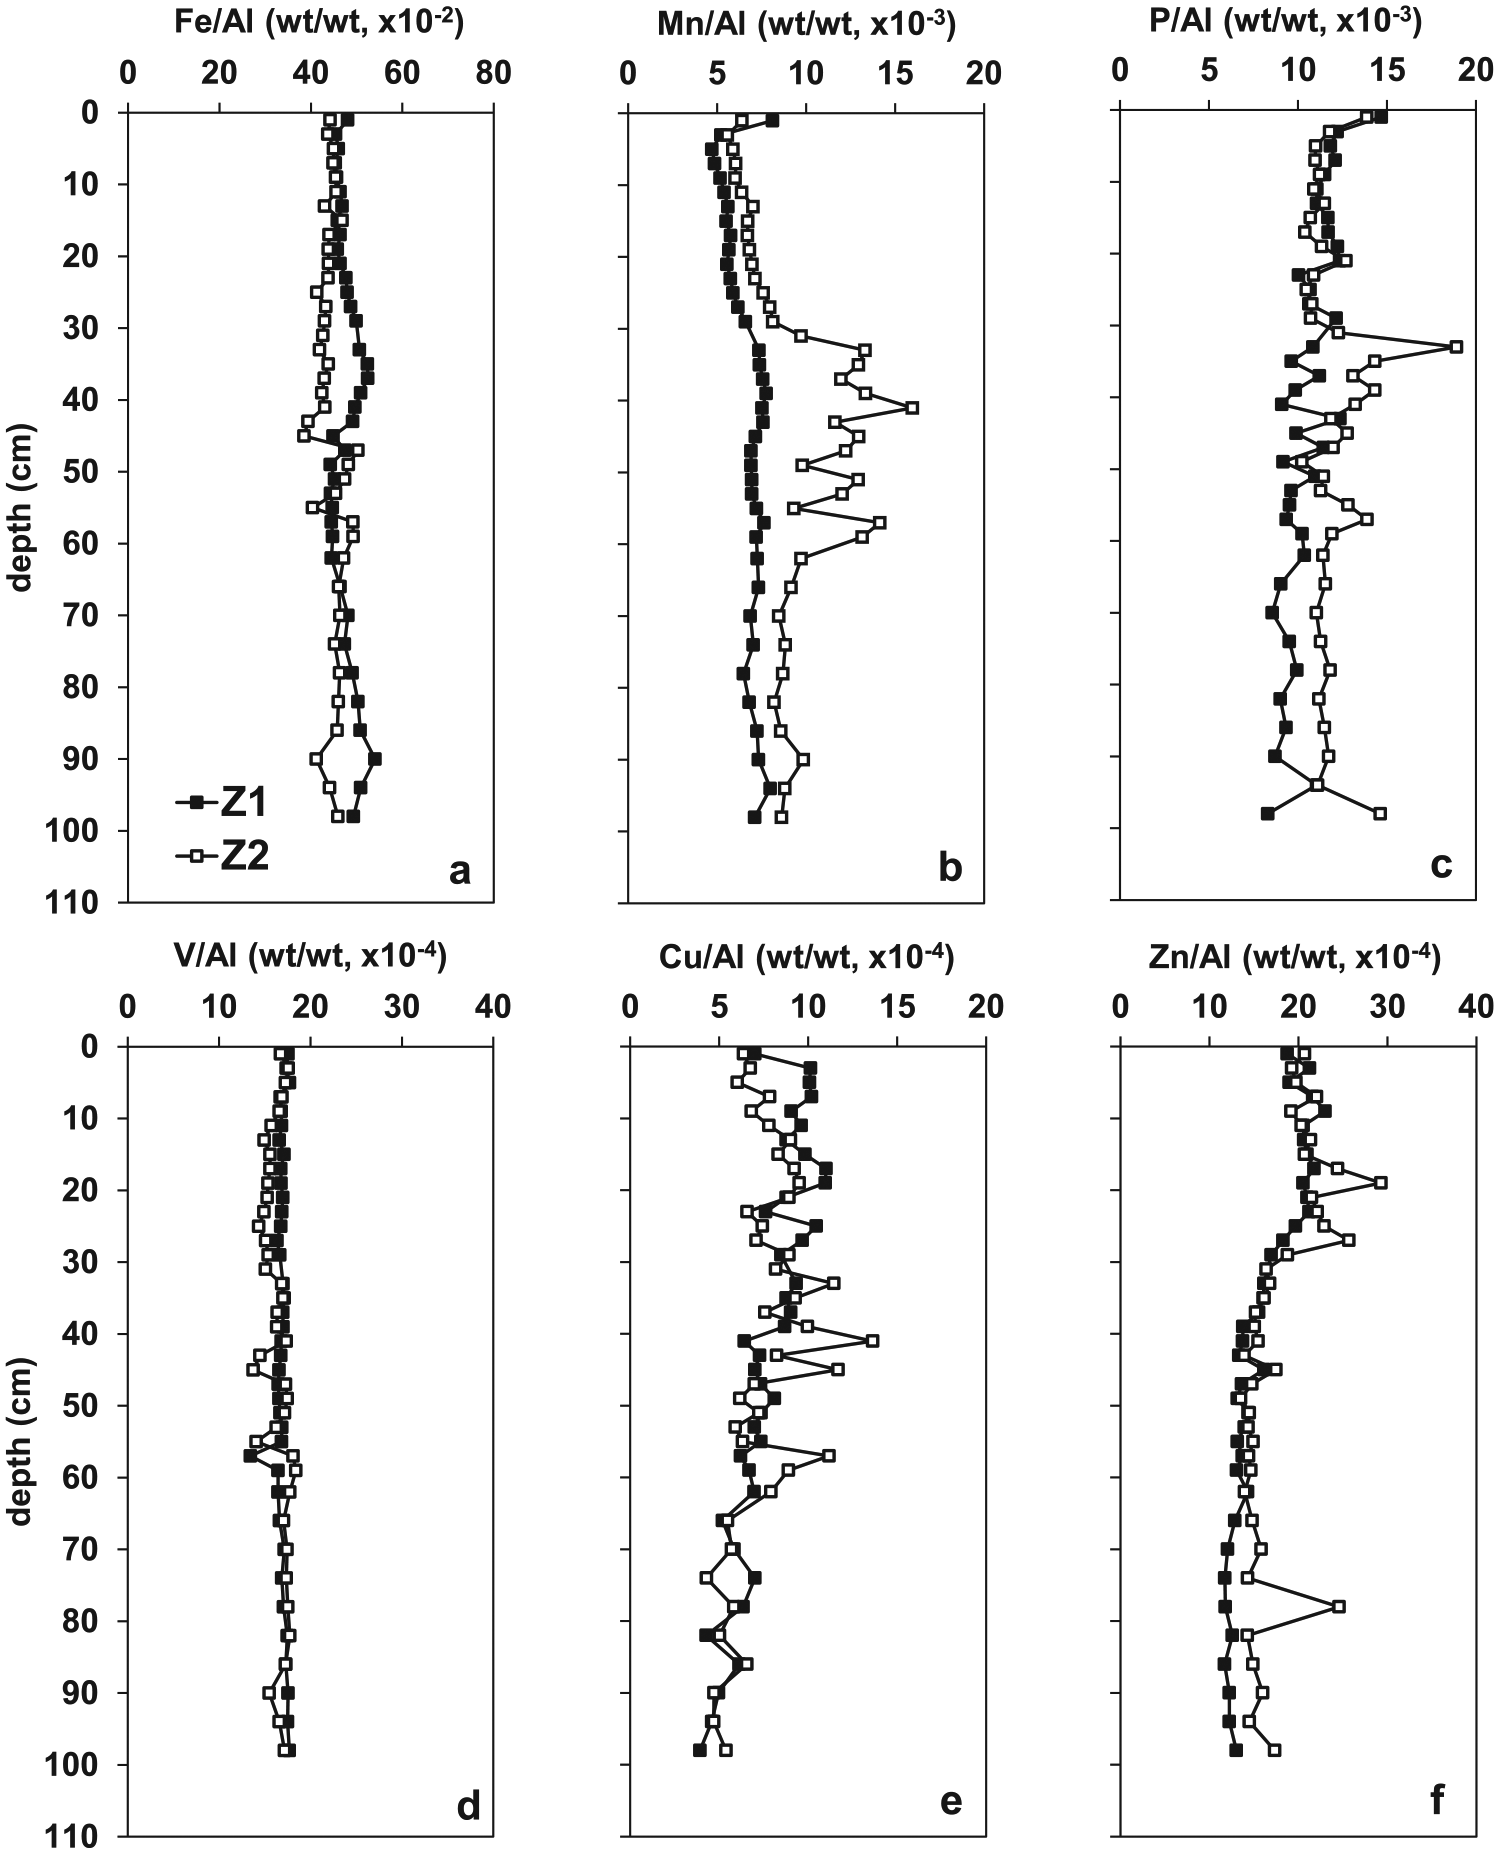
Al-normalized depth profiles for (a) Fe, (b) Mn, (c) P, (d) V, (e) Cu and (f) Zn for Z1 and Z2. The onset of unit H2 is 70 and 30 cm depth for Z1 and Z2, respectively.
High-resolution vertical profiles of element distributions and ratios by XRF core scanning are shown in Figure 4. The Al and Ti profiles show an increase towards the bottom of the cores at both sites, whereas Cl shows an inverse trend. These inverse patterns between Cl and both Al and Ti in XRF core scanner measurements on wet sediment are usually attributed to variations in interstitial water contents along the core (Tjallingii et al., 2007). The water content of the sediment diminished from the top of the core down to 25 and 40 cm depth for Z1 and Z2, respectively (see Supplementary Material, available online). Thus, neither Al nor Ti derived from XRF core scanning can be utilized as a normalizing parameter for the terrigenous fraction in our study. Such corrections are necessary, however, to eliminate the effects of grain-size variations and variable dilution factors (e.g. by organic C or carbonate) on element profiles so that unbiased records of diagenetic and anthropogenic processes can be generated (Calvert and Pedersen, 2007; Martinez-Ruiz et al., 2015). We use Rb instead of Al or Ti, because it is a detrital element present in feldspars and phyllosilicates (both abundant components in the studied deposits; Table 2), and it is less affected by physical effects during XRF scanning due to its higher atomic mass (Rothwell et al., 2006).
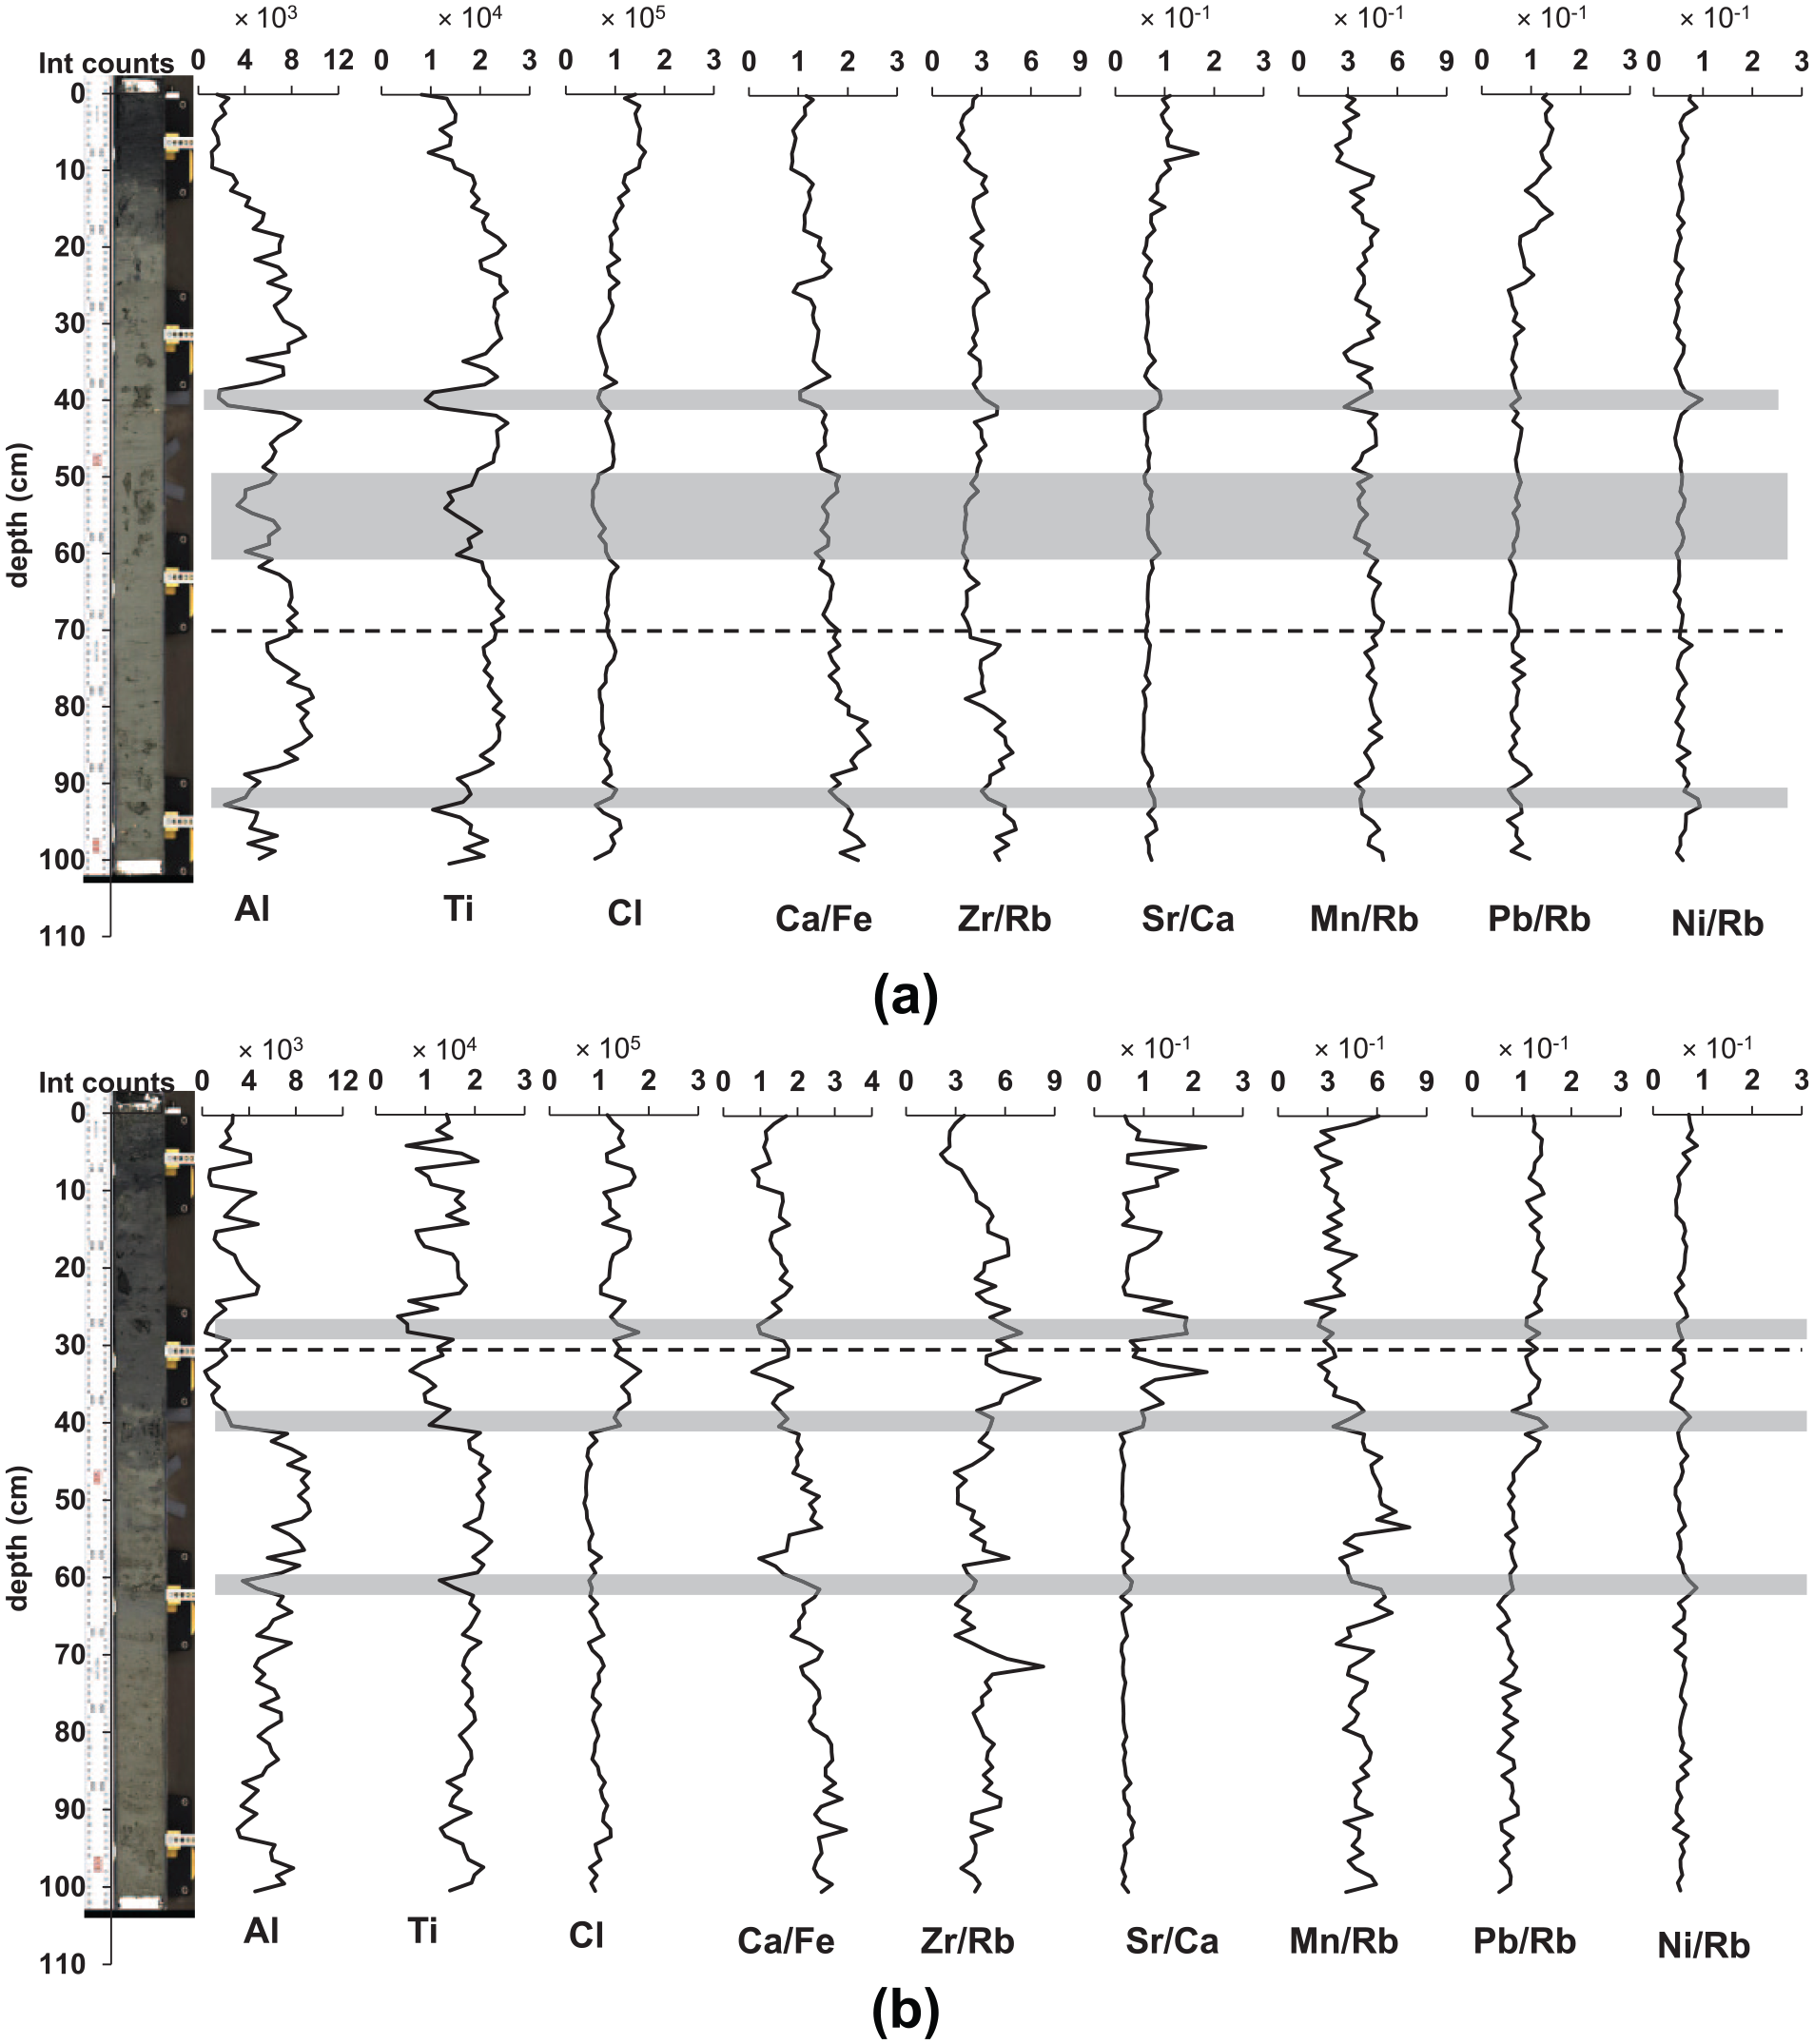
Depth profile of XRF core scanner for (a) Z1 and (b) Z2. The dashed line indicates the onset of H2. The area shaded in grey indicates an artefact (lost signal due to the fact that surface of sediment was not even).
The Ca/Fe ratio increases markedly from 35 cm depth in Z2, while this increase is more gradual and begins at 70 cm depth in Z1 (Figure 4). This index marks the transition between the H1 and H2 stratigraphic units. Zr/Rb and Sr/Ca ratios show enrichments at the same depths, especially in Z2. The Mn/Rb profile is constant in Z1 and displays an increase between 30 and 60 cm depth in Z2. The Pb/Rb ratio decreases towards the sediment bottom in both sites. Nevertheless, the Ni/Rb profile is fairly constant throughout the core.
Iron speciation
The vertical profiles of each Fe fraction relative to the highly reactive Fe (FeHR) are similar at both sites (Figure 5). The Femag/FeHR ratios remain relatively constant throughout the cores, with values close to 0.1. The Fe(III)HFO/FeHR and Feox/FeHR ratios are elevated in the uppermost 10 and 30 cm, respectively. The Fe(II)red/FeHR ratio is also highest in the uppermost 30 cm, whereas the Fesulf/FeHR ratio increases below 30 cm depth. The Fe(II)red/FeHR profile in Z1 has two peaks at 8 and 25 cm depth, and the Fesulf/FeHR profile has a broad maximum around 15 cm depth in both Z1 and Z2. Below 30 cm depth, all Fe fractions and ratios remain relatively constant, and over 80% of the FeHR in the sediment is ultimately bound as Fesulf (i.e. pyrite).
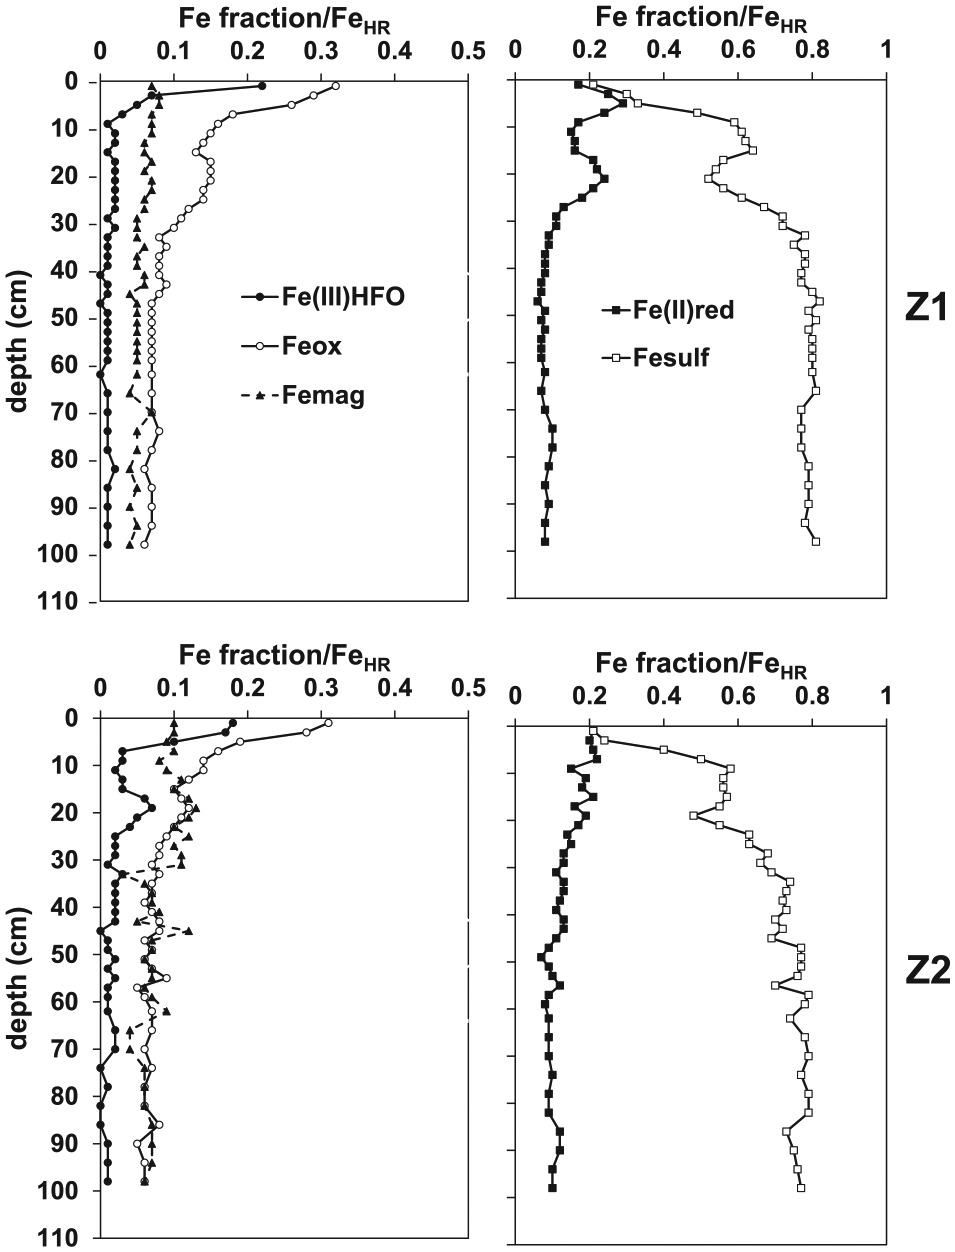
Depth profiles of chemical partitioning of Fe at Z1 (upper panels) and Z2 (lower panels). The onset of unit H2 is 70 and 30 cm depth for Z1 and Z2, respectively.
C-N compositions
The Corg content of the sediments is higher in Z1 than in Z2, with mean values of 2.3 and 1.3 wt%, respectively (Figure 6). The Corg profiles show a general decreasing trend from the top of the core down to 40 cm depth in both sampling locations. Between 40 and 75 cm depth, Z2 displays a high-Corg layer that is absent from Z1. In Z1, Corg consistently increases from 55 cm depth to the bottom of the core. The carbonate contents are generally higher in Z2 than in Z1, with mean values of 14.5 and 8.7 wt%, respectively. This difference is higher at the bottom of the cores. In Z2, a layer from about 30–65 cm depth shows variable carbonate contents, reaching 25 wt%.
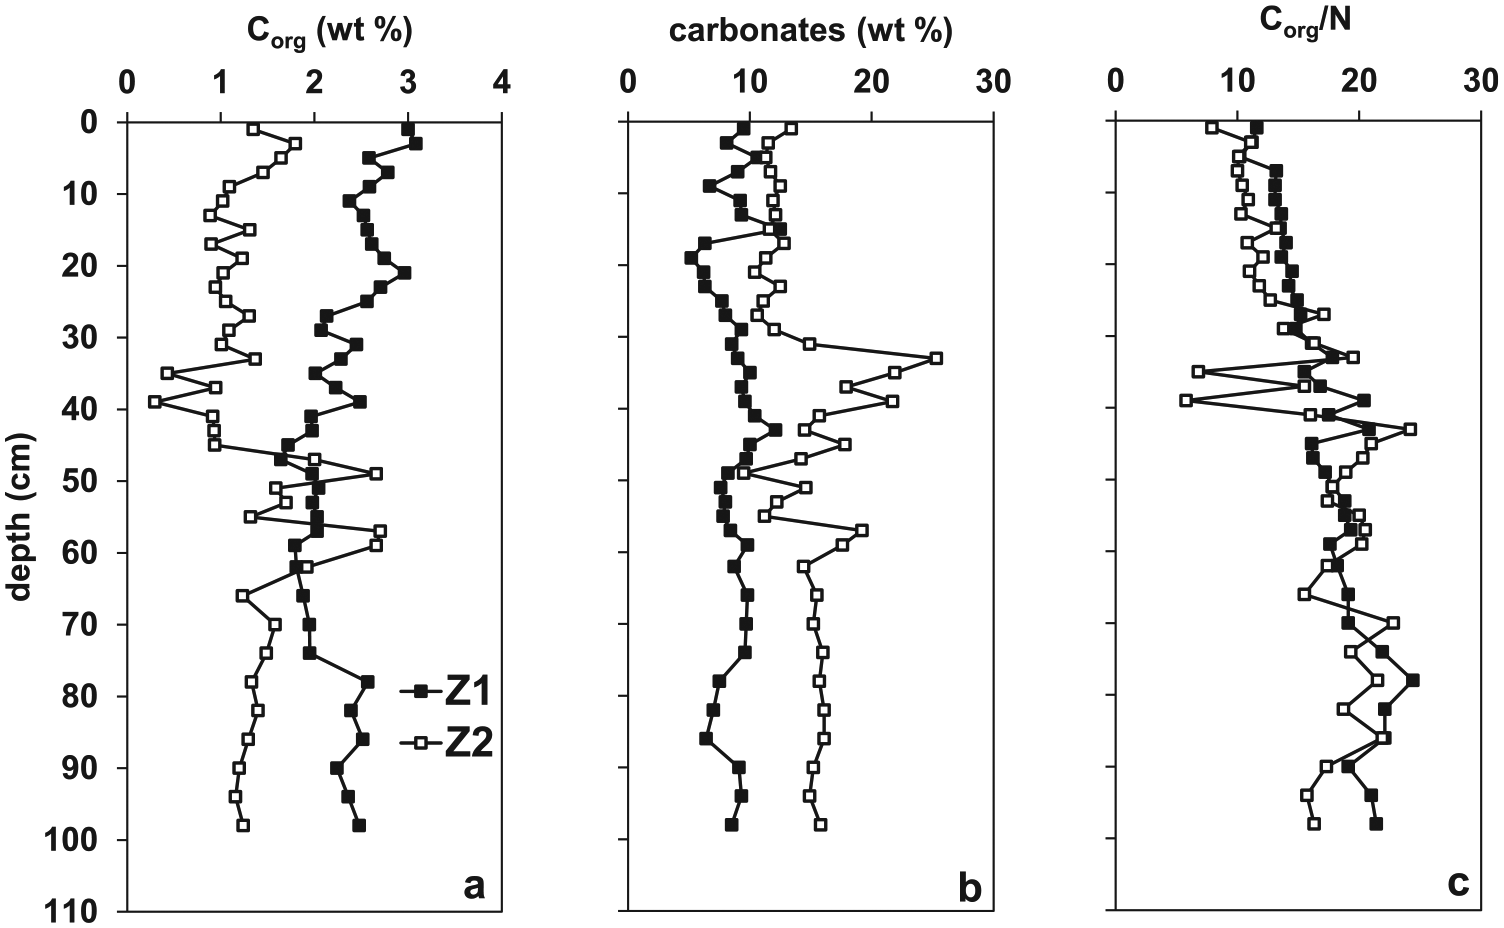
Depth profiles of (a) Corg, (b) carbonates and (c) molar Corg/N ratio for Z1 and Z2. The onset of unit H2 is 70 and 30 cm depth for Z1 and Z2, respectively.
The molar Corg/N ratio increases progressively towards the bottom of both cores, ranging from values around 10 to around 20 at ~75–80 cm depth (Figure 6). Below this depth, Corg/N ratios remain relatively constant. The molar Corg/N ratios are slightly higher for Z1 than for Z2, with mean values of 16.7 and 14.5, respectively.
Stable C and N isotopes
The depth profiles for δ13C and δ15N in sedimentary OM display enrichments in the heavier isotope at the core tops, mainly in the upper 40 cm (Figure 7). As observed for other geochemical variables, the δ13C profile displays more scatter in Z2. At this sampling site, δ13C shows a marked depletion from about 40 to 65 cm depth.
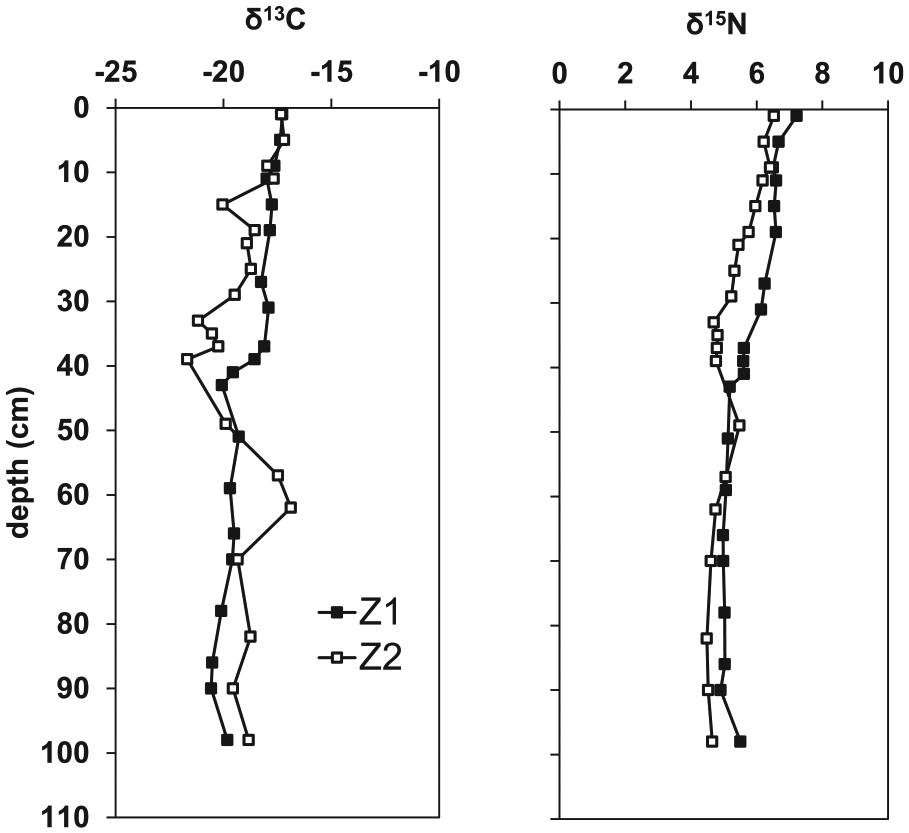
Depth profile for δ13C and δ15N stable isotopes at sampling sites Z1 and Z2. The onset of unit H2 is 70 and 30 cm depth for Z1 and Z2, respectively.
Chronology
The vertical profile of unsupported 210Pb shows an exponential decay with depth (see Supplementary Material, available online). The determination coefficients’ values for the exponential fit are 0.835 and 0.685 for Z1 and Z2, respectively. However, the flattening of the natural log of 210Pbex near the surface indicates a mixed layer of about 10 cm depth in both cores. This surficial mixing does not totally invalidate the use of 210Pbex profile, but the CRS model–estimated ages should be considered approximate (Johannessen and Macdonald, 2012). Dating was performed down to 46 cm depth for sampling site 1 and to 42 cm depth for sampling site 2 (see Supplementary Material, available online).
The 210Pb-based chronology indicates that sediment accumulation rates changed over time, with a general increase since the early 1930s to the present (Figure 8). During this period, the sedimentation rates increased 4.2-fold and 3.6-fold for Z1 and Z2, respectively. However, sediment accumulation rates were relatively constant for the period 1875–1930, with an average linear sedimentation rate of 0.13 cm yr−1. This sedimentation rate allows us to complete the age–depth model for the equivalent sedimentary facies downcore, assuming that below the maximum depth of dating the sedimentation rate is constant, as no sedimentological changes or variations in dry bulk density occur down to the bottom of the core (see Supplementary Material, available online). In addition, the geochronology can only be applied to unit H1, given that unit H2 has a different lithology (Figure 4). Thus, age-element and element ratio profiles can be extrapolated to 70 cm at Z1, but only down to 30 cm at Z2. Nevertheless, the estimated ages at Z1 below the maximum depth of dating, and the estimated rates of sediment accumulation in the mixed area of both sampling sites, must be interpreted with caution.
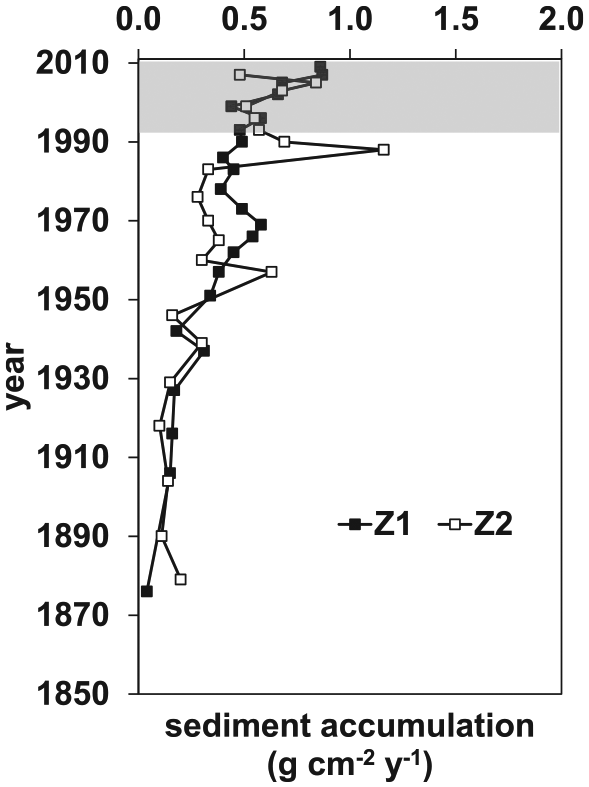
Evolution of sediment accumulation rates at sampling sites Z1 and Z2. Grey-shaded area indicates the mixed layer (see section ‘Chronology’). Note that years correspond to approximated ages.
Discussion
Environmental interpretation based on changes in lithology and XRF core scanning
Here, we compare the sedimentary units (Figure 2) defined in this study with the distribution of relict and modern facies in Cadiz Bay and also the lithofacies present in the Holocene record. Unit H1, at the top of core, has a black colour as a consequence of FeS, FeS2, and OM accumulation. The fine-grained nature of this unit and the presence of bivalve shells at certain depths are consistent with the predominant facies found in recent sediments of the area (Achab et al., 1999; Gutiérrez-Mas et al., 1997).
The carbonate-rich poorly sorted mud, sand and gravel of unit H2 is consistent with coarse-grained facies that are usually found near cliffs and rocky bottoms in Cadiz Bay (Achab et al., 1999; Gutiérrez-Mas et al., 1997), but here, the coarser sediments are mixed with fine sediments. Similar deposits are found in recent lithofacies of the outer Cadiz Bay and surrounding marshes, and their formation is related to sporadic high-energy events (Gutiérrez-Mas et al., 2009; Lario et al., 2002). The similar sedimentary characteristics of unit H3, relative to H1, suggest deposition under quiet conditions in a low-energy environment. At present, such conditions govern the inner Cadiz Bay. Therefore, unit H2 represents an interruption of the normal depositional regime.
Besides the lithological contrast, the onset of unit H2 is recognized by higher Sr/Ca and Zr/Rb ratios (Figure 2). We attribute the higher Sr/Ca ratio to the abundance of shells containing high-Sr aragonite, although this ratio can also be affected by variations in porosity and sediment grain size (Croudace et al., 2006; Rothwell et al., 2006; Thomson et al., 2006). In this work, the Sr/Ca ratio shows an inverse pattern in relation to the proportion of fine-grained material and a similar pattern to the Zr/Rb ratio (Figure 2). The Zr/Rb ratio is usually high in coarser sediments (Croudace et al., 2006), indicating that shell accumulations are associated with the coarse-grained fraction of sediment. In Z1 and Z2, a gradual downcore increase in the Ca/Fe ratio within this unit is also observed (Figure 2). The Ca/Fe ratio is a useful proxy for sediment grading and recognition of sedimentary units (Rothwell et al., 2006); this parameter reflects changes in the detrital composition, indicating the relative abundance of biogenic carbonate and clay. The higher carbonate compared with clay content within unit H2 increases the Ca/Fe ratio, given that Fe content in the sediment remains invariant with depth (see Fe/Al profile for the second cruise; Figure 6a). Therefore, the Ca/Fe ratio, in combination with Sr/Ca and Zr/Rb ratios, allows us to distinguish unit H1 from unit H2 (Figure 4).
The most reasonable cause for the appearance of unit H2 (i.e. the shell horizon) in Z2 and Z3 is the construction of a port between AD 1948 and 1953. These dates match with the age of the top of unit H2 in the station closest to the port (AC 1946 ± 2 years in Z2). For its construction, 500,000 m3 of sediment from the bay bottom was retrieved and 6 km2 of sea was filled up with blocks, gravel and sand. In the Oslo port, Lepland et al. (2010) found deposits from previous fillings (and dredging activities) at almost 500 m distance from the docks and along the navigation channel. Therefore, unit H2 in Z2 and Z3 likely originated during the construction operations given the proximity of these sampling sites to the port (Figure 1). The textural features (and geochemical properties) of unit H2 can be explained by the reworking of sediment and its mixture with sandy sediments rich in shells from the outer Cadiz Bay that were used as filling material.
The origin of unit H2 at Z1 is not known, although it occurs earlier than Z2 and Z3. Site Z1 is located far away from any current port, but it is surrounded by smaller channels of anthropogenic and natural origin (Figure 1). Since this area has been a maritime port for centuries and dredging activities have been taking place since the 17th century in Cadiz Bay, unit H2 at Z1 could be the product of some older canalization or abandoned dock. Based on the above, unit H2 is an anthropogenic deposit rather than a natural lithofacies at all sites. In addition, the sediment is very mixed, and post-depositional alteration is very likely within this unit. Thus, it is not possible to reconstruct the environment from the onset of unit H2 downwards.
Speciation of Fe in Cadiz Bay
Until now, all studies on iron speciation in Cadiz Bay have focused exclusively on its role as a potential pollutant (Izquierdo et al., 1997; Morillo et al., 2007; Sáenz et al., 2003). However, here, the partitioning of Fe is used as a tracer of diagenetic processes. The availability of reactive Fe controls pore water chemistry (Canfield, 1989) and OM burial (Lalonde et al., 2012) in marine sediments. Hence, the role of Fe biogeochemistry during early diagenesis can aid interpretation of sedimentary records. The marked decrease in Fe(III)HFO/FeHR and Feox/FeHR in the uppermost part of the sediment profile could, at least in part, be due to reaction with hydrogen sulphide released during OM decomposition by bacterial sulphate reduction (BSR), although dissimilatory Fe reduction (DIR) also likely contributes to Fe (oxyhydr)oxide dissolution (Figure 5). The reactivity of Fe(III) minerals towards H2S (and DIR) depends on the mineral phase and its crystallinity, with Fe(III)HFO being the most reactive Fe fraction (Canfield, 1989; Canfield et al., 1992; Poulton et al., 2004b). In contrast, the Femag/FeHR profile remains constant throughout the sediment record, suggesting that Femag does not react rapidly with H2S and is not significantly affected by DIR (see Canfield and Berner, 1987), although this could also be countered by biogenic magnetite production (Lovley et al., 1987). The Fesulf pool (mainly pyrite) increases simultaneously with the reductive dissolution of Fe(III) phases down to 30 cm depth, below which the Fe (oxyhydr)oxide and pyrite profiles remain relatively constant. Because highly reactive Fe (oxyhydr)oxides are still available below this depth, it appears likely that the availability of labile OM is the limiting constraint on further reductive dissolution at depth in the sediment column. It is generally assumed that there is a gradual decrease in the amount of labile OM and a corresponding increase in the amount of refractory OM with increasing sediment depth (Middelburg et al., 1993). The labile fraction of a mixed OM pool seems to be largely degraded in the uppermost 30–40 cm (Figure 6a), while below this depth mostly the refractory fraction remains. The presence of highly reactive Fe (oxyhydr)oxides down to 30 cm depth could be a combination of two factors. On one hand, sedimentation rates are high in Cadiz Bay (Figure 8), so reactive Fe(III) minerals may have escaped reductive dissolution by passing through the zones of iron and sulphate reduction quickly. On the other hand, only the most reactive Fe (oxyhydr)oxides react with H2S on relevant timescales (hundreds of years), while other Fe(III) minerals can take much longer to become sulphidized (Poulton et al., 2004b). So, the presence of relatively stable levels of Corg and Fe (oxyhydr)oxides in the deeper part of the sediment record indicates that further degradation of both components has been stalled due to their rather refractory nature.
Estimation of the original input of organic carbon to the Cadiz Bay sediments
The upcore increase in Corg (Figure 6a) observed in the sediments of our study could indicate an increase in OM input in recent times due to higher biological productivity. However, this apparent increase in Corg could also be a result of microbial mineralization downcore. Consequently, the Corg content in these sediments cannot be directly used as proxy of biological productivity in the past. Instead, we estimate the original input of Corg to the bottom sediments from the water column using the iron speciation data in combination with the Corg content of the sediment.
Considering that the loss of Corg in the shallow water column in our system is negligible, the original input of Corg to the bottom sediments (OCorig) can be theoretically estimated from the amount of Corg preserved in the sediment (i.e. the Corg content measured at every depth), plus the mineralized Corg (Cmin) during the time of deposition (i.e. OCorig = Cmin + Corg). Here, we infer Cmin from the content of Fe present as pyrite (Fepy). Pyrite in modern sediments forms at the expense of Corg degraded via microbial reduction of sulphate (Berner, 1984), and therefore, the content of pyrite measured in the sediment can be expressed in respired Corg equivalents. The net equation involving the mineralization of Corg (assuming a simple CH2O composition for Corg) by BSR can be described as follows:

The H2S released into the pore water by this reaction may be trapped in the solid phase, mostly by reacting with iron minerals to form pyrite (FeS2). In recent marine sediments, the trapping in the form of pyrite typically accounts for 5–20% of the total H2S production (Jorgensen and Kasten, 2006). Pyrite is very stable, resulting in its permanent burial in the long term. This process can be expressed by the following bidirectional equation, according to Berner and Canfield (1989):
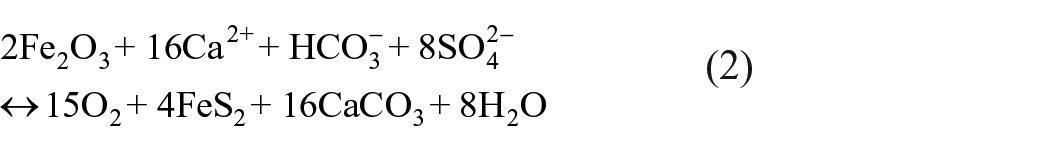
The equation reflects the global effect of sulphur cycle on atmospheric O2 concentration, and reading it from react to product side represents the net burial of sedimentary pyrite. Interestedly, this equation allows us to calculate the amount of sulphate that has been microbially respired and effectively trapped in the solid phase since BSR is the main mechanism for removing sulphate from the oceans in modern sediments (Jorgensen and Kasten, 2006). According to Eq. 2, for every 4 moles of FeS2 buried, 8 moles of
The proposed way of calculating Cmin is limited in several ways. On the one hand, the use of sedimentary pyrite content as an estimation of the Cmin would be valid only in systems where iron sulphides other than pyrite are minor and where pyrite formation is limited by the availability of labile Corg. In our system, pyrite is indeed the main iron sulphide, representing >90% of this mineral phase in all samples (an average value of 99% for both sampling sites). In addition, as already discussed (see section ‘Speciation of Fe in Cadiz Bay’), there is no evidence for a limitation of pyrite formation by iron or sulphur, such that in Cadiz Bay sediments, all degradable Corg is available for pyrite formation, reinforcing our assumption.
On the other hand, sedimentary pyrite formation is more complex than is assumed here, involving chemical reactions in several steps (Jorgensen and Kasten, 2006). However, several pathways of pyrite formation have been reported in the literature, and therefore, results would vary highly depending on the pathway selected. In contrast, our calculation uses a relationship between two components from a mass balance equation which is known to have remained constant over recent times. Also, models including Eq. 2 were able to reproduce carbon cycle past dynamics (e.g. Berner, 2006), indicating its reliability. Finally, the contribution of BSR to the total sediment respiration may be different to 50% and may have varied over time. Nevertheless, our approach offers a first-order estimation of OM degradation (in the absence of direct measurements of OM diagenesis for the study area) and gives an acceptable solution for the reconstruction of OCorig input despite of the uncertainties in the calculation of Cmin.
For all above reasons, OCorig is applied in the last section as a tentative indicator of the evolution of the productivity in the water column and as tracer of anthropogenic OM inputs in the inner Cadiz Bay.
Organic geochemical proxies for tracing environmental changes in Cadiz Bay
Corg/N ratios at the sediment surface (8–12; Figure 6c) indicate a predominantly algal origin for the sedimentary OM (Meyers, 1994, 1997). The increase in this ratio with sediment depth may be related both to changes in OM sources and to differential OM decomposition after sedimentation. Given that this trend continues beyond the most active remineralization zone (first 30 cm depth; see section ‘Speciation of Fe in Cadiz Bay’) and continues down to 70–80 cm depth, the Corg/N ratio most likely reflects variations in OM sources rather than post-depositional alteration. In Z2, low Corg/N ratios (close to 5; Figure 6c) occur at certain depths with Corg contents below 0.5% (Figure 6a). Such low Corg/N ratios occur in Corg-poor sediments caused by sorption of ammonium and organic nitrogen within clay minerals (Müller, 1977), preventing its use as indicator of OM origin under similar conditions. In our study, the low Corg/N ratios occur within unit H2 (see Figure 4), and therefore, these values are not considered in the environmental reconstruction for Z2.
The values of δ13C and δ15N obtained in the studied sediment (between −22‰ and −17‰ in δ13C and 4–7‰ in δ15N; Figure 7) suggest that the sedimentary OM is predominantly of marine origin, in agreement with the Corg/N ratios (Lamb et al., 2006; Meyers, 1994; Montoya, 2007). Again, the observed increase in δ13C and δ15N values from 30 cm depth to the top of the cores could be related to both environmental changes (e.g. changes in the vegetation, productivity or pollution) and diagenetic changes. As diagenetic processes can alter the primary isotopic composition of OM (Gaye-Haake et al., 2005; Lehmann et al., 2002; Macko and Estep, 1984), the applicability of δ13C and δ15N as tracers of environmental changes is currently a matter of debate (see reviews of Lamb et al., 2006, and Robinson et al., 2012). Nevertheless, several studies indicate that their values in the bulk sediment can be used to reconstruct environmental changes in the water column despite diagenetic overprints (Freudenthal et al., 2001; Kohzu et al., 2011; Möbius, 2013). The variability in δ13C and δ15N caused by diagenesis is small in comparison with the isotopic variation due to environmental change. Therefore, the upcore increase in δ13C and δ15N values (Figure 7) likely represent temporal changes in the OM sources entering in the inner Cadiz Bay and possible changes in the trophic state of the water column.
Minor and trace elements in Cadiz Bay sediments
The contents of heavy metals and lithogenic elements (Table 2) in the studied sediments are generally in the range of other studies performed in the area (Carrasco et al., 2003; Gomez-Parra et al., 1984; Morillo et al., 2007). The lower values observed in Z2, compared with Z1, are consistent with the higher proportion of carbonates at this station (Figure 6b), thus diluting the elements present in the terrigenous fraction.
The invariant profiles of Fe/Al, V/Al and Ni/Rb (Figures 3a, 3d and 4) indicate that these metals are largely controlled by terrigenous input. Furthermore, the fact that redox-sensitive elements such as V or Ni (Tribovillard et al., 2006) show constant profiles indicates that the column water in Cadiz Bay was never anoxic during the studied time period. In contrast, the increases in Cu/Al, Zn/Al and Pb/Rb ratios at the core top (Figures 3e, 3f and 4) seem to represent inputs of heavy metals from anthropogenic sources. In Cadiz Bay, these metals (Cu, Zn and Pb) are frequently linked to urban and industrial contamination (Carrasco et al., 2003; Gomez-Parra et al., 1984; Morillo et al., 2007). However, Cu, Zn and Pb are metals which may potentially undergo early diagenetic mobilization in the sediment (Spencer et al., 2003). To discard this possible alteration, we consider these heavy metals in relation to the Fe oxide (Fe(III)HFO +Feox) and Fe sulphide contents (Fesulf) obtained from Fe partitioning (see section ‘Sequential iron extractions’). In Cadiz Bay sediments, Fe (oxyhydr)oxides are the main scavengers of Zn and Pb, whereas Cu is strongly controlled by sulphides (Morillo et al., 2007). The weak correlation between the concentration of these metals and their corresponding scavengers (r = 0.41, r = 0.47 and r = 0.42 for Zn, Pb and Cu, respectively) demonstrates that diagenetic mobilization has not significantly affected the distribution of Cu, Zn and Pb in the sediment.
Changes in the Mn/Al and P/Al ratios along the cores (Figure 3b and c) are probably related to post-depositional processes involving dissimilatory reduction of Mn, Fe and sulphate during diagenesis of OM (Spencer et al., 2003; Tribovillard et al., 2006). In modern marine sediments, Mn oxyhydroxides and Mn carbonates are known to be formed diagenetically within the sediment (Calvert and Pedersen, 1993, 1996). Although we did not study Mn speciation in our cores, the increased Mn/Al ratio in the uppermost 5 cm could indicate accumulation of Mn oxyhydroxides in the surface, as a consequence of dissimilatory Mn reduction at depth followed by dissolved Mn diffusion and re-precipitation at the sediment surface. Conversely, the slight downcore increase in the Mn/Al ratio observed in the top 30 cm (Figure 3b) may indicate formation of authigenic Mn carbonates at depth, as a consequence of the high alkalinity derived from BSR and DIR. The slight decrease in P/Al with depth (Figure 3c), on the other hand, is probably due to P being released to the dissolved phase during OM diagenesis and then either being adsorbed to carbonate minerals or precipitated as authigenic apatite (Ruttenberg and Berner, 1993). This decrease is consistent with the typical pattern for total P and organic P in Cadiz Bay sediments (Ponce et al., 2010).
In Z2, a clear peak in the P/Al ratio between 30 and 40 cm depth is observed, exactly at the top of a carbonate-rich high-Mn layer located between 35 and 65 cm depth (Figures 3b, 3c and 6b). The observed increase in the Mn/Al ratio (cf. Figures 3b and 6b) may reflect the formation of authigenic Mn carbonates at these depths as a consequence of their precipitation on pre-existent biogenic carbonates (Boyle, 1983). Also, the high P/Al ratio (cf. Figures 3c and 6b) may indicate authigenic apatite formation and/or adsorption of P onto carbonate particles. The diagenetic formation of apatite (carbonate fluorapatite) and the sorption of P on carbonates are processes very common in marine sediments (Ruttenberg and Berner, 1993; Slomp et al., 1996). Thus, the carbonate-rich interval seems to be the most significant factor leading to enrichments in Mn and P at this station.
In summary, only the ratios of Cu/Al, Zn/Al and Pb/Rb are applied in the following section as promising tracers of heavy metal contamination in Cadiz Bay. Moreover, given the intense diagenetic mobilization of Mn, the ratios of Mn/Al and Mn/Rb should not be utilized as a proxy for redox conditions in the water column.
Trends in ecological conditions in Cadiz Bay over the past few centuries
Sedimentary records of several variables indicative of urban and industrial activities, indicators of OM sources and tracers of eutrophication and productivity were dated using the age–depth model determined for H1 (see section ‘Chronology’) to determine their historic evolution since 1680 in Z1 and since 1940 in Z2 (Figure 9).
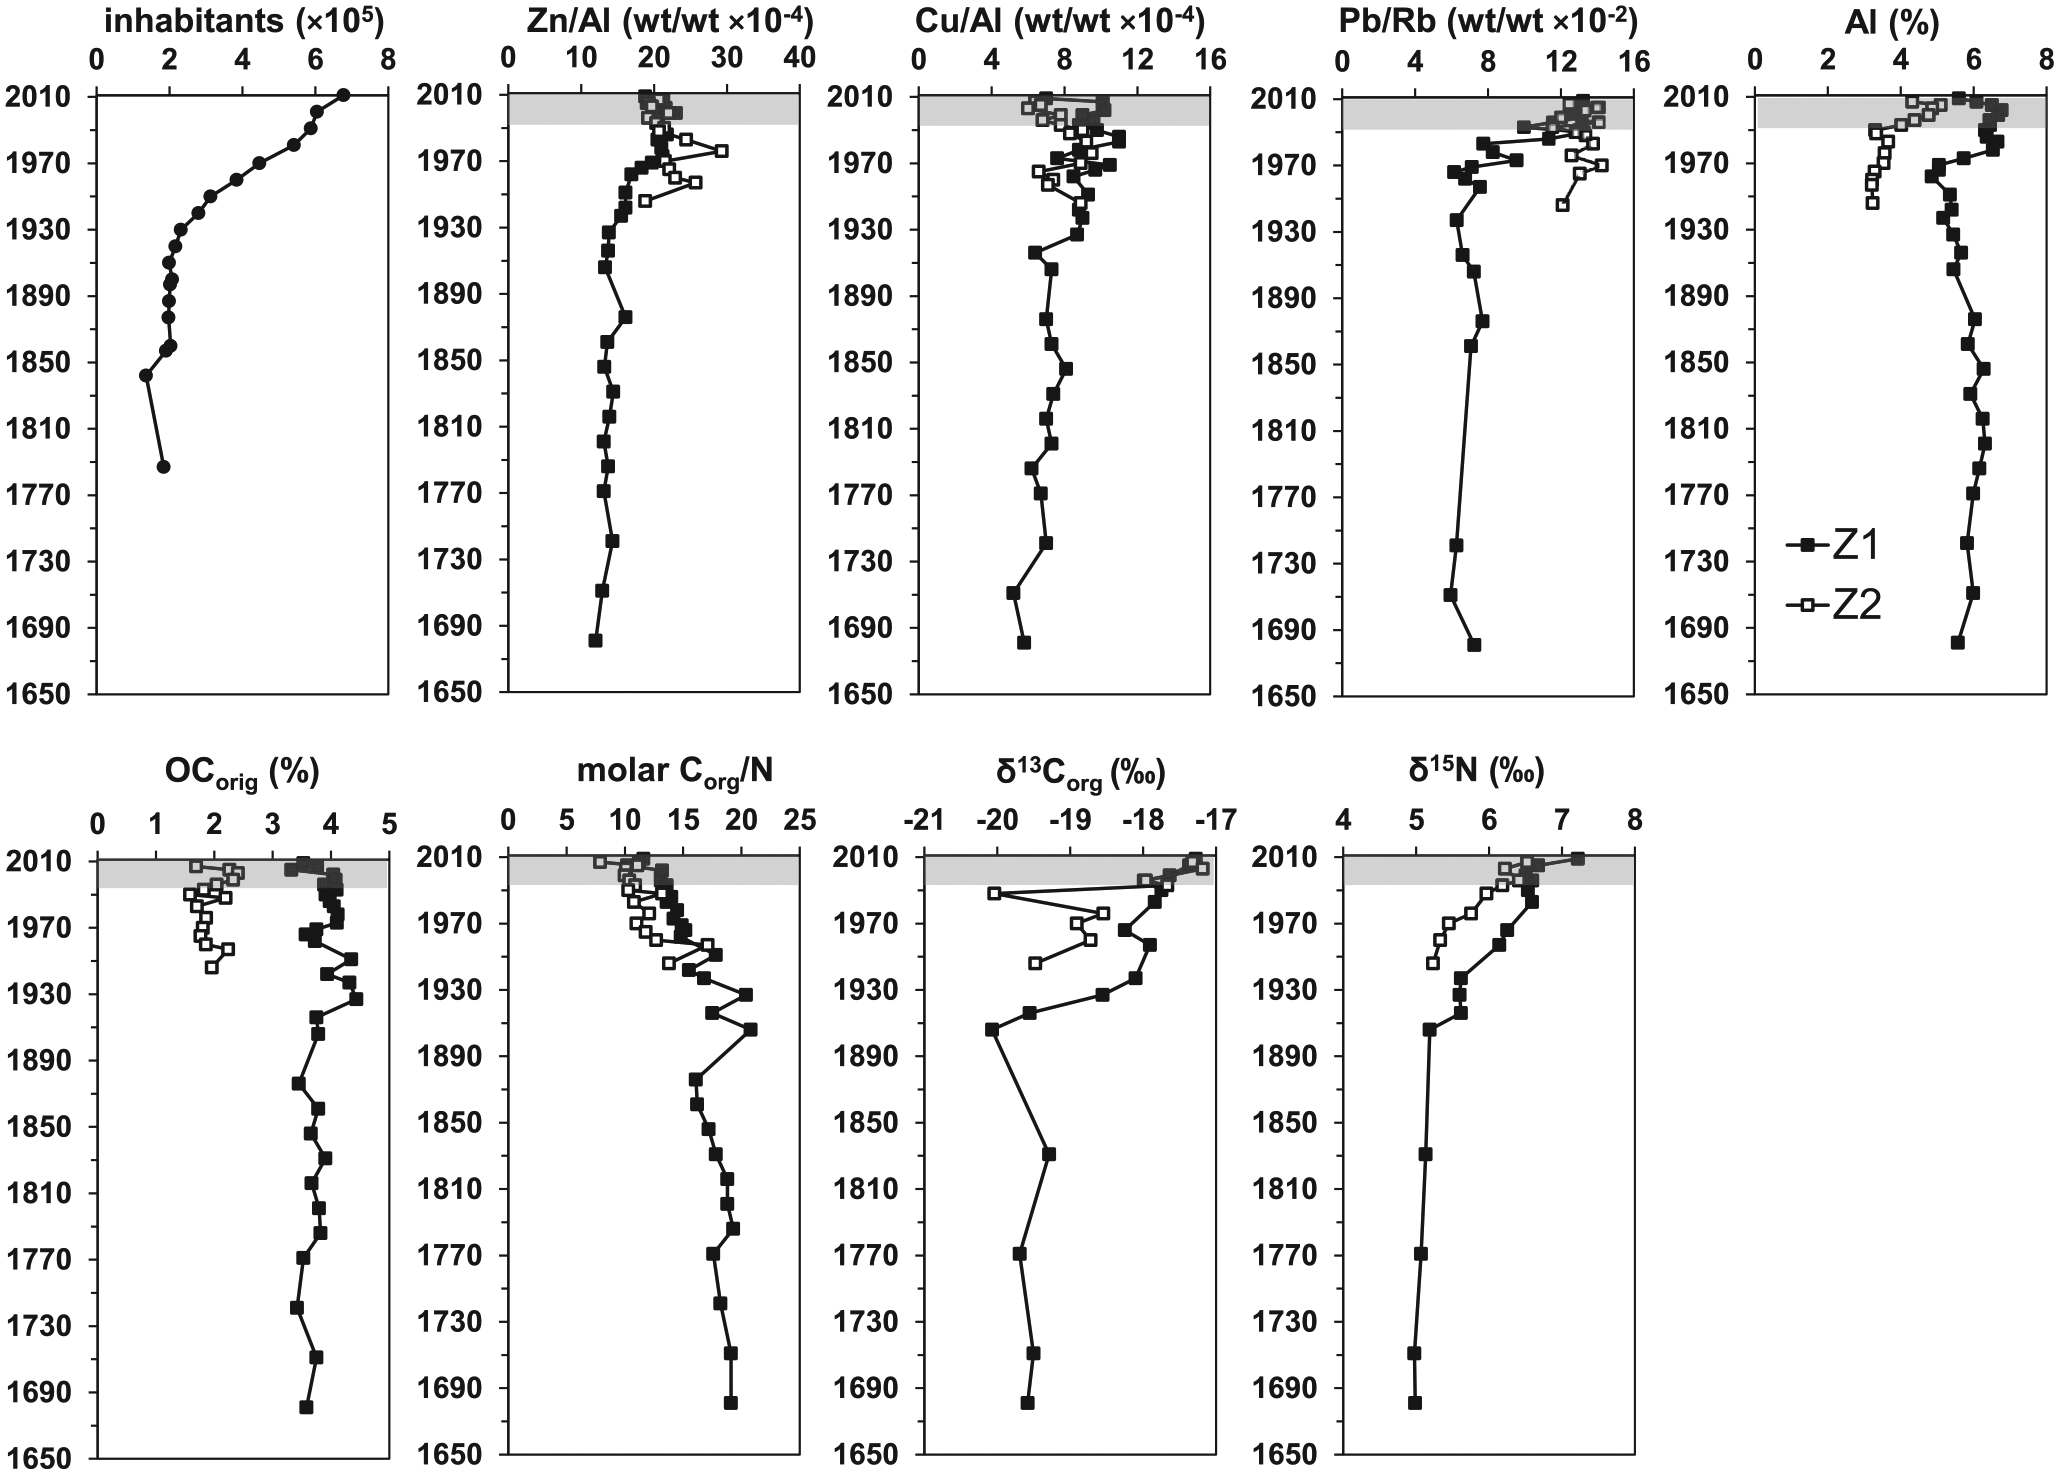
Summary diagram of the major environmental changes in the inner Cadiz Bay. Information on the number of inhabitants was obtained from census data gathered by the Spanish National Statistical Institute (INE). The calculation includes all of the municipalities that belong to Cadiz Bay from an administrative point of view, and/or that drain sewage into the watershed of the Guadalete, Salado and Iro Rivers (Cádiz, Chiclana de la Frontera, Puerto de Santa Maria, Puerto Real, Rota, San Fernando, Jerez de la Frontera, and San Jose del Valle). Grey-shaded area indicates the mixed layer (see section ‘Chronology’). Note that years correspond to approximated ages.
Human population in the Cadiz Bay area remained stable at around 200,000 inhabitants between 1787 and 1910, increasing rapidly to 700,000 at present. This population increase can be used as a proxy of historic anthropogenic impacts on the ecosystem and sediments. In addition, AC 1910 marks the onset of the industrial period for inner Cadiz Bay, and therefore, records prior to this date could represent more pristine conditions of the bay.
The inner Cadiz Bay has been progressively filled up with sediment over the last few centuries (Figure 8). In addition, sediment accumulation rates have accelerated several-fold since the 1930s. Present rates of sediment accumulation range from 0.5 to 1 g cm−2 yr−1, being 3–7 times higher than those found before the 1930s. This increase has occurred despite the construction of six dams in the main rivers draining into the wider Cadiz Bay since the 1960s, which is known to decrease sediment load to the coastal areas (Syvitski et al., 2005). The exponential population growth and the extensive transformation of the area due to urbanization, deforestation and agricultural activities, all of which increase soil erosion and sediment transport via rivers (Syvitski and Milliman, 2007), have more than compensated for the decrease caused by damming. Moreover, a higher confinement of the water body as a consequence of desiccation of old marshes, and construction of ports, drawbridges, and other maritime structures in Cadiz Bay, has also contributed to the increase in sediment accumulation during the 20th century. Although the increase in these rates is observed to a large extent within the mixed zone of Z1 and Z2 and should be interpreted with caution, this tendency actually starts at depths well below the mixing zone (see Supplementary Material, available online) indicating its validity. However, further studies with validation methods of 210Pb dating are needed to corroborate this tendency in the area.
The heavy metal content normalized to the terrigenous fraction (Zn, Cu and Pb) has increased since the 1930s (Figure 9), in agreement with previous historical studies on metal contamination in the area (Ligero et al., 2002, 2004). Ratios of Zn/Al and Cu/Al increased notably from 1930 to 1970, remaining more constant, or even decreasing (in Z2), since the 1980s. However, Pb/Rb ratios increased from the 1970s in Z1, and even from 1940 in Z2, up to the mid-1990s. These changes in heavy metal contamination clearly reflect the evolution of urban development, including increased road traffic (for Pb), and of the industrial activity (mainly naval) in the area (Gomez-Parra et al., 1984; Ligero et al., 2004, 2002; Ponce et al., 2000). In addition, these results suggest that levels of contamination in the inner Cadiz Bay were higher between 1970 and the mid-1990s.
Zinc, copper and lead are metals widely used in paint as anti-corrosion and anti-fouling agents in shipbuilding. The rapid increase in Zn/Al and Cu/Al ratios in the 1950s coincides with the peak in activity of the naval industry; the subsequent decrease in the 1980s corresponds with the closure of the naval industry in the area and its transformation to automobile and aerospace manufacturing (Figure 9). Conversely, the existence of other sources for Pb, such as motor vehicle emissions (Gomez-Parra et al., 1984; Ligero et al., 2004) or urban effluents (Ponce et al., 2000), can explain the different temporal evolution of the Pb/Rb ratio in comparison with Zn/Al and Cu/Al ratios. The introduction of unleaded gasoline at the end of 1980s significantly reduced contamination by this metal in Cadiz Bay in the following years (Ligero et al., 2004); however, an increased input of Pb via urban effluents due to population growth might explain why levels maintained high after the 1990s.
The organic carbon content of material that reaches the sediment (OCorig) showed a relatively constant value of 3.7 wt% from 1680 until the early 20th century in Z1 (Figure 9). Thereafter, OCorig increased slightly towards values >4 wt% during the first half of the 20th century, which was probably caused by the increase in human population. Since then, OCorig has remained constant despite an almost threefold increase in human population in the Cadiz Bay area (from 230,000 inhabitants in 1930 to 700,000 inhabitants in 2011). Similarly, OCorig in Z2 shows a constant value of 2 wt% since 1946. Given that the higher values in the first half of the 20th century compared with pre-1900s persist, this signifies that most of this Corg was autochthonous, produced within the inner bay by primary producers, and there was little input of anthropogenic organic material from land.
Available water column chlorophyll measurements in the inner Cadiz bay only go back as far as 1967 (Establier et al., 1990; Muñoz Perez and Sánchez de LaMadrid Rey, 1994). These data do not indicate any clear or significant increase in primary production for the period between 1967 and 1990. Our results also suggest that pelagic productivity in the inner Cadiz Bay has remained constant during the 20th century. Benthic primary producers like seagrasses and C. prolifera, on the other hand, play an important role in the overall primary production of the inner bay and contribute significantly to the Corg input to the bay (Morris et al., 2009). However, OCorig does not take into account the organic carbon derived from these marine macrophytobenthos. It is likely that benthic primary production has increased over the years as the basin has become shallower in parallel to increased anthropogenic inputs of nutrients.
The increase in OCorig since the early 20th century is associated with changes in the composition of the OM as evident by the profiles of Corg/N, δ13C and δ15N (Figure 9). The rather low Corg/N ratio in very recent sediments in Cadiz Bay, characteristic of marine primary producers (i.e. micro- and macroalgae) with lower Corg/N ratios than terrestrial plants (Meyers, 1994, 1997), and its steady decrease from the early 20th century up to the present suggest a higher contribution of marine produced Corg compared with terrestrial Corg. The higher marine Corg input could be attributed to either an increase in the autochthonous primary productivity or a decrease in the terrestrial supplies to the inner bay or both. Given that the Al content of sediment (a proxy for terrigenous supply) has remained relatively constant since the 17th century in Z1 and even increased notably since the 1970s in both stations (Figure 9), the first hypothesis is more plausible. In addition, the increase in sewage discharges over time would reduce the Corg/N ratio by increasing the N content in the primary producer biomass (Morris et al., 2009; Wigand et al., 2007). Consequently, an increase in nitrophilic species in the inner Cadiz Bay, such as C. prolifera and Ulva spp., has also likely contributed to lowering the sedimentary Corg/N ratio.
Major changes in δ13C and δ15N values in the sedimentary OM also occurred in the early 20th century due to population growth and changes in land use (Figure 9). The δ15N and δ13C increased from 5 and −20, respectively, since the early 20th century to >7 and −17 in contemporary sediments, suggesting an increase in marine primary productivity due to higher N inputs (Ellegaard et al., 2006; Voss et al., 2000). Inputs of anthropogenic OM from wastewater discharges and organic fertilizer runoff, which is rich in 15N, might be the cause of the increased δ15N surface values (Kendall et al., 2007). Indeed, Morris et al. (2009) demonstrated that the nutrients from urban and aquaculture effluents in Cadiz Bay were being assimilated by C. prolifera and C. nodosa, enhancing their δ15N values. Thus, benthic primary production increased since the early 20th century due to a higher input of nutrients as a consequence of the population increase. Moreover, the contribution of the benthic macroalgae to primary production seems to have increased over this period, as suggested by the Corg/N ratio decrease. All of this evidence reasonably suggests a major change in the trophic conditions of the inner Cadiz Bay during the 20th century.
Conclusion
Sedimentary records from the inner Cadiz Bay are suitable for reconstructing the recent past of this shallow water environment. However, post-depositional alteration, probably induced by human activities, has created a discontinuity in the sedimentary record, preventing environmental reconstruction from this discontinuity and below. These and other diagenetic overprints were differentiated from variability induced by environmental changes, via the interpretation of sedimentary profiles using multiple geochemical analyses.
Our results show that significant environmental changes have taken place in the inner Cadiz Bay during the 20th century. An increase in heavy metal pollution since the 1930s, reflected in the normalized depth profiles of Zn, Cu and Pb, in parallel to an increase in sediment accumulation rates, is observed. Changes in the trophic state of the water column were detected over the last century as indicated by the increase in OM input to the sediments and variations in Corg/N, δ13Corg and δ15N. Given that the population of Cadiz Bay tripled during this period, all these changes can be interpreted as tracers of anthropogenic influence in the area. The results of this study suggest that a multiproxy approach and the identification of diagenetic alteration are required for detailed environmental reconstructions in coastal sediments.
Footnotes
Funding
This research was funded by the Ministry of Education and Science, Spain (CTM 2009-10736, CTM2013-43857-R), and Andalusian Regional Government (P11-RNM-7199). JL Jiménez-Arias was funded by a FPI Grant (2010-063) from the University of Cadiz, Spain. E García-Robledo was funded by Ramon Areces Foundation (Spain). J Bohórquez was funded by an FPI Grant (BES-2010-035711) from the Ministry of Education and Science, Spain. S Papaspyrou was funded by a JAE-Doc fellowship (Programa JAE, JAE-Doc109, Spanish National Research Council) and a Marie Curie ERG Action (NITRICOS, 235005, European Union).