



Abstract
The timing of landscape change, post-settlement alluvium (PSA) deposition and gully erosion in the southeastern Australian Tablelands remains at the centre of a long-standing discussion over the geomorphological effects of European land-use compared with Aboriginal land-use and climate change. Few quantitative studies date the onset of gully erosion and subsequent PSA deposition in the Tablelands and those that do determine the timing of landscape change for individual catchments rather than across the region. In this study, we present optically stimulated luminescence (OSL) burial ages of swampy meadow (SM) sediment and PSA from six sites spread throughout the Goulburn Plains to place better regional constraints on the timing of landscape change. PSA burial ages at each of our sample sites range between 213 and 81 years before AD 2013, the year during which all samples were collected and measured – corresponding to AD 1800–1932. All measured PSA burial ages post-date European arrival to Australia and are therefore consistent with the generic name and implied age assigned to these sediments before quantitative age estimates were available for them. We suggest, however, that the term ‘post-European settlement alluvium’ may be more appropriate in the Australian context as Aboriginal Australians were living in the Tablelands prior to European arrival. Associations between the occurrence of gully incision and PSA deposition throughout the Tablelands and climatic factors are tenuous, and we suggest that European land-use practices in the region dominate landscape evolution, which had been driven by climatic factors throughout the Holocene.
Introduction
The continued and increasing use of agriculture has resulted in a total loss of more than half of the world’s forested and non-agricultural land (Hooke et al., 2012). Humans have used the world’s landscapes so intensively that the rate of modern soil erosion and sediment flux from river systems is significantly higher than natural soil production and sediment flux on geological timescales (Brown et al., 1998; Hooke et al., 2012; Montgomery, 2007; Reusser et al., 2015). Much of the world’s eroded soil, however, is never delivered to the ocean, but is trapped behind dams or reservoirs (Merritts et al., 2011; Walter and Merritts, 2008; Wilkinson and McElroy, 2007), or it is stored within river basins as aggradational stream deposits, often called post-settlement alluvium (PSA) (Brannstrom and Oliveira, 2000; García-Rodríguez et al., 2002; Knox, 2006; Richardson et al., 2014; Starr, 1989; Wilkinson and McElroy, 2007), usually referring to European colonization during the AD 1500s–1800s. Because PSA is typically deposited near its source, it compounds the effects of upland soil erosion by burying downstream agricultural land and filling wetland and fluvial ecosystems, leading some to conclude that soil erosion and PSA deposition are, together, some of the most concerning geomorphic processes in the world (Toy et al., 2002; Wilkinson and McElroy, 2007).
PSA deposition is neither a new phenomenon, nor does it occur only in land colonized by Europeans. Land clearance for mining in post–Industrial Revolution Great Britain, for example, resulted in sedimentation of valley bottoms (Foulds et al., 2013; Passmore and Macklin, 1994), and Lang et al. (2003a) note the presence of PSA-type sediments in the Rhine River of Germany following infrastructure projects in the AD 1800s. Moreover, the identification of PSA-type sedimentary deposits demonstrates that indigenous peoples had widespread geomorphological effects on their landscapes well before the European colonial era, including in New Zealand (Richardson et al., 2013), Mexico (Beach et al., 2006, 2009), the North Atlantic (Dugmore et al., 2000, 2005; Massa et al., 2012; Sandgren and Fredskild, 2008), Greece (Fuchs et al., 2004; Lespez, 2003), Ethiopia (Machado et al., 1998; Nyssen et al., 2004), South Africa (Damm and Hagedorn, 2010), Germany (Lang et al., 2003b), China (Kidder et al., 2012) and Bolivia (Coltorti et al., 2010).
As evidence builds for the argument that peoples and cultures around the world have contributed through time to the loss of over half of the world’s natural lands, Australia seems to be an exception. Australia was inhabited prior to ~50 ka (Olley et al., 2006; Roberts et al., 1994; Turney et al., 2001), 35 ka before humans set foot in the Americas (Waters et al., 2011), but Aboriginal Australians never adopted formalized agriculture (Yen, 1995). Aboriginal Australians undoubtedly used fire to modify their surroundings (Bowman, 1998); in southeastern Australia, however, the effect Aboriginal burning had on erosion over thousands of years has been shown to be minimal (Portenga et al., 2016). The only evidence of widespread sediment deposition resulting from anthropogenic activities seems to be PSA deposited after the arrival of Europeans (Gore et al., 2000; Rustomji and Pietsch, 2007; Starr, 1989; Wasson et al., 1998), but quantitative data on the ages of this PSA are sparse (e.g. Rustomji and Pietsch, 2007).
Studying sediment known to be the result of a change to drastically different land-use practices may therefore provide useful knowledge about the effects of human land-use and the processes that lead to PSA emplacement. For this reason, we focus on the southeastern Tablelands in New South Wales (NSW), Australia (Figure 1). The Tablelands is an ideal study area because of the recency of European arrival (Mitchell, 1839; Oxley, 1820), well-documented descriptions of the pre- and post-European landscape and regulated settlement limits set by the colonial government (Scott, 2001) such that the timing of landscape change should be apparent if caused by the introduction of European land-use practices.
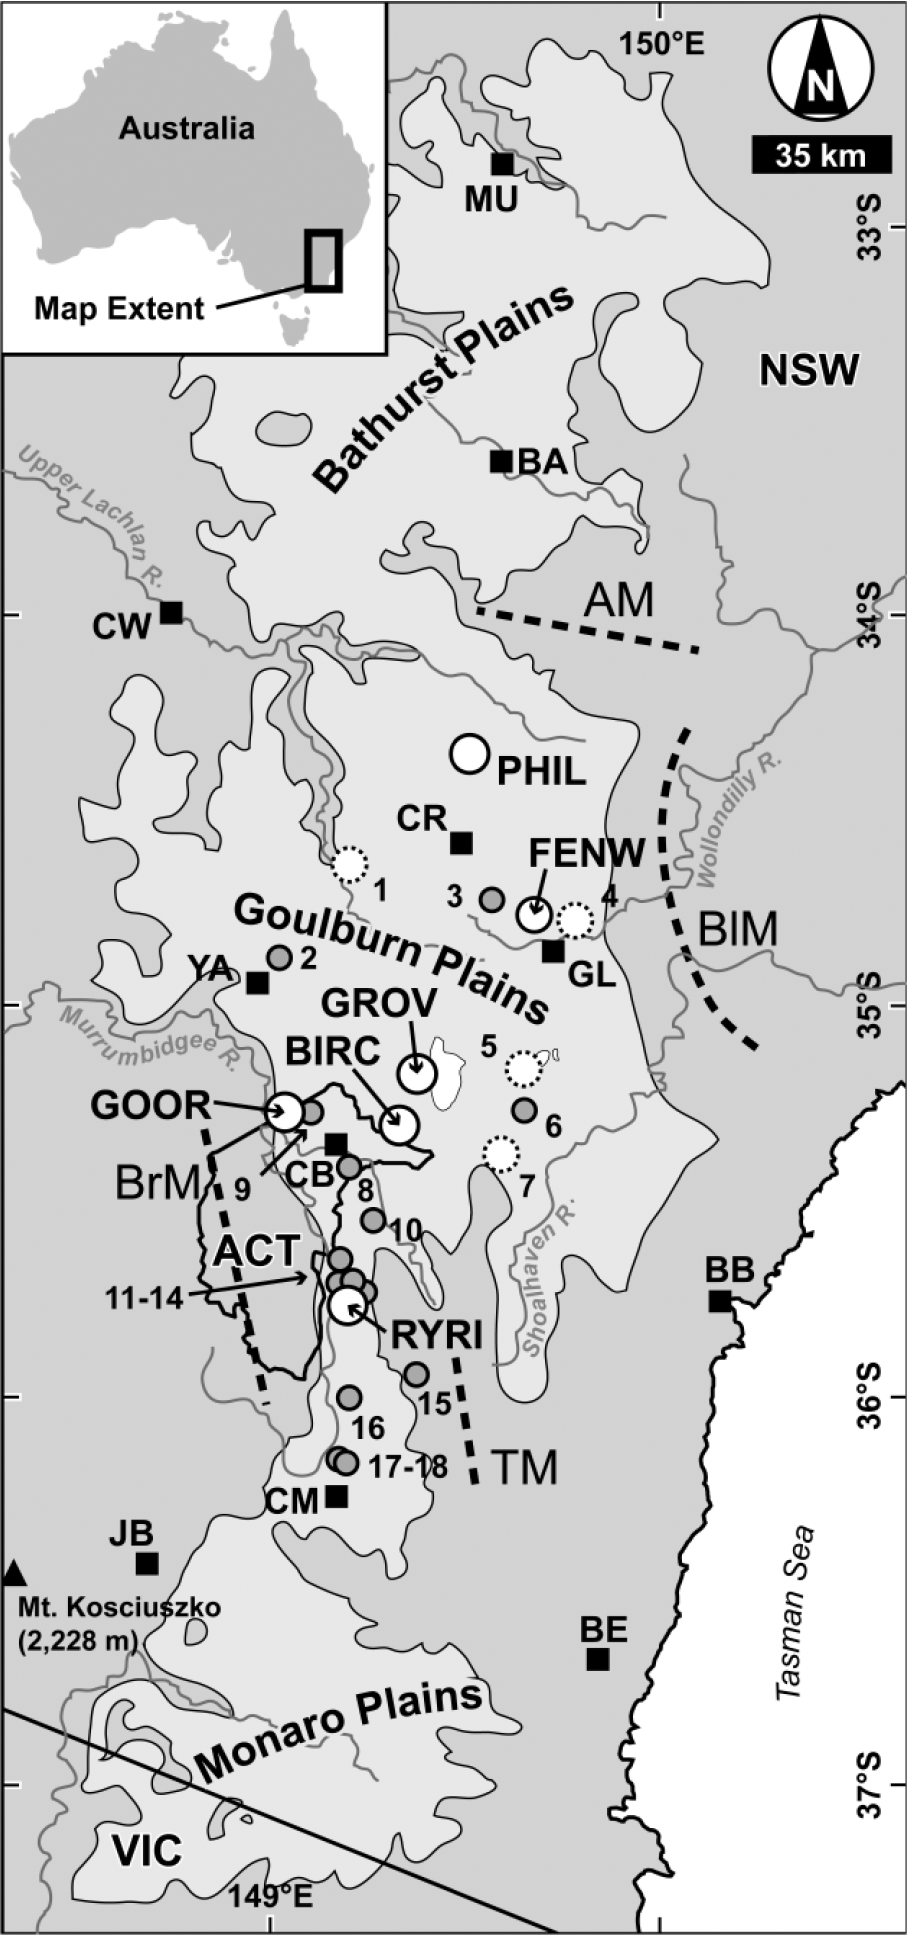
Reference map of Australia (inset) showing the extent of the southeastern Australian Tablelands. The main figure shows the southeastern Australian Tablelands (light grey region), which occupies elevations of 500–1000 m, halfway between sea level (Tasman Sea) and Australia’s highest point, Mt Kosciuszko (black triangle). Cities (black squares) and state boundaries are shown for geographic reference: MU: Mudgee; BA: Bathurst; CW: Cowra; CR: Crookwell; GL: Goulburn; YA: Yass; CB: Canberra; BB: Batemans Bay; CM: Cooma; JB: Jindabyne; BE: Bega; NSW: New South Wales; ACT: Australian Capital Territory; VIC: Victoria. Dashed bold lines show mountain ranges: AM: Abercrombie Mountains; BlM: Blue Mountains; BrM: Brindabella Mountains; TM: Tinderry Mountains. Sites where burial ages of swampy meadow sediments or PSA are determined from this study (solid white circles) or other studies (dashed white circles, see the main text for references), sites of gullies where incision ages are anecdotal or unknown (grey circles): BIRC: Birchams Creek; FENW: Fenwick Creek; GOOR: Gooromon Ponds Creek; GROV: Groves Creek; PHIL: Phils River; RYRI: Ryries Creek; 1: Grabben Gullen Creek; 2: Bango Creek; 3: Whiteheads Creek; 4: Wollondilly River; 5: Mulwaree River; 6: Boro Creek; 7: Mulloon Creek; 8: Jerrabomberra Creek; 9: Ginninderra Creek; 10: Burra Creek; 11: Waterhole Creek; 12: Michelago Creek; 13: Margarets Creek; 14: Teatree Creek; 15: Wangrah Creek; 16: Gungoandra Creek; 17–18: Numeralla Creek; 19: Gilmore Creek.
European exploration and settlement in Australia were initially focused within the Sydney area, but surveyors and explorers soon ventured from Sydney and returned with detailed descriptions, meteorological data, illustrations and anecdotes from the Tablelands (Blaxland, 1870; Evans, 1916; Lawson, 1813; Mitchell, 1839; Oxley, 1820; Scott, 2001; Wentworth, 1813). Further descriptions of the Tablelands shortly after European settlement and grazing began in the AD 1820s were kept in diaries and journals of early graziers (Meredith, 1844; Scott, 2001). Hillslopes of limited relief in the pre-European Tablelands landscape were covered in open woodlands with grassy understories, and valley bottoms were open with sedges and grasses growing in water-saturated wetlands called swampy meadows (SMs) (Eyles, 1977b; Mactaggart et al., 2008). Water flowing through these valley bottoms was typically not channelized but filtered through the SMs and sometimes collected in ponds – chains of ponds – which proved to be an invaluable source of water for grazing livestock (Eyles, 1977b; Scott, 2001).
The most notable changes to the Tablelands since European arrival include the deforestation of hillslopes to provide more land for grazing livestock and agriculture, the removal of nearly all SMs and chains of ponds and the nearly ubiquitous presence of stream incision forming rills on hillslopes and deep, often laterally expansive, stream gullies along valley bottoms and lower hillslopes (Figure 2) (Butzer and Helgren, 2005; Eyles, 1977a, 1977b, 1977c; Hughes and Prosser, 2003; Scott, 2001). Gully incision in upstream reaches of river catchments deposited mantles of PSA in valley bottoms, burying SM environments for up to tens of kilometres downstream (Muñoz-Salinas et al., 2014; Rustomji and Pietsch, 2007), a process that created a common valley bottom stratigraphy throughout the region consisting of dark clay-rich SM sediments overlain by the light-coloured and sandy PSA. This common stratigraphy has been subsequently exposed in gully walls by further stream incision into valley bottoms (Figure 2; Supplementary Figure 1, available online). Today, most eroded sediment is transported out of incised catchments during floods or is trapped behind farm dams (Neil and Fogarty, 1991). Recent evidence, however, shows that high magnitude floods can overtop gully banks and deposit tens of centimetres of PSA during one event (Portenga and Bishop, 2016).
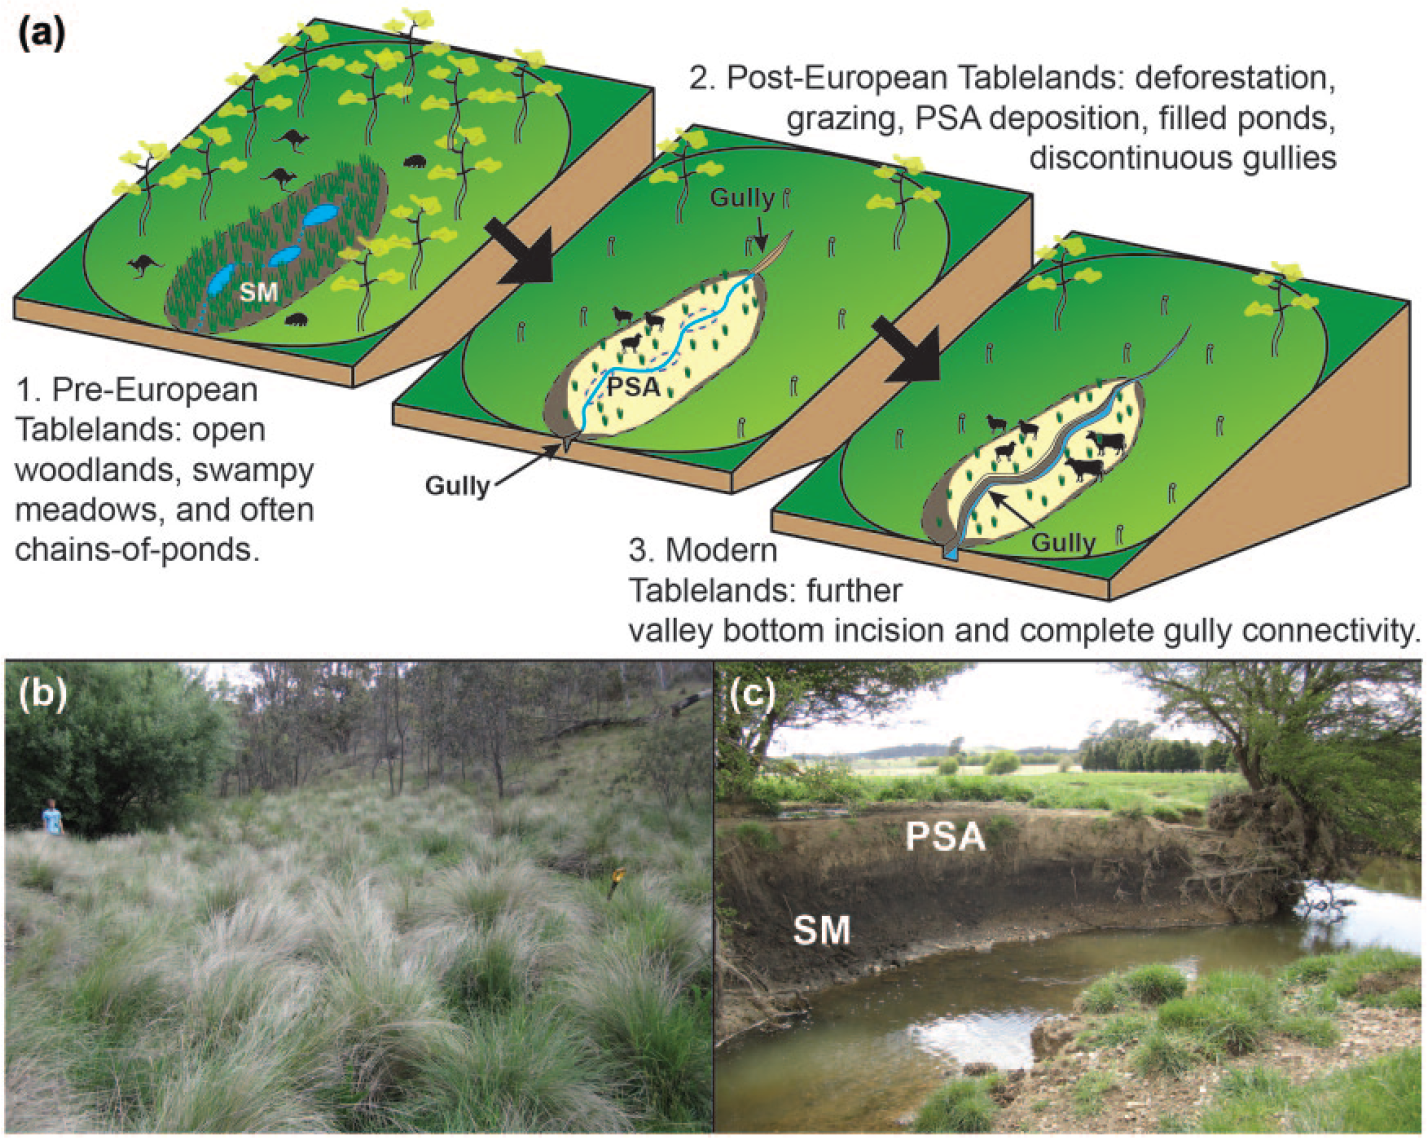
(a) Schematic diagram of a typical Tablelands stream catchment before landscape disturbance (left), after post-settlement alluvium (PSA) deposition during initial gully incision (middle) and after gully connectivity is complete (right). (b) Photograph of a modern swampy meadow (SM) landscape in the headwaters of Wangrah Creek with a person for scale, from Portenga and Bishop (2016). (c) Photograph of a gullied valley bottom at Primrose Valley Creek with PSA and SM sediments exposed in the gully wall. Gully wall is ~1.5 m in height above water level.
There are only a few direct observations of European land-use practices causing the development of gully systems in the Tablelands (Gillespie, 1981; Johnston and Brierley, 2006; Starr, 1989), although European artefacts preserved at the base of PSA deposits confirm that at least some of the widespread gullying in southeastern Australia must post-date European arrival (Gore et al., 2000; Rustomji and Pietsch, 2007; Starr, 1989; Wasson et al., 1998). The only truly quantitative evidence for a connection between post-European land-use changes and PSA deposition comes from optically stimulated luminescence (OSL) data at Mulwaree River near Tarago, NSW (AD 1833–1919), and Wollondilly River east of Goulburn, NSW (AD 1800–1978) (Rustomji and Pietsch, 2007).
Although PSA deposition and the gullies from which alluvium was derived seem to be inextricably linked to the impact of European land-use, the discussion is complicated by the disagreement in results derived from studies that quantify the timing of PSA deposition. Gully erosion in the Tablelands occurred numerous times throughout the Holocene (Eriksson et al., 2006) and some PSA deposits are believed to have been emplaced over SMs before European arrival to Australia (Johnston and Brierley, 2006; Muñoz-Salinas et al., 2014), implying that some gully erosion had been initiated by mechanisms other than European land-use change (Butzer and Helgren, 2005; Johnston and Brierley, 2006; Muñoz-Salinas et al., 2014). Perhaps this pre-European gullying was a result of climatic influences or Aboriginal Australian land-use, although the latter is unlikely (Portenga et al., 2016).
In this study, we present new OSL burial ages for PSA deposits collected throughout the Tablelands in an attempt to rectify the apparent mismatch between anecdotal evidence and quantitative data on the timing of gullying and PSA deposition (Prosser and Soufi, 1998; Prosser and Winchester, 1996). In addition, we compile all previous data and accounts of erosion and sediment deposition in the Tablelands and compare these ages with climate data over the last 200 years to better understand when landscape change occurred, allowing for a more detailed and thorough investigation of the potential factors that caused erosion and PSA deposition.
Methods
OSL is an optical property of minerals that is directly related to the time passed since sediment was last eroded, exposed to sunlight and reburied (Aitken, 1998). In nature, buried mineral grains are irradiated naturally by surrounding sediment and soil; as a result, electrons are excited and move to, and become trapped in, defects of the mineral crystal structure. Trapped electrons build up over time until the mineral is exposed to sufficient intensities of light, which stimulates electrons, releasing them from their traps and allowing them to return to a stable energy state, emitting photons (i.e. luminescence) in the process. The loss of luminescence during optical stimulation is called bleaching, and in most cases, bleaching the OSL signal in sediment only takes a few seconds (Godfrey-Smith et al., 1988). Thus, if OSL is measured in a controlled setting and the sediment dose rate is known, the burial age of sediment can be derived (Aitken, 1998) by the following equation:
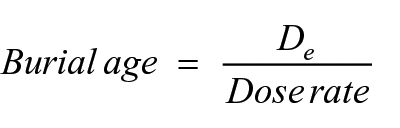
where the burial age is given in years and is the quotient of the equivalent dose (De), of measured OSL, given in units of Gray (Gy) and the dose rate (Gy/yr).
The De of completely bleached sediment is essentially the same throughout an aliquot of sediment, and the age can be modelled using a central age model (CAM) (Galbraith et al., 1999). Fluvial systems are often not ideal for complete bleaching of all mineral grains because of the refraction of light through water, and sediment is often deposited with an inherited accumulated luminescence (Duller, 1994; Li, 1994; Muñoz-Salinas et al., 2014). Aliquots of incompletely bleached fluvial sediment often result in overestimations of sediment burial ages if a CAM is used. Techniques that measure OSL of individual single grains of quartz and the development of a minimum age model (MAM) that isolates the grains with the greatest degree of bleaching based on De values and their associated errors (Galbraith et al., 1999) allow for precise and accurate ages to be determined on fluvial sediment (Olley et al., 2004; Rittenour, 2008).
Although incompletely bleached sediment is problematic for age-dating, it has recently been used in a handful of studies assaying general changes in OSL conditions in a variety of geomorphological settings (e.g. King et al., 2014; Muñoz-Salinas et al., 2011; Munyikwa et al., 2012). In a previous study in the Tablelands, Muñoz-Salinas et al. (2014) used bulk sediment OSL to identify the transition from SM valley bottom sediment to PSA deposition in Grabben Gullen Creek, interpretations which have recently been validated (Portenga and Bishop, 2016). We follow the same sampling strategy and measure bulk sediment luminescence emitted after stimulation by infrared stimulation (IRSL) and blue-light LED stimulation (BLSL). Our measurements are made on sediment aliquots collected at 3 cm intervals down SM and PSA stratigraphies exposed in gully walls throughout the Goulburn Plains. Following Portenga and Bishop (2016), we identify the transition between SM and PSA sediments in each profile at the depth where upwardly decreasing OSL of SM sediments changes into deposition of incompletely bleached PSA sediment.
We used the SM-PSA transition depth to guide OSL burial age sample collection at six sites with a range of catchment sizes and bedrock lithologies: Birchams Creek (BIRC), Fenwick Creek (FENW), Gooromon Ponds Creek (GOOR), Groves Creek (GROV), Phils River (PHIL) and Ryries Creek (RYRI) (Figure 1; Supplementary Figure 1, available online, Supplementary Table 1, available online). The close sample spacing (3 cm) identifies the precise depth of the SM-PSA sediment transition, allowing us to collect burial age samples from as close to the timing of landscape change as possible. Samples for OSL burial age estimation were collected using light-proof plastic tubes. The first age sample at each site (e.g. BIRC-A at Birchams Creek) was collected at the base of PSA, and the second sample (e.g. BIRC-B at Birchams Creek) was collected just below the SM-PSA transition, from the uppermost SM horizon. Sediment profile descriptions of the six chosen study sites were completed in the field (Figure 3; Supplementary Table 2, available online).
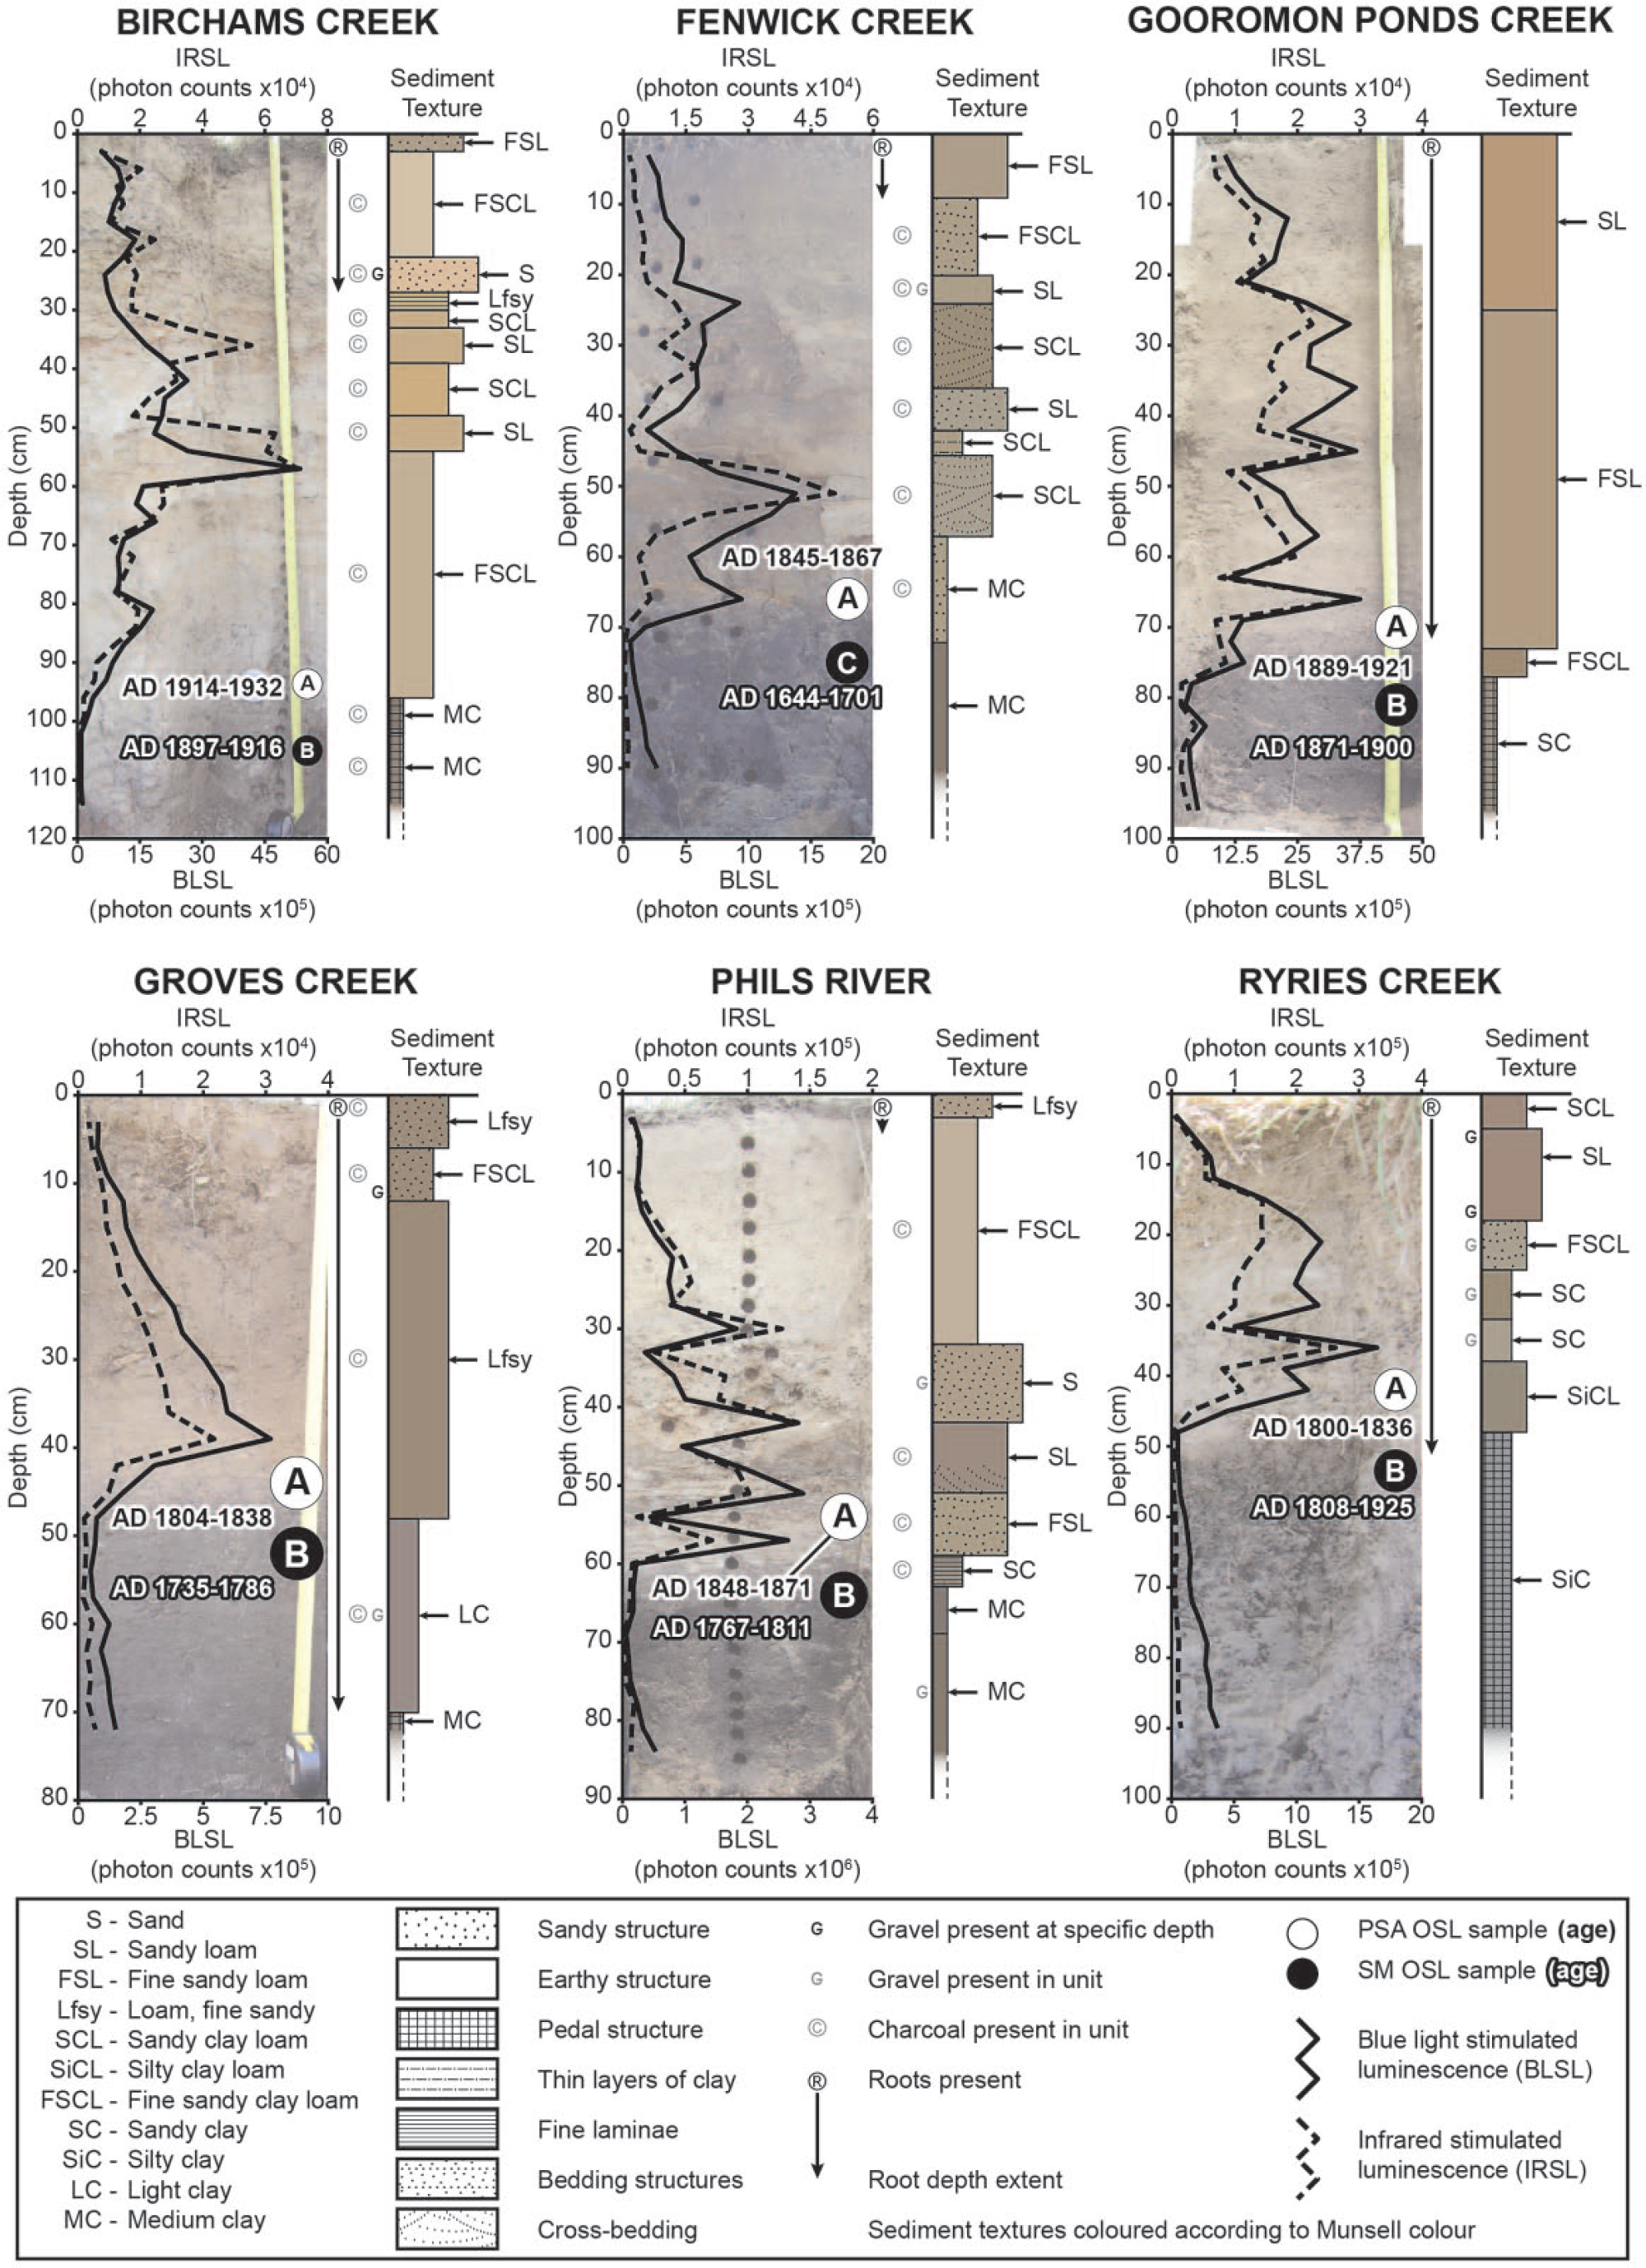
Bulk luminescence measurements and sediment descriptions of SM and PSA at Birchams Creek, Fenwick Creek, Gooromon Ponds Creek, Groves Creek, Phils River and Ryries Creek. Photographs of SM-PSA exposures are in the background of each plot and are to scale with the depth axis. Photographs of full field context of sample sites and detailed sediment profile descriptions are provided in the Supplementary Material (available online).
In situ gamma radiation was measured at each site using a portable gamma spectrometer; beta counting and high-resolution gamma dosimetry were measured in the laboratory on sediment from the ends of the plastic collection tubes. High-resolution gamma dosimetry was used with beta dosimetry and cosmic ray dose estimates to determine dose rates for PSA samples, while in situ gamma dosimetry was used with beta dosimetry and cosmic ray dosing to determine dose rates for SM samples (see Supplementary Material, available online). Quartz in the 180- to 212-µm grain size fraction was isolated from unbleached sediment for burial age determinations from the centre of each sample tube by a series of acid and peroxide treatments, density separations and sieving (Aitken, 1998; Olley et al., 2004). In this study, we used OSL quartz single-grain techniques, incorporating a modified SAR protocol measured in a TL-DA-20 Risø unit containing the single-grain attachment (Bøtter-Jensen et al., 2000, 2003; Murray and Wintle, 2000). Ultraviolet emissions were detected by an Electron Tubes Ltd 9235QA photomultiplier tube fitted with 7.5 mm of Hoya U-340 filter. Not all quartz grains yield reliable OSL signals for dating purposes, and acceptable OSL data were only used from quartz grains that satisfy certain criteria (Roberts, 2008). We thus use Jacobs et al.’s (2006) grain rejection criteria to remove poor-quality data from burial age analyses (Supplementary Table 4, available online). OSL from individual grains of quartz was measured from at least 1000 grains or until enough quartz was measured for ~100 grains to pass rejection criteria. Refer to the Supplementary Material (available online) for detailed sample collection, preparation and measurement details and information on dosimetry calculations.
Results
Down-profile trends of bulk sediment OSL measurements from the six sample sites are similar to those measured through SM and PSA deposits elsewhere in the Tablelands (Muñoz-Salinas et al., 2014; Portenga and Bishop, 2016). Both IRSL and BLSL at each profile decrease upwards through SM sediment and increase abruptly in the basal PSA (Figure 3). The change in bulk OSL above and below the SM-PSA transition at each site corresponds to sediment texture changes at the SM-PSA transition (Figure 3; Supplementary Table 2, available online); we use the agreement between the bulk sediment OSL transition depth and sediment stratigraphy to guide our placement of burial age samples.
Between 1341 and 5663 treated quartz grains were analysed to identify ~100 useable quartz grains per sample. Only 6% of total measured grains were accepted, and the majority of rejected grains had measured OSL less than 3× that of the background (Supplementary Table 3, available online). Although all quartz grains from both Ryries Creek samples were analysed, the 100-grain threshold was not met, each sample only yielding ~75 accepted grains.
Equivalent dose (De) determinations from accepted quartz grains from each of the 12 samples are plotted in Figure 4 and exhibit high overdispersion (69–166%). MAM-derived De estimations for each sample are combined with high-resolution dosimetry measurements (Supplementary Table 4, available online), yielding SM burial ages ranging from 341 ± 28 to 107 ± 10 years (Figure 5, Table 1), where the benchmark year (0 year) is AD 2013, when all samples were collected and measured. All uncertainties reported here, and throughout the paper, are 1σ, unless otherwise noted. Within 1σ uncertainties, PSA burial ages range from 195 ± 18 to 90 ± 9 years, all post-dating the arrival of Europeans to Australia. There are no signs of stratigraphic inversion of the OSL ages at most sites, the uppermost SM horizons being as old or older than the overlying PSA deposits.
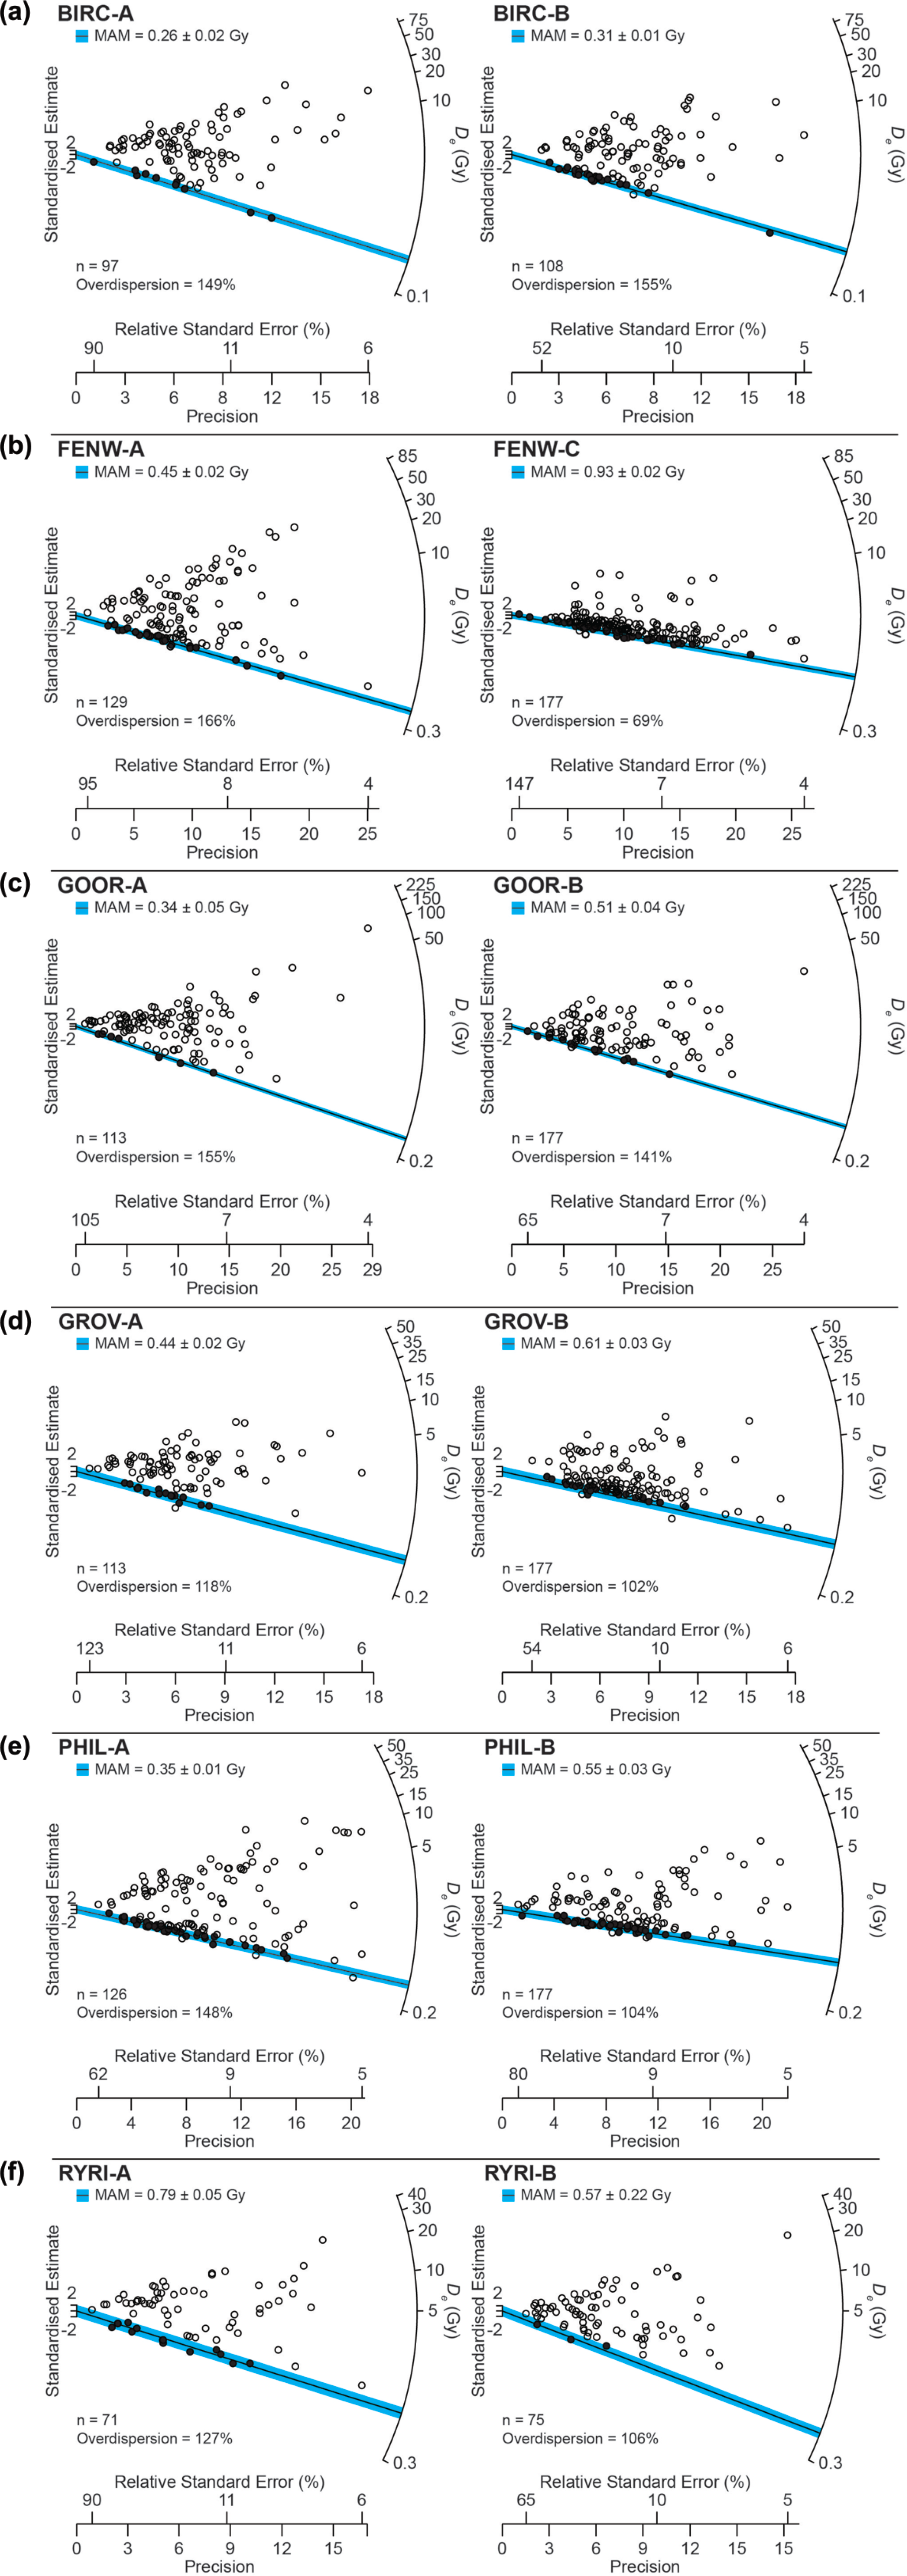
Radial plots showing equivalent dose (De) distributions from OSL measurements on single grains of quartz from (a) Birchams Creek, (b) Fenwick Creek, (c) Gooromon Ponds Creek, (d) Groves Creek, (e) Phils River and (f) Ryries Creek. The minimum age model (MAM) was used to calculate burial ages for all samples due primarily to the fluvial nature of the sample sites. Quartz grains included in the MAM estimates of the De for each sample are shown by filled black circles and the MAM-derived De value is shown by the solid black line and blue bar. Corresponding MAM burial ages are in Table 1.
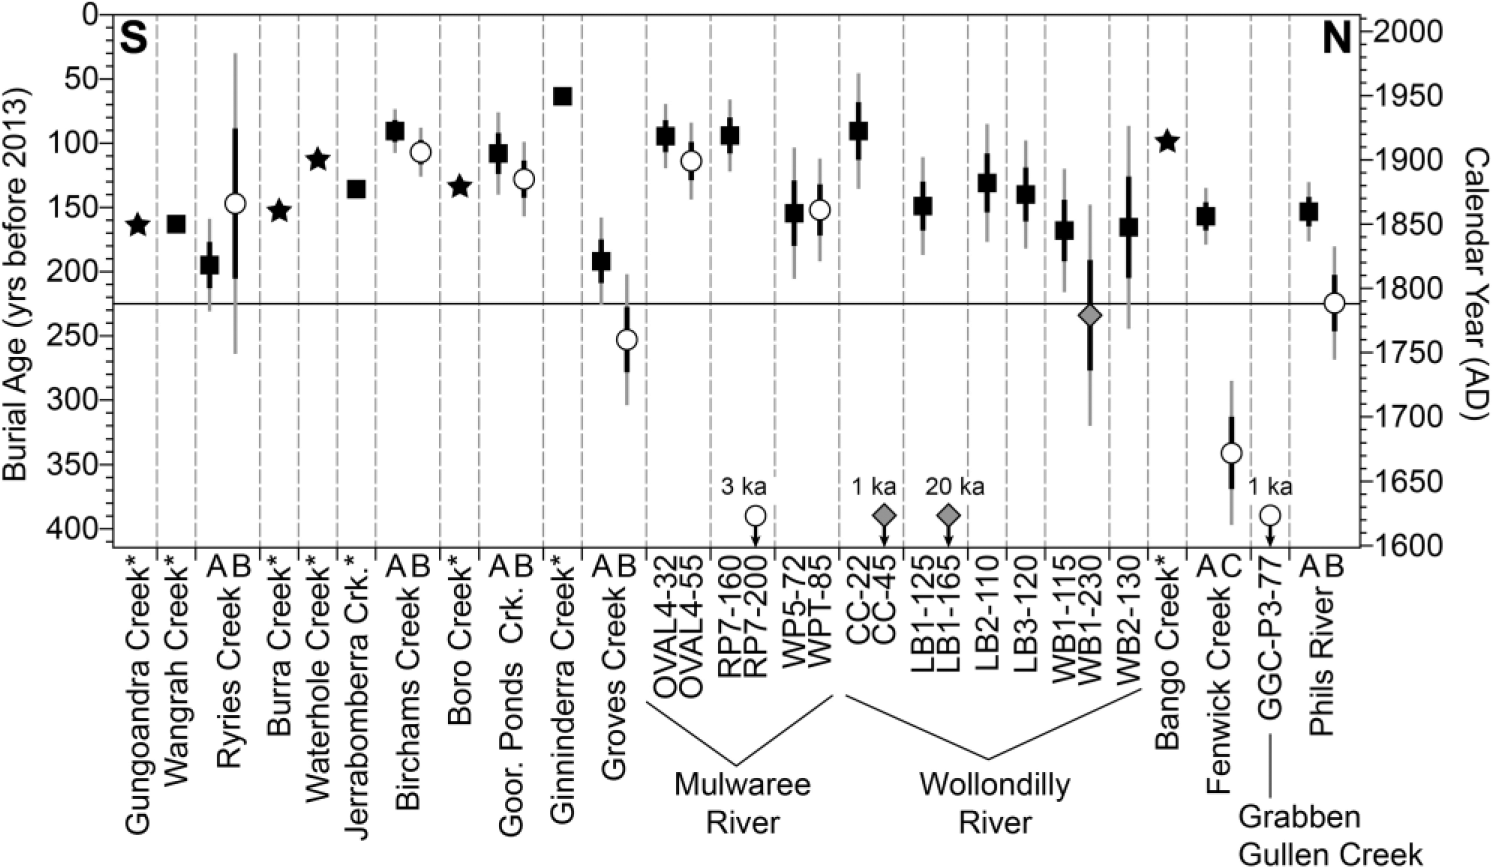
Burial ages of Tablelands SM and PSA samples (white circles and black squares, respectively); grey diamonds are OSL samples from non-SM alluvium buried by PSA; black stars are ages of gully incision from historical accounts. Solid black and grey vertical lines are 1σ and 2σ errors on OSL ages, respectively. Ages of catchments marked with an asterisk (*) are only best-approximations from the original source. All catchments are arranged generally from South to North. Data comes from this study, Erskine and Melville (1984), Eyles (1977a, 1977b, 1977c), Gillespie (1981), Gillespie et al. (1992), Muñoz-Salinas et al. (2014), Prosser (1991), Prosser and Abernethy (1996), Rustomji and Pietsch (2007), Starr (1989) and Wasson et al. (1998). Vertical dashed grey lines group samples from the same sediment profile. Note that only the two samples closest to the SM-PSA transition are included in this figure. Horizontal black line indicates the calendar year AD 1788 when Europeans arrived in Port Jackson – present-day Sydney, New South Wales.
Optically stimulated luminescence burial ages.
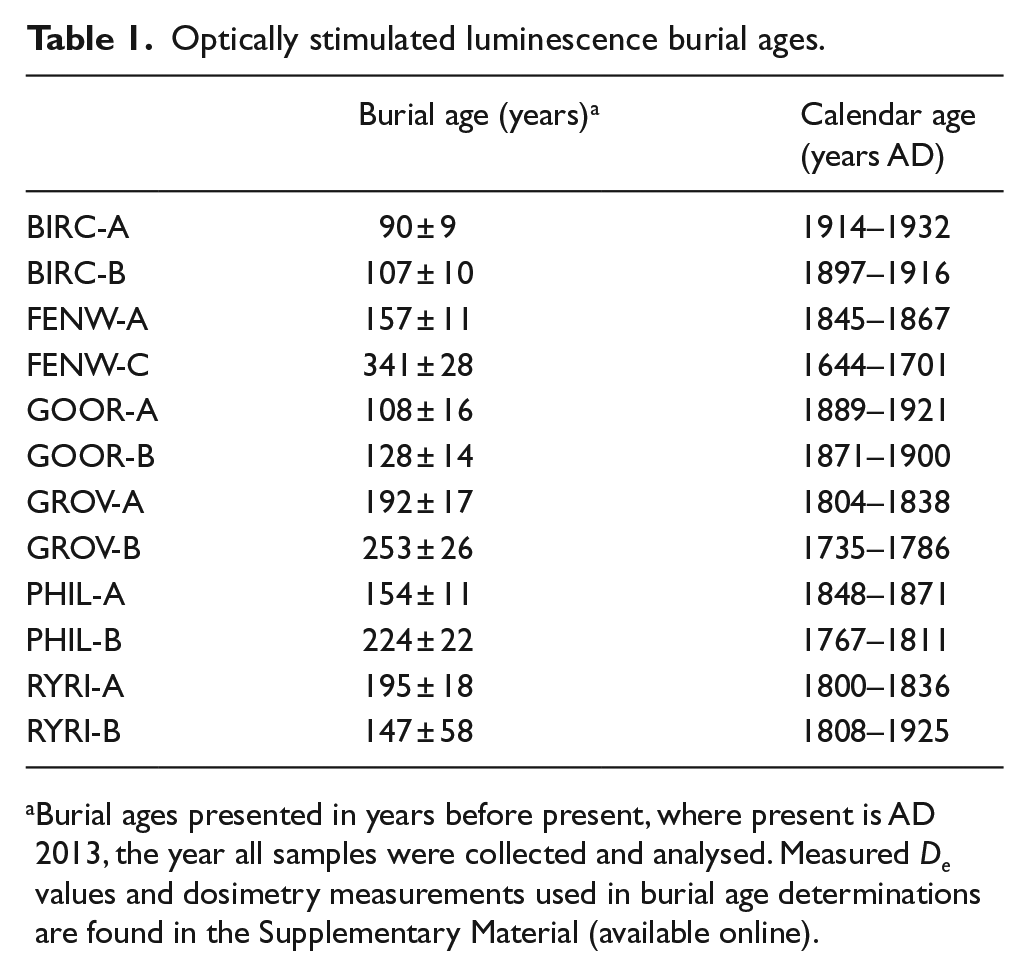
Burial ages presented in years before present, where present is AD 2013, the year all samples were collected and analysed. Measured De values and dosimetry measurements used in burial age determinations are found in the Supplementary Material (available online).
Discussion
Integrity of burial ages
PSA samples all exhibit a wide range of De values, and considering that PSA is alluvium (cf. Muñoz-Salinas et al., 2014; Portenga and Bishop, 2016), the overdispersion of De values probably reflects partial bleaching of sediment prior to burial. Some PSA samples, however, also appear to have more than one population of De values (e.g. FENW-A, PHIL-A; Figure 4). Muñoz-Salinas et al. (2014) showed that the luminescence of the most incompletely bleached PSA aliquots reflects the luminescence of its source material, which is dependent on lithology. Given that the catchments from which our PSA samples were taken are underlain by one dominant lithology, we reason that the upper limit of De values from PSA represents the luminescence of the soils from which PSA was derived in each respective catchment. Conversely, SM samples should comprise mostly well-bleached sediment with little inheritance (Muñoz-Salinas et al., 2014; Portenga and Bishop, 2016). This observation seems to hold true for individual quartz grains from SM samples, shown by a clear clustering of quartz grains at the low end of the radial scale – best illustrated by FENW-C (Figure 4). Although SMs are typically low-energy environments, they still likely received incompletely bleached sediment transported by occasional flooding. We believe this phenomenon is reflected in the similar degrees of overdispersion between SM and PSA samples at each site and the fact that the maximum De values in each SM sample (with the exception of one grain in GROV-B) are equal to, or less than, the maximum De values of each PSA sample. Therefore, due to the alluvial nature of PSA and the likely introduction to SM environments of quartz with some inherited luminescence during pre-PSA floods, we interpret burial ages of all of our samples using the MAM rather than the CAM. Furthermore, since secondary populations of quartz grains with large De values likely represent the incompletely bleached luminescence of the sediment source material, we focus our analysis only on the populations of grains with the lowest De values using the MAM.
A detailed depositional history at any of the sample sites cannot be derived from only two samples; however, the chronologic agreement in ages and lack of stratigraphic inversion at our sites supports the notion that SM environments were present throughout the Tablelands into the AD 1800s and that all sampled PSA deposits are post-European in age. The one possible exception from the dataset is Ryries Creek. Here, the burial age of SM sediment is 147 ± 58 years corresponding to AD 1808–1925 and incorporating large 1σ uncertainties; PSA at Ryries Creek was deposited at 195 ± 18 years, or AD 1800–1836. While both SM and PSA ages at Ryries Creek are derived from substantially fewer quartz grains than all other sites (n = 75 and 71, respectively), a similar number of accepted quartz grains lie within the ±2 standard estimate of the MAM-derived De value at RYRI-A, compared with other PSA sites, whereas significantly fewer accepted grains lie within the De ± 2 standard estimate for SM sediment at RYRI-B, compared with other SM sites. Thus, we find no reason to doubt the PSA burial age at Ryries Creek; moreover, it is plausible that had more sediment been collected from RYRI-B, the 100-grain threshold would be met, the precision on the burial ages would increase, the large uncertainties on its age would reduce, and the resultant burial age would be less than or equivalent to the burial age of RYRI-A.
Post-European settlement alluvium
The coincidence of all PSA depositional ages with the post-European era of Tablelands settlement within 1σ uncertainties strongly confirms traditional geomorphological interpretations and complements Rustomji and Pietsch’s (2007) data showing that the sediments they dated are post-European. While 1σ age uncertainties of GROV-A and RYRI-A from this study, and WB2-130 from Rustomji and Pietsch (2007), are completely within the post-European era of Tablelands history, the lower limit of 2σ errors of the burial ages correspond to the years AD 1787, 1792 and 1769, respectively, and could be used to argue for pre-European PSA deposition in Australia. We, however, argue that they emphasize how quickly the Tablelands responded, geomorphologically, to European land-use by the first graziers in the AD 1820s or that they reflect landscape response to squatters who started grazing the Tablelands shortly after exploration in the early AD 1800s (Scott, 2001). Although the 2σ age from Rustomji and Pietsch’s (2007) sample, WB2-130, predates European arrival, all other PSA ages from the Wollondilly River site are well within the post-European era. In short, PSA was emplaced after European arrival and is correctly referred to as ‘post-settlement’.
The Tablelands had been ‘settled’ by Aboriginal Australians for thousands of years, however (Flood et al., 1987; Stockton and Holland, 1974), so PSA should be redefined, at least in the Tablelands, as post-European settlement alluvium. Outside of Australia, redefining PSA in the Tablelands may seem trivial, but in the Australian context, this redefinition importantly acknowledges the presence of Aboriginal Australians in the Tablelands prior to European arrival and that Aboriginal use of fire to manage the landscape likely had little geomorphological impact on erosion and sediment deposition (Portenga et al., 2016). We maintain the use of the acronym PSA as it is widely used to refer to post-European settlement and its effects in other European-colonized lands (e.g. Booth et al., 2009; Brannstrom and Oliveira, 2000; Kreznor et al., 1990; Merritts et al., 2011; Wilkinson and McElroy, 2007). However, we take care here to reiterate that PSA-type sediments are found in post-disturbance landscapes around the world and not just those altered by European land-use (e.g. Beach et al., 2006; Foulds and Macklin, 2006; Fuchs et al., 2004; Lang et al., 2003a; Nyssen et al., 2004).
Chronology of gully erosion in the Tablelands
The new PSA ages presented in this study are not the first to come from the Tablelands (i.e. Rustomji and Pietsch, 2007). Our new data and the following discussion, however, do provide the first integrated regional examination of PSA deposition, and by proxy, erosion of upstream valley bottoms by gully incision.
The oldest instance of PSA deposition occurred at Ryries Creek between AD 1800 and 1836, meaning that if gullying associated with PSA deposition resulted from land-use change, it came very early in the history of European settlement in the Goulburn Plains. Drainage basins in the adjacent Tinderry Mountains that are currently covered by native forests show no signs of incision (Neil and Fogarty, 1991) nor have PSA deposits been reported for these catchments, implying that incision and subsequent sediment deposition is associated with land-use practices that decrease native vegetation cover. According to Starr’s (1989) interviews with local families, the first permanent graziers at Michelago, NSW, arrived in AD 1828 and Starr concluded that gullying in Michelago Creek and its tributary catchments began within the first 30–40 years of settlement. In the middle of the Goulburn Plains, PSA was deposited in Groves Creek between AD 1804 and 1838. Cattle were being grazed in this area by AD 1825 (Scott, 2001) and Groves Creek is near Mulwaree River, where one of Rustomji and Pietsch’s (2007) single-grain OSL age profiles (WP5) shows that some PSA deposition occurred between AD 1833 and 1884 (Figure 5). As with Ryries Creek to the south, the likely timing of gully incision and PSA deposition at Groves Creek was shortly after European arrival.
European squatters arrived in the Goulburn and Crookwell regions of NSW by AD 1828 and deforestation began in the late AD 1830s for grazing and crop-based agriculture (Bayley, 1975). Near Goulburn, PSA was deposited in Fenwick Creek between AD 1845 and 1867, closely agreeing with five of the six profiles along nearby Wollondilly River showing PSA deposition between AD 1808 and 1905 (Figure 5) (Rustomji and Pietsch, 2007). Local gullying is extensive, but no other dates are available and historical data are scarce; however, PSA deposition ages at Phils River (AD 1848–1871) north of Crookwell, NSW, are nearly identical to those at Fenwick Creek. West of Crookwell, PSA has been examined along Grabben Gullen Creek (Muñoz-Salinas et al., 2014), and a trend line drawn through an OSL age–depth plot of SM sediments suggests a pre-European age for PSA deposition. Due to its geographical proximity, PSA at Grabben Gullen Creek may have been deposited contemporaneously with that at Phils River and Fenwick Creek, in which case Muñoz-Salinas et al.’s (2014) suggested age of Grabben Gullen Creek PSA is an overestimate, possibly from undetected erosion of SM or a period of no SM accumulation prior to PSA deposition. Thus, ages available from the northern Goulburn Plains indicate that the PSA deposition and gully erosion likely did not begin until the mid AD 1800s, contemporaneous with ongoing gullying and PSA deposition in the southern Goulburn Plains in Burra, Gungoandra, Mulwaree, and Wangrah Creeks and the Michelago area (Eyles, 1977c; Gillespie et al., 1992; Prosser, 1991; Prosser and Abernethy, 1996; Rustomji and Pietsch, 2007; Starr, 1989) (Figure 5).
Landowners west of Lake George began clearing land by the AD 1850s (Gillespie, 1981) and initial gully incision likely occurred shortly thereafter. PSA deposition at Gooromon Ponds Creek began between AD 1889 and 1921, coinciding with settlement in the Canberra region as evidenced at Jerrabomberra Creek where gullying had initiated by AD 1878 (Wasson et al., 1998). PSA deposition at Gooromon Ponds Creek is perched on a high abandoned terrace that extends beyond its confluence with neighbouring Ginninderra Creek, which experienced gully erosion in the mid AD 1900s (Eyles, 1977b) resulting in PSA deposition at this confluence. Because PSA along Ginninderra Creek is exposed at a lower elevation than along Gooromon Ponds Creek, it must have been deposited after emplacement of PSA at Gooromon Ponds Creek. This chronological interpretation is supported by the GOOR-A age, which shows that PSA along Gooromon Ponds Creek occurred in the early AD 1900s.
Birchams Creek, the youngest site of our new dataset, shows PSA deposition between AD 1914 and 1932, well after the start of PSA deposition at nearby Groves Creek, but nonetheless coinciding with continued deposition at Mulwaree and Wollondilly Rivers into the AD 1900s (Rustomji and Pietsch, 2007). Eyles’ (1977a) time series of pond and gully locations along Birchams Creek conceptualizes the transition from a valley bottom chain of ponds to a continuous gully. The absence of gullying in Birchams Creek in AD 1880 and its presence by AD 1941 are consistent with the time constraints provided here for PSA deposition at BIRC-A. Gooromon Ponds and Birchams Creeks are only ~20 km apart and their PSA ages are similar enough to suggest that gully erosion and PSA deposition intensified in the central Goulburn Plains in the early AD 1900s, just as it had at nearby Bango Creek in AD 1915 (Gillespie, 1981) and Waterhole Creek (Eyles, 1977b) (Figure 5).
Investigations at Boro Creek (Erskine and Melville, 1984) and Jerrabomberra Creek (Wasson et al., 1998) found fence lines and other European artefacts within sandy overbank deposits. Wire fences were not available in this region until the AD 1860s and not widely used until the AD 1880s (Hancock, 1972; Pickard, 2007, 2010), meaning gully erosion and PSA deposition at Boro and Jerrabomberra Creeks could not have occurred as early as at Ryries Creek, Groves Creek or WP5 from Mulwaree River in the early AD 1800s. Rather, PSA deposition in these creeks was likely concurrent with deposition at Gooromon Ponds and Birchams Creeks in the late AD 1800s to the early AD 1900s (Figure 5).
European land-use change in a changing climate
All new PSA age data from this study, and all previous quantitative and anecdotal histories of gully incision and PSA deposition in the Goulburn Plains, support the notion that European land-use changes within a catchment make the landscape more susceptible to erosion during storms (Prosser, 1991) rather than being driven by climatic factors alone. European land-use likely had a great effect on landscape vegetation cover. The role vegetation cover plays in protecting sediment from erosion by sheetwash and rain splash in southeastern Australia is well documented, as is the notion that widespread sediment erosion and deposition will occur if vegetation health declines over time (Erskine and Melville, 1984; Eyles, 1977a, 1977b, 1977c; Gale and Haworth, 2002; Gillespie, 1981; Johnston and Brierley, 2006; Muñoz-Salinas et al., 2014; Neil and Fogarty, 1991; Olley and Wasson, 2003; Page and Carden, 1998; Prosser, 1990; Prosser and Soufi, 1998; Prosser et al., 1994; Rustomji and Pietsch, 2007; Starr, 1989; Warner, 1984; Zierholz et al., 2001). Vegetation cover, stressed by drought, decreases during arid climate conditions, and as a result, more sediment can be eroded and deposited than during wetter periods when vegetation cover is greater and not stressed. This phenomenon is illustrated throughout the Holocene by observations that fluvial activity and sediment deposition have been linked to periods of prolonged low water levels in Lake George, which is dictated by rainfall and evaporation because of it being an endorheic catchment (Cohen and Nanson, 2007; Eriksson et al., 2006; Fitzsimmons and Barrows, 2010) (Figure 6).
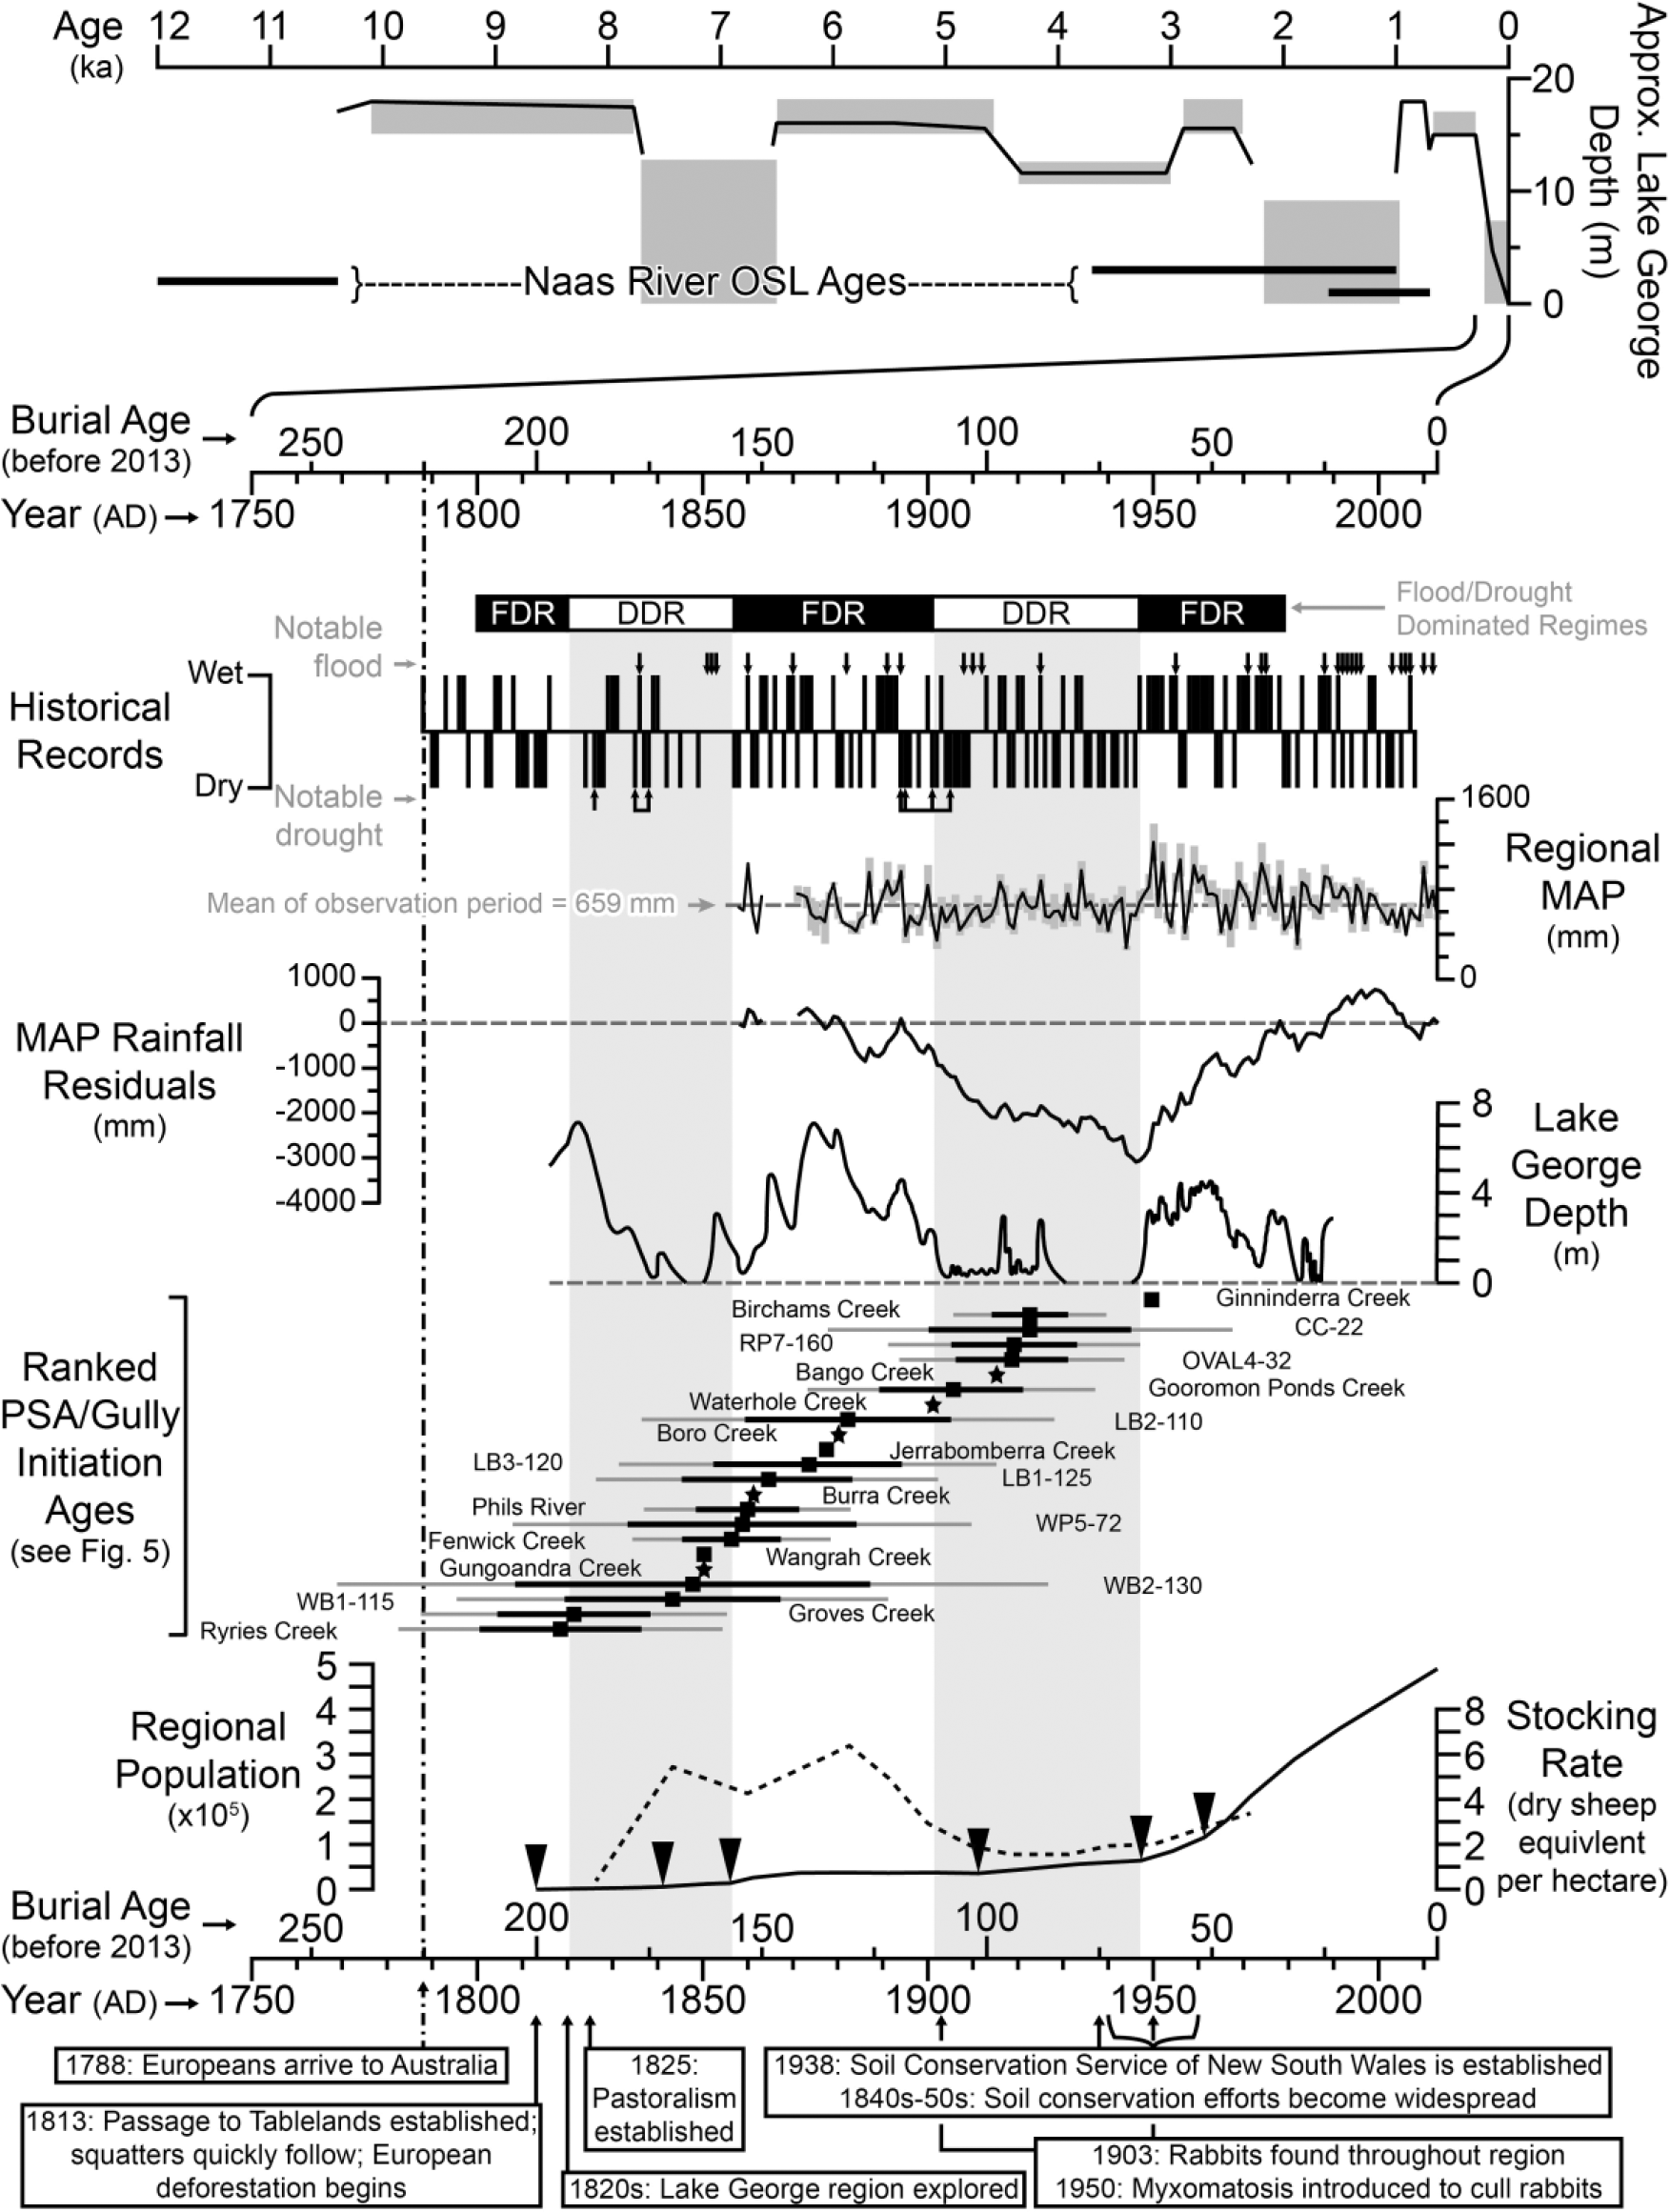
Climatic and land-use datasets from southeastern Australia, including important historical events and PSA burial ages. From top panel down: Holocene water levels for Lake George (Fitzsimmons and Barrows, 2010) and OSL burial ages for alluvium in the Naas River catchment in the Australian Capital Territory (Eriksson et al., 2006). Flood- and drought-dominated climate regimes (FDR and DDR, respectively) (Erskine and Warner, 1988, 1998). Wet and dry years as noted in historical records (Fenby and Gergis, 2012; Gergis and Ashcroft, 2013). Dates of notable floods and droughts compiled from multiple sources (http://ACTfirst.org.au; Eyles, 1977b, 1977c; Fenby and Gergis, 2012; Scott, 2001; Wasson et al., 1987). Regional mean annual precipitation (MAP) in the Goulburn Plains. Black line is the average (± standard deviation, grey bars) of rainfall data from the Bungendore Post Office (070105), Collector (Brookdale) (070021), Goulburn (070072), Hall (Lochleigh) (070045), Jeir (070049), Mount Fairy (Merigan) (070102), and Queanbeyan Bowling Club (070072) weather stations. Data accessed from the Australian Bureau of Meteorology (http://www.bom.gov.au/climate/data). MAP residual rainfall is the difference of rainfall of a given year from the average annual rainfall for the whole observation period; the curve is plotted by summing the residual rainfall of a given year and all preceding years such that the value for each year is the total excess or deficit of rainfall from the start of observations to that year. Historical Lake George water level record (after Jacobson et al., 1991). PSA burial ages determined by single-grain OSL dating techniques are shown as black squares with black and grey horizontal lines reflecting 1σ and 2σ age uncertainties, respectively (Rustomji and Pietsch, 2007; this study); black squares with no uncertainties and black stars are the best-approximation of PSA deposition ages and gully initiation ages, respectively, from their original sources. Regional human population of the Goulburn Plains (e.g. Argyle, King and Murray counties; solid black line) and livestock stocking rate (provided in units of dry sheep equivalents per hectare, where 40 sheep equal 1 cow; Wasson et al., 1998). Population data from the AD 1833–1991 Australian Census reports, accessed online at http://abs.gov.au/AUSSTATS and http://hccda.anu.edu.au/documents/ on 22 September 2015. Black triangles point to positive inflections on the population growth chart. Historical dates of significance come from Scott (2001).
One might therefore expect PSA deposition to be naturally contemporaneous with arid conditions in the Tablelands, perhaps with the multi-decadal drought-dominated regimes (DDRs) described by Erskine and Warner (1988, 1998). Although the actuality of DDRs, and flood-dominated regimes (FDRs), has been questioned (Kirkup et al., 1998), the association of severe DDRs with the near-total evaporation of Lake George cannot be overlooked (Figure 6). Indeed, gully erosion and PSA deposition at some sites in the Tablelands seem to occur after storms that cause notable floods during arid DDR periods (Figure 6). However, our observation that initiation of many gullies and associated deposition of PSA also occurred during the wet FDRs leads us to suggest that since European arrival, non-climatic factors have played a larger role in shaping the Goulburn Plains landscape.
Regardless of climatic conditions, we observe that all gully incision and PSA deposition occurs between AD 1800 and 1950, a period that starts with European exploration of the Tablelands and ends with the enactment of soil conservation practices by the newly established Soil Conservation Service of NSW and attempts to eradicate rabbits from the region. Moreover, we also observe a possible connection between European population growth in the three counties of the Goulburn Plains in that gully incision or PSA deposition ages seem to be clustered shortly after positive inflections in the population growth curve (Figure 6). The exception is population growth after the establishment of the Soil Conservation Service of NSW and the introduction of myxomatosis to cull the rabbit population in AD ~1950. Population increased sharply after this time, but no new episodes of gully incision or PSA deposition contemporaneous with that population increase have been noted. This is not to say that PSA does not continue to aggrade in catchments already affected by gullies (Portenga and Bishop, 2016), but that most gully incision and PSA deposition occurred between AD ~1820 and 1950.
From these observations, we conclude that although climate has played a role in shaping the Tablelands landscape throughout the Holocene, the Goulburn Plains were probably rendered prone to erosion by a combination of drought- and human-induced landscape changes since European arrival in the early AD 1800s, both likely leading to vegetation degradation.
Human settlement patterns reflected in PSA ages
If more ages are determined for PSA deposits in the Goulburn Plains, an even more detailed land-use change chronology than that provided in this study is likely to be revealed, perhaps even mirroring European settlement patterns into the region. Research into the Bathurst Plains and Monaro Plains, north and south of the Goulburn Plains, respectively, should create chronological ‘bookends’ to the overall southeastern Australian Tablelands land-use change timeline. The Bathurst Plains were explored before the Goulburn Plains, and because quantitative ages of PSA or gully incision of the Bathurst Plains are yet to be determined, we can only presume that landscape change similar to that in the Goulburn and Monaro Plains also occurred here. The Monaro Plains were first accessible via the Goulburn Plains and thus evidence of land-use change is expected to occur after the oldest ages from the Goulburn Plains. Indeed, OSL ages from two PSA deposits in the Numeralla River catchment in the northern Monaro Plains indicate that sediment was deposited between AD 1843–1883 and AD 1878–1908 (Olley et al., 2004), both of which are younger than those at Ryries Creek to the north.
Following the notion that PSA deposition may mirror the patterns of European settlement into the Tablelands, patterns of human settlement or changing land-uses in other landscapes around the world might be identified by dating the basal layer of PSA and PSA-type sediments. Treating PSA-type sediments to be geomorphological artefacts of prehistoric human land-use may complement archaeological investigations that are otherwise reliant on finding artefacts in the context of datable sites. Moreover, because PSA is deposited downstream of a catchment affected by anthropogenic landscape change, inferences of human land-use can be made over a much larger geographical area than may be possible from individual archaeological study site investigations.
Conclusion
PSA deposition and gully erosion in the Goulburn Plains of the southeastern Australian Tablelands are post-European in age and likely result from a change in land-use practices, deforestation and livestock grazing following European arrival to the region. We are unable to find a straightforward link between the PSA depositional chronology and climate change despite an inferred expectation that PSA deposition might be associated with drought conditions and associated landscape stress. Indeed, the fact that PSA is deposited at many sites during flood-dominated periods leads us to suggest that climate is no longer the dominant force shaping the Tablelands landscape. We suggest that vegetation cover, already stressed by drought upon European arrival, was decimated by changed land-management practices and the overgrazing of livestock throughout the region and thus rendered prone to widespread erosion during periods of climatic change and individual storms. The fact that all gully initiation and PSA deposition ages fall between the dates of European arrival to the Tablelands and the establishment of the Soil Conservation Service of NSW supports our conclusion that European land-use practices have superseded climate as the dominant factor shaping the Tablelands, at least since European arrival ~200 years ago.
Footnotes
Acknowledgements
We thank Olivia Leal-Walker, Adam Wethered, Therese Canty, Meredith Orr, Zacc Larkin, Stacy Oon and Lani Barnes for field and laboratory assistance, and Andreas Lang, Derek Fabel, two reviewers and Dr Joe Mason for thoughtful comments and constructive feedback.
Funding
Funding for this project came from a Macquarie University Research Excellence Scholarship and University of Glasgow ‘International PhD Research Studentship’.
Supplementary materials
Details of stream catchments that were sampled for this study and detailed sediment profile descriptions can be found in the online Supplementary Material along with field photographs of sample sites, optically stimulated luminescence (OSL) dosimetry measurement details, sample processing and measurement details, and dose measurement and quartz grain acceptance/rejection criteria tables.