



Abstract
In an effort to reconstruct past aeolian activity, a foredune stratigraphy and a continuous lake sediment record from the largest dunefield on Andøya, northern Norway, have been investigated. The dunefield extends landwards in a north-eastward direction and consists of several parabolic dunes, foredunes and blowouts. The sediment record (169 cm) from the nearby lake Latjønna and the foredune stratigraphy (10 m) covers the last 6200 and 3700 cal. yr BP, respectively. Both sites possess sediments deposited after the Tapes transgression maximum (~6800 cal. yr BP), which reached a level of ~7–8 m a.s.l. at the study site. The lake sediment record consists of several units dominated by sand grains interspersed by more organic-rich beds. The core has been examined by x-ray fluorescence (XRF), magnetic susceptibility (MS) and loss-on-ignition (LOI). Mineral grains were detected by wet sieving of the ignition residue (IR), and the influx of sand grains to Latjønna was calculated based on the weight of sand grains >250 µm/cm divided by the accumulation rate determined from a radiocarbon (14C)-based age–depth model. Phases with high influx of sand to Latjønna are recorded around 4800, 4250, 3000–2000, 1850–1750, 1600–600, 450, 300 and 150 cal. yr BP, which coincides with periods of increased storminess recorded in other studies around the North-Eastern Atlantic region. The two study sites show, however, quite contrasting results; high sedimentation rates in the lake record associated with greater aeolian influx correspond to stability in the foredune stratigraphy reflected by the presence of several palaeosols. Because of this out-of-phase behaviour, it is suggested that the foredune is mainly influenced by summer climate and relative sea level (RSL) change, whereas the lake record is more influenced by niveo-aeolian processes transporting sand grains farther inland during winter.
Introduction
The coastal parts of northern Norway are frequently hit by strong cyclones following the North Atlantic storm track pattern, bringing high-energy winds landward. Areas with an abundant supply of sand are highly susceptible for deflation during such events, which has led to establishment of small coastal dune systems. The age and formation of these dune systems are unknown; however, recent studies from other areas around the North-Eastern Atlantic region reveal a diverse history of aeolian activity (storminess) throughout the Holocene (e.g. Björck and Clemmensen, 2004; Clarke et al., 2002; Clarke and Rendell, 2006; Clemmensen et al., 1996, 2006; Costas et al., 2012; Dawson et al., 2004; De Jong et al., 2006; Orme et al., 2015, 2016; Selsing and Mejdahl, 1994; Sjögren, 2009; Van Vliet-Lanoë et al., 2014; Wilson and Braley, 1997; Wilson et al., 2004).
Coastal dunes are dynamical and complex landforms affected by terrestrial, oceanic and atmospheric systems (e.g. Pye, 1983). Studies of coastal dunefields demonstrate the occurrence of episodic phases of sand movement punctuated by periods of soil stabilization (e.g. Clarke et al., 2002; Clarke and Rendell, 2006, 2009; Clemmensen et al., 2006, 2009; Wilson et al., 2004). Instrumental data indicate that dunefield alteration in Denmark is related to cool and windy summers and that the past century has experienced a marked decrease in summer storminess which is partly responsible for the stabilization of sand dunes (Clemmensen et al., 2014). In northernmost Norway, however, Sjögren (2009) relates increasing aeolian activity to an intensification and/or northward displacement of the main winter storm track, associated with moist westerlies and a positive North Atlantic Oscillation (NAO) index. In southern Sweden, the onset of periods with increasing aeolian activity has been related to humidity shifts associated with short-term intensifications in the regional atmospheric circulation pattern (De Jong et al., 2007, 2009; Mellström et al., 2015). In a longer perspective, coastal dune development has been associated with relative sea level (RSL) fluctuations, where dune building (aeolian activity) is often related to a regressive or a gradually transgressive phase of RSL history, as well as changes in storminess (e.g. Clarke and Rendell, 2009; Wilson et al., 2004).
The reconstruction of a continuous record based on dune stratigraphy is limited by several factors such as sub-aerial erosion and lack of datable material. Because of this, other studies have investigated continuous sediment records from bogs and lakes adjacent to coastal dune systems (Björck and Clemmensen, 2004; De Jong et al., 2006, 2007; DeVries-Zimmerman et al., 2014; Fisher et al., 2012; Fisher and Loope, 2005; Hanes et al., 2014; Timmons et al., 2007). However, bogs and lakes also produce sediments in addition to recording other processes occurring within their catchments (e.g. DeVries-Zimmerman et al., 2014). In order to separate the different sedimentary regimes, as well as to assess the relationship between sediments and climate, an in-depth analysis of the sedimentary records is needed.
Björck and Clemmensen (2004) calculated the annual influx of sand grains >200 µm, called aeolian sand influx (ASI), in cores from raised bogs close to the coastal plains of south-western Sweden. The ASI is suggested to record wintertime storminess as the sand grains were transported into the bog when the vegetation was covered by snow (niveo-aeolian activity). This process has also been recorded elsewhere in high altitude and latitude climates where sand is susceptible for reworking; transporting coarse grained sediments across large distances over solid (frozen) and smooth surfaces (e.g. DeVries-Zimmerman et al., 2014; Fisher et al., 2012; Fisher and Loope, 2005; Hanes et al., 2014; Koster, 1988; Lamoureux and Gilbert, 2004). By comparing lacustrine sediment records and dune stratigraphy in the Lake Michigan coastal zone, Timmons et al. (2007) found that lacustrine sediments provide a more varied record of aeolian activity compared with the OSL- and 14C-dated dunes. Furthermore, they suggested that lacustrine sediments are more sensitive to alterations and thus better in capturing periods of small-scale storm events giving a more complete record of past aeolian activity.
The main objective of this paper is to study and date the aeolian activity at the largest dunefield at the outmost western coast of Andøya, northern Norway, as part of the subarctic North-Eastern Atlantic region. To explore the complexity of aeolian activity, the influx of sand has been recorded in both a lacustrine sediment environment and by stratigraphical investigations in a foredune. The results from this study are further discussed in relation to other proxies from the region to obtain knowledge about past aeolian activity, storminess and the evolution of coastal dunefields on Andøya.
Regional setting
Study area
The study area is located on the south-western shore of Andøya, which is the northernmost island of the Lofoten-Vesterålen archipelago in northern Norway (69°00′01″N, 15°27′55″E; Figure 1). Most of the study area is within the ‘Sørmela naturreservat’ (Sørmela nature reserve), which became protected in AD 2002 and has a total area of 1.32 km2. A 1.6-km-long and up to 600-m-broad coastal dunefield called Sandhaugan (‘the sand hills’) extends towards the north-east within the nature reserve (Figure 1). The Sandhaugan dunefield borders a large peat bog area (Bømyra) to the north and east and is directly exposed to high-energy waves from the Norwegian Sea and to North-Eastern Atlantic storm tracks. The adjacent beach is well developed and composed of medium sand. The tidal range at Andenes, at the northernmost part of the island, is ~3 m (Tidevannstabeller, 2014). The highest registered storm surge in the area was observed in Tromsø during the great storm of ‘Berit’ in AD 2011, with a maximum elevation of 3.83 m a.s.l. (Tidevannstabeller, 2014). The vegetation cover at Sandhaugan is characterized by a well-developed zonation from foreshore to bog, which is the main reason for the protection of the area (Elven et al., 1988). The dunefield has to some extent been affected by anthropogenic influence visible by old wheel tracks around the southern and middle part of the reserve. Historical sources reveal that the nearest farm, situated south of Sandhaugan, has been affected by drifting sands, which in periods reduced their area of arable land (Borgos and Dybwik, 2003). In addition, sand grains deposited on snow have been observed inland from the western shore of Andøya during several field campaigns, suggesting that the area is affected by niveo-aeolian transportation during wintertime.

(a) Geomorphological map of the Sandhaugan dunefield on Andøya with study sites. Cross sections (a) and (b) are in Figure 2. Aerial photography from (b) AD 1956 and (c) AD 2013 clearly indicates an increase in vegetation cover during the last 60 years. The black and white circles in (b) and (c) are the study locations shown in (a).
Latjønna is a small (600 m2) and shallow (1 m deep) elongated lake situated east of the most active blowouts and south of the most inland parabolic dunes on the border between the dunefield and the surrounding bog (69°00′00″N, 15°28′26″E, 14.5 m a.s.l.; Figures 1 and 2). A small stream, now redirected due to road construction, previously entered the eastern side of the lake. The lake outlet was earlier at the southern side but is at present redirected because of agricultural activity. Along the former streambeds (gullies) south of Latjønna, several thin (1–3 cm) dark-brown to black organic horizons are observed in the upper 1.5 m of the stratigraphy. These buried horizons can be traced all around the southern part of Sandhaugan.

Shoreline displacement
Several prominent beach ridges, shorelines and abrasion terraces were formed during the deglaciation and the Holocene, and they are the basis for the reconstructed Late Weichselian and Holocene shoreline displacement diagrams in the area (Fjalstad, 1997; Marthinussen, 1962; Møller, 1986, 1987, 2003; Møller and Sollid, 1972). Several parallel beach ridges are clearly visible 600 m east of Sandhaugan at an altitude between 20 and 25 m (Figure 1) and are assigned to the north Andøya shore zone dated to ~14,000 14C yr BP (e.g. Fjalstad, 1997). The RSL was probably well below current sea level from an interval stretching from the Younger Dryas period (12,900–11,700 cal. yr BP) until ~8000 cal. yr BP (e.g. Møller, 1986, 2003; Møller and Holmeslet, 2002; Vorren and Moe, 1986).
The Tapes transgression on Andøya has been somewhat disputed. The current understanding, however, is that the Tapes high stand/maximum sea level throughout the Holocene at Andøya reached an altitude of 9 m a.s.l. near Ramså (Figure 1), ~30 km north-east of Sandhaugan at 6000 14C yr (~6800 cal. yr BP; Møller, 1986; Vorren and Moe, 1986). Following the Tapes transgression, RSL fell until ~5900 cal. yr BP, before a period of RSL rise reached 6 m a.s.l. at 4500 14C yr (5100 cal. yr BP; Møller, 1986). Following this, there was a drop in RSL interrupted by two possible short phases of RSL rise (e.g. Marthinussen, 1962) and an accelerated sea level fall after ~3000 cal. yr BP (see Figure 10g for sea level curve from Ramså). Despite the rather well-documented RSL history on Andøya and elsewhere in northern Norway, there are still large gaps regarding age and altitude between RSL reconstructions (Barnett et al., 2015; Romundset et al., 2011). This clearly shows that the Holocene RSL history on Andøya should be regarded with some care.
Modern climatological data
Andøya has a maritime climate, with mean July and January temperatures of 11°C and −2.2°C (AD 1961–1990), respectively. The annual precipitation is 1060 mm, 65% of which falls during wintertime (October–April) resulting in over 100 days with snow cover throughout the year (DNMI, 2015). The meteorological data used in this study originate from two meteorological stations located 45 km north-east of the study area near the town of Andenes: station 87100 at the old lighthouse (AD 1866–1972) and station 87110 near the airport (AD 1962–present). Instrumental data on wind climate extends back to AD 1866; however, daily observations of both wind speed and direction started in AD 1891 (Figure 3 and Table 1). The meteorological data from the period AD 1905–1930 are unreliable (Figure 3c and d). This is most likely related to qualitative measurements as the lighthouse keeper based the wind measurements on visual observations (until AD 1924) and that there were problems with the newly installed anemometer in AD 1924 and 1927 (Stein Kristiansen, 2015, personal communication). Because of this, only data from AD 1930–2014 have been used in the analysis.
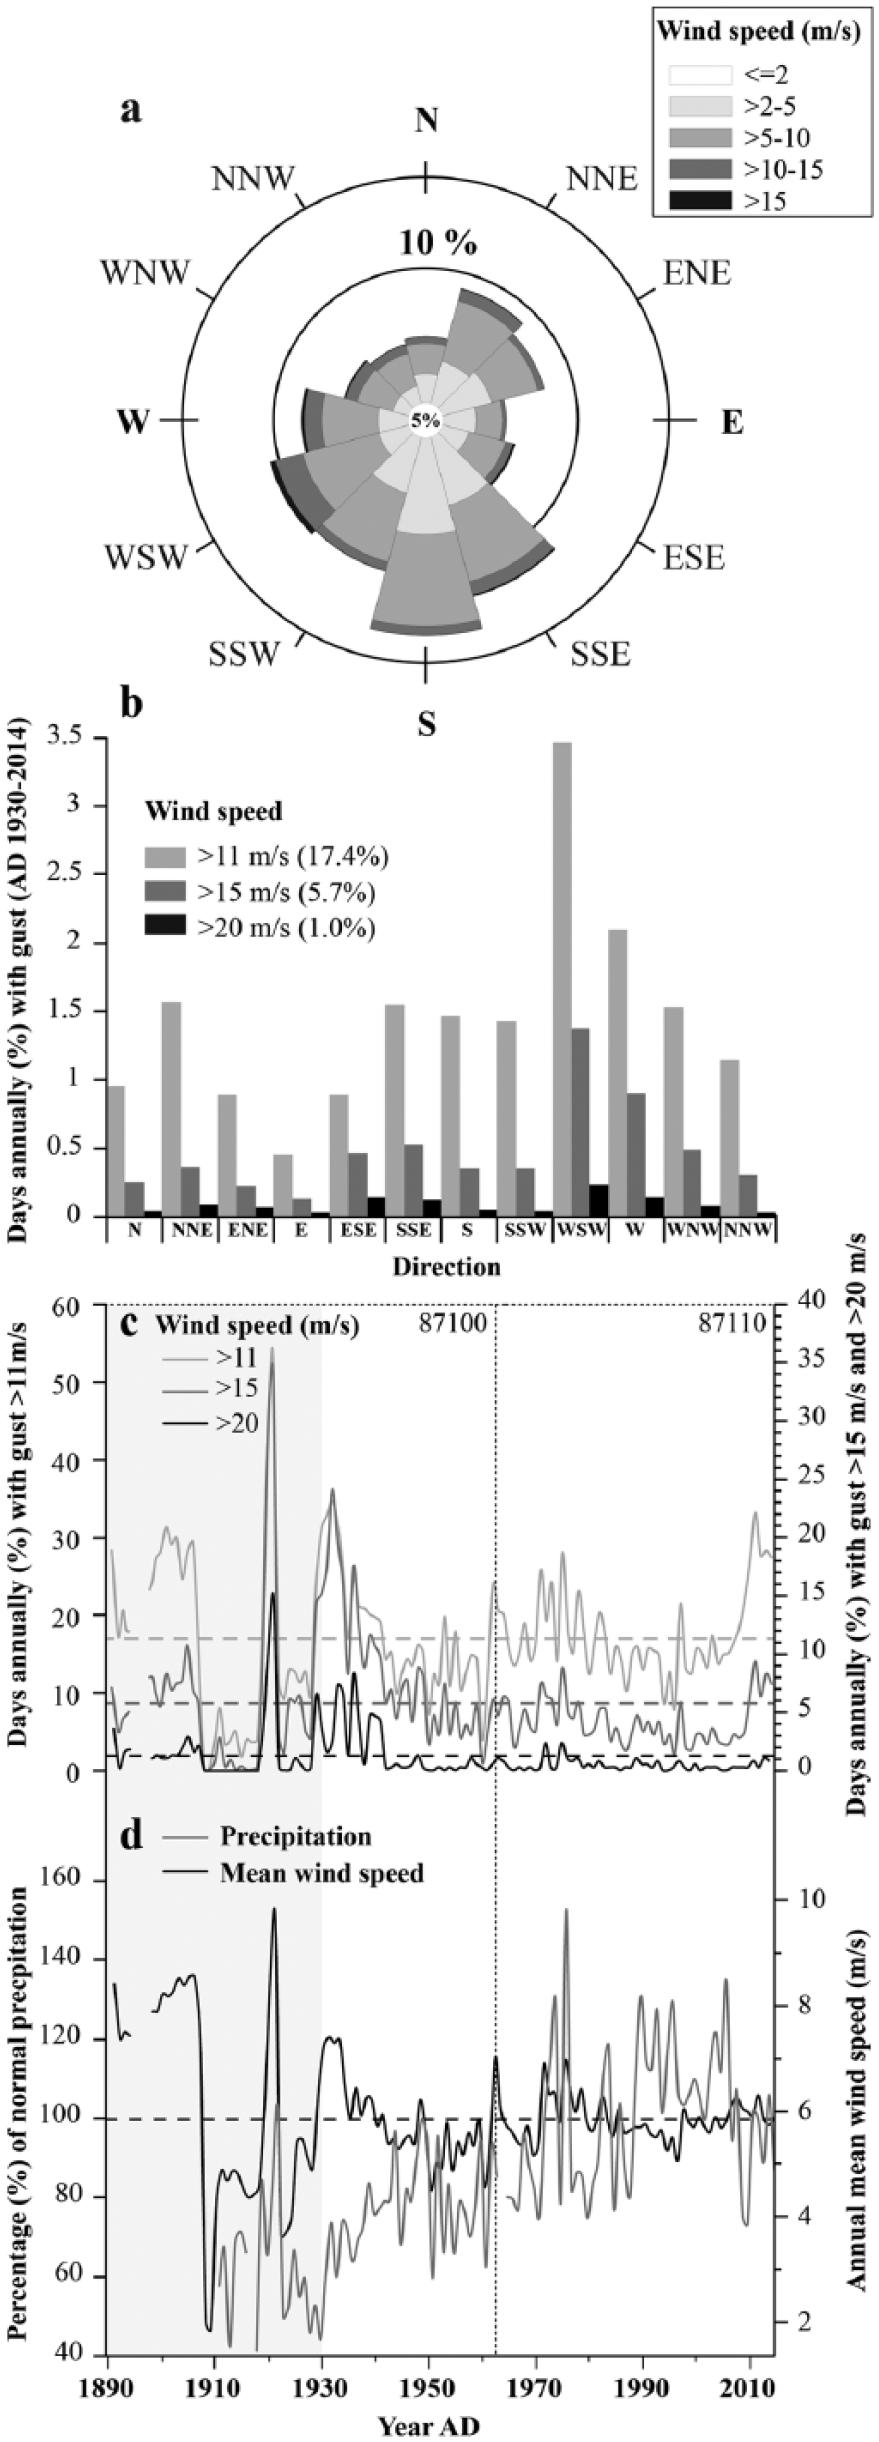
Compilation of meteorological data from Andenes. Data from two meteorological stations have been used in the analysis; station 87100 (AD 1866–1972) was located at the lighthouse, whereas the present station (87110, AD 1962–) is located at the airport. (a) Wind rose showing the frequency of wind speed and direction during the period AD 1930–2014. (b) Percentage of days annually with wind gust exceeding 11, 15 and 20 m/s and the corresponding wind direction from AD 1930 to 2014. The most common wind direction during ‘stormy’ periods is WSW. (c) Days (%) annually with wind gust exceeding 11, 15 and 20 m/s (AD 1891–2014). (d) Mean annual wind speed (m/s) and annual precipitation shown as per cent of normal value (normal period: AD 1961–1990). The grey shaded area in (c) and (d) was removed from further analysis because of qualitative data (see text).
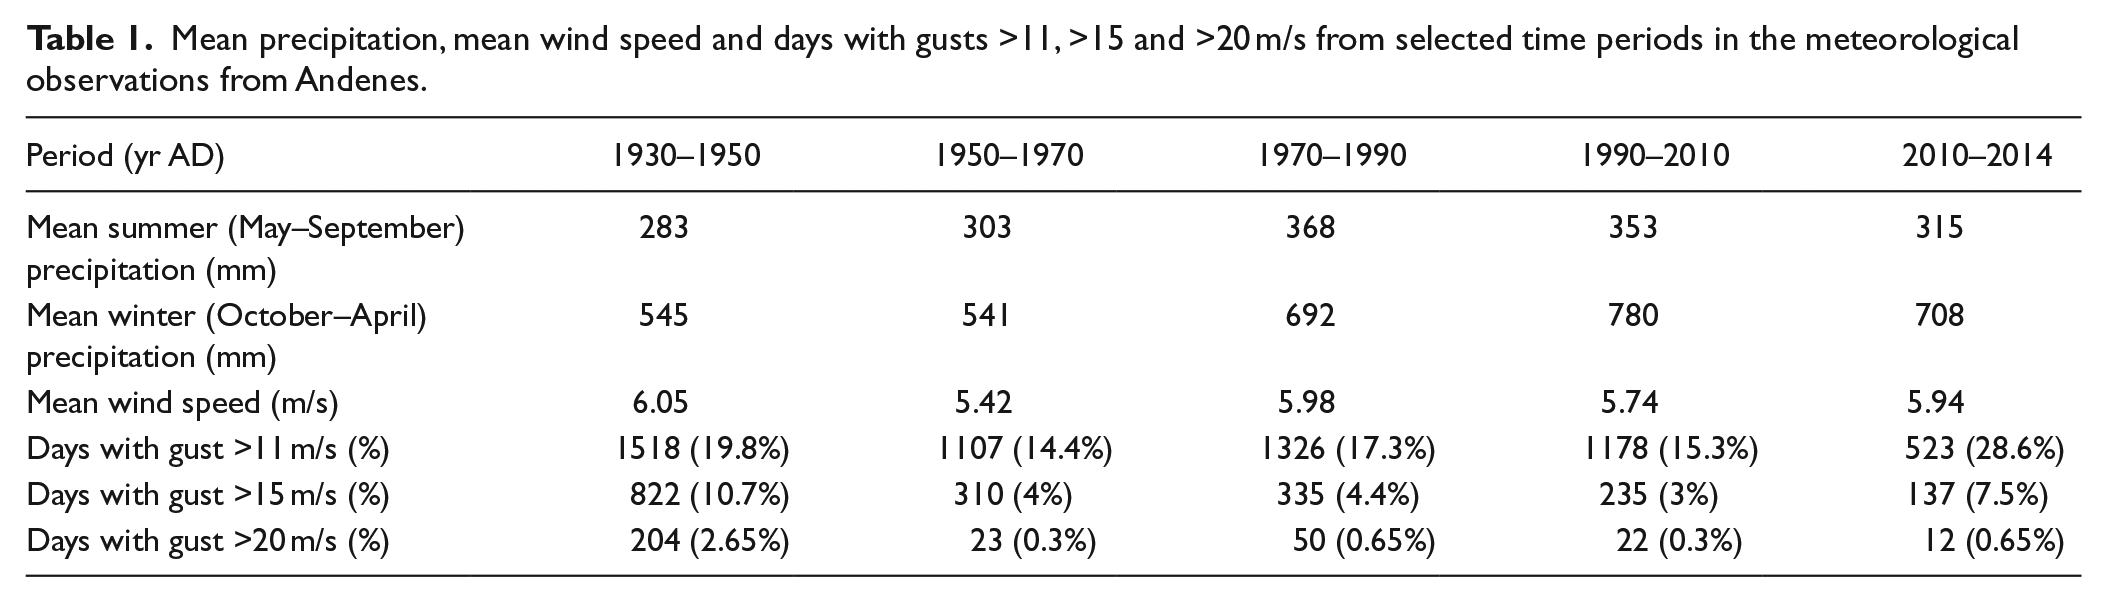
Mean precipitation, mean wind speed and days with gusts >11, >15 and >20 m/s from selected time periods in the meteorological observations from Andenes.
The annual mean wind speed at Andenes for the period AD 1930–2014 is 5.8 m/s (6.5 m/s for wintertime and 4.8 m/s for summertime). Winds from the S (14%), SSE (12%), WSW (10%) and SSW (10%) are most frequent throughout the measured period (Figure 3a). A seasonal difference in wind direction and strength is obvious. During wintertime, the most common wind direction is between the sectors SSE and WSW, with a total frequency of 58%. Contrary to wintertime wind direction, the summer season (May–September) is more affected by winds from N to ENE (35%) compared with SSE and WSW, which only accounts for 31%. However, the most intensive winds during all seasons come from a WSW direction.
Clemmensen et al. (2009) suggested wind events of strength 11 m/s or higher (Beaufort scale 6) to be a proxy for storminess in Denmark. At Andenes, days with maximum wind speed >11 m/s occurred with a frequency between 4% and 34%, with some periods (AD 1930–1942, 1962–1983 and 2010–2014) having higher than normal (>17.4%) wind activity. Similar patterns are also identified in the frequency of days with maximum wind speed >15 and >20 m/s.
Methods
Several approaches are used in order to investigate former aeolian activity at Sandhaugan. Aerial photography (series: WF-780 from AD 1956 and series: 14093 from AD 2013) and field observations were combined to produce a detailed geomorphological map and a longitudinal cross section of Sandhaugan with emphasis on sand dunes, marine deposits, former beach ridges and blowouts (Figures 1 and 2). In order to evaluate former aeolian activity beyond historical data at Sandhaugan, two independent sediment records are studied: (1) stratigraphical investigations of a 10-m-high shore-parallel dune (foredune) that records near beach activity and (2) a continuous lake sediment core from the distal lake Latjønna.
Latjønna (69°00′01″N, 15°28′28″E) was cored using a modified piston corer (Nesje, 1992) with 110-mm-diameter core tubes during winter AD 2013. The core LATP-113 (169 cm long) was retrieved from the central part of the lake at 1 m water depth. The upper 3 cm of core was not examined because it was disturbed during core recovery. The core was split lengthwise and stored in cold room (4°C) prior to analysis.
The core was analysed by use of several high-resolution sediment parameters. Magnetic susceptibility (MS) was measured with a Bartington MS2E MS sensor every 0.5 cm (n = 338). Geochemical analysis was performed using an Itrax x-ray fluorescence (XRF) core scanner at the Department of Earth Sciences, University of Bergen (Croudace et al., 2006). The scan was performed using chrome (Cr) x-ray tube every 0.1 cm, with voltage and current setting of 30 kV and 55 mA and exposure time of 10 s (n = 1699). Four geochemical elements and ratios were selected to investigate lake sediment variations: silicon (Si), titanium (Ti) and the ratios between iron (Fe) and titanium and manganese (Mn) and titanium. Si and Ti are known as good indicators of minerogenic content (e.g. Balascio et al., 2011; Haug et al., 2001; Kylander et al., 2011). Si, however, can also be sensitive to the concentration of biogenic silica and, therefore, needs support from other proxies to identify its source (Peinerud, 2000). Both Mn and Fe are redox-sensitive elements and are in this study used as proxy for redox-related processes when normalized against Ti (e.g. Croudace et al., 2006; Kylander et al., 2013).
Weight loss-on-ignition (LOI) was measured every 1 cm by extracting volume specified samples (1 cm3). The samples were first weighed for wet bulk density (g/cm3), dried overnight at 105°C, before being weighed for dry bulk density (g/cm3) and water content (%). The samples were then ignited at 550°C for 1 h and cooled in a desiccator before the weight LOI and ignition residue (IR) were determined (Dean, 1974). Grain-size distribution was determined by wet sieving the IR (n = 169). The samples were sieved through 250 and 125 µm screens, dividing the grain size fractions into three classes: >250 µm (⩾medium sand), 250–125 µm (fine sand) and <125 µm (⩽very fine sand). Since the LOI procedure measures both water content (WC) and organic content (LOI), the total concentration of sample material could be determined throughout the core.
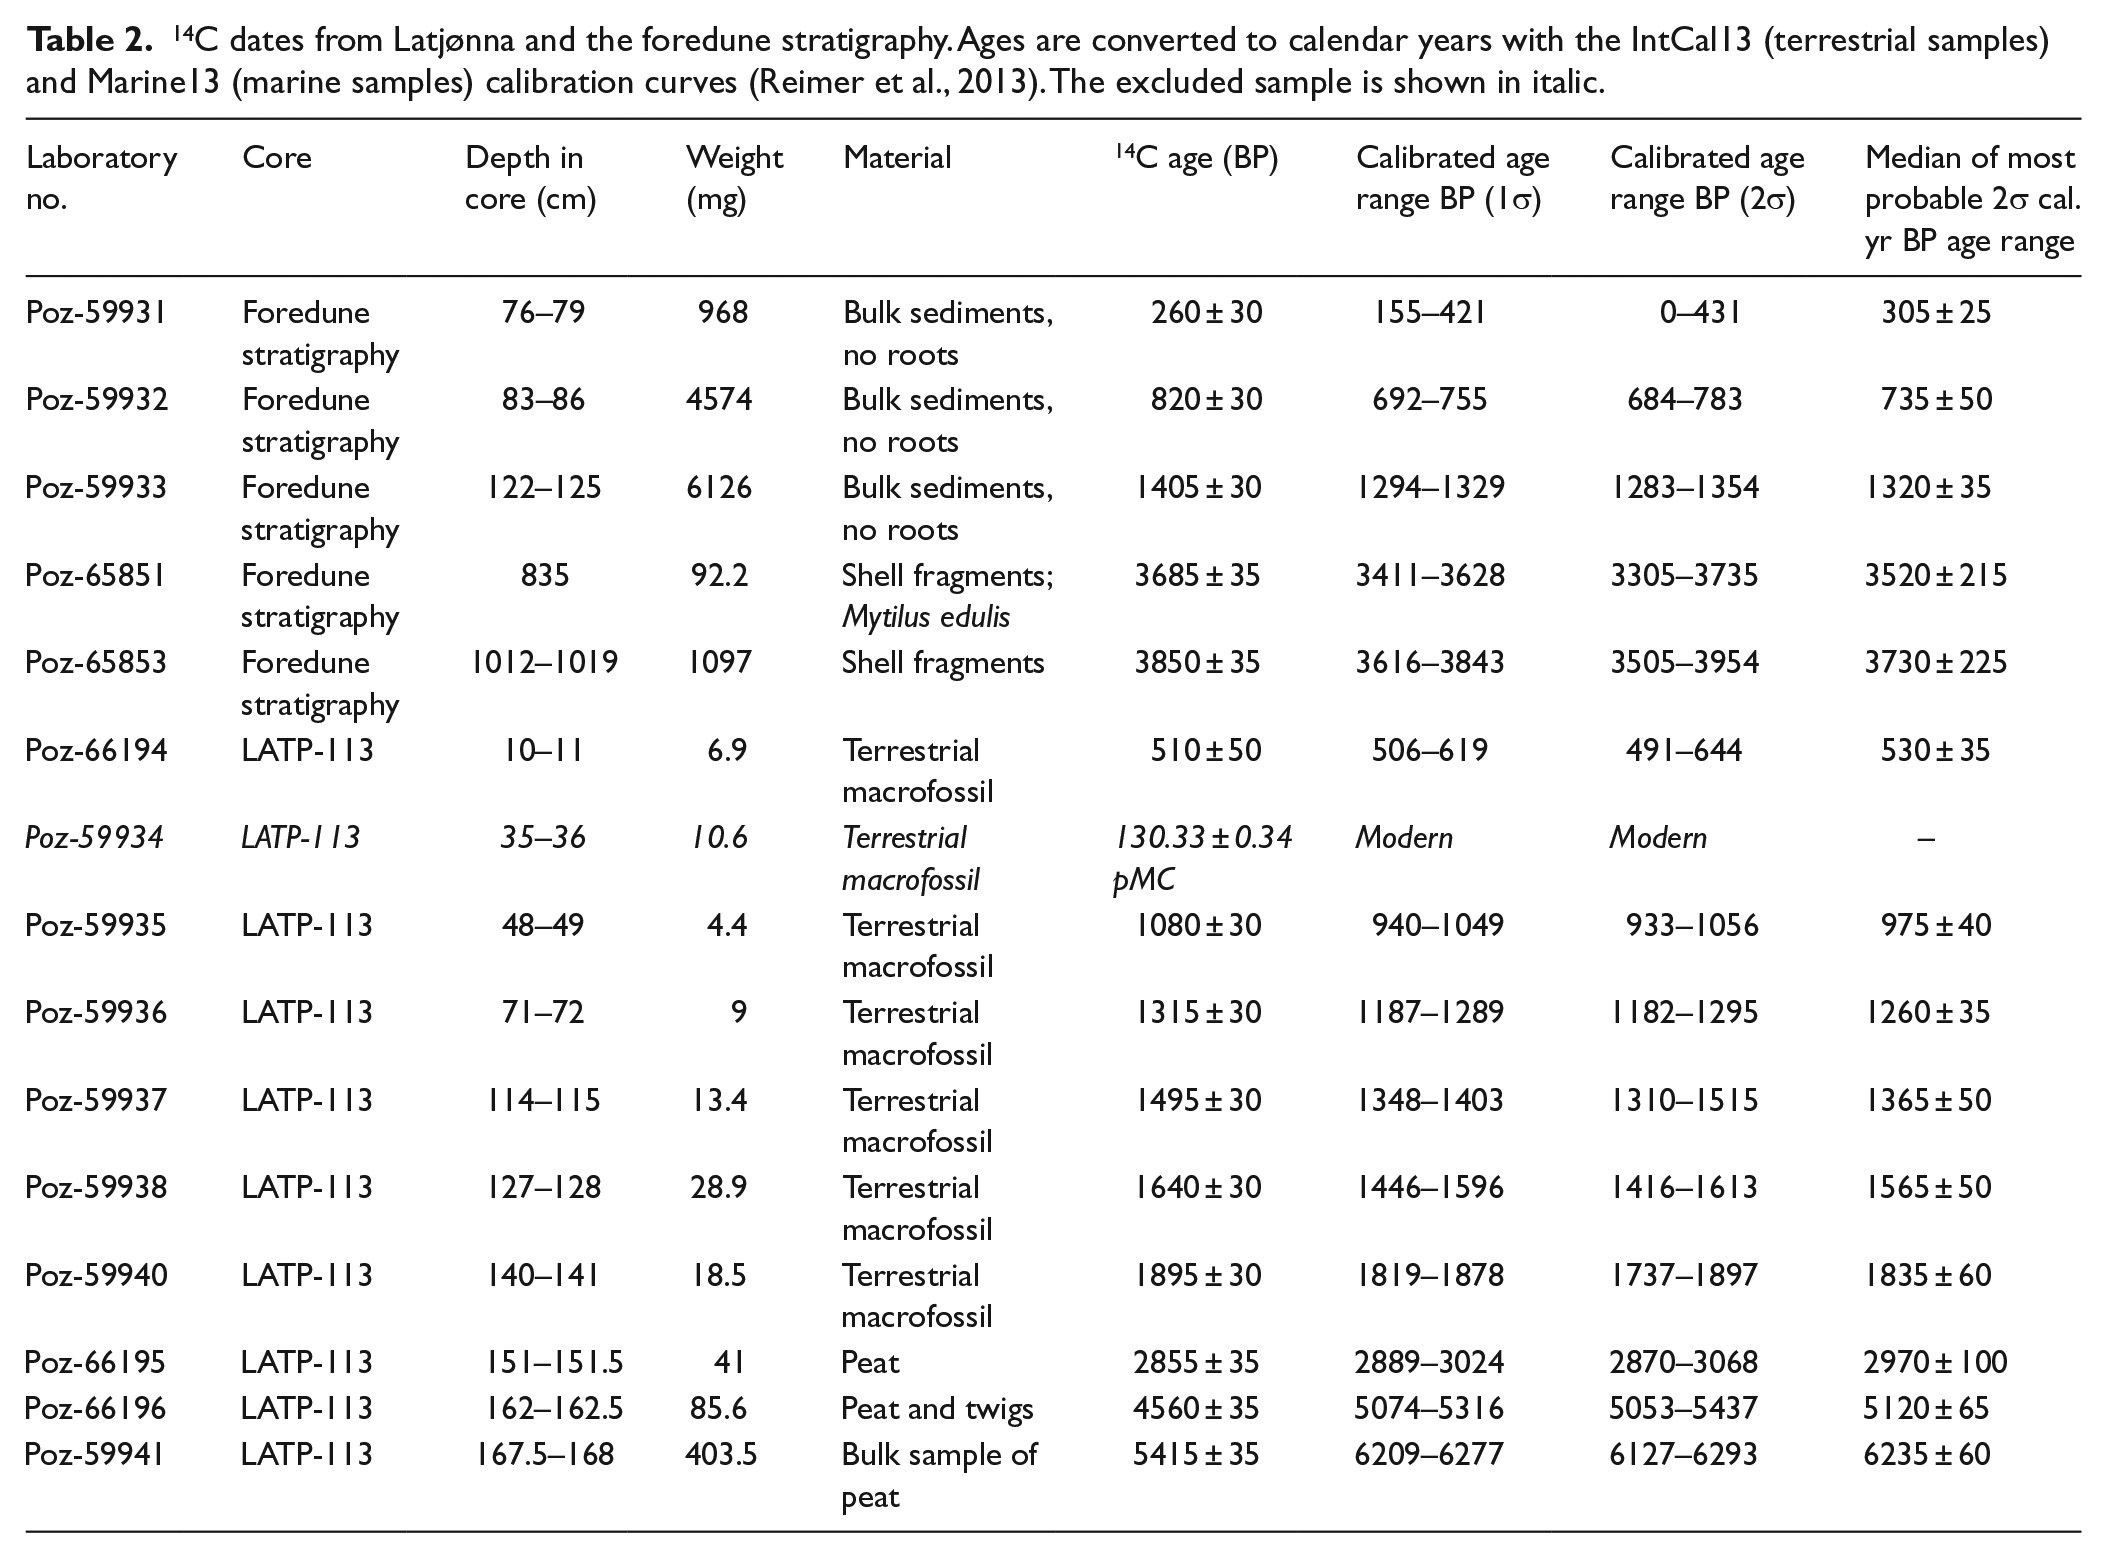
In total, 15 samples of organic material (10 from LATP-113 and 5 from the dune stratigraphy) were dated by use of AMS 14C dating (Table 2). Slices of sediments (1 cm thick) from the piston core were sieved through 125 µm using distilled water. Terrestrial plant remains were isolated and picked under the microscope. The organic material from the dune stratigraphy was carefully cleaned prior to analysis to avoid contamination from modern roots. The samples were then dried overnight (50°C) before being submitted to Poznan Radiocarbon Laboratory. The 14C ages were converted to calendar years before present (cal. yr BP) and subjected to the age–depth modelling routine clam 2.2 (Blaauw, 2010) using the open-source software R. Two calibration curves were employed: IntCal13 for terrestrial samples and Marine13 for marine samples (shells from the dune stratigraphy; Reimer et al., 2013). ΔR was set to 61 ± 16 years based on weighted mean values from molluscs in northern Norway (Mangerud et al., 2006). Only calibrated ages are presented in the text and figures.
14C dates from Latjønna and the foredune stratigraphy. Ages are converted to calendar years with the IntCal13 (terrestrial samples) and Marine13 (marine samples) calibration curves (Reimer et al., 2013). The excluded sample is shown in italic.
Results
Geomorphological mapping
The studied dunefield includes three V-shaped parabolic dunes with trailing arms pointing towards the south-west, shore-parallel foredunes (transverse dunes) and several blowouts (Figure 1). The highest point is located on the eastern ridge of the most inland parabolic dune, with an altitude of 21 m (Figure 2). Most of the study area is today vegetated and stable (Figure 1c); however, aerial photography from AD 1956 (Figure 1b) depicts a more active dunefield with several areas covered by exposed sand, including areas around the investigated lake.
A well-defined ridge composed of gravel with rounded pebbles at ~7–8 m a.s.l. was observed on a large deflation surface along the southern part of the dunefield (Figures 1 and 2). The ridge reappears parallel to the present shoreline at the same altitude both north and south of Sandhaugan (Figure 1).
Foredune stratigraphy and age
To study past variations in near-shore aeolian activity, a natural exposure 120 m from the present beachface has been investigated (68°59′45″N, 15°27′30″E, 5–15 m a.s.l.). The internal structure and composition of the 10-m-high foredune are presented in Figure 4a. The natural exposure is the side of a deflation hollow that was earlier undercut by a small stream (Figure 4b). The dune stratigraphy has been divided into five units based on changes in dip direction of the cross beddings (D1–D5). In general, the dune is composed of gently dipping (<16°) cross-beds with well-sorted medium to coarse sand, dipping towards the NW (unit D1 and D3), SE (unit D2 and D5) and SW (unit D4).
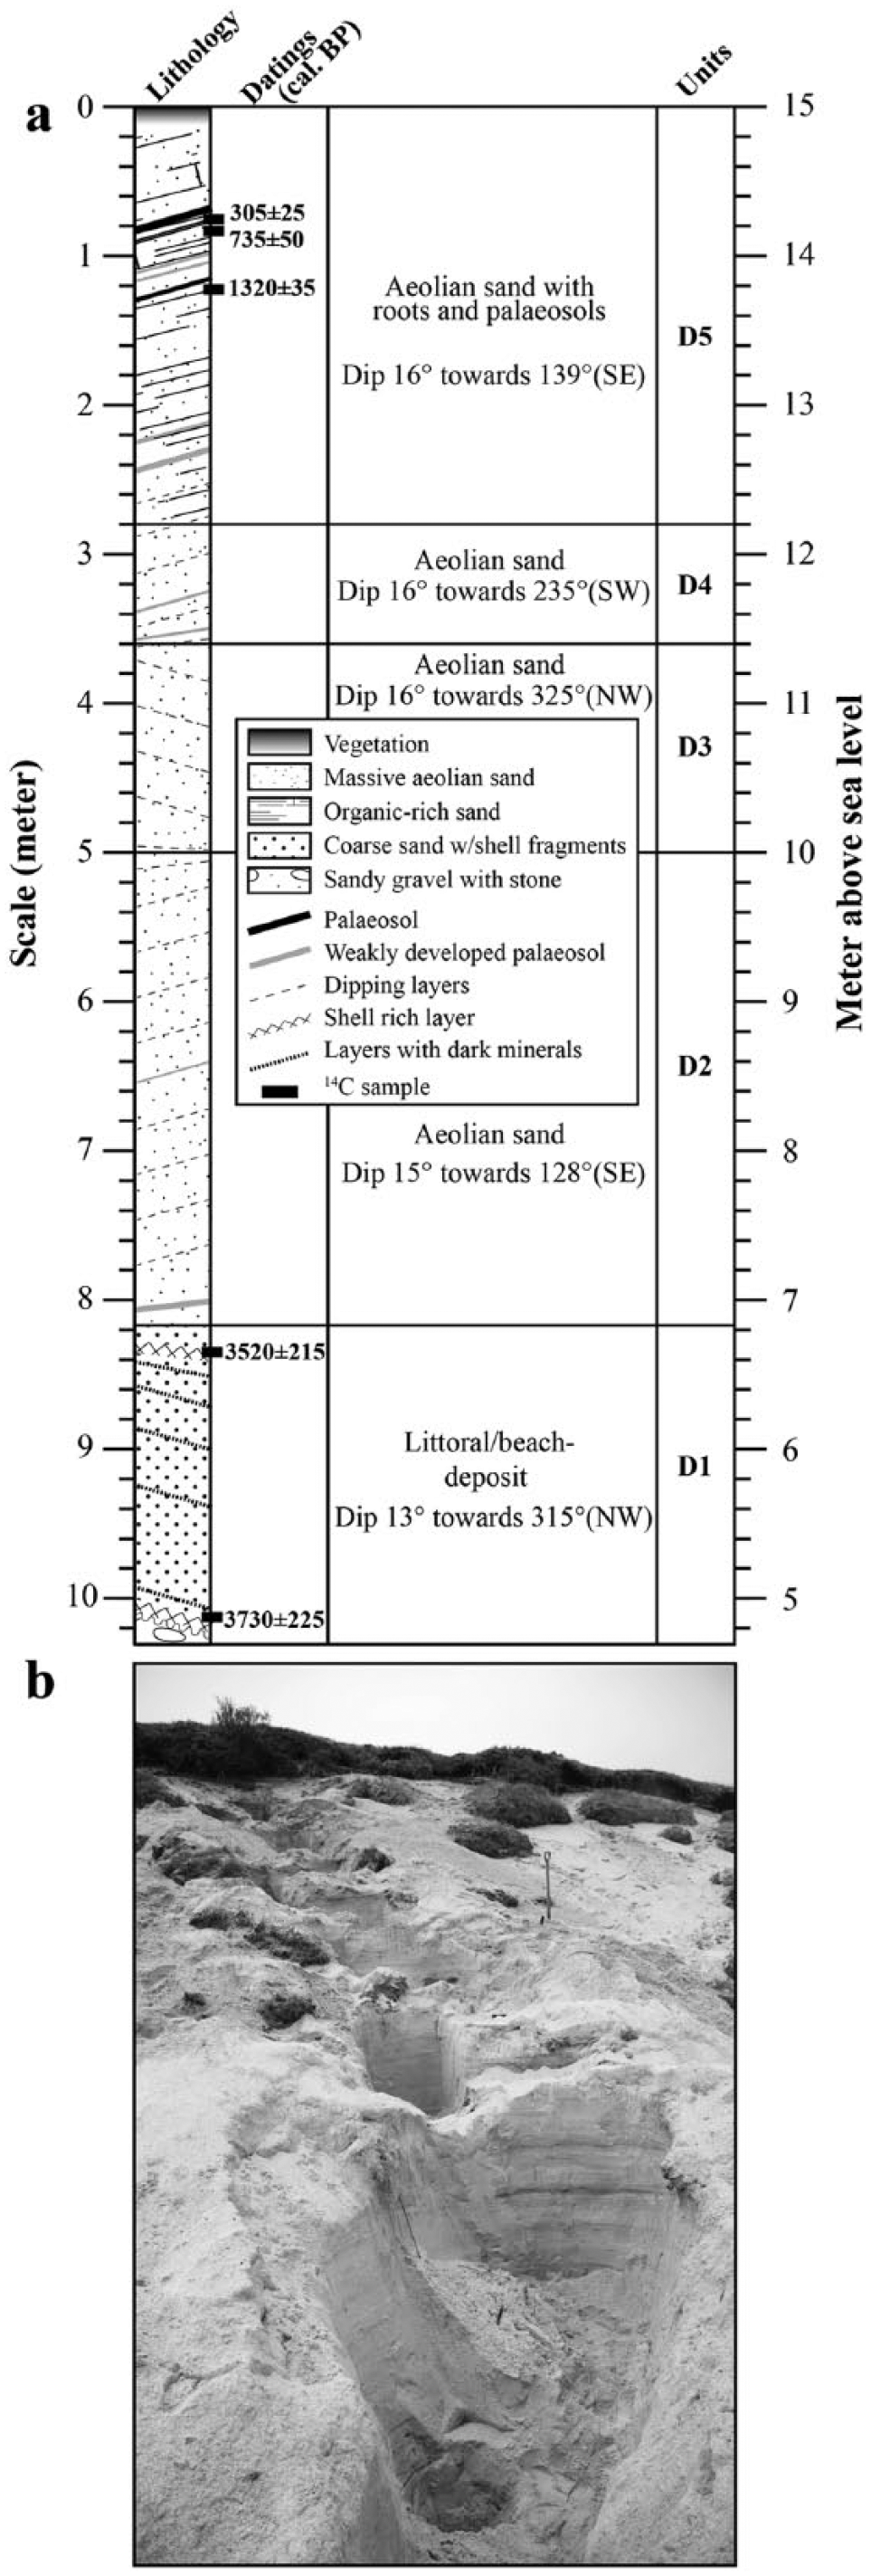
(a) Lithostratigraphy and 14C dates from the studied foredune. The section has been separated into five units with different directions of dip (D1–D5). (b) Hand-dug exposures showing foredune stratigraphy corresponding with dashed line in Figure 2. Shovel is 1 m tall.
Unit D1 (1019–818 cm) consists of laminated coarse sand containing shell fragments. Beneath unit D1 is rounded pebble gravel similar to the composition of the nearby ridge situated 60 m further inland (Figure 1). The unit has several thin black ripple cross-laminations, some of which contain dark heavy minerals. Shell-rich beds are observed between 1012–1019 and 831–839 cm. These beds have been dated to 3730 ± 225 and 3520 ± 215 cal. yr BP, respectively (Table 2).
Units D2 (818–500 cm), D3 (500–360 cm) and D4 (360–280 cm) consist of grey coloured laminated well-sorted medium sand. Some thin brown organic-rich laminas are found throughout the units. Due to insufficient amount of organic material, the units are not dated.
Unit D5 (280–0 cm) consists of light-brown to greyish laminated medium sand with a gradual change to dark-brown colour as a result of increasing organic content and inclusions of organic material towards the top of the unit. Three dark-brown to black horizontal beds of <4 cm in thickness containing decomposed organic material, and separated by laminated sand, are present in the uppermost 125 cm of the stratigraphy. All three beds have been dated, giving ages of 1320 ± 35 (122–125 cm), 735 ± 50 (83–86 cm) and 305 ± 25 cal. yr BP (76–79 cm), respectively. The uppermost 76 cm consists of laminated sand capped by vegetation.
The age–depth relationship of the foredune is based on five samples and was constructed using a linear model (Figure 5). The dates are, however, somewhat unevenly distributed because of the absence of datable organic material in the sand between 815 and 125 cm (units D2 to D4). The foredune built rapidly with high sedimentation rates from 3500 to 1300 cal. yr BP (0.31 cm/yr), followed by a period with relatively low sedimentation rates between 1300 and 300 cal. yr BP in unit D5 (0.049 cm/yr).

(a) Age–depth relationship in core LATP-113 and (b) dune stratigraphy. Black line shows best age–depth estimates using smooth spline for the sediment core and linear model for the dune stratigraphy (dotted line). The dark-grey shading areas following the black lines are 95% confidence intervals. Note that the high sedimentation rate in the lake (1600–600 cal. yr BP) overlaps with the lowest sedimentation rate on the foredune (1300–300 cal. yr BP).
Lake sediment core and age
The 169-cm-long sediment core from Latjønna consists of several sand sections dominated by quartz grains separated by organic-rich sediments. The core has been divided into eight sedimentary units (from L1 to L8) based on visual inspection and the measured sediment parameters. The units are described below (see also Figures 6 –8).
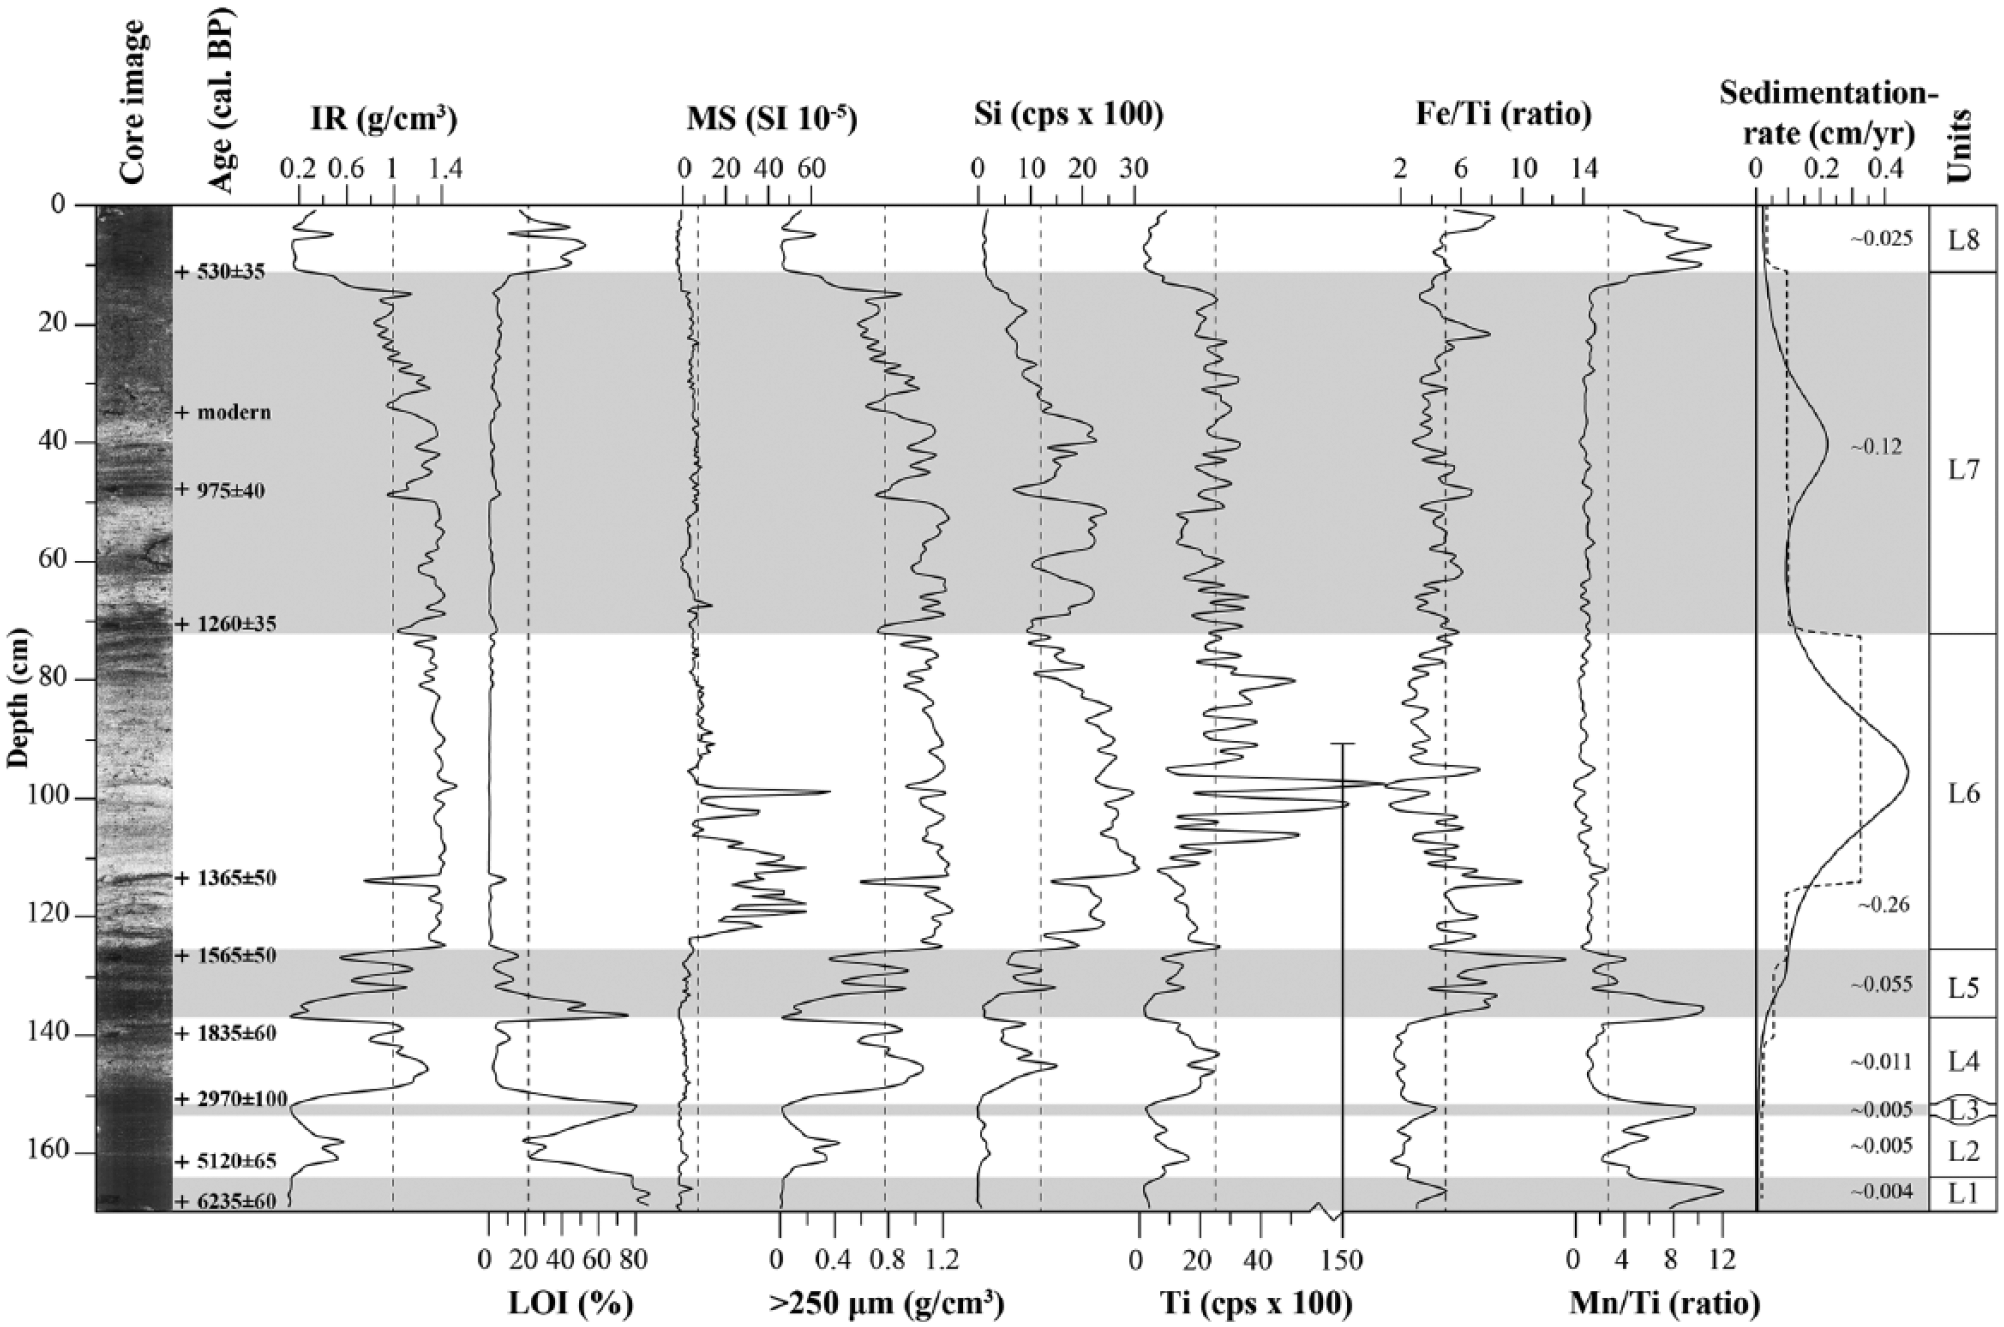
Selected sediment parameters from LATP-113. From left to right: photograph of the core, samples for 14C dating (cal. yr BP), ignition residue (IR), loss-on-ignition (LOI), magnetic susceptibility (MS), mineral grains >250 µm (g/cm3), geochemical elements and ratios between elements from Itrax XRF, sedimentation rate based on spline and linear model (cm/yr) and units (L1–L8). The vertical dashed lines indicate mean core values for each parameter.
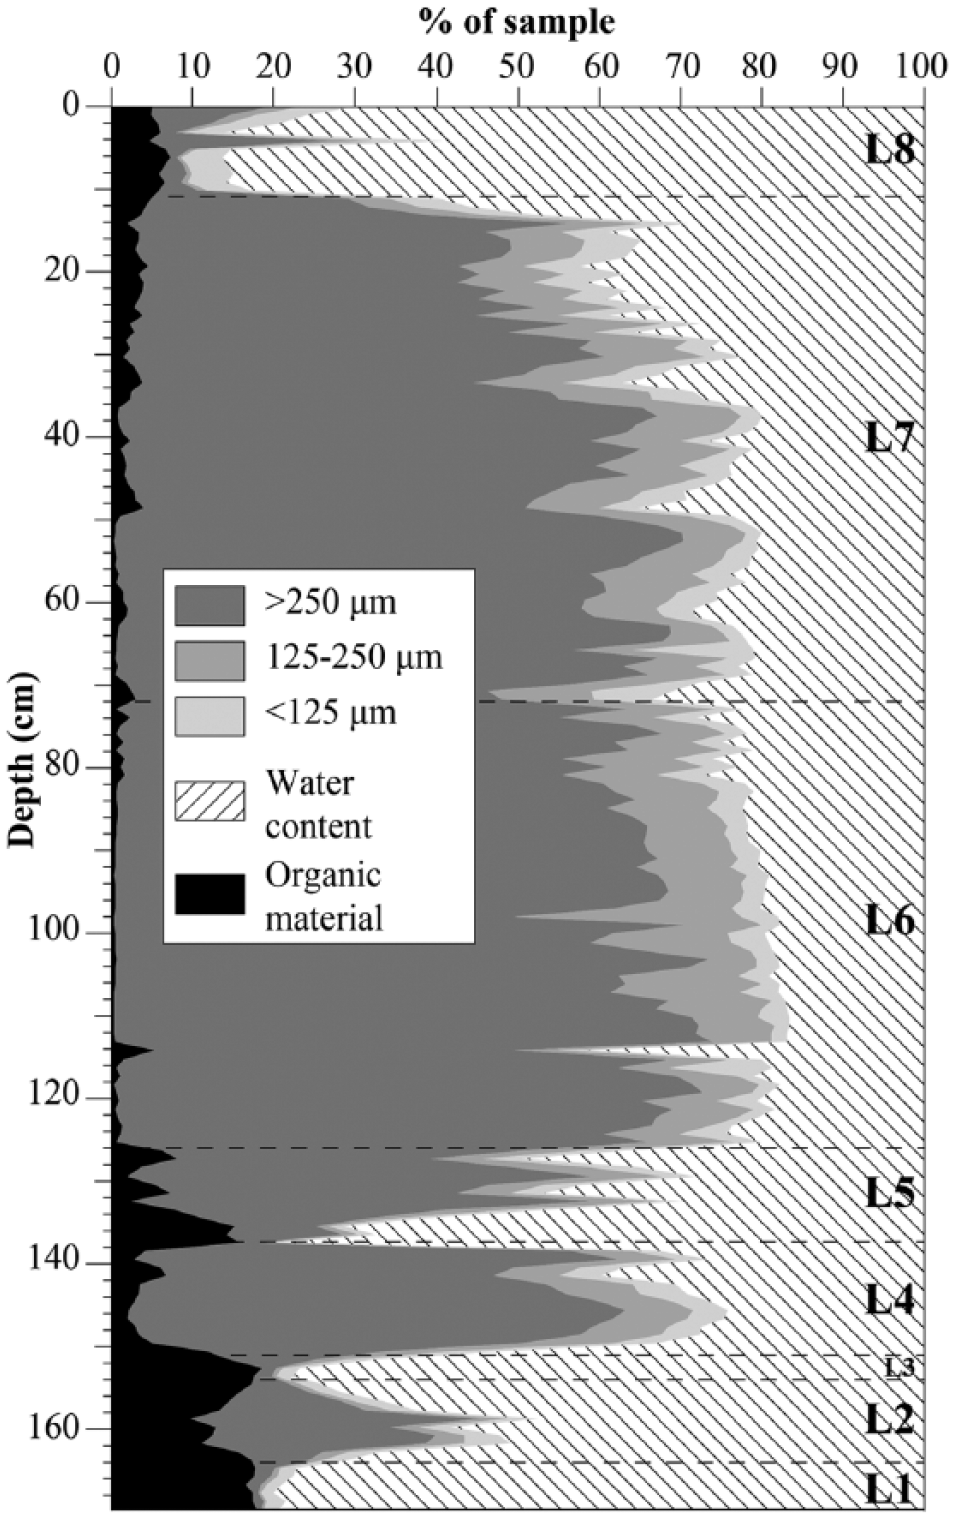
Down-core variations (LATP-113) in sediment composition (%). Bulk samples (1 cm3) were first measured for water content before being ignited at 550°C for LOI measurement (organic content). The residue after LOI was then sieved through 250 and 125 µm screens before being weighed.

Variations in the influx of sand grains >250 µm (g/cm2/yr) along a logarithmic scale and the content of IR (%) throughout LATP-113. The grey vertical columns mark the phases of high influx of sand (1–8). Note the extremely high influx of sand in units L5, L6 and L7 (dark-grey columns).
Unit L1 (169–164 cm) consists of compact dark-brown organic material with LOI around 80%. The geochemical ratios Mn/Ti and Fe/Ti show relatively high values, while Si, Ti, MS and IR show low values throughout the unit. The unit contains <5% minerogenic sediments, of which 50% is of grain sizes <125 µm.
Unit L2 (164–154 cm) has a dark-brown colour with sand grains clearly visible among the organic material. The unit differs from unit L1 by a gradual increase in the physical parameters; IR increases from 0.05 to 0.50 g/cm3, and the content of sand grains >250 µm increases from 7% to 35% of total sample towards 158 cm. After this, IR, Ti and minerogenic sediments show decreasing values towards unit L3, while Fe/Ti, Mn/Ti and LOI (from 20% to 80%) are increasing.
Unit L3 (154–151 cm) is a distinct thin bed dominated by very dark-brown compact organic material, which is indicated by low IR (0.05 g/cm3), low signal in MS, low content of minerogenic sediments (5%) and high LOI (80%), Mn/Ti and a small peak in Fe/Ti.
Unit L4 (151–137 cm) has a brown colour and is characterized by increasing minerogenic content, which is shown by a gradual increase in both physical (IR < 1.2 g/cm3) and geochemical parameters (Si and Ti). Because of this, the unit is somewhat light-coloured compared with overlying and underlying units. The unit has two peaks in IR, sand grains >250 µm and Si centred at 146 and 139 cm, respectively, which is linked to two beds consisting of laminated sand. LOI varies between 2.5% and 10%, while Mn/Ti and Fe/Ti are low.
Unit L5 (137–126 cm) consists of a diffuse transition from underlying unit to dark-brown organic-rich sediments with two thin sandy light-brown beds present towards the top of the unit. The thin sandy beds are characterized by a lower LOI (reduction from 75% to 3%), high values in IR (1.15 g/cm3), high amount of sand grains >250 µm (0.95 g/cm3) and peaks in the geochemical parameters Si and Ti. High Mn/Ti and Fe/Ti-ratios are consistent with organic-rich sections, and Fe/Ti reaches the highest value of the core at 127 cm.
Unit L6 (126–72 cm) shows a sharp transition from the underlying unit L5 to brownish-grey laminated sand with inclusions of organic material present throughout the unit. Several of the physical and geochemical parameters reach their highest values in this unit (IR, sand grains >250 µm, MS, Si and Ti). LOI is generally low throughout the unit, with a small peak at 114 cm. IR, sand grains >250 µm and Si have the same trends, with a gradual increase towards 112 cm, before the values slowly decrease towards the top of the unit. MS shows high values between 123.5 and 97 cm, and two distinct peaks centred around 102 and 98 cm (<50 SI 10−5) correspond with extremely high count rates in Ti (from 1500 to 19,000 cps). The unit turns darker in colour from 82 cm and towards unit L7, as also indicated by an increase in organic content (LOI < 4%).
Unit L7 (72–11 cm) is dominated by three brown beds consisting of laminated sand interspaced between darker and more organic-rich sediments. The sandy beds (<10 cm in thickness) are best recognized as peaks in Si and sand grains >250 µm centred at 65, 53 and 42 cm depth in the core. A gradual change towards more dark-brown sediments characterizes the upper part of the unit, with a gradual decrease in IR, sand grains >250 µm and Si, and an increasing value in LOI (from 1% to 7.5%). Ti, Fe/Ti and Mn/Ti are relatively stable throughout the unit.
Unit L8 (11–0 cm) consists of a gradual transition from underlying unit to dark-brown to black gyttja. Three small peaks in IR and sand grains >250 µm, combined with a lowering of LOI and Mn/Ti, are recognized at 9, 5 and 2 cm. The topmost sediments are dominated by non-degraded organic material (reeds).
The chronology of LATP-113 shows that one sample (Poz-59934) is anomalously young (modern) compared with the under- and overlying samples (Table 2). The 14C-dated material was most likely contaminated by the presence of modern roots reaching down into the uppermost sediments in the lake and has therefore been excluded from the age–depth relationship. The age–depth model of LATP-113 was constructed using smooth spline and implies relatively steady sedimentation rates between 6200 and 1600 cal. yr BP (mean of 0.007 cm/yr) and from 600 cal. yr BP to present (0.025 cm/yr). Interspaced between these two periods of steady sedimentation, the time span from 1600 to 600 cal. yr BP has extremely high sedimentation rates (peak value of 0.47 cm/yr; Figure 5).
Sand influx to Latjønna
To quantify the amount of sand entering Latjønna, the sand mass accumulation rate (SMAR) of Sjögren (2009), which is equivalent to the ASI method of Björck and Clemmensen (2004), has been adapted to this study. Since the core has a high content of medium to coarse sand grains (>250 µm), the sand influx was calculated by dividing the amount of sand grains >250 µm (g/cm3) by the sedimentation rate (Figure 6). Because of the extremely high sedimentation rate between 1600 and 600 cal. yr BP, a logarithmic scale has been used in order to present both high and low values (Figure 8).
Eight phases (1–8) with high influx of sand grains >250 µm and IR have been identified in the lake sediments (Figure 8). A gradual increase in the influx of sand grains >250 µm is observed from 5500 cal. yr BP, reaching two peaks at (1) 4800 and (2) 4250 cal. yr BP, after which the influx slowly decreases towards unit L3. Two phases with high influx of sand grains >250 µm are recognized at (3) 3000–2000 and (4) around 1850 cal. yr BP, followed by a substantial drop between 1750 and 1600 cal. yr BP. An increase in the influx of sand grains >250 µm is registered from unit L5 to the transition towards unit L8 (phase 5, 1600–600 cal. yr BP). Maximum influx of sand grains >250 µm reaches 0.57 g/cm2/yr at 1300 cal. yr BP, which is more than 50 times that of phase 4 (0.01 g/cm2/yr). In unit L8, three short phases with peaks in the influx of sand are present at around (6) 450, (7) 300 and (8) 150 cal. yr BP. Periods with a drop in or rather low influx of sand grains >250 µm are recorded around 6200–5500, 3800–3000, 1750–1600, 500, 400 and 250 cal. yr BP.
Discussion
Geomorphological and climatic setting
Sandhaugan exhibits several active and inactive landforms. When the present state of the dunefield is compared with old aerial photography, the general impression is that the area has become more stable during the last 60 years (Figure 1). The vegetation, especially the cover of birch forest, has experienced a considerable increase throughout this period. This has led to a stabilization of dunes, near-shore areas and former blowouts, reducing the amount of sand available for aeolian transport. The instrumental climate data from Andenes (Table 1 and Figure 3) show that the last ~30 years is characterized by (1) an increase in precipitation (both winter and summer seasons), (2) a minor decrease in mean wind speed and (3) a decrease in the frequency of gale days compared with the period prior to AD 1945.
Field studies of the influence of vegetation cover on aeolian sediment flux show that there is a negative exponential decrease in sediment transport with increasing vegetation cover (e.g. Lancaster and Baas, 1998). This is, however, not relevant during wintertime at these high latitudes, as the vegetation is usually covered by snow. Based on our observations of sand grains on snow on Andøya (niveo-aeolian transportation), as well as the reported winter wind regime, it is suggested that a significant amount of sand drift occurs during late autumn and throughout the winter. Hence, the observed reduction in sand mobility at Sandhaugan during the last 60 years is suggested to be related to factors such as a decreasing trend in storminess, increasing summer precipitation and/or shorter periods with snow cover, which has led to an overall stabilization of the dunefield during the past decades. We cannot, however, exclude the influence by grazing pressure and human disturbance, which potentially can alter the vegetation cover as indicated by a recent vulnerability analysis conducted at Sandhaugan (Hansen et al., 2013).
Interpretation of sediment records
The foredunes in the southern part of the study area are established dunes, with well-vegetated surfaces. This is in contrast to the northern part, which contains several blowouts and parabolic dunes (Figure 1). The well-defined ridge observed on the deflation surface near the foredune is interpreted as a beach ridge based on its distinct shape and the sediment composition. Based on the altitude of the ridge, and the location west of Ramså where the Tapes transgression reached a level of 9 m above contemporaneous sea level (e.g. Møller, 1986), the ridge is here suggested to represent the beach ridge deposited during the Tapes transgression. This implies that the dunes located below this level (~7–8 m a.s.l.) are assumed to be younger than the Tapes transgression high stand.
The foredune has a maximum age of 3730 cal. yr BP based on dating of shell fragments from the base of the stratigraphy (Figure 4). Unit D1 is interpreted to be beach sediments, which is supported by the presence of two beds containing shell fragments located 4.8 and 6.6 m a.s.l. in the stratigraphy. The shell dates provide two data points elucidating past sea level at Sandhaugan within a period of high sediment accumulation (beach development) and has been marked on the sea level curve in Figure 10g. Above unit D1, the sediments become better sorted and more fine grained. This transition is suggested to represent foredune initiation (incipient foredune) resulting from the interaction between coastal processes, vegetation cover and aeolian sand transport (e.g. Hesp, 2002), as well as the reported drop in RSL occurring after ~3000 cal. yr BP (e.g. Marthinussen, 1962; Møller, 1986). Units D2–D4 show incremental growth through time based on thick sections of aeolian sand. Thereafter, at the transition to unit D5 (based on the age–depth model; ~1800 cal. yr BP), the sediments become increasingly more organic, and three palaeosols separated by sand are found between 125 and 76 cm depth below the modern surface. The presence of palaeosols in sand dunes is usually related to periods of landscape stability as they represent a period with low sand accumulation and stable vegetation (e.g. Clemmensen et al., 2009; Wilson et al., 2004).
The sediment core from Latjønna encompasses the last 6200 years and was mainly deposited during a period of falling RSL. The sediment core consists of several units with laminated medium sand (units L2, L4, L5, L6 and L7) interspaced between more organic-rich sediment units (L1, L3 and L8). The alternating organic- and sand-rich sections are registered in the physical and geochemical data (Figure 6). Sand-rich sections (high IR) are reflected by high count rates in Ti and Si, and periods with organic production (high LOI) are reflected by high ratios in Mn/Ti and Fe/Ti. The sedimentation rate is generally low (0.004–0.055 cm/yr) throughout the lowermost units (L1–L5) and is followed by an increase in sedimentation rate as a response to higher minerogenic input throughout units L6–L7 (Figure 8). This is especially noticeable in the Ti count rates and MS values, which reach their highest values at the time of peak sedimentation rate at 1300 cal. yr BP of 0.47 cm/yr (Figure 6).
DeVries-Zimmerman et al. (2014) discuss several ways in which sand grains can be transported to lakes located leeward of sand dunes. Sand may originate from aeolian processes, stream flow, mass wasting, shoreline dynamics or niveo-aeolian processes. Latjønna is a relatively small lake with a (previously) slow flowing stream entering the eastern side of the lake. No bathymetric data exist from Latjønna; however, we assume the lake to be shallow because of the high vegetation cover (reeds) along the sides, reducing the possibility of influence by mass wasting and floods. Based on the geomorphological setting and the reported wind conditions from Andenes, we infer the presence of sand grains in Latjønna to represent periods of enhanced aeolian activity from the sector between S and NW. The aeolian sand grains were deposited either directly throughout the snow-free season or indirectly during winter onto the lake ice by niveo-aeolian processes.
The amount of aeolian sand present in a sediment record is related to several complex and local factors, the most important being the distance from sediment source, volume and availability of sediment supply, wind climate and surface cover (vegetation/snow; e.g. Björck and Clemmensen, 2004). In this study, the close proximity between the lake (trap) and the blowouts (sediment source) indicates that the rate of aeolian influx potentially can reach high values throughout periods of intensive sand mobilization during both summer and winter conditions. However, since coastal dune systems are dynamic (move inland), it is difficult to evaluate the intensity of aeolian activity based on the content of sand grains >250 µm in the lake sediments. This was also demonstrated by Sjögren (2009) in a coastal mire at Sørøya, northernmost Norway, where there was a large discrepancy in SMAR between two sites located only 200 m apart.
The sedimentation rates of the two study sites are contrasting (Figure 5). During periods of high sand accumulation to the foredune (units D2–D4), there is evidence of low sedimentation rate in the core (units L1–L5). This is opposite during the last ~1600 years when several palaeosols indicate stability on the foredune, while thick sections of sand in the core indicate high mineral sediment input. Based on this, it is obvious that local conditions show an out-of-phase behaviour of when the foredune is active and when the parabolic dunes/blowouts are active (lake sediments). It is here suggested that the foredune is mainly affected by the long-term changes in past RSL and summer climate, which influence the vegetation cover and thus sand mobility, whereas the lake is more affected by niveo-aeolian processes transporting sand grains farther inland during winter.
Aeolian activity and climate
Coastal dune stratigraphies and related sediment cores have been extensively investigated across western Europe (e.g. Clarke and Rendell, 2009; Clemmensen et al., 2009; Wilson et al., 2004). In these studies, periods with high sand influx have been associated with single storm events and/or intensification in storm climate, hence being a proxy of past storminess. However, the underlying causes for the variation in aeolian input are debated, and there are often several local factors influencing the aeolian activity. Wilson et al. (2004) concluded, based on a study of coastal dunes in Northern Ireland, that RSL is the first-order forcing factor of dunefield development in the area and that climate deterioration is superimposed on this. Hesp (2002) discussed several possible outcomes in dunefield response during RSL drops. Changes in the supply of sediments as a response to a wider foreshore are a critical factor. Increasing sand supply can result in the burial of vegetation and sediments bypassing the foredune, initiating increased sand mobility and thereby dune instability. This process can become more intensified during periods of increased storminess, which may initiate blowouts and develop transgressive sand dunes (parabolic dunes). Sorrel et al. (2012) combined data from several coastal sedimentary archives in an attempt to make a regional chronology of past storminess, reducing the influence of local variations (i.e. RSL change). These latter authors referred to these periods as Holocene Storm Periods (I–V) and propose them to be cyclic in nature with a periodicity of 1500 years. They are suggested to occur in harmony with rapid climate changes related to ocean and atmospheric reorganizations in the North Atlantic region, which is closely tied to cold events captured in the maximum concentration of ice-rafted debris from marine records (e.g. Bond et al., 2001). It is also suggested that there is a link between storminess (aeolian activity) and the variations in the NAO. This possible relationship is, however, not fully understood, and further work needs to be conducted (e.g. Burningham and French, 2013; Clarke and Rendell, 2006; Dawson et al., 2002; Hanes et al., 2014; Hurrell, 1995; Pinto et al., 2009; Trouet et al., 2012; Wang et al., 2009). A recent study on subarctic sand dunes in Finnish Lapland found that the occurrence of forest fires plays a key role in triggering episodes of aeolian erosion (Matthews and Seppälä, 2014). This latter study furthermore suggests that the occurrence of forest fires is indirectly related to climatic variations through complex geoecological interactions.
The continuous sediment record from Latjønna and the stratigraphy of the foredune indicate significant variations in aeolian activity during the studied period. Based on the discussion above, a conceptual model for the evolution of the Sandhaugan dunefield has been developed (Figure 9). The model is divided into four periods with distinctive characteristics, based on sea level change, foredune stratigraphy and the variations in aeolian influx to Latjønna. In the following sections, the results from this study are compared with other relevant climate proxies from the region (Figure 10).
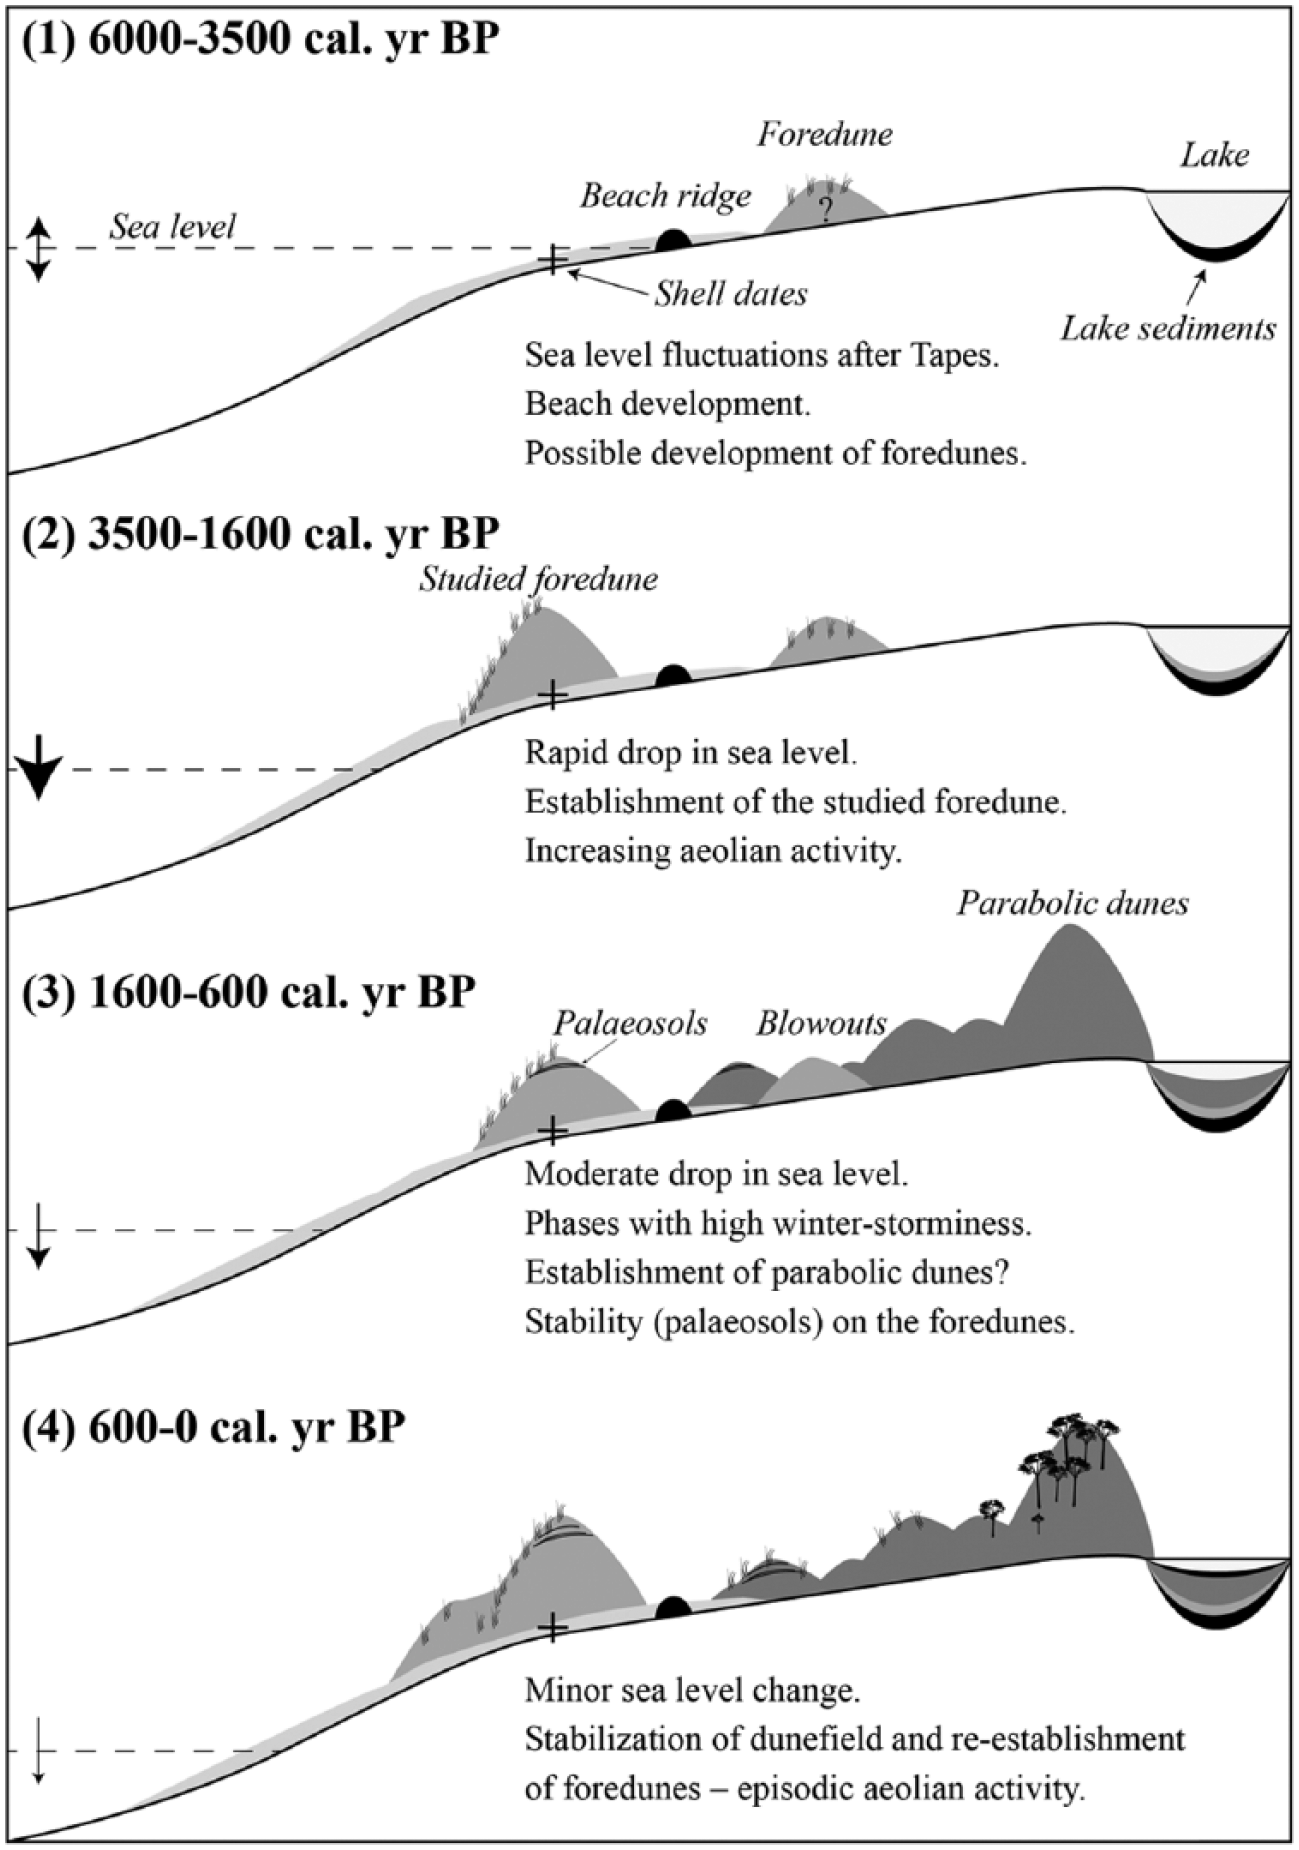
A conceptual model of dunefield evolution at Sandhaugan taking into account sea level changes, dune stratigraphy and lake sediments from Latjønna.

Comparison between the influx of sand grains >250 µm to LATP-113 (a), the studied fordune stratigraphy (h) and selected proxy records from the region. The eight phases with increased aeolian influx to Latjønna are marked with grey columns. (b) Sand mass accumulation rate (SMAR) from a coastal mire complex at Sørøya, northern Norway (Sjögren, 2009). (c) ASI variation of sand grains >200 µm from an ombrotrophic peat in Halland, south-west Sweden (De Jong et al., 2006). (d) Total amount of winter precipitation received along the Norwegian coast reconstructed from glacier proxies (% of normal; Bakke et al., 2008). (e) Reconstructions of the variation in NAO based on the combination between tree-ring and speleothem-based proxies of drought and precipitation (Trouet et al., 2009) and changing redox conditions of a lake sediment record (Olsen et al., 2012). (f) Diatom-based sea surface temperature (SST) reconstruction from the Vøring Plateau (Andersen et al., 2004; Birks and Koç, 2002). (g) RSL curve from Ramså with the two shell samples from the littoral sediments in the foredune stratigraphy marked (Marthinussen, 1962; Møller, 1986). (h) Periods with increased/onset of aeolian activity in Aquitane and Brittany, France (Clark et al., 2002, Van Vliet-Lanoë et al., 2014), Denmark (Clemmensen et al., 2009) and a combined record showing Holocene storm periods (HSP) in the North Atlantic region (Sorrel et al., 2012).
Aeolian activity on Andøya from 6000 to 3000 cal. yr BP
The lowermost unit in LATP-113 consists of compact organic material, which has been dated to 6235 ± 60 cal. yr BP. The distance between the lake and the exposed beach was ~200 m during this period, which is approximately half the distance between the lake and the current beach. A gently increasing aeolian influx is recognized from 5500 cal. yr BP, reaching two distinct peaks at around 4850 and 4250 cal. yr BP (Figure 10a). These peaks are correlated to ASI events recorded in Undarsmosse bog in south-western Sweden (Figure 10c; De Jong et al., 2006), increasing westerlies along the coast of Norway (Figure 10d; Bakke et al., 2008), a persistent positive NAO (Figure 10e; Olsen et al., 2012) and dunefield alterations in western Europe (Figure 10h; Clarke and Rendell, 2009; Clemmensen et al., 2009). The observed changes have been related to a shift towards cooler and wetter conditions, which favoured the expansion of glaciers in Scandinavia (e.g. Bakke et al., 2010; Balascio and Bradley, 2012; Nesje, 2009). This cooling is also observed in the trends of the diatom-derived sea surface temperature (SST) reconstruction from the Vøring Plateau (Figure 10f), which is concurrent with decreasing summer insolation throughout the Holocene (Andersen et al., 2004; Birks and Koç, 2002).
Following this period, a relatively calm phase is recorded between 4000 and 3000 cal. yr BP indicated by a gently decreasing trend in the influx of sand grains >250 µm, reaching the lowest level at 3200 cal. yr BP. This is also recorded in other proxies, which are suggested by De Jong et al. (2006) to be related to a shift towards drier (stable) summer conditions dominated by a continental climate. However, Vorren et al. (2007) identified several short-lived wet-shifts, as well as cool conditions in a high-resolution core from a raised bog situated at the northernmost tip of Andøya during the same period, pointing to local climate variations. On the Faroe Islands, this period is characterized by increased soil erosion which has been related to freeze/thaw cycles caused by a cooler climate as a response to atmospheric and oceanic variability (Olsen et al., 2010). Furthermore, the period is represented by decreasing summer and winter temperatures, as well as a decrease in winter precipitation in a pollen and macrofossil study from lake Svanåvatnet just south of the Arctic Circle in northern Norway (Bjune and Birks, 2008).
Aeolian activity on Andøya from 3000 cal. yr BP to present
A distinct increase in sand content is observed in LATP-113 after 3000 cal. yr BP lasting until 1750 cal. yr BP. The recorded increase in sand grains >250 µm (unit L4) occurred simultaneously as the RSL was falling (Figure 10g), and terrestrial proxy records reflect high climatic variability. This is especially noticeable in the ASI record from Undarsmosse bog that was very high between 2800 and 2200 cal. yr BP and is suggested to indicate intensification in storm climate and a shift towards wetter conditions (De Jong et al., 2006; Mellström et al., 2015). The NAO index is also highly variable, although predominantly negative during this period, most probably indicating rapid shifts between wet and dry conditions (Olsen et al., 2012). Based on the chronology, the foredune grew rapidly after 3500 cal. yr BP, indicating suitable conditions for dune build-up (Figures 4 and 5). A small peak in the influx of sand grains >250 µm to Latjønna is observed at 1775 cal. yr BP, before the influx of sand rapidly slows down during a short period between 1750 and 1600 cal. yr BP. The reason for this abrupt change is unknown; however, it is concurrent with a period of low input of sand (SMAR) at Sørøya between 2000 and 1550 cal. yr BP north of the study area, which by Sjögren (2009) is suggested to represent a cool and stable period (Figure 10b). There is also the possibility of an extreme storm event or a storm group removing sand susceptible for deflation, causing a period of sand starvation and dunefield stability (e.g. Ferreira, 2005; Loureiro et al., 2012).
The highest influx of sand grains >250 µm to Latjønna is recorded between 1600 and 600 cal. yr BP, which is within the same time span as several palaeosols indicate stability in the foredune (Figures 4 and 5). The period between 1600 and 600 cal. yr BP is dominated by a very positive NAO (Olsen et al., 2012), a strong influence of westerlies (Bakke et al., 2008) and an increasing input of sand at Sørøya (Sjögren, 2009). De Jong et al. (2007) relate ASI peaks from bogs in south-western Sweden to humidity shifts reconstructed by testate amoebae analysis. The humidity shifts occur at around 1550, 1200, 800 and 350 cal. yr BP, which is consistent with ‘wetness shifts’ recorded in the degree of peat humification in Lofoten and on Andøya (Vorren et al., 2007, 2012) and with the formation of palaeosols in the studied foredune (1320, 735 and 305 cal. yr BP). This period also coincides with the onset of large-scale dune formation in France at 1300 cal. yr BP (Clarke et al., 2002) and in Denmark between 900 and 750 cal. yr BP (Clemmensen et al., 2009, and references therein). Based on these studies, it is rather consistent that the period between 1600 and 600 was characterized by large-scale atmospheric instability in the North Atlantic region leading to a highly variable climate.
After 600 cal. yr BP, a distinct drop in the influx of sand grains >250 µm is recorded in LATP-113 (unit L8). Nevertheless, high amplitude variations are observed, with three short phases with higher influx of sand occurring during the ‘Little Ice Age’ (LIA, AD 1400–1920) at 450 (AD 1500), 300 (AD 1650) and 150 cal. yr BP (AD 1800). Several instrumental, historical and proxy records give evidence of periods with enhanced storminess in the North-Eastern Atlantic region during LIA (e.g. Björck and Clemmensen, 2004; Clarke and Rendell, 2009; Clemmensen et al., 2015; Clemmensen and Murray, 2006; Dawson et al., 2004; De Jong et al., 2006; Lamb and Frydendahl, 1991). The record from Sandhaugan does not show any signs of extraordinary high input of sand during LIA as would be expected based on the other studies. The relatively low sand influx (compared with earlier periods) recorded in Latjønna may indicate that the climate alterations were not sufficient to create instability at Sandhaugan during this period.
Conclusion
This study has provided a detailed reconstruction of past aeolian activity at Sandhaugan, Andøya, northern Norway, based on a combination of geomorphological mapping, foredune stratigraphy and a continuous lake sediment record from Latjønna. The foredune stratigraphy and the lake sediment record extend back to ~3700 and 6200 cal. yr BP, respectively. Based on the results, the Sandhaugan dunefield was initiated after the Tapes transgression (~6800 cal. yr BP) during a phase of falling RSL, which provided suitable conditions for sand accumulation.
Aeolian activity has been calculated based on the weight of sand grains >250 µm/cm recorded in Latjønna divided by sedimentation rate. Phases with high influx of sand grains >250 µm is recorded at (1) 4800, (2) 4250, (3) 3000–2000, (4) 1850–1750, (5) 1600–600, (6) 450, (7) 300 and (8) 150 cal. yr BP, which is concurrent with periods of increased storminess indicated from other sites in the North-Eastern Atlantic region.
Since the history of dune activity at the two study sites is not in phase with each other (instability/stability), it is difficult to pinpoint the cause for dunefield alteration on Andøya. Aeolian activity at Sandhaugan is complex and occurs at a landform rather than a landscape scale. It is suggested that the parabolic dune activity (as recorded by lacustrine sediment in Latjønna) is more controlled by the winter wind regime transporting sand grains farther inland. In contrast, the foredune activity (as recorded at one exposure in a foredune) is more controlled by the long-term changes in RSL and summer climate. For both records, we assume that a wider foreshore, as a response to a falling RSL, made sand more susceptible for erosion by wind and that periods of increased storminess caused more aeolian activity on Andøya during the last 3000 years.
Footnotes
Acknowledgements
We direct our sincere thanks to Bjørn Skorpa Eikeland, Martin Tvedt and Erlend Sporstøl Vikestrand for valuable assistance during several periods of fieldwork and to Benjamin Aubrey Robson for proofreading the manuscript. We would also like to thank Stein Kristiansen at DNMI for information about meteorological measurements at Andenes. Timothy G. Fisher and three anonymous reviewers are thanked for many thoughtful comments that improved the manuscript.
Funding
This study has received funding from Meltzerfondet awarded to PRN.