



Abstract
The social impacts of climate change constitute an important field within the study of global change. The impacts of historical climate change on dynastic transitions and prosperity in China from a food safety perspective is a helpful research topic that contributes to a better understanding of the impacts, process, and mechanism of climate change, as well as a reference for projecting the impacts of climate change in the future. This study defined the periods of dynastic transitions and prosperity in China from 210 BC to AD 1910 and analyzed the relationships among dynastic transition or dynastic prosperity, climate change, and grain harvests. From 210 BC to AD 1910, dynastic transitions mostly coincided with cold ages or the periods that changed from warm to cold and dry or wet-to-dry periods when there was relatively poor harvest. In contrast, dynastic prosperity mostly coincided with warm ages or the periods that changed from cold to warm and wet or dry-to-wet periods when there was relatively bumper harvest. Meanwhile, the dynastic transitions from a divisive dynasty to a unified dynasty often came with a progressively warm phase on the century scale when grain harvests increased. Interestingly, the division of a unified dynasty often came with a progressively cold phase and poor harvests. Furthermore, changes in temperature and agricultural production may be one of the most important factors leading to the collapse of Tang Dynasty. In conclusion, the fluctuation of grain harvests and climate change correspond with the transitions between a tumultuous society and an ordered one, which reveals that the social sensitivity periods were often a result of a change to a colder climate on the century scale.
Keywords
Introduction
Research on climate change and its impact is a current global issue that has drawn international attention. In recent years, studies have revealed that a series of social and economic changes, dynastic transitions, eruption of wars, and population fluctuations in the history of human development was triggered by climate change (Balbo et al., 2010; Büntgen et al., 2011; De Menocal, 2001; Fan, 2010; Haug et al., 2003; Hsiang et al., 2013; Lee and Zhang, 2010; Liu and Feng, 2012; Su et al., 2014; Wei et al., 2014, 2015; Xiao et al., 2015; Yin et al., 2014; Zhang et al., 2007, 2011, 2014b, 2015). For example, substantial multiyear droughts coincided with the collapse of the Mayan civilization (Haug et al., 2003); anomalously cold periods were associated with major periods of instability in central Europe (Büntgen et al., 2011). Generally, climate change in agricultural societies directly influences the agricultural productivity and the impacts of climate change transfer to society and the economy indirectly through the agriculture, such as with the reign of an empire or population fluctuations (Fang et al., 2013, 2014b; Ge, 2011; Lee and Zhang, 2010; Su et al., 2014; Wei et al., 2014, 2015; Xiao et al., 2015; Yin et al., 2014; Zheng et al., 2014b).
Over the past two millennia, there were dozens of unified or divided regimes in China, each of which went through a process of consolidation followed by deterioration. In addition to the social and economic impacts, climate change is also regarded as an important factor that influences dynastic transitions (Ge et al., 2013b; Lee and Zhang, 2010; Zhang et al., 2011, 2015). There are many disagreements on the relationship between dynastic transitions in China and climate change, such as the role of climate change in the collapse of Tang Dynasty (Cheng et al., 2010; Yancheva et al., 2007a, 2007b; Zhang, 2008; Zhang et al., 2008, 2010a, 2010b; Zhang and Lu, 2007). The solutions to the conflict do not only lie on reducing the uncertainty in the meaning of the index of climate change but also depend on a more detailed study of the conjunction between climate change and dynastic fluctuations, which is to say the study of process and mechanism.
Based on the concepts of vulnerability and food security applied in the research of Global Changes, the historical impact of climate change in China can be regarded as food security issues (Fang et al., 2014b). Historically, China’s food security can be simplified to cover the safety in three levels: food production, supply, and consumption (Fang et al., 2014b). Food availability affected not only social sensitivity to climate change through its direct influence on the per capita food supply but also social capacities for responding to climate change through its influence on socioeconomic status. Based on the reconstructed data of historical grain harvests, research on the impact of ancient climate change in China on dynastic transitions and prosperity from a food safety perspective is helpful for the evaluation of the process and mechanism by which climate change influences dynastic fluctuations and transitions. This research also provides cases for a better understanding of the process and mechanism of climate change.
Meanwhile, China has long-term, continuous, and rich historical documents, such as biography, archive, chorography, which international scholars recognize as a unique resource available for the reconstruction of historical climate change. The vocabulary of the Chinese language provides a rich variety of unique words that distinguish the extent and scope of socioeconomic status. Researchers have successfully demonstrated the feasibility and reliability of using historical records and descriptions to reconstruct many facets of past climate change such as winter temperature and wetness index (CMA, 1981; Chu, 1972; Ge et al., 2010, 2013a; Zheng et al., 2006). Similarly, a large number of records contained in historical Chinese documents describe agricultural production, social economy, dynastic transitions, and prosperity, and they can be quantified into an index (Su et al., 2014; Wei et al., 2014, 2015; Yin et al., 2014). This study, based on the winter half-year temperature departure series (Ge et al., 2010) and precipitation series (Zheng et al., 2006) in eastern China, and the grain yield grade sequence (Yin et al., 2014), discussed the relationships among climate change, grain harvest fluctuations and ancient Chinese dynastic transitions and prosperity over the past two millennia.
Material and methods
Regional setting and data sources
The study period was from 210 BC to AD 1910 and covered the Western Han Dynasty (206 BC–AD 24) to the Qing Dynasty (AD 1645–1911) of China. China’s cultivated land is mainly distributed in the eastern monsoon climatic zone (Ge, 2011; Han, 2012; He et al., 2010; Zhou, 2007; Figure 1). Agricultural production is limited by both heat conditions and high rainfall variability. Thus, climate fluctuations and disasters have a significant impact on food production (Su et al., 2014).

Expansion of the cropland (Han, 2012; Zhou, 2007) and the region covered by the temperature sequence (Ge et al., 2010) and precipitation sequence (Zheng et al., 2006).
In this study, the winter half-year temperature departure series (Ge et al., 2010) and precipitation series (Zheng et al., 2006) were used to represent climate changes in eastern China over the past 2000 years, and the grain yield grade sequence (Yin et al., 2014) was chosen to represent agricultural production from 210 BC to AD 1910 (Figure 1). The climate sequence and grain harvest sequence used in this study overlapped to a large extent, and both covered the key farming region of each dynasty from the Western Han Dynasty (206 BC–AD 24) to the Qing Dynasty (AD 1645–1911) of China (Figure 1).
The basic source materials for information regarding dynastic transitions and prosperity included two parts. One is the book series of Twenty-Four Histories (Xu and An, 2004) and Qing History Draft (Zhao and Ke, 1977). The other is the books of Chinese History (Bai, 1982), History of Chinese Revolution by Farmers (Zhang and Zheng, 1983), Climate Change through Ancient Chinese Dynasty (Ge, 2011).
Analysis of the relationship between climate change, grain harvests, and dynastic transitions and prosperity
From the perspective of food security, the agricultural yield that is influenced by temperature and water availability, lays the material foundation of a dynasty (Fang et al., 2013, 2014b). This study compared the relationships between climate change, grain harvest fluctuations, dynastic transitions, and prosperity as follows:
The correlation between dynastic transitions, climate change, and grain harvests was analyzed by calculating the corresponding average temperature, precipitation variation, and the mean grade level of grain harvests during dynastic transitions.
The correlation between dynastic prosperity, climate change, and grain harvests was analyzed by calculating the corresponding average temperature, precipitation variation, and the mean grade level of grain harvests during dynastic prosperity and by creating scatterplots and calculating linear trends between the temperature departure and the duration of dynastic prosperity in different periods.
Social sensitive periods over the past 2000 years in China were analyzed by calculating the mean value of the yield grade every 30 years and building the scatterplots and linear trends between temperature departure and grain grades in different warm and cold periods. The times of prosperity were compared with dynastic transitions using the mean value of the grain harvests in the respective period.
Results
Chinese climate change, grain harvests, dynastic divisions, and unifications over the past 2000 years
Chinese temperature change
The winter half-year temperature departure series in eastern China over the past 2000 years reconstructed by Ge et al. (2010) was chosen to reflect the temperature changes. In China, since Chu (1972) reconstructed the temperature sequence of the past 5000 years based on phenological data, the reconstruction of temperature changes in China has been improved unceasingly. At present, among the temperature change sequences of China of the past 2000 years, Ge et al.’s (2013b) temperature sequence, which is reconstructed by principal component regression (PCR) and partial least squares (PLS) regression from temperature anomalies with respect to the 1851–1950 climatology at a decadal resolution, covering the whole of China for the past 2000 years, is widely recognized and shared. The Central East (CE) temperature change of Ge et al.’s (2013b) sequence is based on the winter half-year temperature departure series (Ge et al., 2010), which was reconstructed from historical data, including phenological phenomena, the dates of first and last frosts, the distribution and northern boundaries of subtropical economic plants (e.g. citrus, tea, and bamboo), frost and freeze disasters, farming activities, and temporal and spatial distributions of farming systems. Particularly, the winter half-year temperature departure series (Ge et al., 2010) in eastern China could explain 71% of the variance of the temperature change sequence of all of China (Ge et al., 2013a), and the starting year of this winter half-year temperature departure series is 210 BC. Because the winter half-year temperature departure series (Ge et al., 2010) covered the main agricultural areas of China, which have long been the center of historical agricultural practices and economic activities, and shared the same starting year with the grain yield grade sequences involved in this study, the winter half-year temperature departure series (Ge et al., 2010) was chosen to reflect the climate changes of the past 2000 years. The time resolution of the winter half-year temperature departure series in eastern China over the past 2000 years ranged from as much as 30 years to as little as 10 years. A high-resolution, reconstructed climate series that spans more than one millennium and ranges from regional to global have been generated (Christiansen and Charpentier Ljungqvist, 2012; Ge et al., 2013a; Loehle and McCulloch, 2008; Mann et al., 2008, 2009; Solomon, 2007). The winter half-year temperature departure series (Ge et al., 2010) is comparable with the above climate series at the sequence length, time resolution, and so on.
From 210 BC to AD 1910 (from the Western Han Dynasty to the Qing Dynasty), the temperature change in China can be roughly divided into six phases (Ge et al., 2010, 2013a; Zheng et al., 2010). The three warm periods are 210 BC–AD 180 (the ‘Han Warm Period’), AD 541–810 (the ‘Sui-Tang Warm Period’), and AD 931–1320 (the ‘Song-Yuan Warm Period’) when the winter half-year temperatures in eastern China exceeded the current average temperature (AD 1951–1980) by 0.28°C, 0.48°C, and 0.18°C, respectively. The three cold periods are AD 181–540 (the Wei, Jin, Northern, and Southern Dynasties Cold Period), AD 811–930 (the late Tang Cold Period), and AD 1321–1910 (the Ming-Qing Cold Period) when the winter half-year temperature in eastern China was under the current average temperature by 0.30°C, 0.28°C, and 0.39°C, respectively (Ge et al., 2013a; Zheng et al., 2010). The ‘Han Warm Period’ and ‘Song-Yuan Warm Period’ correspond with the ‘Roman Warm Period’ and the ‘Medieval Warm Period’ in the northern hemisphere, respectively; the Wei, Jin, Northern, and Southern Dynasties Cold Period and the Ming-Qing Cold Period coincide with the Cold Dark Age Period and the ‘Little Ice Age’, respectively (Büntgen et al., 2011; Christiansen and Charpentier Ljungqvist, 2012; Loehle and McCulloch, 2008; Mann et al., 2008, 2009; Solomon, 2007).
Chinese precipitation change
The precipitation series in eastern China during the past 1500 years reconstructed by Zheng et al. (2006) was chosen to reflect the precipitation changes. The proxy precipitation index dataset for the period AD 501–2000 over eastern China (east of 105°E; 25–40°N approximately) was statistically derived from three existing datasets, which were reconstructed based on Chinese historical documents and instrument measurements. The first is the drought/flood grading for 63 stations in the period 137 BC–AD 1469 derived from 22,567 pieces of historical drought/flood descriptions extracted from ancient Chinese writings (Zhang, 1996). The second is the dry/wet dataset for 85 stations from 1470 to 1950 based on the statistics of drought/flood counties extracted from local gazettes and historical drought/flood archives (Zheng et al., 1993). The third is drought/flood grading since 1951 for the same stations based on individual station precipitation records. Because of too much missing drought/flood-grade data before AD 500 for all 48 stations, this series starts only from AD 500. But this precipitation series was the only available 2000-year-long decadal precipitation series that covered the entire region of eastern China.
On the centennial time scales, precipitation variation in eastern China from AD 500–1910 (from the Eastern Han Dynasty to the Qing Dynasty) exhibited three dry phases (AD 500–880, AD 1001–1240, and AD 1431–1540) and three wet phases (AD 881–1000, AD 1241–1430, and AD 1541–1910), with multi-decadal dry/wet fluctuations within each phase (Zheng et al., 2006).
Chinese grain harvest
The grain yield grade sequence (Yin et al., 2014) with a 10-year resolution from 210 BC to AD 1910 in China was chosen to reflect the fluctuations in the agricultural yields of the past 2000 years. Grain harvests reflected relative fluctuations in agricultural yields, which may have represented relative changes in the grain production capacity of the production subsystem. Because grain harvests are closely related to climate change, they can reflect the impacts of climate change on the production subsystem, as well as on food security.
The grain grade sequence was reconstructed using the Semantic Differential method (Fang et al., 2014a), which was used to quantify harvest grades based on descriptions contained in historical documents. The basic source materials for information regarding agricultural yields are the Twenty-Four Histories (Xu and An, 2004) and Qing History Draft (Zhao and Ke, 1977), both written in biographical style. The Twenty-Four Histories is the general term of 24 chronicle historical books about the official history of the Chinese except Qing Dynasty, generally written and reviewed by later dynasty independently. The Twenty-Four Histories contain 3213 volumes and about 40 million words, covering a period of protohistory and history from 2550 BC to the Ming Dynasty in the 17th century. The Qing History Draft is a draft of the official history of the Chinese Qing Dynasty written in 1927, including 536 volumes.
In the volumes of Imperial Biographies, Five Elements Records, and Economic Records for each dynasty within these books, there are abundant records, which can be used as direct or indirect evidence of the harvest condition. The direct evidence includes information related to crop production (bumper or poor yields) and food security (such as famine because of natural disasters). The indirect evidence includes information related to major agricultural disasters (floods, droughts, frosts, and damage from insects and hailstorms), subsistence conditions, grain prices, and grain storage status. In total, 2755 records were collected. Throughout the study period, there were 1513 years with records (Figure 2) (accounting for 71.4% of the total years). The number of years with no records was 607 (28.6%) (Figure 2). First, annual grain harvest levels were assessed according to semantic differences in historical records on a yearly basis. These annual levels were then converted into grain harvest grades for each decade (Su et al., 2014; Yin et al., 2014). Over the past 2000 years, grain harvest grades ranging from grade 1 (poor harvest) to grade 5 (bumper harvest) roughly constituted 44%, 56%, 64%, 71%, and 78% of the grain harvests, respectively.
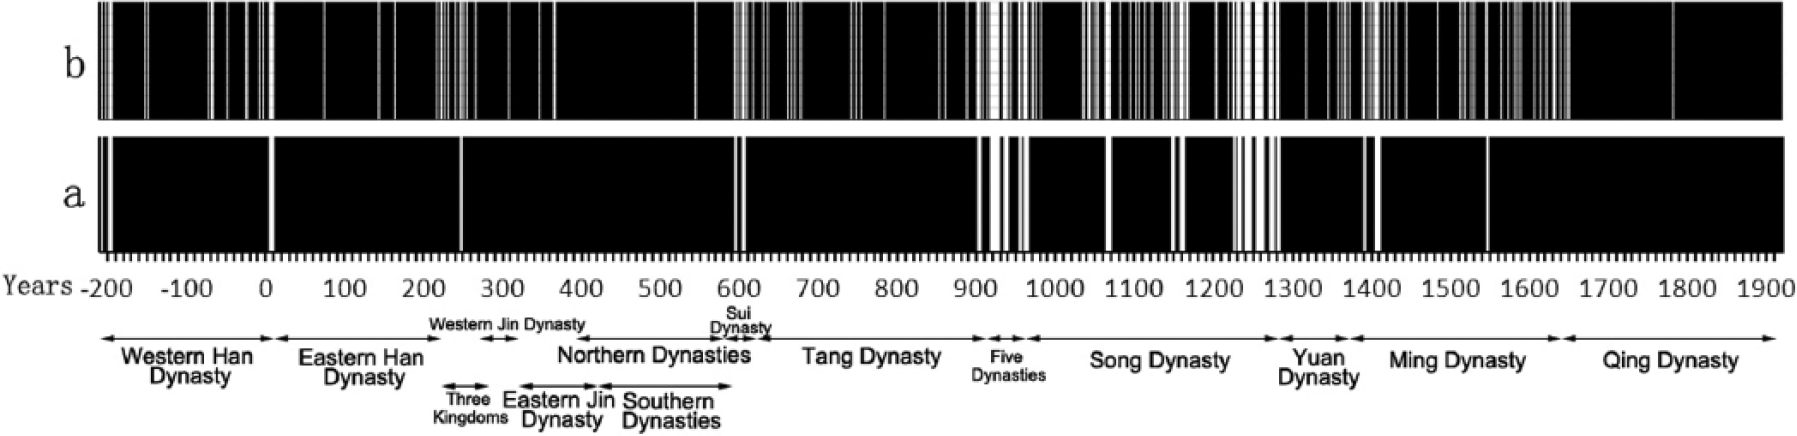
Years of related records (black parts) and no records (white parts), 210 BC–AD 1910: (a) no record for more than five consecutive years and (b) no record for more than two consecutive years.
Over the past 2000 years, the grain harvest fluctuation can be divided into five phases (Yin et al., 2014). The three agricultural bumper harvests predominate periods are 210–51 BC, AD 621–1240, and AD 1661–1910, when average grain harvest grades were all above 3.2. The two poor harvests predominate periods are 51 BC–AD 620 and AD 1241–1660, when the average grain harvest grades were all below 2.8 (Figure 3).
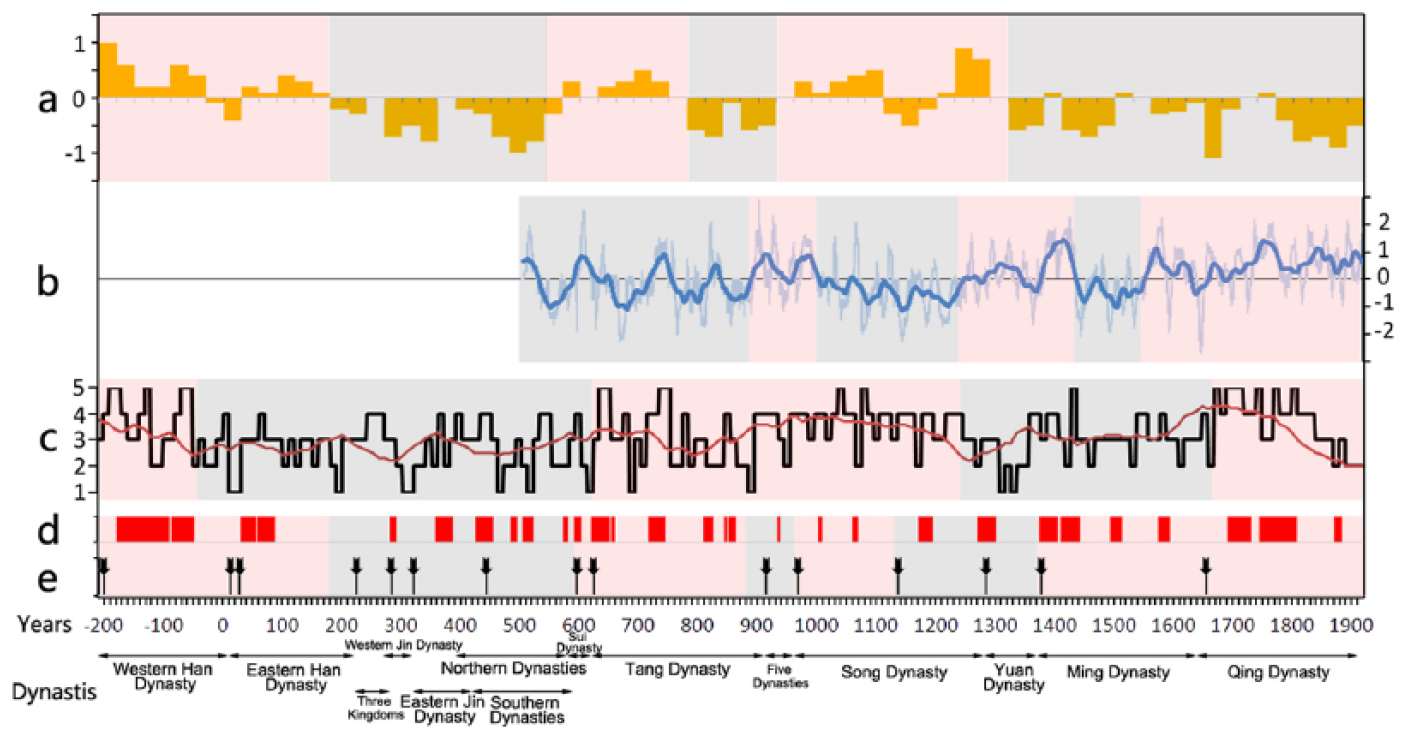
Climate change, grain harvests, and dynastic transitions and prosperity in China over the past 2000 years. (a) Winter half-year temperature departure series in eastern China (Ge et al., 2010). Shades of red represented three warm phases and gray represented three cold phases, respectively. (b) Precipitation series of eastern China (Zheng et al., 2006). Shades of red represented three wet phases and gray represented three dry phases, respectively. The blue line was the 30fft moving average line. (c) Grain yield grade sequence (Yin et al., 2014). Shades of red represented three bumper harvest phases and gray represented two poor harvest phases, respectively. The red line was the 50fft moving average line. (d) Chronology of Chinese dynastic prosperity. Shades of red represented four unified phases and gray represented three divisive phases, respectively. (e) Chronology of Chinese dynastic transition. Shades of red represented four unified phases and gray represented three divisive phases, respectively.
Chinese dynastic transition and prosperity
Definition for dynastic transition and prosperity
Since the Qin and Han Dynasties, one key feature of Chinese history has been the frequent transition between an ordered society and a society in turmoil. Each dynasty from 210 BC to AD 1910 went through a process that spanned from prosperity to deterioration. When a dynasty came to collapse, it would be taken over by a new dynasty, which was generally called ‘the old dynasty was replaced with a new one’ in China. On the other hand, the peak of development in each dynasty was represented by the periods when the dynasty reached a relatively high level in politics, economy, social welfare, and so on, which was generally called ‘the thriving of a nation and the wellbeing of its citizens’ in China.
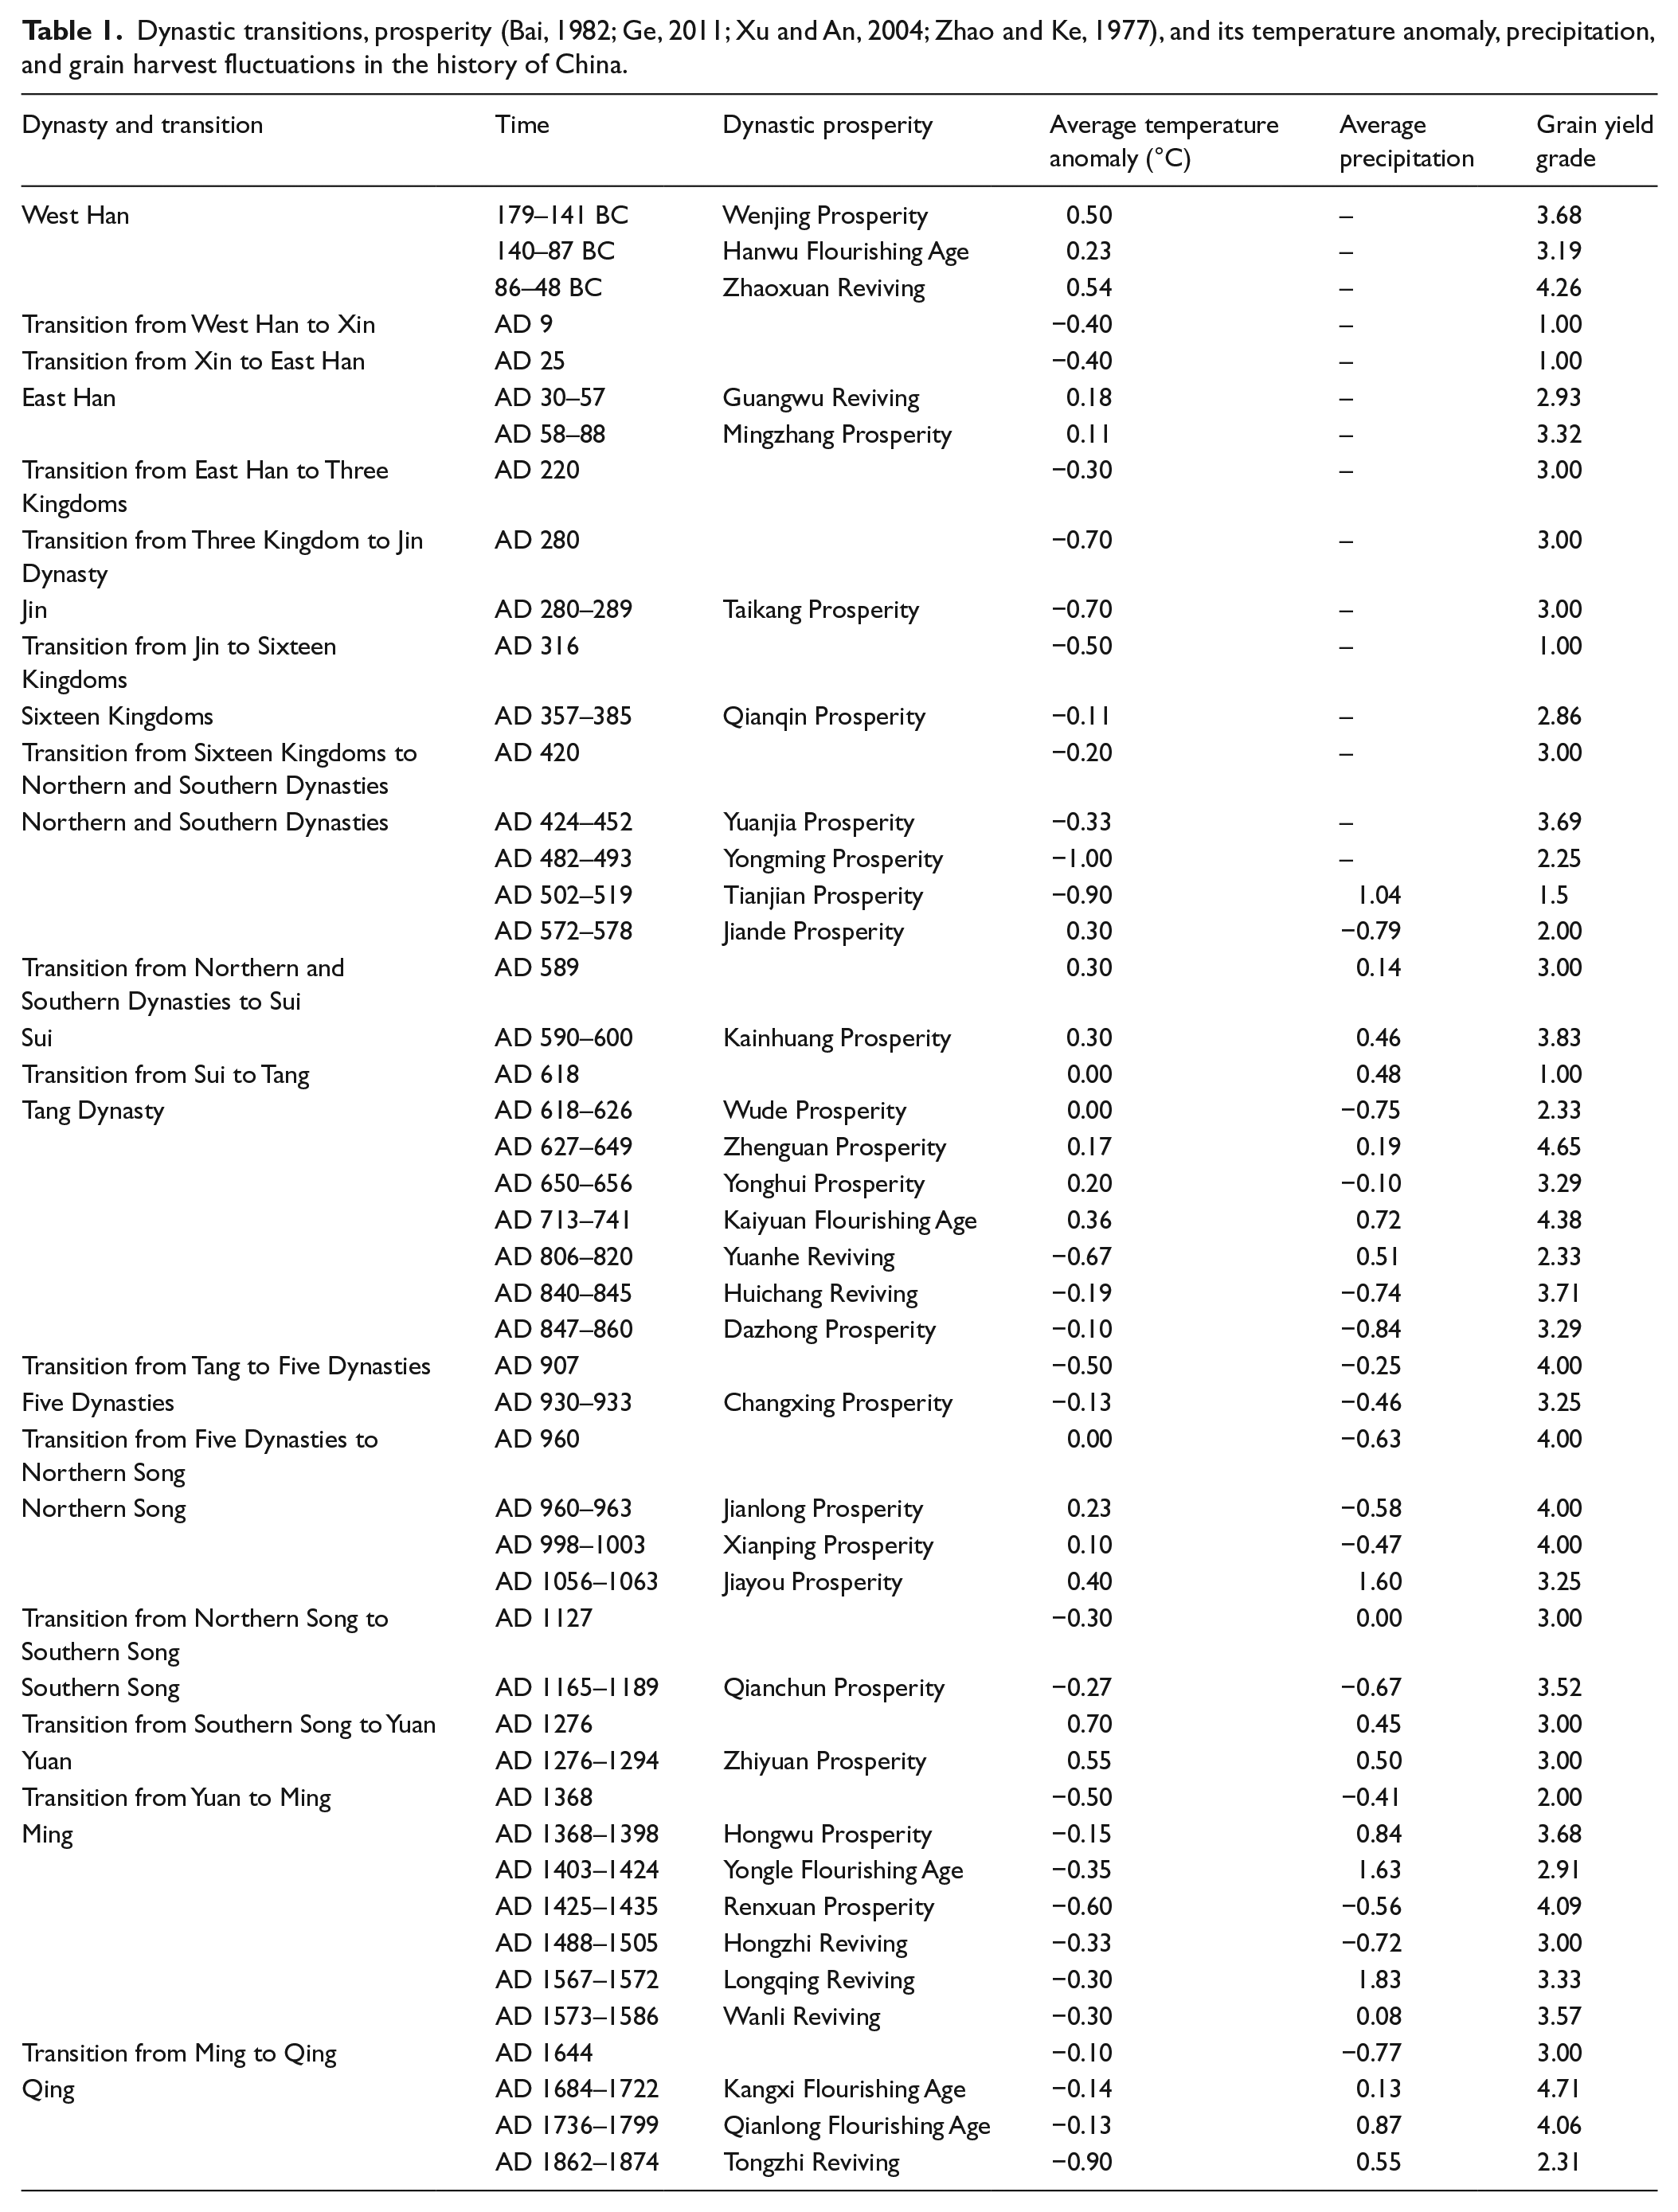
The basic source materials for information regarding dynastic transitions and prosperity included two parts. One is the book series of Twenty-Four Histories (Xu and An, 2004) and Qing History Draft (Zhao and Ke, 1977) which were history books written in biographical style. The other is the books of Chinese History (Bai, 1982), History of Chinese Revolution by Farmers (Zhang and Zheng, 1983), Climate Change through Ancient Chinese Dynasty (Ge, 2011) which were published over the last 30 years and written by modern leading Chinese scholars. These books are basically the authoritative work in terms of China’s general history, dealing with every dynasty’s establishment, development, prosperity, and replacement. Based on the descriptions concerning the phase change of social rise and fall for a specific dynasty extracted from these books, this study has defined the periods of dynastic transition and prosperity for each dynasty (Table 1).
Dynastic transitions, prosperity (Bai, 1982; Ge, 2011; Xu and An, 2004; Zhao and Ke, 1977), and its temperature anomaly, precipitation, and grain harvest fluctuations in the history of China.
The Dynastic Transition between the destruction of a dynasty and the thriving of a new dynasty was defined as the point in time when a new dynasty was established. For instance, the Tang Dynasty was established in AD 618, which was defined as the dynastic transition between the Sui and the Tang Dynasties.
When a dynasty reached a high level of development in economics and politics, it tended to be called ‘Reviving, Prosperity or Flourishing’. This study defined all of the ‘Reviving’, ‘Prosperity’, and ‘Flourishing’ as Dynastic Prosperity. According to the conclusion of Academia of History, dynastic prosperity was often named after the name of ruling emperor, such as ‘The Benign Administration of Wen and Jing Reign Period (179 BC-141 BC)’, or named after the reign title of the emperor, such as ‘The Benign Administration of Zhenguan Reign Period (627 AD-649 AD)’. The duration of a period of dynastic prosperity had been approximately defined by the reign period or the length of the emperor on the throne. Periods of dynastic prosperity lasting for more than 20 years would be further calculated.
Accordingly, over the past 2000 years, from the Western Han Dynasty to the Qing Dynasty, there were 14 dynastic transitions and 34 dynastic prosperity periods (Table 1).
Chinese dynastic divisions and unifications
According to the level of political and social order, the ancient Chinese feudalistic society can be divided into seven phases including four unified periods and three divisive periods (Ge, 2011). The four unified periods are 206 BC–AD 183 (the East and West Han unified period), AD 590–884 (the Sui and Tang unified period), AD 961–1127 (the Northern Song unified period), and AD 1368–1910 (the Ming and Qing unified period). The three divisive periods are AD 184–589 (the Wei, Jin, Northern, and Southern Dynasties divisive period), AD 885–960 (the late Tang and Five Dynasties divisive period), and AD 1128–1367 (the Southern Song and Yuan divisive period).
The East and West Han unified period (206 BC–AD 183) experienced an unprecedented development of social economy and culture and presented flourishing ages. The Wei, Jin, Northern, and Southern Dynasties divisive period (AD 184–589) was the most frequent period of regime change in China’s history and was a time of bitter divisions. The Sui and Tang unified period (AD 590–884) was recognized as China’s most glorious period. The late Tang and Five Dynasties divisive period (AD 885–960) experienced frequent peasant uprisings and general division. The Northern Song unified period (AD 961–1127) experienced a relatively unified situation and economic, cultural, and technological prosperity. During the Southern Song and Yuan divisive period (AD 1128–1367), although it experienced transitory unification in the Yuan Dynasty, China experienced a separate regime situation in general. The Ming and Qing unified period (AD 1368–1910) again reached a high level of economic and political development.
Over the 2120 years covering the Western Han Dynasty to the Qing Dynasty, the unified period reached 1394 years (65.3%) and the divisive period reached 726 years (34.2%).
Relationship between dynastic transition, climate change, and grain harvests
The dynastic transitions over the past 2000 years mainly occurred when the climate changed from warm/wet to cold/dry and the grain yield decreased.
From 210 BC to AD 1910, there were 14 dynastic transitions (Table 1, Figure 3). The average temperature anomaly of all 14 transitions was only −0.21°C. In all, 78.6% of the dynastic transitions coincided with a cold climate that includes seven dynastic transitions that occurred in the cold periods and four transitions that occurred in the relatively cold stages of a warm period. In addition, 12 dynastic transitions (85.7%) occurred when the climate changed from warm to cold.
From AD 500–1910, there were eight dynastic transitions (Table 1, Figure 3). The average precipitation variation of all eight transitions was only −0.12. In all, five dynastic transitions coincided with a dry climate and three coincided with wet climate. Meanwhile, five dynastic transitions occurred when the climate changed from wet to dry.
From 210 BC to AD 1910, in the 14 dynastic transitions, four transitions coincided with very poor harvests, eight coincided with slightly poor harvests, and two coincided with near bumper harvests. In all, 85.7% of the transitions occurred when the agricultural production decreased. In addition, the average grain yield grade of all 14 transitions was just 2.5.
Relationship between dynastic prosperity, climate change, and grain harvest
The dynastic prosperity over the past 2000 years occurred mainly when the climate changed from cold/dry to warm/wet and the grain yield increased.
From 210 BC to AD 1910, there were 34 dynastic prosperity periods over a total of 695 years (Table 1, Figure 3). In all, 85.3% of the dynastic prosperity periods coincided with a warm climate, which includes 18 dynastic prosperity periods that appeared in warm periods and 11 periods in the relatively warm stages of a cold period. In addition, 26 dynastic prosperity periods (76.5%) occurred when the climate changed from cold to warm.
From AD 500 to 1910, there were 25 dynastic prosperity periods over a total of 423 years (Table 1, Figure 3), with the average precipitation variation being 0.17. In all, 14 dynastic prosperity periods coincided with a wet climate, and 11 dynastic prosperity periods coincided with a dry climate; 14 dynastic prosperity periods occurred when the climate changed from dry to wet.
From 210 BC to AD 1910, in the 34 dynastic prosperity periods, 22 periods coincided with a near bumper harvest, while 12 coincided with a slightly poor harvest. The average grain yield grade of all 34 dynastic prosperity periods was 3.3.
Among the 34 dynastic prosperity periods from 210 BC to AD 1910, there were 14 that lasted for more than 20 years, covering 480 years in total (69.1% of the all dynastic prosperity periods) and coincided with a 0.06°C average temperature departure and a 3.73 average grain harvest grade. They were Wenjing (179–141 BC), Hanwu (140–87 BC), Zhaoxuan (86–48 BC), Guangwu (AD 30–57), Mingzhang (AD 58–88), Qianqin (AD 357–385), Yuanjia (AD 424–452), Zhenguan (AD 627–649), Kaiyuan (AD 713–741), Qianchun (AD 1165–1189), Hongwu (AD 1368–1398), Yongle (AD 1403–1424), Kangxi (AD 1684–1722), and Qianlong (AD 1736–1799). Among the 14 periods, seven coincided with a warm climate and five coincided with the relatively warm stages of cold periods (Figure 4 left). In addition, 11 of the 14 periods coincided with a bumper harvest (Figure 4 right).
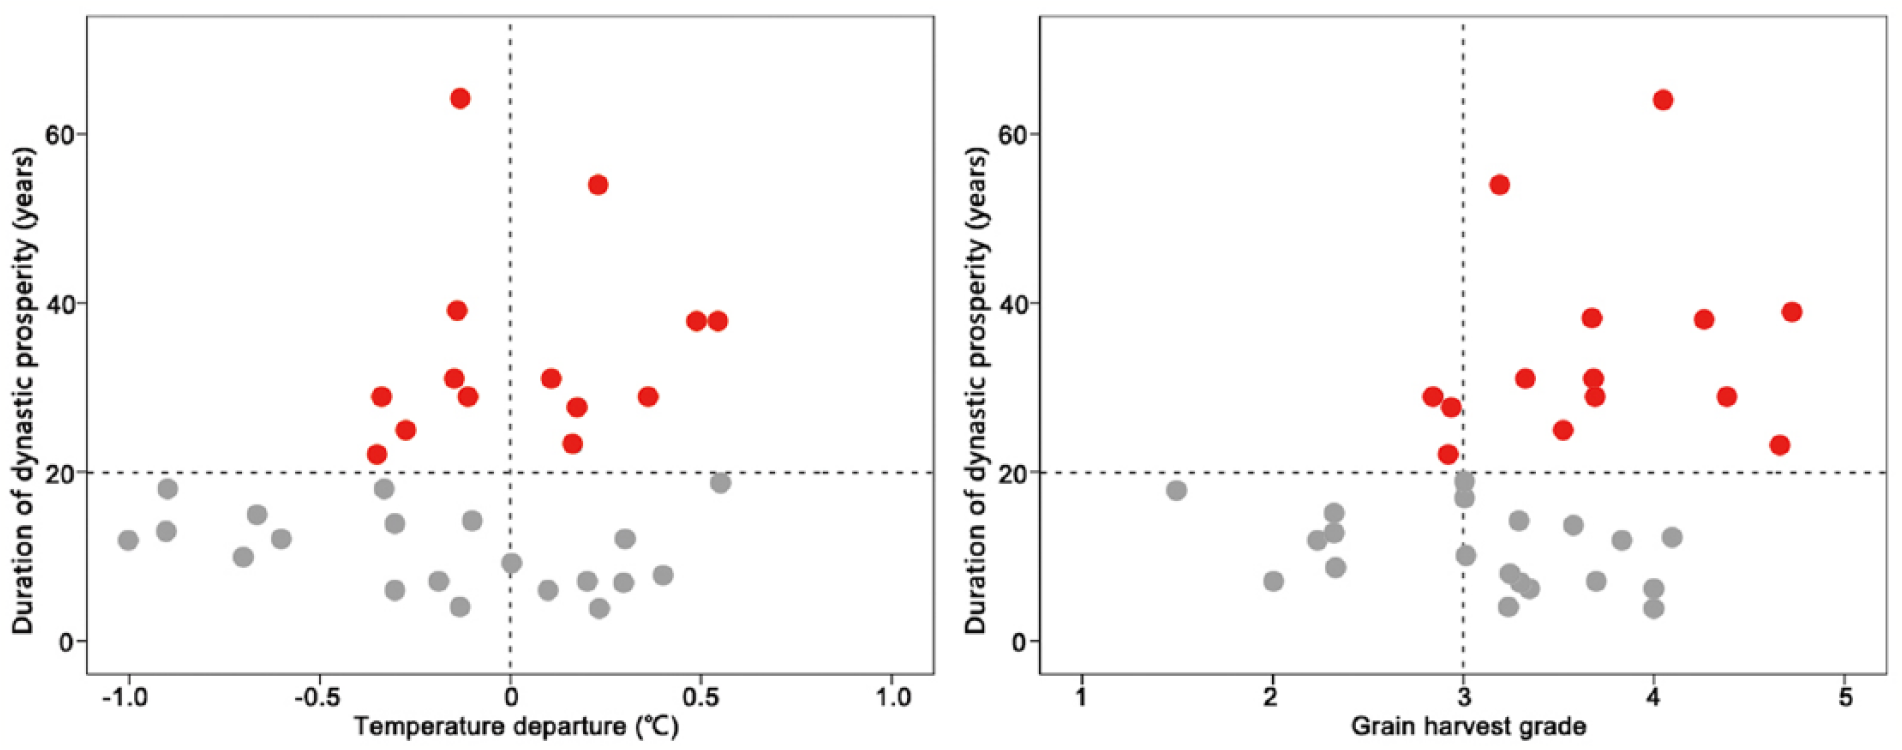
Duration of dynastic prosperity and their respective temperature departures and grain harvest grades in China over the past 2000 years. Red scatters: dynastic prosperity lasting more than 20 years. Gray scatters: dynastic prosperity lasting less than 20 years.
Discussions
Relationship between temperature and grain harvest fluctuations on the century scale and dynastic division and unification
Over the past 2000 years, the transitions between Chinese dynastic divisions and unifications corresponded with climate and grain harvest fluctuations on the century scale, which revealed to some extent that society was sensitive to climate change when the climate fluctuated from warm to cold. However, the relationship between the precipitation variation and dynastic division and unification was not obvious on the century scale (Figure 3).
From 210 BC to AD 1910, the dynastic unification mostly coincided with warm periods, and dynastic division coincided with cold periods, except Southern Song-Yuan division that occurred in warm period and Ming-Qing unification that occurred in cold period.
The ending of dynastic unification and the transitions to dynastic division generally occurred when the climate cooled and grain yields decreased. The temperatures and grain yield grades in the last 50 years of every dynastic unification period were lower than the average but significantly higher than in the first 50 years of the following division periods (Table 2; Figure 5). In contrast, the ending of dynastic divisions and the transitions to dynastic unification generally occurred when the climate warmed and grain yields increased, except for the Southern Song-Yuan division period. The temperatures and grain yield grades in the last 50 years of the Wei-Jin-Northern and Southern division period and the late Tang-Five Dynasties division periods were above the average but significantly lower than that in the first 50 years of the following unification periods (Table 2; Figure 5).
Relationship between climate change, grain harvest, dynastic division, and unification.

Unifications 1–4 refer to the East and West Han unified period (206 BC–AD 183), the Sui and Tang unified period (AD 590–884), the Northern Song unified period (AD 961–1127), and the Ming and Qing unified period (AD 1368–1910), respectively. Divisions 1–3 refer to the Wei, Jin, Northern, and Southern Dynasties divisive period (AD 184–589); the late Tang and Five Dynasties divisive period (AD 885–960); and the Southern Song and Yuan divisive period (AD 1128–1367), respectively.
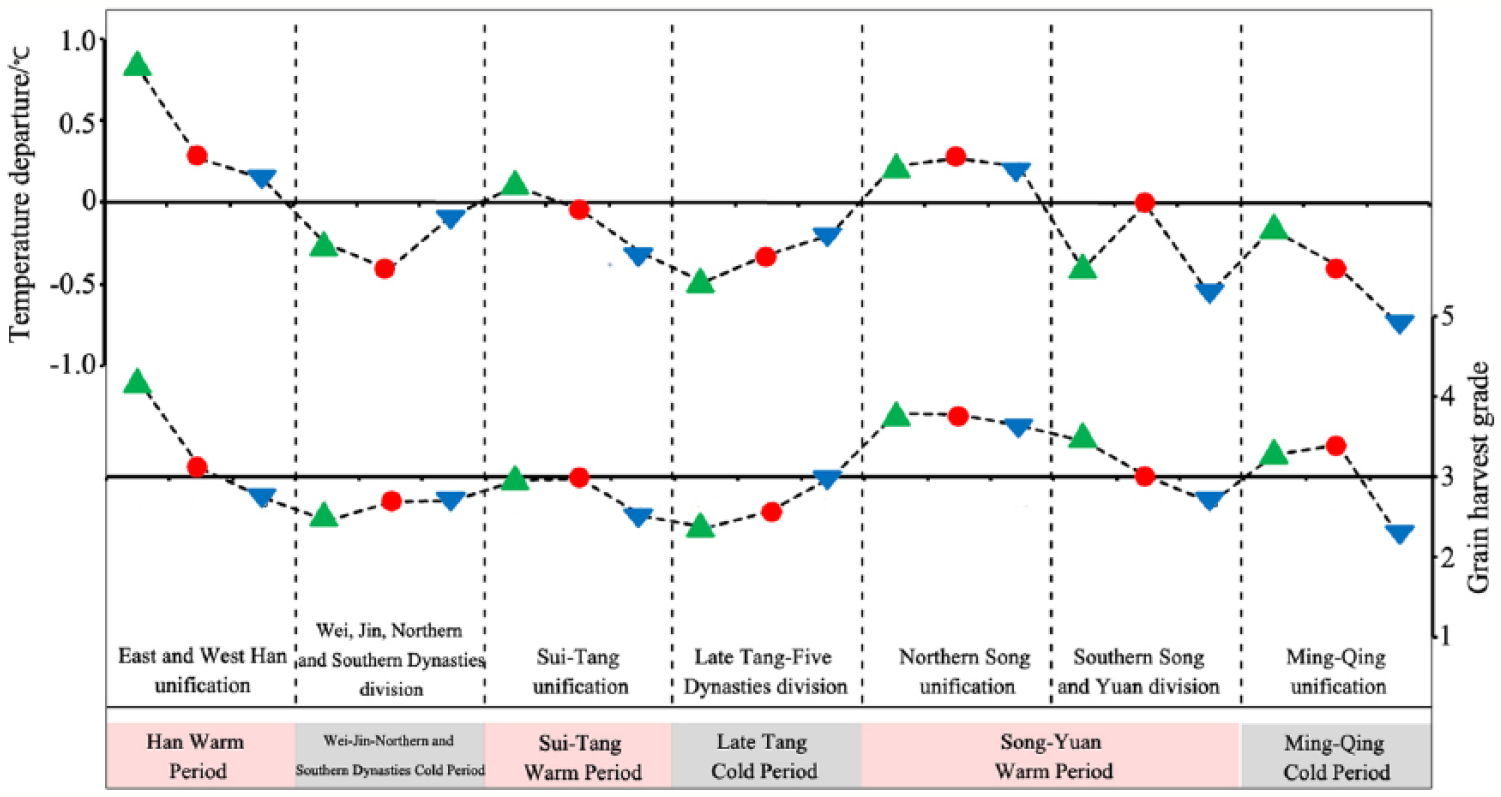
Relationship between climate change, grain harvest, dynastic division, and unification. Green scatter: The average temperature departure and grain harvest grade of every dynastic division or unification in the first 50 years. Red scatter: The average temperature departure and grain harvest grade of every dynastic division or unification. Blue scatter: The average temperature departure and grain harvest grade of every dynastic division or unification in the last 50 years.
Climate change directly affects agriculture productivity and indirectly impacts on the balance of food resources and the demand of society (Fang et al., 2013, 2014b). That is the way linking climate change and the dynastic cycles of division and unification. The transitions from chaos to unity tended to occur at the end of centurial cold periods and the beginning of warm periods because the continuing warmer climate and increasing grain yields provided the material foundation to end the chaos.
The role of climate change in the collapse of Tang Dynasty
There are many disagreements on the relationship between dynastic transitions in China and climate change. One representative conflict is focused on the relationship between the end of Tang Dynasty (AD 618–907) and climate change. The role of climate change in the collapse of Tang Dynasty has been an issue among scholars. The argument is not over impact of climate change on social transitions, but on whether the drought period that existed was caused by a weaker summer monsoon during the late Tang Dynasty and whether the drought played a key role in the collapse of Tang Dynasty (Cheng et al., 2010; Yancheva et al., 2007a, 2007b; Zhang, 2008; Zhang et al., 2008, 2010a, 2010b; Zhang and Lu, 2007). Yancheva et al. (2007a), based on the evidence from the sediment of Lake Huguang Maar, Guangdong Province, speculated that the collapse of the Tang Dynasty was accelerated by declining summer rainfall dating back to AD 700–900. It is supported by other scholars including Zhang (2008) who claimed that the drought caused by a weaker summer monsoon played a key role in inducing social turbulence and destroying the Tang Dynasty based on the δ18O of stalagmites in the Wangxiang Cave, Gansu Province. However, Zhang et al. (2010a) argued that the hypothesis of insufficient rainfall in the summer and long-term drought in the late Tang Dynasty was not compatible with the historical record of the Chinese climate. She further proposed that the climate of the late Tang Dynasty was characterized by cold winters and humid summers, and that the collapse of the dynasty was caused by multiple factors including climate change, which played an important but not a key role.
The Tang Dynasty collapsed in AD 907 as a direct result related to the peasant uprising led by Wang Xianzhi and Huang Chao in AD 875. The uprising initially emerged in Henan Province which was severely stricken by drought. Over the Qianfu years (AD 874–879), the grain harvest was extremely poor and a lot of people became thieves because of hunger, especially in Henan Province 1 . The uprising grew larger and finally took over the capital city, Chang’an, in AD 881. The Daqi Regime founded by Huang Chao went on to collapse in AD 884 because the landlords in Guanzhong Plain starved the rebels by consolidating their fortresses and hiding grains in the fields. Beside the worse climate, the birth and development of the Huang Chao uprising was also related to the poor feedback of officials of the weaker Tang Dynasty to cope with the hunger caused by the drought and the uprising. Although the Huang Chao Riot was because of hunger 2 and, therefore, climate change has been regarded as a critical factor in the collapse of the Tang Dynasty (Bret H, 2003), it should be noticed that the drought causing the Huang Chao uprising was a short-term drought on annual scale in a steady climate background. It is different from the long drought period that lasted for more than a century, claimed by Yancheva et al. (2007a, 2007b) and Zhang (2008). In fact, the extreme drought and flood period in the Tang Dynasty happened during AD 751–800, and the 9th century was not the main drought period of the Tang Dynasty (Su and Zheng, 2012; Zheng et al., 2014a).
It has widely been acknowledged among historians that the Rebellion of An Lushan and Shi Siming (AD 755–762) and the following domestic wars and social turmoil were the main reasons for the downfall and collapse of the Tang Dynasty (Jian et al., 2009; Lv, 2005). Comparing with the climate change, the early and middle Tang Dynasty (AD 618–810) were in the Warm Period of Sui and Tang (AD 540–810), when the climate was mild and the average grade value of the grain harvest was as high as 3.58, but the downfall of Tang’s power after the Rebellion of An Lushan and Shi Siming (AD 755–762) corresponded to a change in the climate from warm to cold and a decrease in agricultural production. The late Tang Dynasty (AD 811–907) was in the Cold Period of the late Tang and the Five Dynasties (AD 811–930), when the climate became colder and agricultural production began to decrease. The average grade value of grain harvest in the late Tang Dynasty was 2.7, which was one grade lower than that in the early and middle Tang, and might be insufficient to feed the population. From AD 881 to 900, the average temperature during the winter was 0.87°C lower than today’s average winter temperature (Ge et al., 2010). These 20 years before the collapse of the Tang Dynasty were the coldest years and the most deficient years of agricultural production with an average grade value of merely 2.5 in the history of the Tang dynasty. Thus, changes in temperature and agricultural production may be one of the most important factors leading to the weakening of dynastic strength.
Other impacts on dynastic transitions and prosperity
There are two manifestations of climate change impacts: changing mean climate status and extreme climate events. This paper had only discussed mean climate status about temperature and precipitation; the impacts of extreme climate events on dynastic transitions need further analysis. Meanwhile, the complexity of the socio-ecological relationships that might link climate changes and socioeconomic and political changes were overlooked and the discrimination between any kind of environmental and anthropogenic impacts was also a lack. Moreover, societal responses to such external forces tend to be non-linear in nature. Other factors that might influence the dynastic transitions and prosperity, so much as a suite of social, economic, political, demographic, and environmental factors, also have important impacts on dynastic transitions and prosperity, although those aspects were not discussed in this paper.
Conclusion
The development of a dynasty culminates in prosperity and withers in dynastic transition. Studying the impact that ancient climate change in China had on dynastic flourishing and transitions from a food security perspective is helpful for an objective evaluation of the correlation between climate and grain harvest fluctuations and the dynastic transitions and prosperity. It could also provide a reference for a better understanding of climate change in the future. This study defined the periods of dynastic transitions and prosperity from 210 BC to AD 1910 and analyzed the relationships among dynastic prosperity, climate change, and agricultural harvests. The major findings can be summarized as follows:
Dynastic transitions tended to occur in cold or warm-to-cold periods, dry or wet-to-dry periods, and crop failure periods. And dynastic prosperity tended to appear in warm periods or cold-to-warm periods, wet or dry-to-wet periods, and crop abundance periods.
The transitions from chaos to unity tended to occur at the end of centuries-long cold periods and at the beginning of warm periods. The continuing warmer climate and increasing grain yield provided the material foundation to end the chaos. The transitions from unity to chaos were likely to occur at the end of the centuries-long warm periods and the start of cold periods, with decreasing food production.
Centurial climate change between warmness and coldness and the fluctuation of agricultural production corresponded to the transitions between unity and chaos. The corresponding relationship between dynastic transitions and climate change, to some extent, indicates that social turmoil tended to happen in the warm-to-cold climate fluctuation periods or the centurial warm-to-cold periods.
The collapse of the Tang Dynasty was haunted by colder weather and declining grain harvests, which signified that climate change and fluctuation of crop production were highly critical to national power.
Footnotes
Funding
This work was supported by National Natural Science Foundation of China (Grant No. 41371201), Strategic Project of Science and Technology of the Chinese Academy of Sciences (Grant No. XDA05080102), and the Major State Basic Research Development Program of China (973 Program) (Grant No. 2010CB950103).