



Abstract
Recent research has demonstrated that a series of mountains from the eastern Iranian Plateau to eastern Kazakhstan and to western China played a significant role in trans-Eurasian exchange during the third and second millennia BC. In close association with these mountain corridors, a number of southwestern Asian cereals, notably free threshing wheat and barley, moved eastward, and broomcorn millet, among other plant foods originating in China, moved westward. In this paper, we apply Bayesian stable isotope mixing models to published and newly obtained isotopic data in order to quantitatively estimate the contribution of different food resources to human diets, and we consider the complexity of human food strategies at both ends of these mountain corridors: southern Kazakhstan and the Hexi Corridor in western China. Our results contrast the rapid adoption of wheat and/or barley in the Hexi Corridor with the gradual, incremental adoption of millet in southern Kazakhstan during the second millennium BC.
Introduction
In recent years, our knowledge and understanding of the nature of the connections among groups of people in the Bronze Age Eurasia has grown. Various studies consider not only the expansion of food technologies but also the spread of the ways that food was consumed in prehistory. That is, why human diets in some areas were subject to radical changes, while in other areas, people appear to have been conservative in their dietary habits (Boivin et al., 2012; Lightfoot et al., 2013; Liu and Jones, 2014; Liu et al., 2014). In the context of this discussion, the eastern sector of Central Asia is of particular interest. Research has demonstrated that a series of foothill sites from the eastern Iranian Plateau to eastern Kazakhstan form an ‘Inner Asian Mountain Corridor’ which played a significant role in trans-Eurasian exchange during the third and second millennia BC (Frachetti, 2012; Frachetti et al., 2010; Motuzaite Matuzeviciute et al., 2015b; Spengler, 2015; Spengler and Willcox, 2013; Spengler et al., 2014a, 2014b). Other scholars have extended this mountain corridor concept to consider broadly the foothills of the Tianshan Mountains, as well as the northern edges of the Tibetan Plateau, namely, the Hexi corridor, and the western loess plateau in China (Chen et al., 2014; Flad et al., 2010; Liu et al., 2014, in press; Zhang et al., 2015).
There is now much evidence that a series of connections between human populations were established through these mountain corridors since the Bronze Age. From the evidence of early horse management, metallurgy, and a range of associated artifacts, we can trace the origins of these connections to the latter part of the second millennium BC (Frachetti, 2008; Levine, 1999; Lin, 2015; Linduff and Mei, 2009; Mei, 2003; Rawson, 2013; Sherratt, 2005). Archaeobotanical evidence from cereal crops may be able to push the date of these connections back even further into at least the third millennium BC or earlier. This process has been referred as ‘food globalisation in prehistory’ (e.g. Jones et al., 2011, in press). In close association with these mountain corridors, a number of southwestern Asian cereals, notably free threshing wheat and barley, moved eastward, and broomcorn millet, among other plant foods originating in China, moved westward (see Barton and An, 2014; Liu et al., 2016; Motuzaite Matuzeviciute et al., 2013; Spengler et al., 2014b, for reviews). Both Chinese and southwest Asian cereals were documented in the late third millennium BC in Begash in east Kazakhstan (directly dated, 2461–2154 cal. BC), while a number of sites from west China provide similar evidence dated to the late third and early second millennia BC (2100–1800 cal. BC) (Frachetti et al., 2010; Liu et al., 2016).
While the archaeobotanical evidence provides locations, dates, and site contexts, it stops short of elucidating the significance of the trans-located crops in contemporary human food chains. However, stable carbon and nitrogen isotopic evidence allows us to quantify the dietary proportions of foodstuffs with different isotopic ratios. It so happens that two of the crops moving westward from China (broomcorn and foxtail millet) are C4 plants that leave an isotopic signature throughout the food chain which is distinctive from that left by southwest Asian crops moving eastward (which are all C3 plants). A number of recent isotope studies follow the movements in both directions by investigating possible human diets. These studies have demonstrated that the westward expansion of Chinese millets and the eastward movement of the Fertile Crescent cereals follow different isotopically detectable patterns (Lightfoot et al., 2014; Motuzaite Matuzeviciute et al., 2015a). Other studies have addressed questions such as why a new type of cereal could be adopted in a region with an already existing indigenous cereal cultivation tradition; and why a new type of cereal was welcomed in one region but rejected initially in another (Lightfoot et al., 2013; Liu et al., 2014). In this paper, we apply Bayesian stable isotope mixing models to previously published and newly obtained isotopic data in order to quantitatively estimate the contribution of different food resources to human diets. In the light of recent isotope studies, we consider the driving force(s) behind the expansions of these cereal crops, and we consider the complexity of human food strategies at both ends of the mountain corridors: southern Kazakhstan and the Hexi Corridor in northwest China.
Expansions of the Fertile Crescent crops and the Chinese millets
By c. 1500 BC, the geographical range of two of the southwest Asian crops, free threshing wheat and barley, and of one of the north China’s domesticates, broomcorn millet, extended from the Pacific to the Atlantic Ocean. The chronology, pathways, and driving forces of these expansions have been subjected to scholarly investigations (e.g. Jones et al., 2011).
The pattern of the eastern movement of wheat and barley from southwest Asia has recently become clear. Evidence for the cultivation and domestication of various wheat and barley species appears in southwest Asia from at least 10,000 years ago (e.g. Weiss and Zohary, 2011). They are recorded in western Central Asia by around 6000–5000 years ago (Harris, 2010; Miller, 2003) and in Pakistan by around 7000 years ago (Costantini, 1984; Meadow, 1996; Petrie, 2015). After these initial spreads, the subsequent, more extensive movement of wheat and barley appears to be restricted to the free threshing forms. Research in eastern Central Asia and western China shows that the mountain corridors played an important role in the expansion of free threshing wheat during the third millennium BC (see Liu et al., 2016, for a review).
Beyond Central Asia, we can distinguish two separate expansion sequences of free threshing wheat to the north and south of the Tibetan Plateau in the third and second millennia BC (Liu et al., 2016). In the north, the sequence runs from the eastern range of the Inner Asian Mountain Corridor through the Tianshan Mountains and the Hexi corridor. It then extends to the middle and lower reaches of the Yellow River. In the south, a second sequence may be inferred from the Indus and northwest India through South India and the Ganges region. The source of free threshing wheat in Tibet could be from either the northern or the southern corridor. The pathway by which barley spread east is less constrained. It is likely that the spread of barley was associated with the movement of free threshing wheat but perhaps barley spread at different rates along the northern and southern routes.
The earliest sites with broomcorn and foxtail millet in northern China before 5000 BC are patchily distributed along foothills at the margins of the loess plateau (e.g. Liu et al., 2009, 2015; Yang et al., 2012). The subsequent two millennia (5000–3000 BC) see a high concentration of millet sites on the loess plateau, particularly along the valleys of the Wei River and its tributaries (Wagner et al., 2012). Broomcorn millet expanded westward to east Kazakhstan (Frachetti et al., 2010) in the late third millennium BC. It remains unclear, however, how broomcorn millet got to Europe from Central Asia. Foxtail millet, however, expanded to southwest and southeast China during the third millennium BC. Evidence of foxtail millet is documented in Taiwan, Thailand, and India in the second millennium BC (Castillo, 2011; Webber, 1991, 2001). An enigmatic feature of the records for broomcorn millet is its earliest apparent occurrence on both sides of the Old World at the same time. During the sixth and fifth millennia BC, some 20 sites from Europe and the Caucasus report broomcorn millet identified to species level (Hunt et al., 2008). However, attempts to directly date some of these fifth or sixth millennium BC millets have shown that they date to the Late Bronze Age and later periods; therefore, the date at which Asian millets reached Europe remains a matter for enquiry and ratification (Motuzaite Matuzeviciute et al., 2013).
Dietary shifts in Kazakhstan and China
Recent works have revealed dietary patterns for the broader eastern Central Asia and western China during the Bronze and Iron Ages (Guan et al., 2007; Lightfoot et al., 2013, 2014; Liu et al., 2014; Ma et al., 2013a, 2013b; Motuzaite Matuzeviciute et al., 2015a; Murphy et al., 2013; Shishlina et al., 2012; Svyatko et al., 2013; Ventresca Miller et al., 2014; Zhang and Zhu, 2011; Zhang et al., 2010; Zhou and Garvie-Lok, 2015). Of particular interest to this paper, dietary changes are documented on both sides of the mountain corridors around 4000 years ago in southern Kazakhstan and in the Hexi Corridor of western China (Lightfoot et al., 2014; Liu et al., 2014; Motuzaite Matuzeviciute et al., 2015a). In seven cemetery sites studied by Liu et al. (2014), carbon isotope data cluster individual skeletons into two distinct groups. The individuals in one group correspond to a diet dominated by C4 foods (possibly millet), while those in the other group correspond to a mixed diet containing C3 and C4 resources, most likely wheat and/or barley and millet and possibly animals fed on these crops. The first of these groups comprises all of the individuals from two sites dating to before c. 1900 BC. The second group comprises virtually all of the individuals from five sites dating to after 1900 BC. It would appear that all of the individuals sampled at each site shared a common dietary pattern. There are no evident ‘trail-blazers’ in the novel post-1900 BC pattern. Liu et al. (2014) inferred that this considerable agrarian shift was a ‘bottom-up’ change, rather than an elite-led process. The ‘tidal wave’ of western crops after 1900 BC clearly corresponded to an agricultural revolution in the Hexi corridor. It should be noted that these burials from the Hexi Corridor were from seemingly public cemeteries, presumably representing a cross section of society. This is different from the kurgans in Central Asia which may represent elite burials.
A similar dietary shift has been observed at the other end of the mountain corridors, that is, the southern part of Kazakhstan. Work performed by Motuzaite Matuzeviciute et al. (2015a) showed that C4 plants became established food sources in southern Kazakhstan from the Middle–Late Bronze Age onward (c. 1800 BC) and were likely eaten directly by humans, while there is no such evidence in northern Kazakhstan. Given the archaeobotanical evidence from eastern Central Asia, it is reasonable to attribute the C4 signal to the consumption of millet(s). Such evidence constitutes the earliest-to-date directly dated isotopic signals of millet consumption outside of China (Motuzaite Matuzeviciute et al., 2015a). The isotopic data from southern Kazakhstan indicate that while millet(s) was a significant dietary component for a number of individuals, and it is possible that they were not staple foods in the Bronze Age as they were in the Iron Age.
Carbon and nitrogen isotope values measured in bone collagen are primarily derived from dietary protein (Ambrose and Norr, 1993; Hare et al., 1991; Jim et al., 2006). When human consumption of animal protein is relatively high, collagen isotopic values likely fail to capture isotopic signatures from relatively low-protein, carbohydrate-rich cereal crops, such as millet, wheat and barley. However, in the context of naturally isotopically labeled food resources – for example, C4-based carbohydrate source (millet) and C3-based protein source (meat fed on C3 plants) – consideration of the diversity of food inputs (both plant and animal) of a given community becomes plausible. In the following section, we apply the Bayesian stable isotope mixing model Stable Isotope Analysis in R (SIAR-R package ‘simmr’ version 0.2) to published and newly obtained δ13C and δ15N data from human and animal bone collagen and carbonized plant remains in order to quantify the contribution of different food protein resources to human diets at six Bronze Age and Iron Age sites in southern Kazakhstan and the Hexi Corridor in China.
Materials and methods
We sourced carbon and nitrogen isotope data for humans, animals, and plants from the literature. All data from Kazakhstan are previously published (Motuzaite Matuzeviciute et al., 2015a). Isotopic results from human specimens from China have also been published by Liu et al. (2014). Results of isotope analyses for Chinese animal and plant remains are published here for the first time. These samples are from three sites in Gansu province in west China: Xihetan, Huoshaogou, and Sanbadongzi. Procedures for sampling and analysis follow those described in Liu et al. (2014). Site information and isotope results are summarized in Tables 1 and 2. Site locations are shown in Figure 1.
Site information derived from Liu et al. (2014) and Motuzaite Matuzeviciute et al. (2015a).
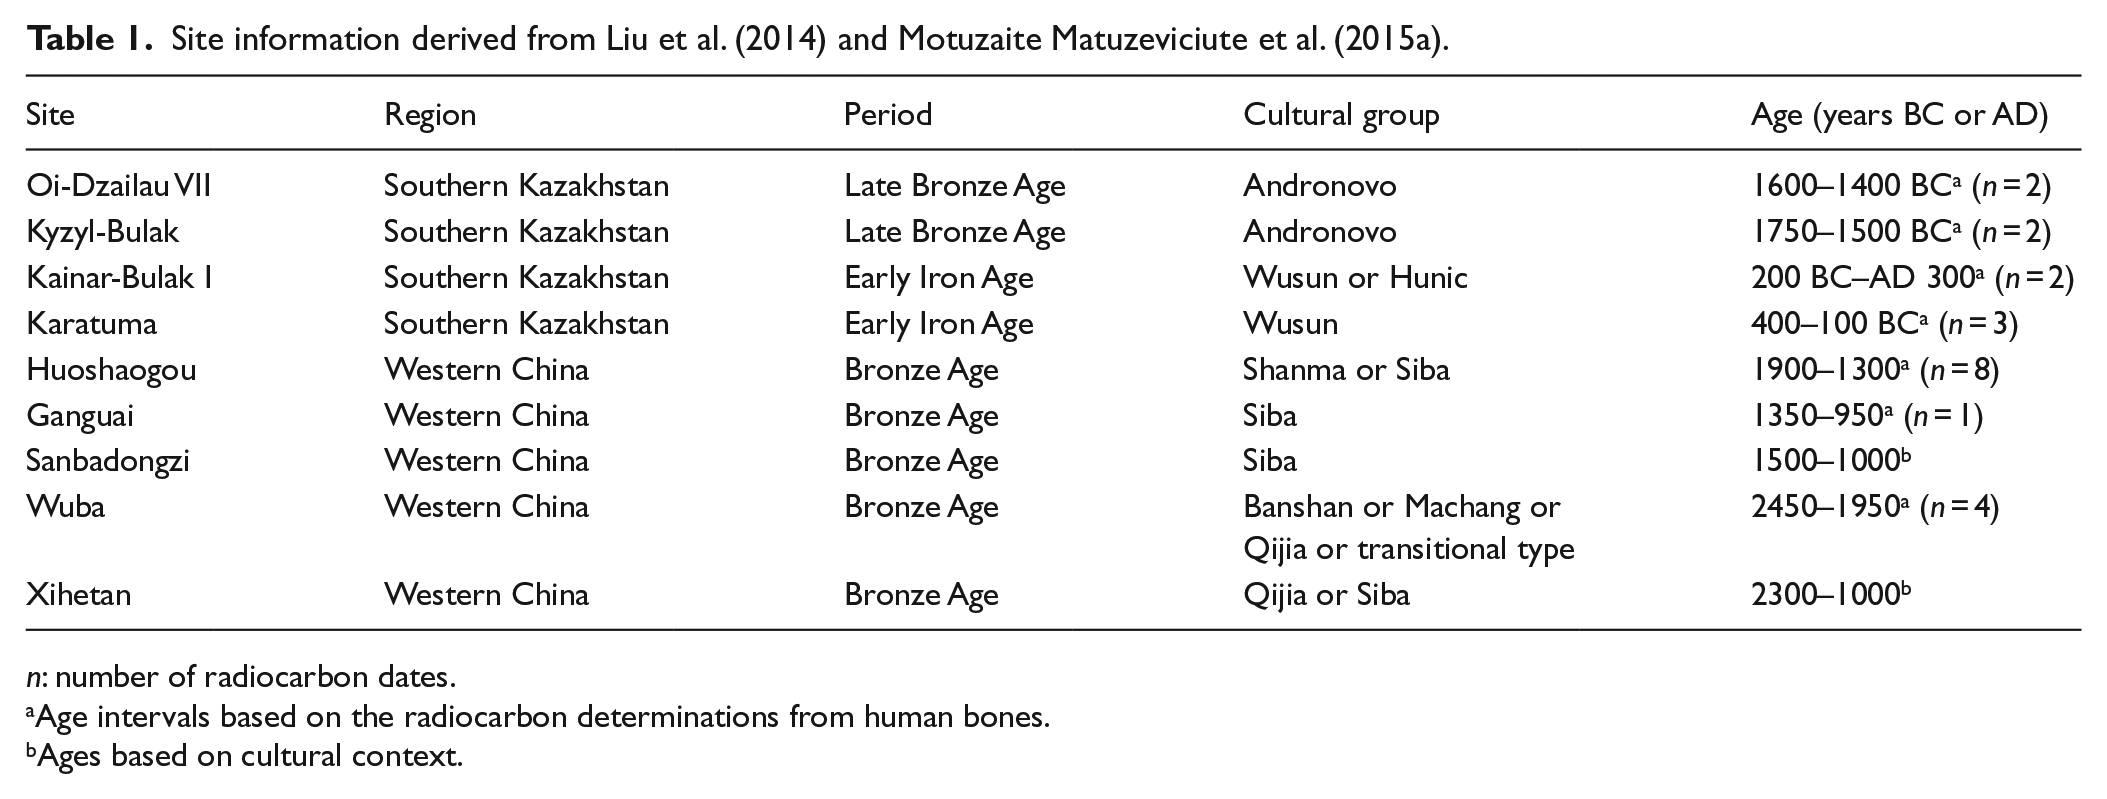
n: number of radiocarbon dates.
Age intervals based on the radiocarbon determinations from human bones.
Ages based on cultural context.
Isotope and diet composition data used in modeling.
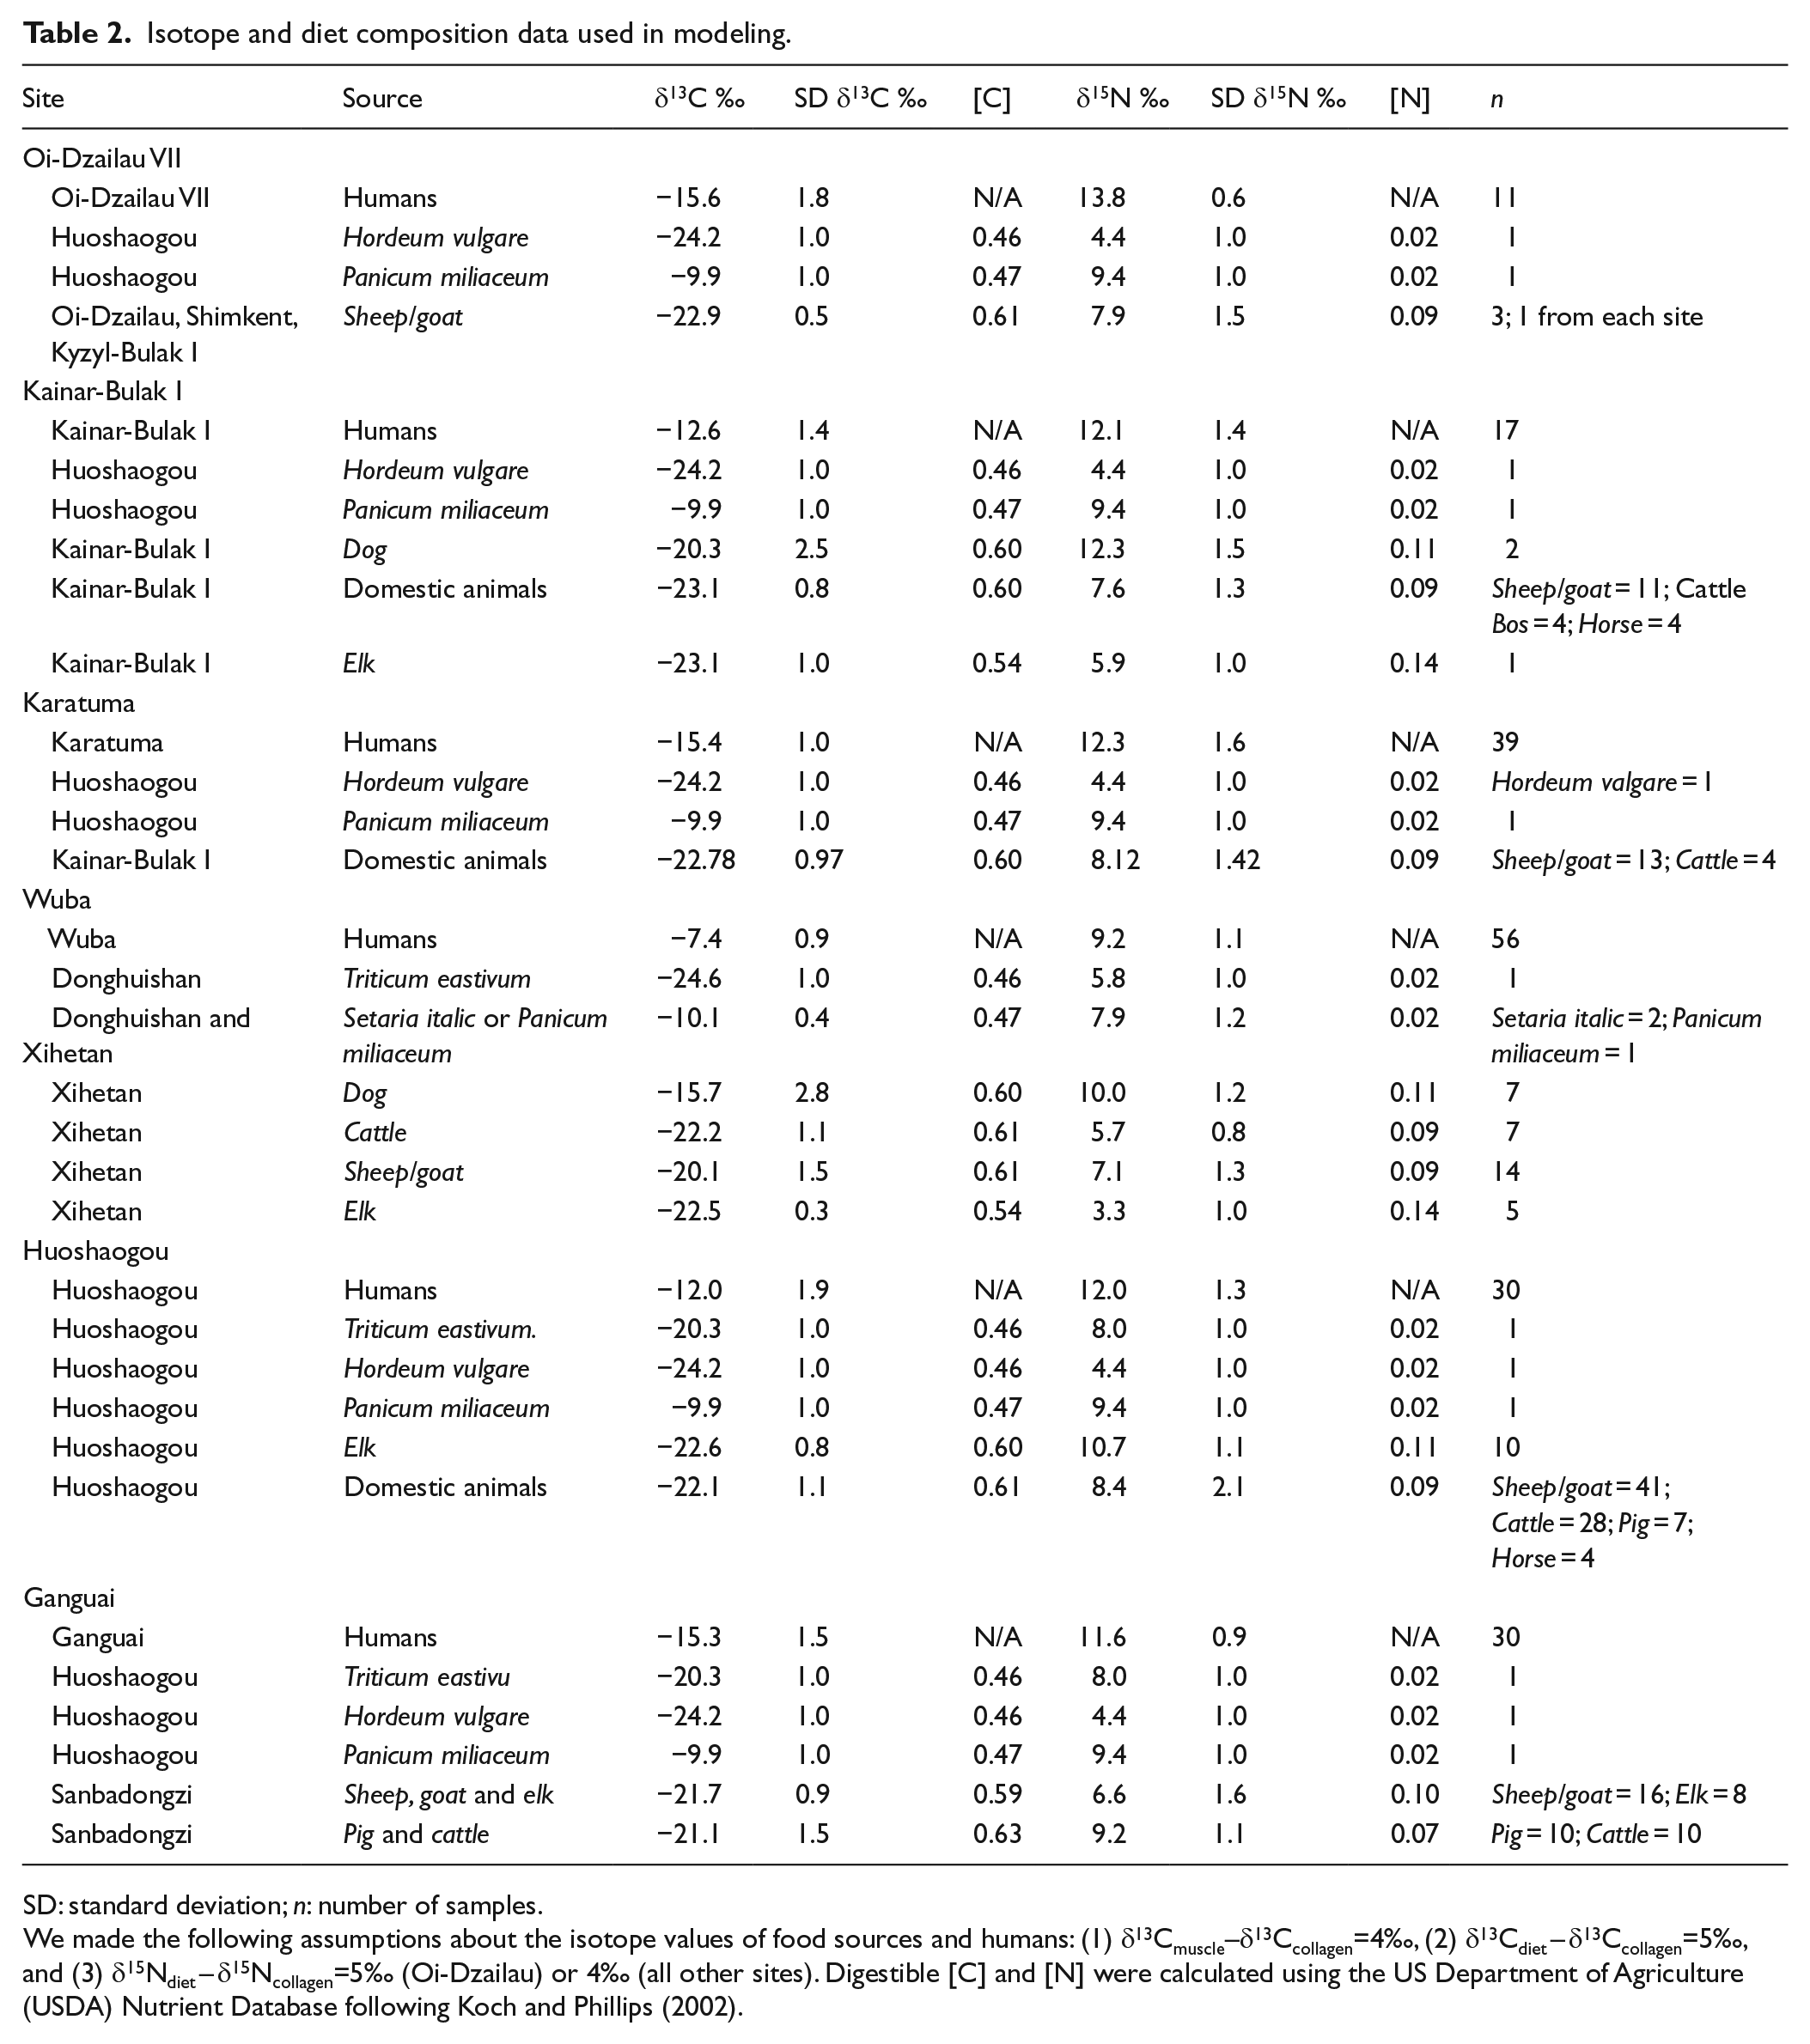
SD: standard deviation; n: number of samples.
We made the following assumptions about the isotope values of food sources and humans: (1) δ13Cmuscle–δ13Ccollagen=4‰, (2) δ13Cdiet – δ13Ccollagen=5‰, and (3) δ15Ndiet – δ15Ncollagen=5‰ (Oi-Dzailau) or 4‰ (all other sites). Digestible [C] and [N] were calculated using the US Department of Agriculture (USDA) Nutrient Database following Koch and Phillips (2002).
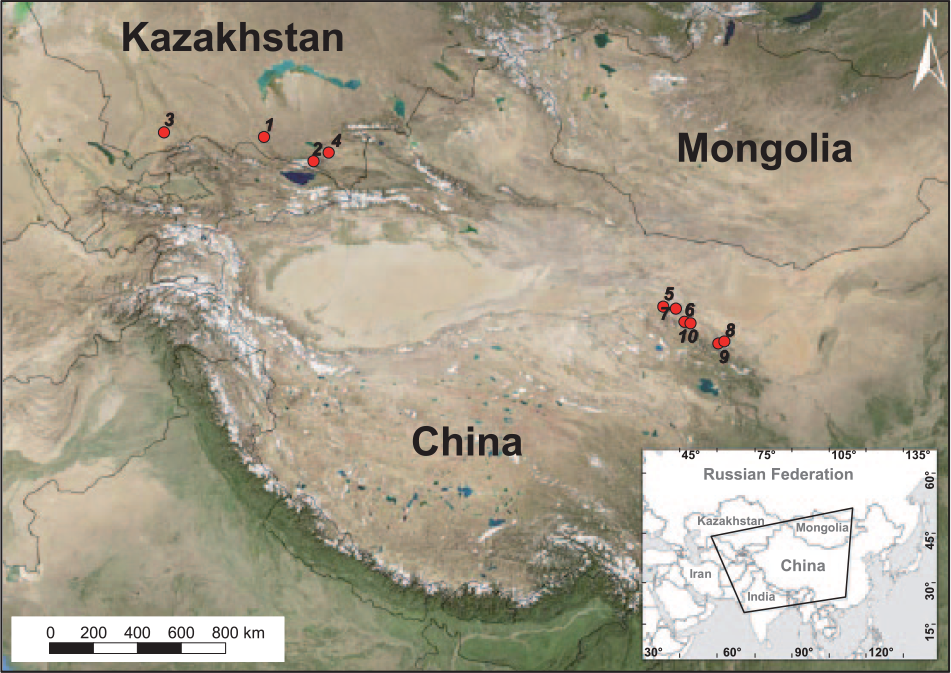
Maps showing location and topography of the study region and the sites from Kazakhstan and China discussed in this paper (see Table 1 for detailed information).
To quantify the proportional contributions of various plant and animal food sources assimilated dietary protein of archaeological humans, we used SIAR-R package (‘simmr’ version 0.2; Parnell et al., 2010). We followed the best practices for stable isotope mixing models as delineated by Phillips and et al. (2014). SIAR is a Bayesian stable isotope mixing model that is capable of accounting for error in estimates of discrimination factors (i.e. the difference in isotopic composition between an individual’s tissue and diet: Δ13Cdiet-collagen and Δ15Ndiet-collagen), variation in source isotopic values, and different food source elemental concentrations of C and N.
When diets include both plant and animal resources, which have very different C and N concentrations, failure to employ a concentration-weighted model can significantly affect the results (Phillips and Koch, 2002). We calculated digestible [C] and [N] of human foods from the US Department of Agriculture (USDA) Nutrient Database following the calculations presented in Koch and Phillips (2002). To avoid a severely underdetermined model, we grouped logically related resources (e.g. domestic animals) a priori when their average isotope values were similar; for example, at Kainar-Bulak I, we combined sheep and/or goat (n = 11; δ13C: −23.2 ± 0.6‰, δ15N: 7.7 ± 1.2‰), cattle (n = 4; δ13C: −22.7 ± 0.8‰, δ15N: 8.1 ± 0.8‰), and horse (n = 4; δ13C: −23.4 ± 1.2‰, δ15N: 6.7 ± 1.8‰) into one domestic animal food source (δ13C: −23.1 ± 0.8‰, δ15N: 7.6 ± 1.3‰). The isotopic values of the food sources considered at each site were determined from animal and plant remains found in the same or adjacent contemporaneous sites wherever possible. To account for systematic diet-to-collagen isotopic difference, we used a Δ13Cdiet-collagen value of 5 ± 1‰ and a Δ15Ndiet-collagen of 4–5 ± 1‰. These values are within the average range used in previous paleodiet studies (Ambrose and Norr, 1993; Hedges and Reynard, 2007; Lee-Thorp et al., 1989; Newsome et al., 2004; Schoeninger, 1985). Discrimination factors are also influenced by the isotopic compositions of dietary macronutrients (Froehle et al., 2010; Jim et al., 2006). Given the variation in C3 and C4 resource use across our study area, variable discrimination factors may ultimately be warranted, but we chose to use static values for the sake of simplicity; in the absence of experimental estimates for the localities in our study, this is also the most parsimonious choice. Finally, we did not explicitly consider the isotopic routing of dietary protein to bone collagen in the models. Instead, we assume that bone collagen δ13C and δ15N values are derived from dietary protein. Our mixing model results, therefore, are quantitative estimates of the proportional contribution of various plant and animal resources to human dietary protein. Because dietary routing may vary with the protein content of the diet (e.g. Martínez del Rio et al., 2009; Newsome et al., 2011; Schwarcz, 2002), it will be important to consider this issue in further investigations.
It is important to note that we have analyzed representative samples of all potential food sources found during excavation; however, we cannot rule out the possibility that other food sources were consumed but were not present in the archaeological record. As δ13C and δ15N values are not currently available from archaeological plant material in Kazakhstan, so for those sites, we used values from western China; this decision involves significant assumptions, which we address in the ‘Results’ section.
Results
Figure 2 and Table 3 summarize the results of the mixing models performed on six sites in southern Kazakhstan and western China. Model performance varied from site to site. In western China, the model shows the most certainty in Wuba, with all six possible dietary sources exhibiting constrained uncertainties (see Figure 2, the boxplots show Bayesian 95% credible intervals). Wheat and barley were less well constrained for Huoshaogou, in part because they were negatively correlated (−0.62), meaning that the model could not easily discern between the sources; model solutions that favored wheat excluded barley and vice versa. This was also true for wheat at Ganguai, which was negatively correlated with all of the other sources but particularly strongly with pig or cattle (−0.85) and millet (−0.76). The best-constrained results from Kazakhstan were for Karatuma (see Figure 2). Nonetheless, domestic animals from Karatuma were negatively correlated with several other sources at Kainar-Bulak I (−0.55 with Cervus, −0.52 with dog, and −0.43 with the Fertile Crescent cereals), making it difficult for the model to distinguish the difference among them in dietary contributions. The Fertile Crescent crops and sheep/goat were strongly negatively correlated (−0.87) at Oi-Dzailau and Karatuma (domestic animals and C3 crops: −0.98), although millet was very well constrained at that site.
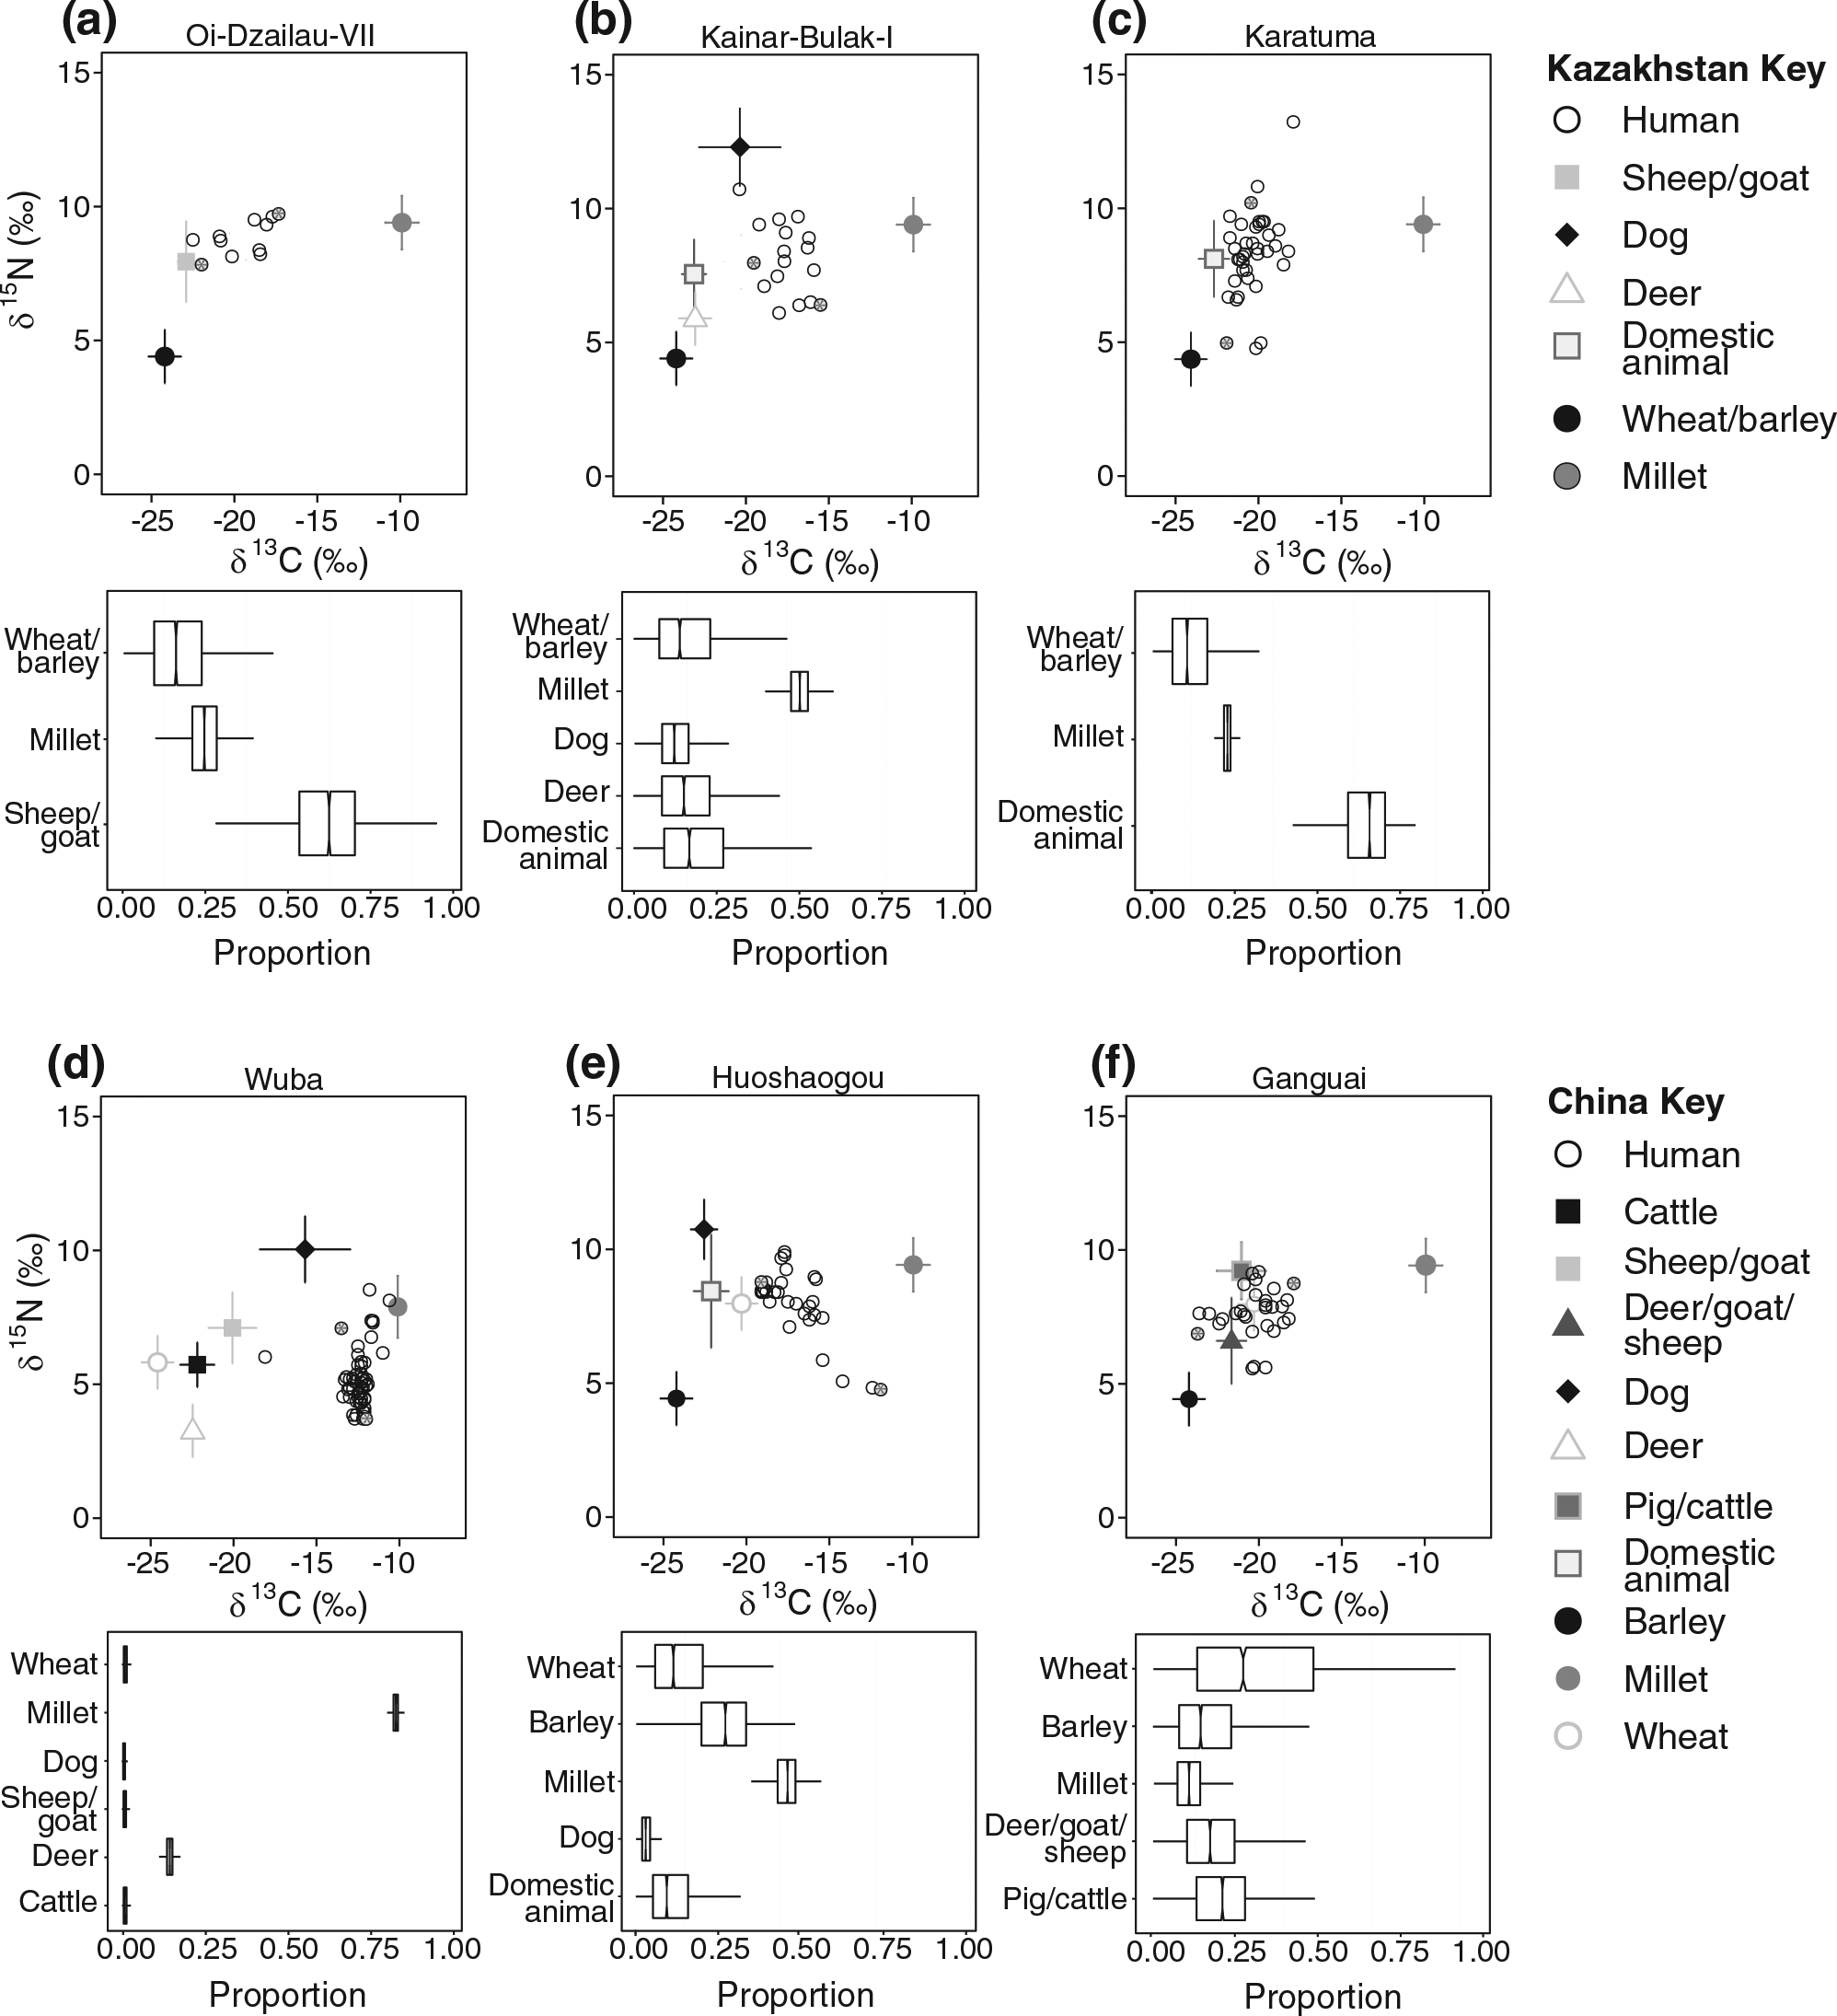
Summary of stable isotope data input into the mixing models and the mixing model results for sites in Kazakhstan (upper panel, a–c) and China (lower panel, d–f). Within each panel, sites are ordered from oldest (left) to youngest (right). The results are labeled as where human bones are recovered. Diet composition data are drawn from the nearest possible locations (see Tables 1 and 2 for details).
Estimated proportional dietary contributions of various animal and plant food resources to archaeological humans with Bayesian credible intervals.

SD: standard deviation.
In terms of the proportion (Bayesian 95% credible intervals), C4 protein (likely millet) in human diets became significant in the Bronze and Iron Ages in southern Kazakhstan. At a population level, millet(s) comprises approximately 10–35% of dietary protein at Oi-Dzailau VII (1600–1400 BC), about 20–25% in Karatuma (400–200 BC), and 35–50% at Kainar-Bulak I (200 BC–AD 300). In China, the millet contribution to dietary protein falls during the Bronze Age from approximately 80–85% at Wuba (2450–1950 BC) to 35–55% at Huoshaogou (1900–1300 BC) to just 2–20% at Ganguai (1350–950 BC). In addition to the uncertainties outlined above, these estimated proportions also reflect the individual differences within a community. For example, at Oi-Dzailau VII, two individuals that are mostly enriched and depleted in 13C were selected for further analyses (see Table S1 for individual proportional dietary contributions, available online; individuals selected for analyses are indicated in Figure 2). In individual X (δ13C: 8.8‰, δ15N: 22.5‰), millet contributed to approximately 0–10% of dietary protein, and in individual Y (δ13C: 8.8‰, δ15N: 22.5‰), the figure is about 30–50%.
The people of southern Kazakhstan and western China also diverge in their reliance on animal versus plant protein. In southern Kazakhstan, animal protein makes up the largest proportion of the protein component of human diets in the second millennium BC, comprising between approximately 35% and 80% at Oi-Dzailau VII. This resource probably remained important in the first millennium BC at Karatuma (~60–70%) and at Kainar-Bulak I. When all animal resources are considered together, animal protein is as important as millet in Kainar-Bulak I (approximately 40% of the dietary protein input). In contrast, millet is the principal food resource for the inhabitants of Wuba, comprising >80% of human diets there. In later periods, wheat and/or barley gain significance – at Huoshaogou (averaging at about 15% and 25%, respectively), and at Ganguai, wheat becomes the most important food resource (>30% on average) followed most closely by pig and cattle group (about 20% on average). In all three cases, cereals contribute the most protein to human diets in China.
One problem with the Karatuma model is that the human data do not plot within the mixing space created by the possible food sources. This suggests that an important food resource was not available for isotopic analysis (e.g. freshwater fish and/or wild plants; Ventresca Miller et al., 2014) and/or the discrimination factors used were incorrect. Nonetheless, the result that terrestrial animal protein comprised the primary dietary protein intake for individuals from this site is consistent with the previous work (Ventresca Miller et al., 2014).
Two issues are worth consideration. The sample size of the plant data is very small, so variations within the same crop are not fully captured. Our results, therefore, offer quantitative predictions as to the importance of these food sources to human diets that we hope will be tested as more data become available. More importantly, these results are dependent on isotope values for millet and barley from China. This is because, to the best of our knowledge, there are hitherto no published isotope data for either modern or archaeological millet and barley from Kazakhstan. Plant δ15N values are related to multiple factors, such as the availability of nutrients and water, and can, therefore, vary significantly geographically, so values from China may be poor approximations for Kazakhstan. For example, possible explanations for the high δ15N values of the Chinese millets could be manuring or aridity. Another study looking at stable isotope values in archaeological plant remains of Bronze Age samples from the Eurasian Caspian Steppe, to the east of Kazakhstan, found average δ13C values for C3 and C4 plants of −26‰ and −12‰, respectively (Shishlina et al., 2012). δ15N values of Lithospermum officinale seeds ranged from 9.6‰ to 13.0‰ and amaranth seeds had a value of 6.4‰. To investigate how the mixing model results might change if millet values from Kazakhstan have much lower δ15N values than those found in China, we ran the models for Oi-Dzailau, Karatuma, and Kainar-Bulak with an arbitrary value of 3‰ instead of 9.4‰. At Oi-Dzailau, this lower nitrogen isotope value model predicts that millet still contributes a mean value of 19% compared with 24% in the original model, but the confidence intervals are larger (8–30%). For Karatuma, there is no change in the results; millet still makes up 19–25% of the diet. And finally, at Kainar-Bulak, millet contribution also stays approximately the same (decreases slightly in importance from a mean value of 44% to 42%). These results suggest that the carbon isotope value is the primary driver, which makes sense, given that this is a concentration-weighted model and digestible [N] from plants is much smaller than from animal food sources. Regardless, the pattern of increasing reliance on millet over time holds.
Discussion
Rapid adoption of wheat and/or barley and delayed millet consumption
The results of the mixing models confirm the dietary shifts previously documented in both regions (Liu et al., 2014; Motuzaite Matuzeviciute et al., 2015a). A few aspects are worth further consideration. There was a considerable delay between the earliest evidence for millet grains and the adoption of millet as a substantial food resource in southeast Kazakhstan. The earliest archaeobotanical evidence of millet (from Begash) precedes the first carbon isotopic evidence of substantial millet consumption (from Oi-Dzailau VII) by a few centuries. It is worthy of note, however, that all of the isotopic evidence to date post-dates the archaeobotanical evidence from Begash. Stable isotope analysis is relatively insensitive to minor dietary components; thus, the isotopic indication of millet consumption at Oi-Dzailau suggests that some individuals consumed significant quantities of millet and others did not. Our model estimates that on average, millet contributes approximately 10–35% of the dietary protein. Nonetheless, this eating habit varies according to individuals; in Oi-Dzailau, some consumed millet as 30–50% dietary protein source, and others consumed almost none.
This pattern is in contrast to that observed in western China, where the earliest archaeobotanical evidence for the presence of C3 cereals (primarily wheat and/or barley) in Gansu is archaeologically approximately contemporaneous with isotopic evidence for the large-scale consumption of C3 plant resources in the early second millennium BC. Our data show that wheat and/or barley contribute about 40% (mean value) of the dietary protein in Huoshaogou and Ganguai, indicating that Fertile Crescent crops were consumed in significant quantities concurrent with or soon after their first appearance in this region. Although the proportion varies, all individuals from Huoshaogou and Ganguai had consumed C3 grains directly. This would support the argument that the Fertile Crescent crops were moved and/or adopted in order to provide a new staple foodstuff to the people.
The delay of isotopically detectable millet consumption in Kazakhstan, however, suggests its initial introduction as a minor component of human diets. One interpretation is that millet was not first introduced to Central Asia as a staple food, but for other reasons, perhaps ritual use or as an indictor of wealth or status. Indeed, some of the earliest evidence of millet was from a burial context rather than from a settlement, indicating that it may well have had a special significance beyond subsistence. Frachetti (2015), for example, argued that the crop remains from Begash were the ‘seeds for the soul’. It could be the case that some foodstuffs would be specifically associated with special ritual events, such as the key life history rites de passage. Nonetheless, these events typically emphasize timelessness and ancestry and do not offer an immediate conceptual link with either novel or normal cereal grains. It is also entirely possible that millet was exploited as a risk reduction strategy or in the context of a seasonal mobility model. Thus, there are a variety of reasons why an introduced crop may remain a minor component of the diet, and we currently lack the full range of contextual evidence necessary to infer the most plausible reason in this case.
Our data also reveal different strategies of consumption of dietary animal protein. Contemporary people in Kazakhstan and western China diverge in their reliance on animal versus plant protein. Animal protein derived from domestic animals or game consistently made a substantial contribution to human diets in Kazakhstan. In western China, however, while meat consumption increased relatively in the period after 1900 BC, various crops (either C3 or C4) were consistently the most important food resource for the population in this region. The dietary shift documented in Gansu was probably connected with the direct consumption of wheat and/or barley.
Our data allow us to contrast the dietary situations at each end of the ‘Mountain Corridors’, that is, the Hexi Corridor and southern Kazakhstan. In between the two regions lies Xinjiang (Xinjiang Uyghur Autonomous Region). Human isotopic values from several sites in this region have been published (Zhang and Li, 2006; Zhang and Zhu, 2011; Zhang et al., 2009, 2010). The current evidence suggests that the dietary choices in Xinjiang vary from community to community during the second millennium BC. It is seemingly the millet consumers lived side by side with communities consumed more meat and C3 foodstuff and less millet. However, published isotopic values derived from animal remains are limited at the moment. Future isotopic research to combine human and animal data may be anticipated.
Agencies of translocations of wheat and/or barley and millet
The gradual adoption of millet in southern Kazakhstan serves to highlight the rapidity of the adoption of wheat and barley in west China. During the second millennium BC, wheat and barley were both growing in the fields and being widely consumed in significant quantities in Gansu, constituting a revolution in eating habits. By contrast, the first appearance of millet currently predates the isotopic evidence of consumption on a significant scale in Kazakhstan.
Liu et al. (2014) argued that the rapid adoption of wheat and/or barley in Gansu could be understood in the context of social and ecological challenges in relation to the expansion of human settlement to arid northwest China. In Gansu, the global drought event of the time was complicated by a widespread weakening of the summer monsoon between 2500 and 2000 BC (An et al., 2005a, 2005b). A plausible explanation of the rapid dietary change in this region is that the early colonizers faced a series of ecological and social challenges: the threat of challenging environments, the threat of famine, and population pressure in spatially limited arable lands. In the face of such challenges, conservative food choices may simply not have been sustainable. In addition, the data lend support to the argument that wheat and/or barley were initially introduced to northwest China as a new staple food to serve the needs of the poor majority, rather than to the rich minority.
By contrast, dietary conservatism may be more in evidence elsewhere. In Kazakhstan, although the archaeobotanical evidence indicates that millet was present from the late third millennium BC, the current isotopic evidence suggests that millet was not consumed on a significant scale until almost a few hundred years later. In the later case, the newly developed millet-eating habit varies according to individuals. The individual variation and the time lag between the initial introduction of millet and its subsequent consumption on a significant scale could be explained by the initial use being connected with a minority, for example, elites, ritual specialists, or seasonal mobile groups.
Conclusion
In this paper, we apply Bayesian stable isotope mixing models to published and newly obtained isotopic data in order to quantitatively estimate the contribution of different food resources to human diets, and we consider the complexity of human food strategies at both ends of the mountain corridors: southern Kazakhstan and the Hexi Corridor in western China. Our results contrast the rapid adoption of wheat and/or barley in the Hexi Corridor with the gradual, incremental adoption of millet in southern Kazakhstan during the second millennium BC. The people who lived in the Hexi Corridor consumed wheat and/or barley on a considerable scale shortly after the crops were introduced into the region. In Kazakhstan, millet consumption is not isotopically detectable until around a few hundred years after the first archaeobotanical evidence from the region. In addition, the people in southern Kazakhstan and western China diverge in their reliance on animal, as opposed to plant, protein. These patterns are best explained as different driving forces facilitating the eastward expansion of the Fertile Crescent crops and westward expansion of millet.
Footnotes
Acknowledgements
The authors are thankful to Catherine Kneale and James Rolfe from Cambridge for assistance with isotopic analysis. We are also grateful to Pavel Tarasov for helping with the manuscript and to Professors Mayke Wagner and Pavel Tarasov and Dr Robert Spengler for organizing the workshop, entitled ‘The Introduction and Intensification of Agriculture in Central Eurasia’, Berlin in 2015.
Funding
This work was supported by the European Research Council, under grant 24964 (FOGLIP); Washington University Deanery Office Grant; American Association of University Women (AAUW); and International Center for Advanced Renewable Energy and Sustainability (I-CARES).