
Abstract
Two gravity cores (778 and 780) sampled at the Nelson River mouth and one (776) at the Churchill River mouth in western Hudson Bay, Canada, were analyzed in order to identify the impact of dam construction on hydrology and sedimentary regime of both rivers. Another core (772) was sampled offshore and used as a reference core without a direct river influence. Core chronology was established using 14C and 210Pb measurements. Cores 778 and 780 show greater variability than the others, and the physical, chemical, magnetic, and sedimentological properties measured on these cores reveal the presence of several hyperpycnites, indicating the occurrence of hyperpycnal flows associated with floods of the Nelson River. These hyperpycnal flows were probably caused by ice-jam formation, which can increase both the flow and the sediment concentration following the breaching of such natural dams. However, these hyperpycnites are only observed in the lower parts of cores 778 and 780. It was not possible to establish a precise chronology because of the remobilization of sediments by the floods. Nevertheless, some modern 14C ages suggest that this change in sedimentary regime is recent and could be concurrent with the dam construction on the Nelson River, which allows a continuous control of its flow since the 1960s. This control prevented the formation of hyperpycnal flows and the deposition of hyperpycnites. Finally, core 776 contains only one rapidly deposited layer. This lower frequency may be related to the enclosed estuary of the Churchill River, its weaker discharge, and the distance of the site from shore.
Keywords
Introduction
Several studies have demonstrated that sediment transport in rivers is highly impacted by anthropogenic activities such as damming, river diversion, or deforestation (e.g. Syvitski et al., 2005; Valiela et al., 2014; Yang et al., 2006). In particular, the construction of hydroelectric dams can affect the rivers’ hydrology and sediment dynamics that would otherwise be governed by climatic variations (e.g. Boyer-Villemaire et al., 2013). This anthropogenic influence may be identified in sediment cores sampled in estuarine environments as they provide a continuous record of variations in currents and/or in river dynamics (e.g. Macklin and Lewin, 2003; Vannière et al., 2013).
In Canada, many rivers are characterized by seasonal dynamics because of the presence of river ice during the winter. In spring, the flow increases and the breakup of the ice, sometimes followed by ice-jam formation, may trigger major floods downstream (Beltaos and Prowse, 2001). However, hydroelectric installations, which are common in Canada, take advantage of the increased flow, holding it back in reservoirs for release at times dictated by hydroelectric demand and thus also allowing a control of the river floods. The Nelson and Churchill Rivers are examples of large Canadian rivers that are subject to anthropogenic modifications as they were dammed during the second half of the 20th century (Anctil and Couture, 1994; Manitoba Wildlands, 2005). Since the construction of these dams, the Nelson River flow is regulated to avoid floods, and extensive ice jamming no longer occurs in the lower Nelson River (Rosenberg et al., 2005). Moreover, the Churchill River was diverted to the Nelson River channel in 1976 to take advantage of its great hydroelectric potential (Manitoba Wildlands, 2005; Newbury et al., 1984), significantly increasing the Nelson River flow from 2240 to 3050 m3/s and reducing the Churchill River flow from ~1350 to ~600 m3/s (Déry et al., 2011; Prinsenberg, 1980). In this study, sediment cores sampled near the mouth of these rivers are used to investigate the impact of anthropogenic modifications on river hydrodynamics. Another core, sampled farther offshore, serves as a reference core without direct river influence.
Regional setting
Hudson Bay is a large and shallow Canadian inland sea located between four Canadian provinces and territories: Nunavut (to the west), Manitoba and Ontario (to the south), and Quebec (to the east) (Figure 1) (Stewart and Lockhart, 2005). During the Last Glacial Maximum (18 ka BP), Hudson Bay was completely covered by the Laurentide Ice Sheet (LIS) (Dyke, 2004). The progressive deglaciation allowed the formation of the large proglacial Lake Agassiz–Ojibway at the southern margin of the LIS (e.g. Barber et al., 1999; Lajeunesse and St-Onge, 2008). Around 8470 cal. BP, the catastrophic drainage of the Lake Agassiz–Ojibway beneath the LIS into the Tyrrell Sea (Hudson Bay precursor) led to the disintegration of the LIS and to the formation of a sequence of two hyperpycnal deposits (hyperpycnites) associated with this major flood (Lajeunesse and St-Onge, 2008; St-Onge and Lajeunesse, 2007). Since then, the coast of Hudson Bay has been emerging as a result of glacio-isostatic rebound (Stewart and Lockhart, 2005), and this continental uplift continues today at a mean rate of 8–10 mm/yr (Sella et al., 2007). At present, Hudson Bay covers an area of 841,000 km2 with a mean depth of only 125 m and a seabed slope of generally less than 2° (Kuzyk et al., 2009). It experiences each year a complete sea-ice cover and receives 30% of the total Canadian freshwater runoff (Déry et al., 2005).
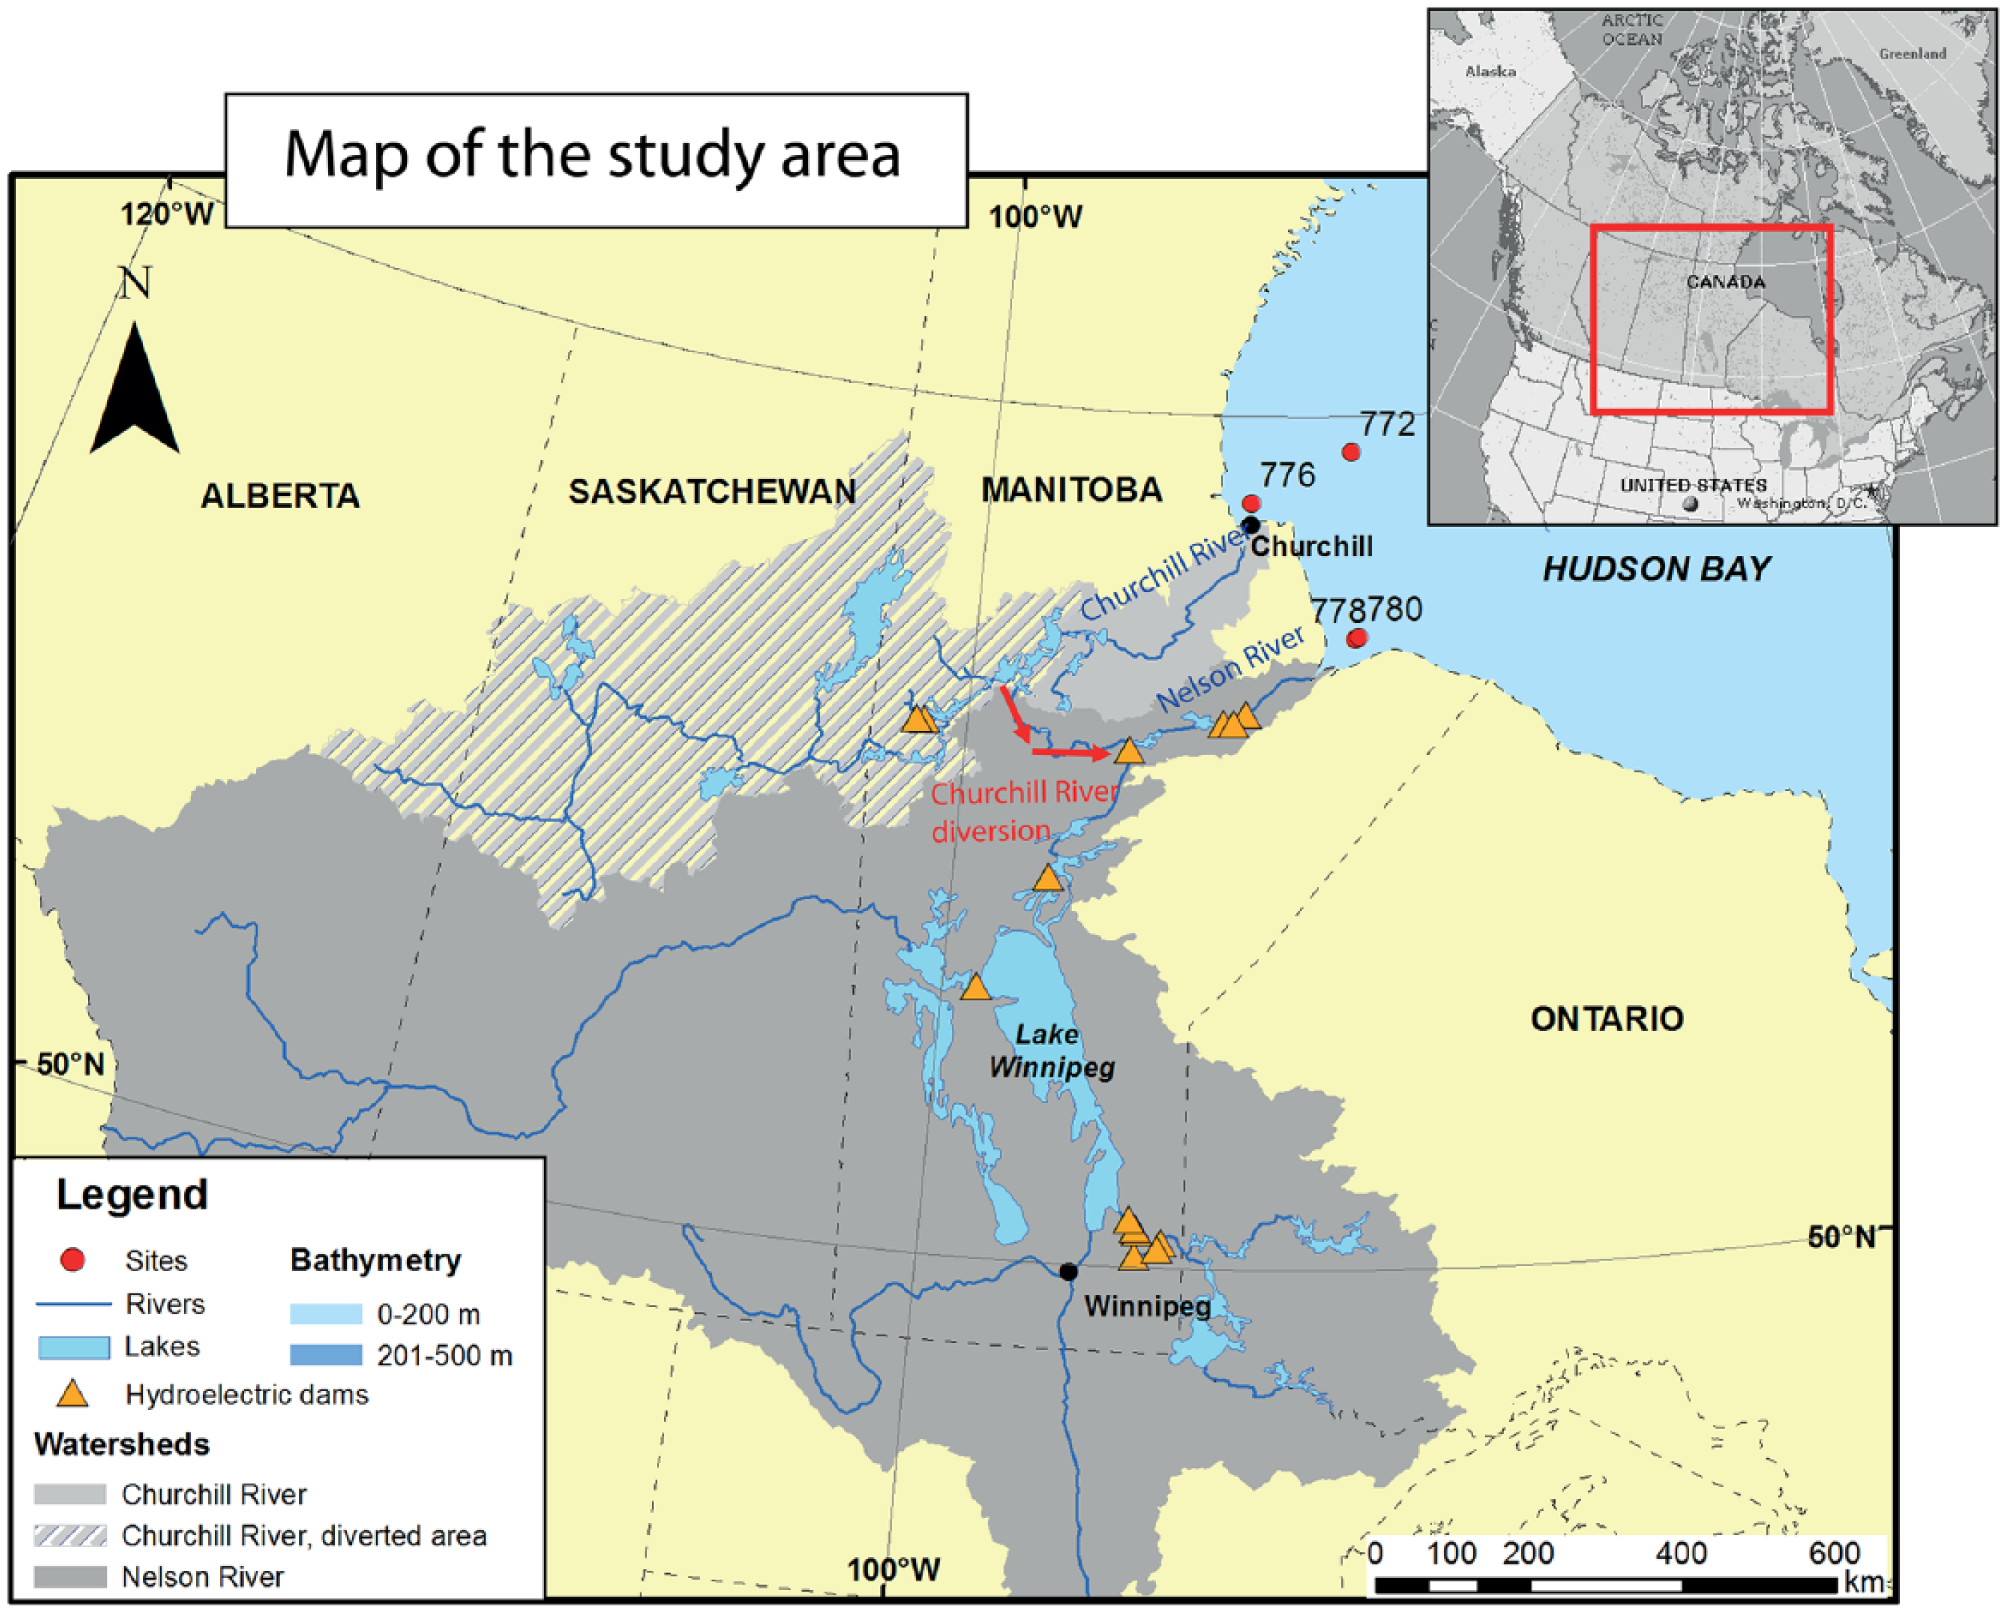
Map of the study area with the sampling sites and the watersheds of the Churchill and Nelson Rivers.
Two major rivers, the Nelson and Churchill Rivers, enter western Hudson Bay on the coast of Manitoba. The Nelson River is the third largest river in Canada, contributing to 16.3% of the freshwater inflow to Hudson Bay. Its drainage basin covers an area of 1,125,520 km2, from the Rocky Mountains in the west to Ontario in the east and Minnesota and South Dakota in the south (Kuzyk et al., 2009; Rosenberg et al., 2005). Its average annual mean discharge is 3050 m3/s but can reach ~6500 m3/s during spring freshet (Kirk and St-Louis, 2009; Rosenberg et al., 2005). The Churchill River basin, located north of Nelson River’s basin, is smaller and includes 281,300 km2 of Canadian land (Rosenberg et al., 2005). Unlike the Nelson River, whose mouth forms an open estuary, the Churchill River ends in a 13 km long enclosed estuary with a weir located at the upstream end (Kuzyk et al., 2008). Before the hydro-development, the lower Nelson River was covered with ice each winter from its mouth and up to 250 km upstream, and the spring freshet often triggered extensive ice jams at several sites downstream (North/South Consultants, Inc., 2012; Rosenberg et al., 2005). The first hydroelectric development was completed in 1928 on the Churchill River (Anctil and Couture, 1994) and in 1961 on the main section of the Nelson River. Five dams exist today between Lake Winnipeg and the mouth of the Nelson River. The last one, the Limestone Generating Station, is located 80 km before the river mouth (North/South Consultants, Inc., 2012). These structures have divided the river channel into a series of flooded valley reservoirs that freeze early in the autumn and reduced the amount of ice brought downstream at the breakup, preventing extensive ice jamming (North/South Consultants, Inc., 2012; Rosenberg et al., 2005). Furthermore, in 1976, 75%–85% of the natural flow of the Churchill River was diverted to the Nelson River channel to increase hydropower efficiency (Manitoba Wildlands, 2005; Rosenberg et al., 2005), disturbing the natural flow of both rivers (Anctil and Couture, 1994; Prinsenberg, 1980) and generating environmental complications such as severe erosion of frozen soils and increasing mercury levels in flooded lakes (Bodaly et al., 1984; Newbury et al., 1984).
Sampling and methods
Sampling
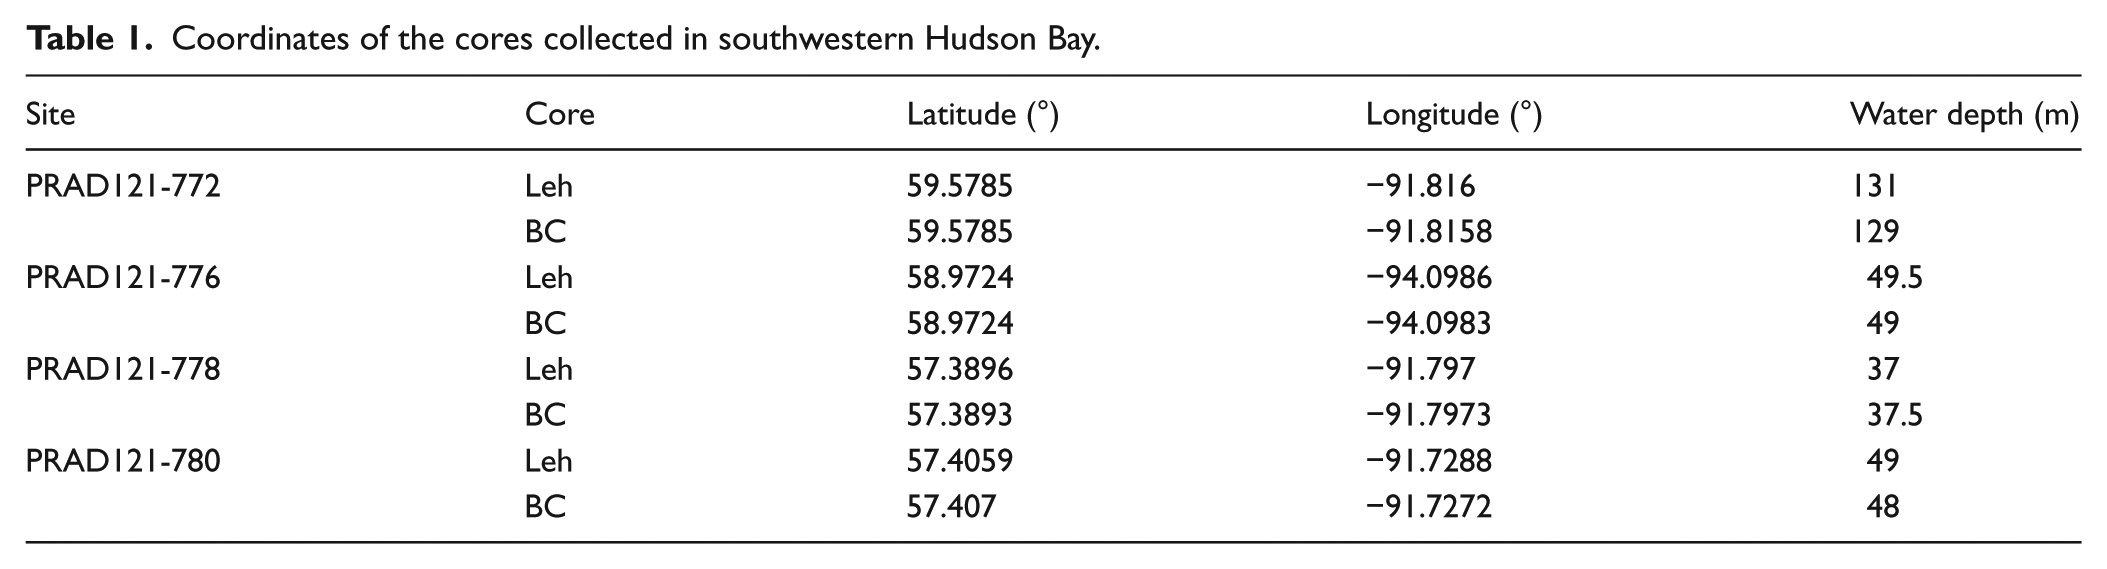
In the summer of 2012, four sites were cored on board the CCGS Pierre Radisson in southwestern Hudson Bay as part of the BaySys 2012 expedition carried out in the framework of the ArcticNet program (Table 1). These sites were selected for their apparent sediment thickness and their undisturbed surface based on seismic data collected from previous expeditions of the CCGS Amundsen in Hudson Bay. At each site, one Lehigh gravity core and one box core were sampled, and four push cores were sampled from each box core to obtain duplicates. Three of the sites are located near the coast of Manitoba: site PRAD121-776 is near the Churchill River mouth, whereas sites PRAD121-778 and PRAD121-780 are near the Nelson River mouth, the latter being 5–6 km farther from the mouth and 12 m deeper. The fourth site, PRAD121-772, is about 200 km to the northeast (Figure 1). The cores will be hereinafter referred to as cores 776, 778, 780, and 772.
Coordinates of the cores collected in southwestern Hudson Bay.
Physical analyses
The whole cores were first scanned with a Geotek XCT digital x-ray system at ISMER to obtain digital x-ray images of the cores which were then displayed with gray-scale values. Subsequently, the cores were analyzed with a Geotek Multi Sensor Core Logger (MSCL) to measure wet bulk density by gamma ray (γ) attenuation and low-field volumetric magnetic susceptibility (kLF) at 0.5 cm intervals. This last parameter is sensitive to ferrimagnetic mineral concentration and grain size variations (e.g. St-Onge et al., 2007).
Using these first results, the best preserved push core for each site (best apparent sediment/water interface, no coring artifact, and no compaction) was selected and opened, along with all the gravity cores. Once split, the cores were described and analyzed one more time with the MSCL to measure diffuse spectral reflectance parameters (L* presented for core 772) using a Minolta spectrophotometer, magnetic susceptibility using a Bartington point sensor, and elemental composition and concentration with a Innov-X x-ray fluorescence (XRF) spectrometer at 0.5 cm intervals. Elemental ratios obtained by XRF data provide information about sediment characteristics and associated processes: a good example is the Zr/Rb ratio that allows identifying turbidities (Croudace et al., 2006).
Finally, the split cores were sampled with u-channels (u-shaped plastic liner of 2 × 2 cm cross section and up to 1.5 m in length) for rock-magnetic analyses. Shells were collected for 14C dating, and discrete samples were taken for grain-size, rock-magnetic, and geochemical analyses.
Grain-size analyses
Sediment grain size is one of the main indicators of hydrodynamic changes through time. For grain-size measurements, discrete samples were collected at 4 cm intervals from the gravity cores, diluted into a Calgon solution (1% sodium hexametaphosphate), and mixed several hours using a house-made rotator before analysis. These analyses were performed using a Beckman Coulter LS13320 laser sizer, and the results were computed with GRADISTAT to determine grain-size statistical data (Blott and Pye, 2001).
Magnetic analyses
The magnetic properties of sediments can be used in several ways. The rock-magnetic properties, which are inherent to the sediment composition, enable detection of variations in grain size, concentration, and mineralogy of magnetic minerals, which are influenced by environmental changes (Liu et al., 2012; Tauxe, 2010). For example, the kARM/k ratio is inversely correlated to grain-size variations if magnetite dominates the magnetic signal (e.g. Liu et al., 2012; Stoner et al., 1996).
The u-channels sampled in the cores were analyzed with a 2G SRM-755 u-channel cryogenic magnetometer to measure ARM by inducing an alternating field of 100 mT with a 0.05 mT direct current (DC) biasing field. The ARM was then normalized by the biasing field used to obtain kARM, which is used in the kARM/kLF ratio (King et al., 1983). In addition, an alternating gradient force magnetometer (AGM) was used on discrete samples to measure hysteresis properties of the sediment; saturation magnetization (Ms), coercive force (Hc), saturation remanence (Mrs), and coercivity of remanence (Hcr). The resulting hysteresis curve is indicative of the magnetic mineralogy and grain size (Tauxe et al., 1996) and is useful to determine if magnetite is the dominant magnetic mineralogy, and thus the validity of the kARM/kLF ratio to reflect changes in grain size.
Chemical analyses
A minor fraction of marine and lacustrine sediment is composed by organic matter that is the residue of past biota. The composition and the amount of this matter reflect changes in environmental conditions in the past (Meyers, 1997). For example, isotopic ratios such as δ13C and δ15N, together with the elemental ratio Corg/Ntotal, allow identification of variations in the sediment source between marine algae, lacustrine algae, or terrestrial plants (e.g. Meyers, 1997; St-Onge and Hillaire-Marcel, 2001). In this study, samples from core 772 were collected at the same interval as for grain-size analyses (every 4 cm) and then split in two subsamples. They were dried and crushed, and one of the two subsamples was treated with HCl to remove inorganic carbon. All samples were then analyzed with a gas chromatograph coupled to a mass spectrometer for stable isotope (δ13C) and an elemental analyzer (GC-EA-IRMS, ThermoElectron/COSTECH) to measure C and N contents (%C, %N). By combining the data from the treated and untreated samples, we can then determine Ctotal, Ntotal, Cinorg and Corg, and the Corg/Ntotal elemental ratio.
Chronology
In total, 20 mollusk shells were collected from the four gravity cores and from one of the box cores for radiocarbon dating (Table 2) and were sent to the Radiochronology Laboratory at Université Laval for pre-treatment. The 14C ages were then determined at the W. M. Keck Carbon Cycle Accelerator Mass Spectrometer Laboratory at the University of California, Irvine, CA, USA. The resulting 14C ages were calibrated using the CALIB 7.0 online calibration software (Stuiver et al., 2005) and the Marine13 data set (Reimer et al., 2013). A marine reservoir correction (ΔR) of 110 ± 65 years, recognized for Hudson Bay (Coulthard et al., 2010), was applied, and the calibrated ages are reported with the 2σ confidence level.
AMS 14C dated material and results.
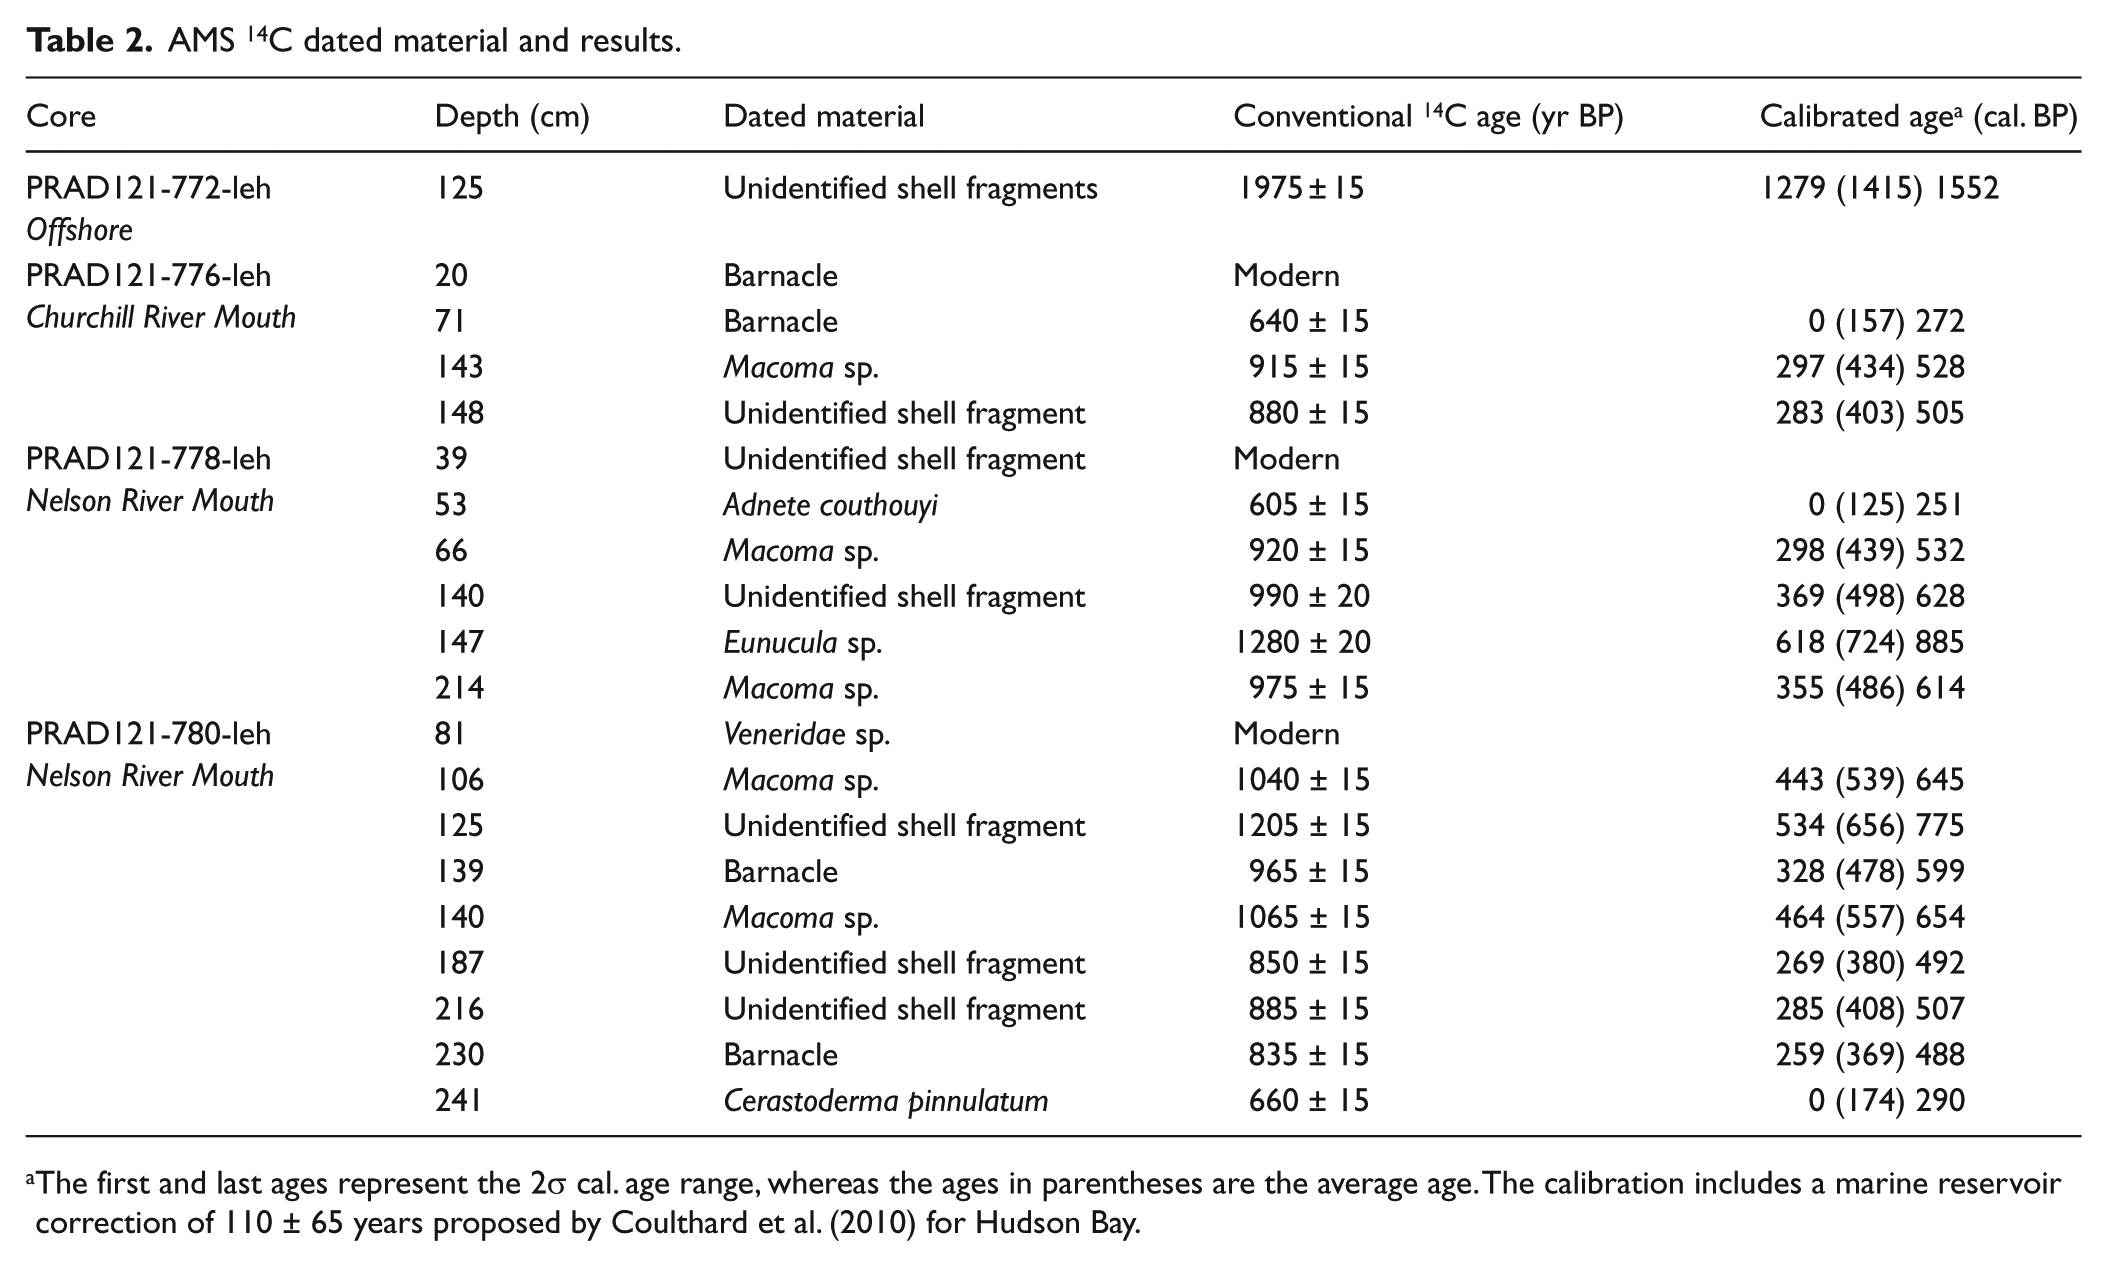
The first and last ages represent the 2σ cal. age range, whereas the ages in parentheses are the average age. The calibration includes a marine reservoir correction of 110 ± 65 years proposed by Coulthard et al. (2010) for Hudson Bay.
Recent sedimentation rates (SRs) for all the sites were derived using the 210Pb activity of dried and crushed sediments determined by alpha spectrometry of the daughter isotope 210Po at the GEOTOP research center (Zhang, 2000). The SR is obtained through the slope of a linear regression between the ln(210Pbexcess) versus depth, which was calculated by subtracting the supported 210Pb determined visually on the activity. For these analyses, sediment was sampled from the selected box cores at each centimeter from 0 to 20 cm and each 5 cm on the rest of the cores.
Results
Core top correlation
Comparison between the gravity cores and their respective box cores was performed using the MSCL parameters (Figure 2). Cores 772 and 776 did not reveal any missing sediment at the top of the gravity cores. However, the gravity cores of sites 778 and 780 show 7 and 25 cm of missing sediments, respectively.
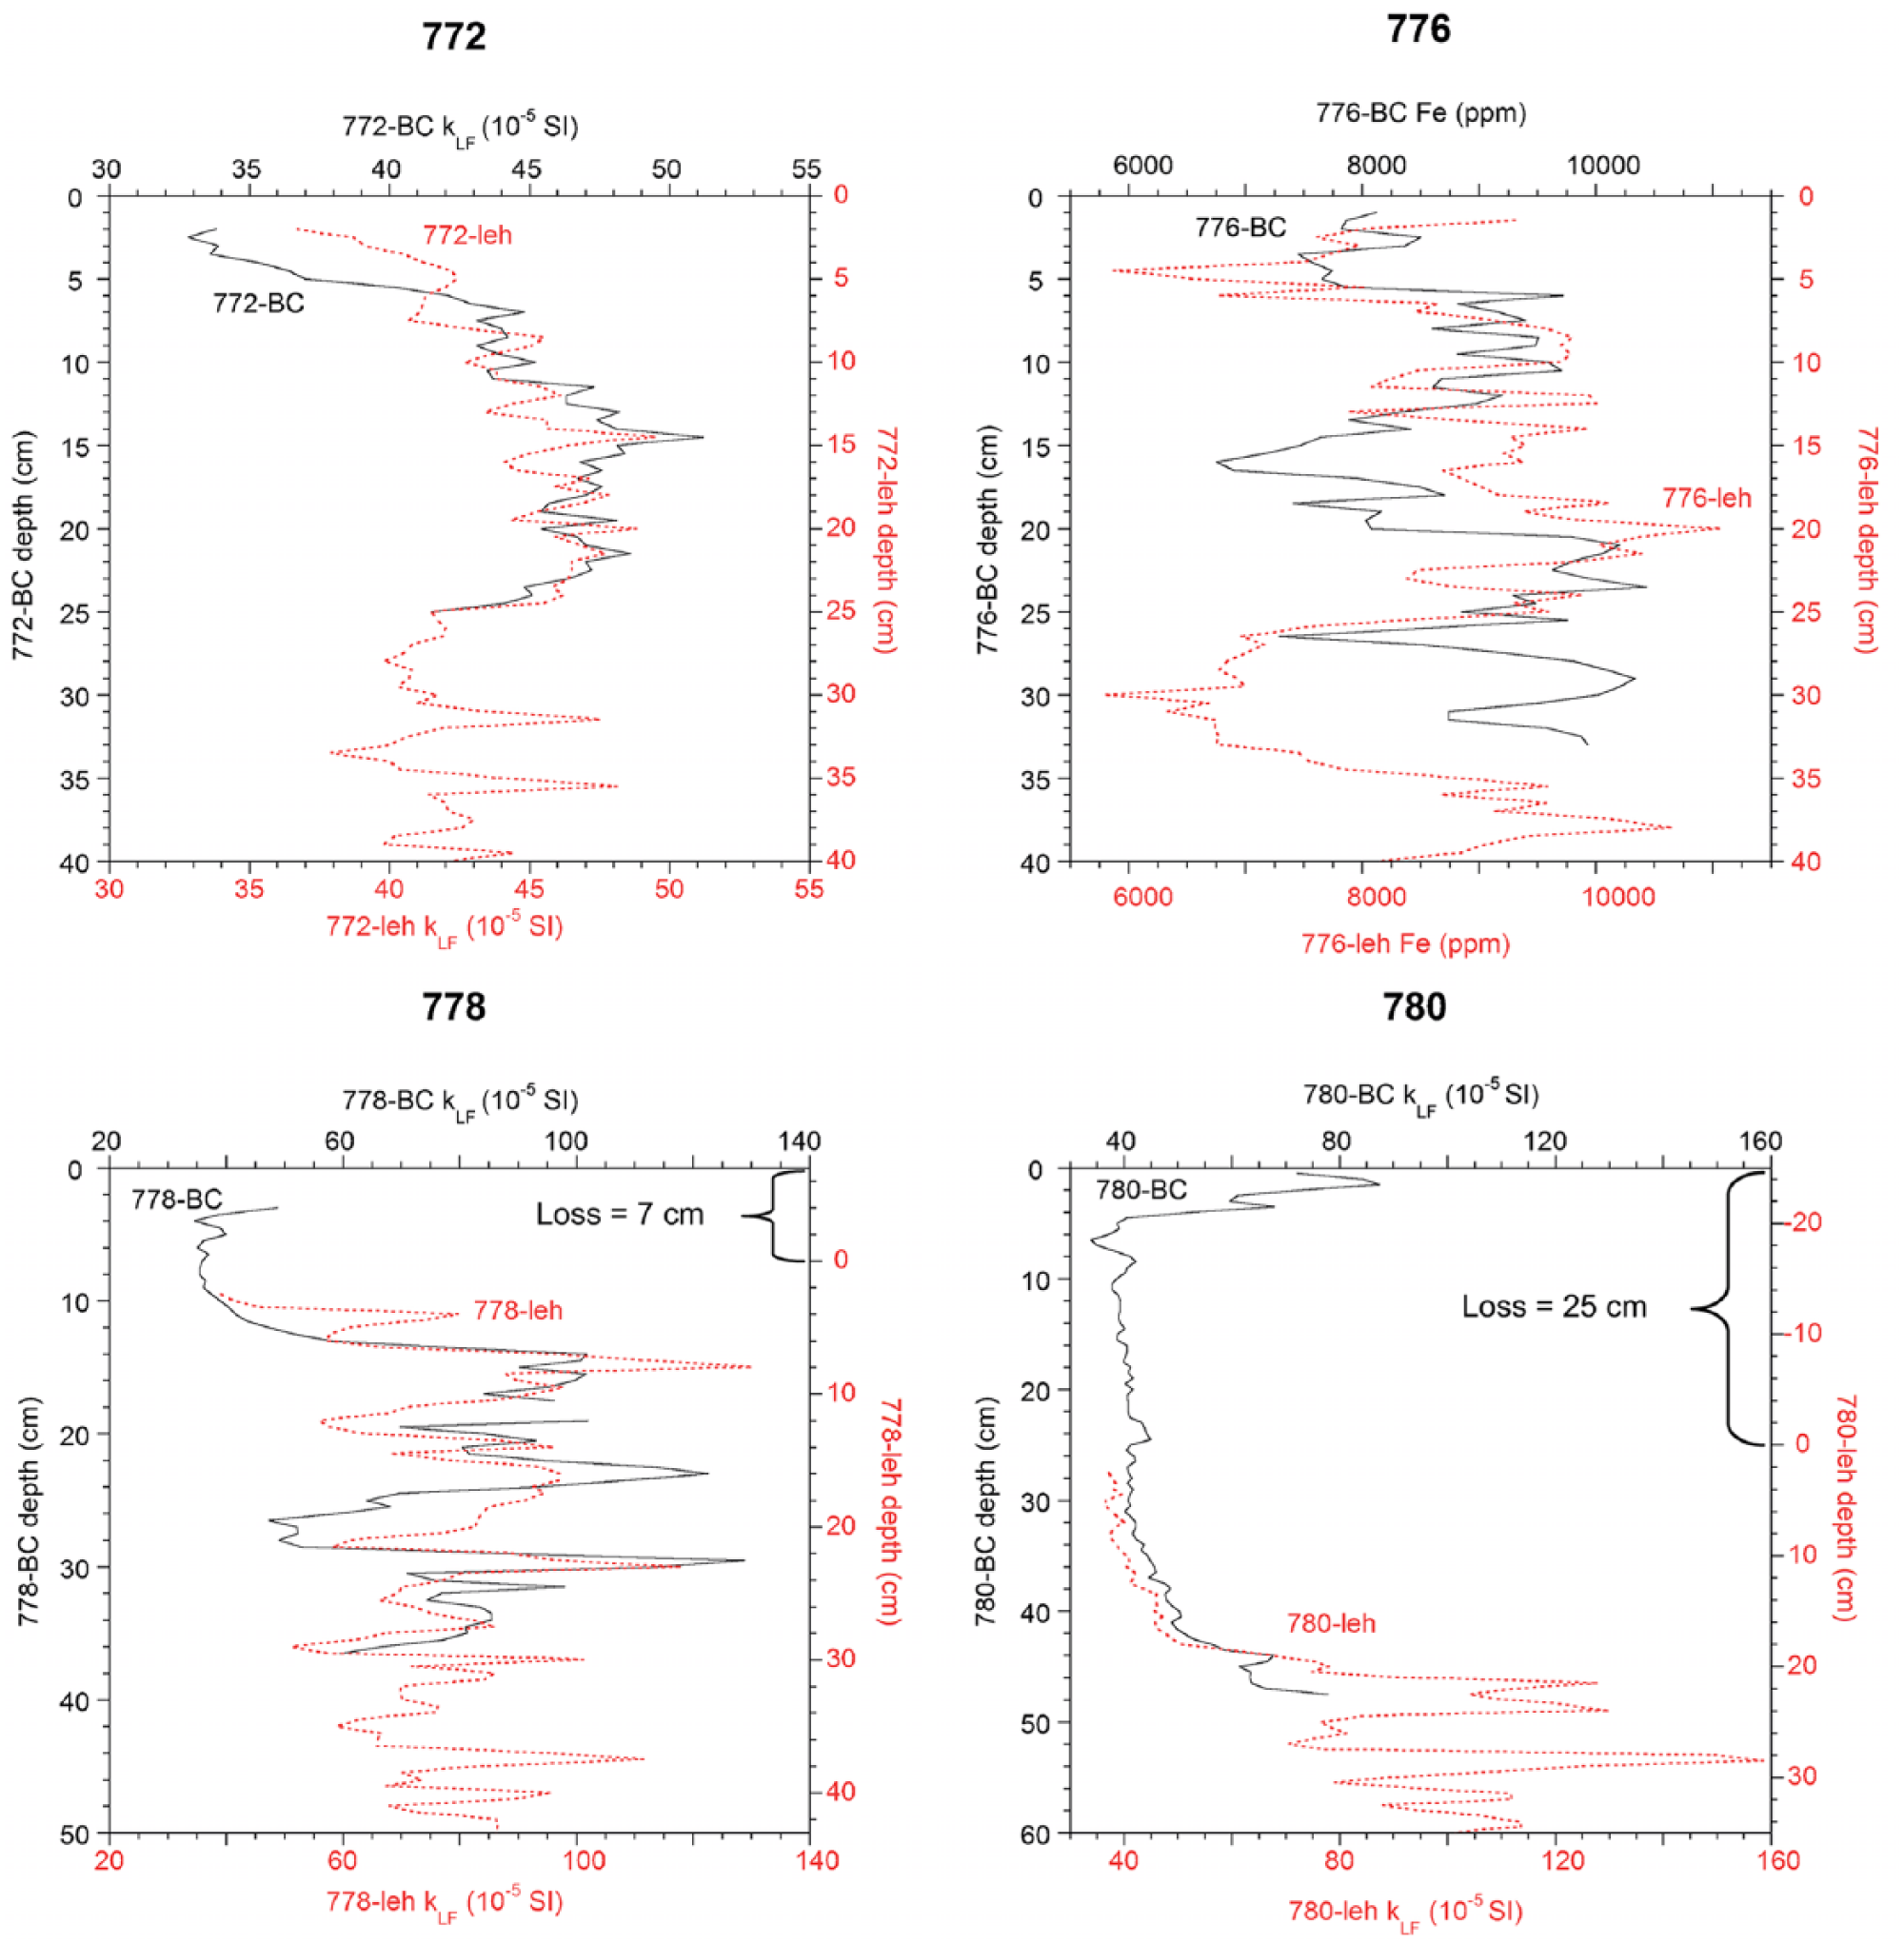
Correlation (magnetic susceptibility kLF or Fe content) between the LeHigh gravity core (leh: in red) and the box core (BC: in black) for the four sites sampled. Even though the Fe results are presented as ppm, only relative changes were used here as an absolute calibration with sediments was not performed.
Lithology
Core 772
Core 772 is mainly composed of fine silt around 11 µm (Figure 3). The density, magnetic susceptibility, and the Zr/Rb ratio are also relatively constant, whereas the kARM/k ratio increases from 50 to 0 cm. L* decreases somewhat from 50 cm to the top, according to the darker color of the sediment that was visible on the opened core. The organic carbon content increases slightly from 0.3% at the base to 0.6% at the top of the core, and the δ13C only shows an increasing trend in the upper 20 cm. The Corg/Ntotal ratio does not show any significant trend. Unlike the other cores, core 772 does not display rapidly deposited layers (RDLs), and is thus relatively homogeneous compared with the other cores, but some properties which are constant below 50 cm show different trends above this depth.
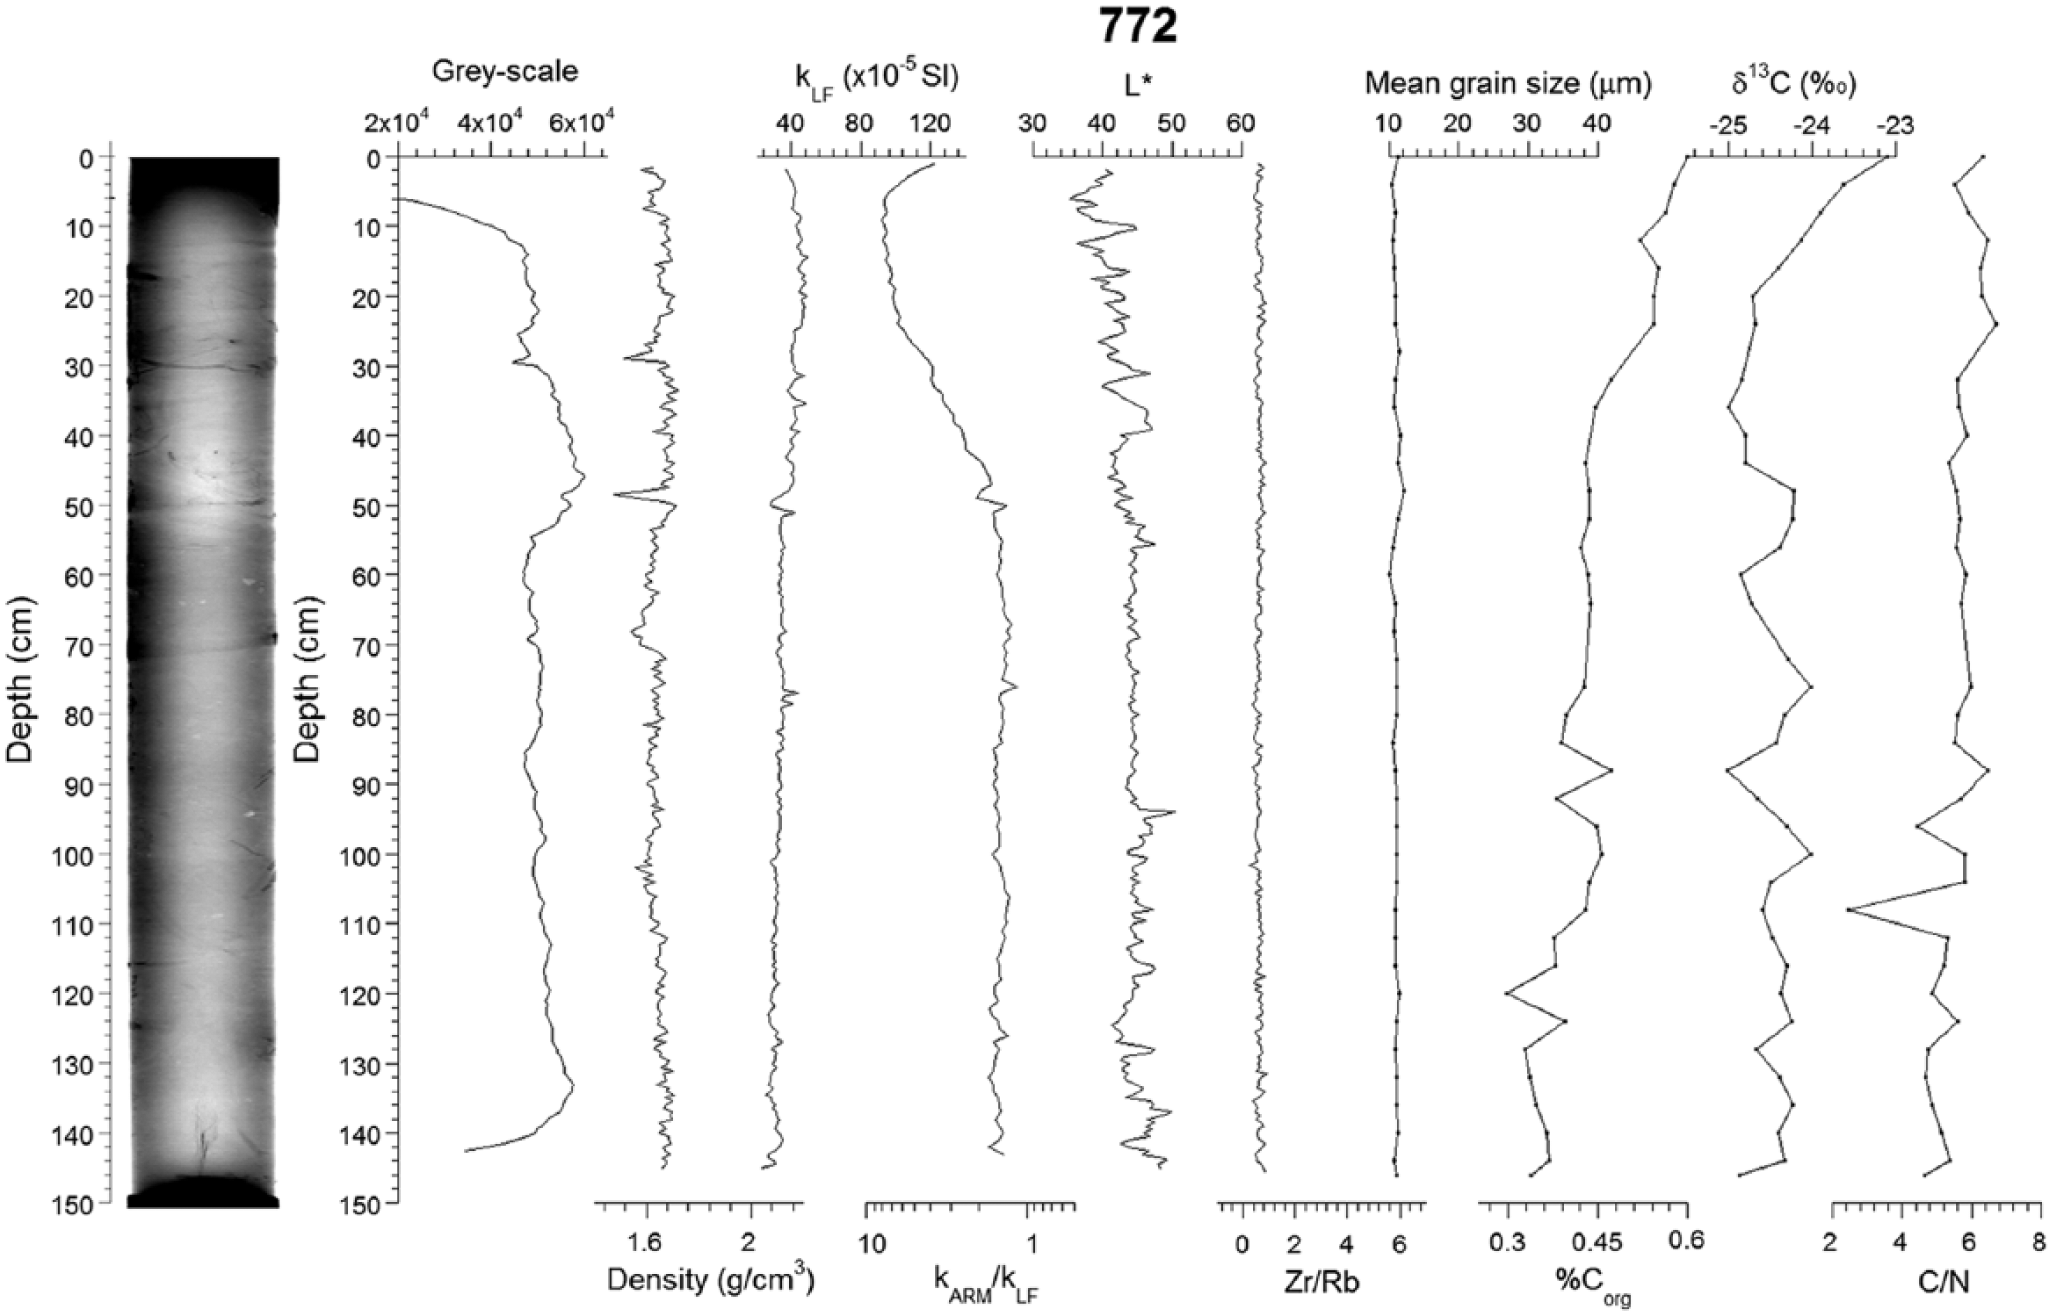
The x-ray image and derived gray scale values, physical, sedimentological, magnetic, and geochemical properties of core 772 versus depth.
Core 776 (Churchill River)
Similarly to core 772, core 776 does not show large lithological variations. It is mainly composed of medium silt, generally coarser than the sediments of core 772 (Figure 4) and contains a few gravel particles (<1.5 cm in diameter) scattered in the core. At 51 cm, there is a sharp and thin layer of fine sand underlying a laminated interval of finer material composed of fine silt. These variations are mirrored by the mean grain size, as well the kARM/k and Zr/Rb ratios. The upper part of the core (0–20 cm) is slightly coarser than the rest, but this is not observed in the kARM/k and Zr/Rb ratios.
The x-ray image and derived gray scale values, physical, sedimentological, magnetic, and geochemical properties of core 776 versus depth.
Cores 778 and 780 (Nelson River)
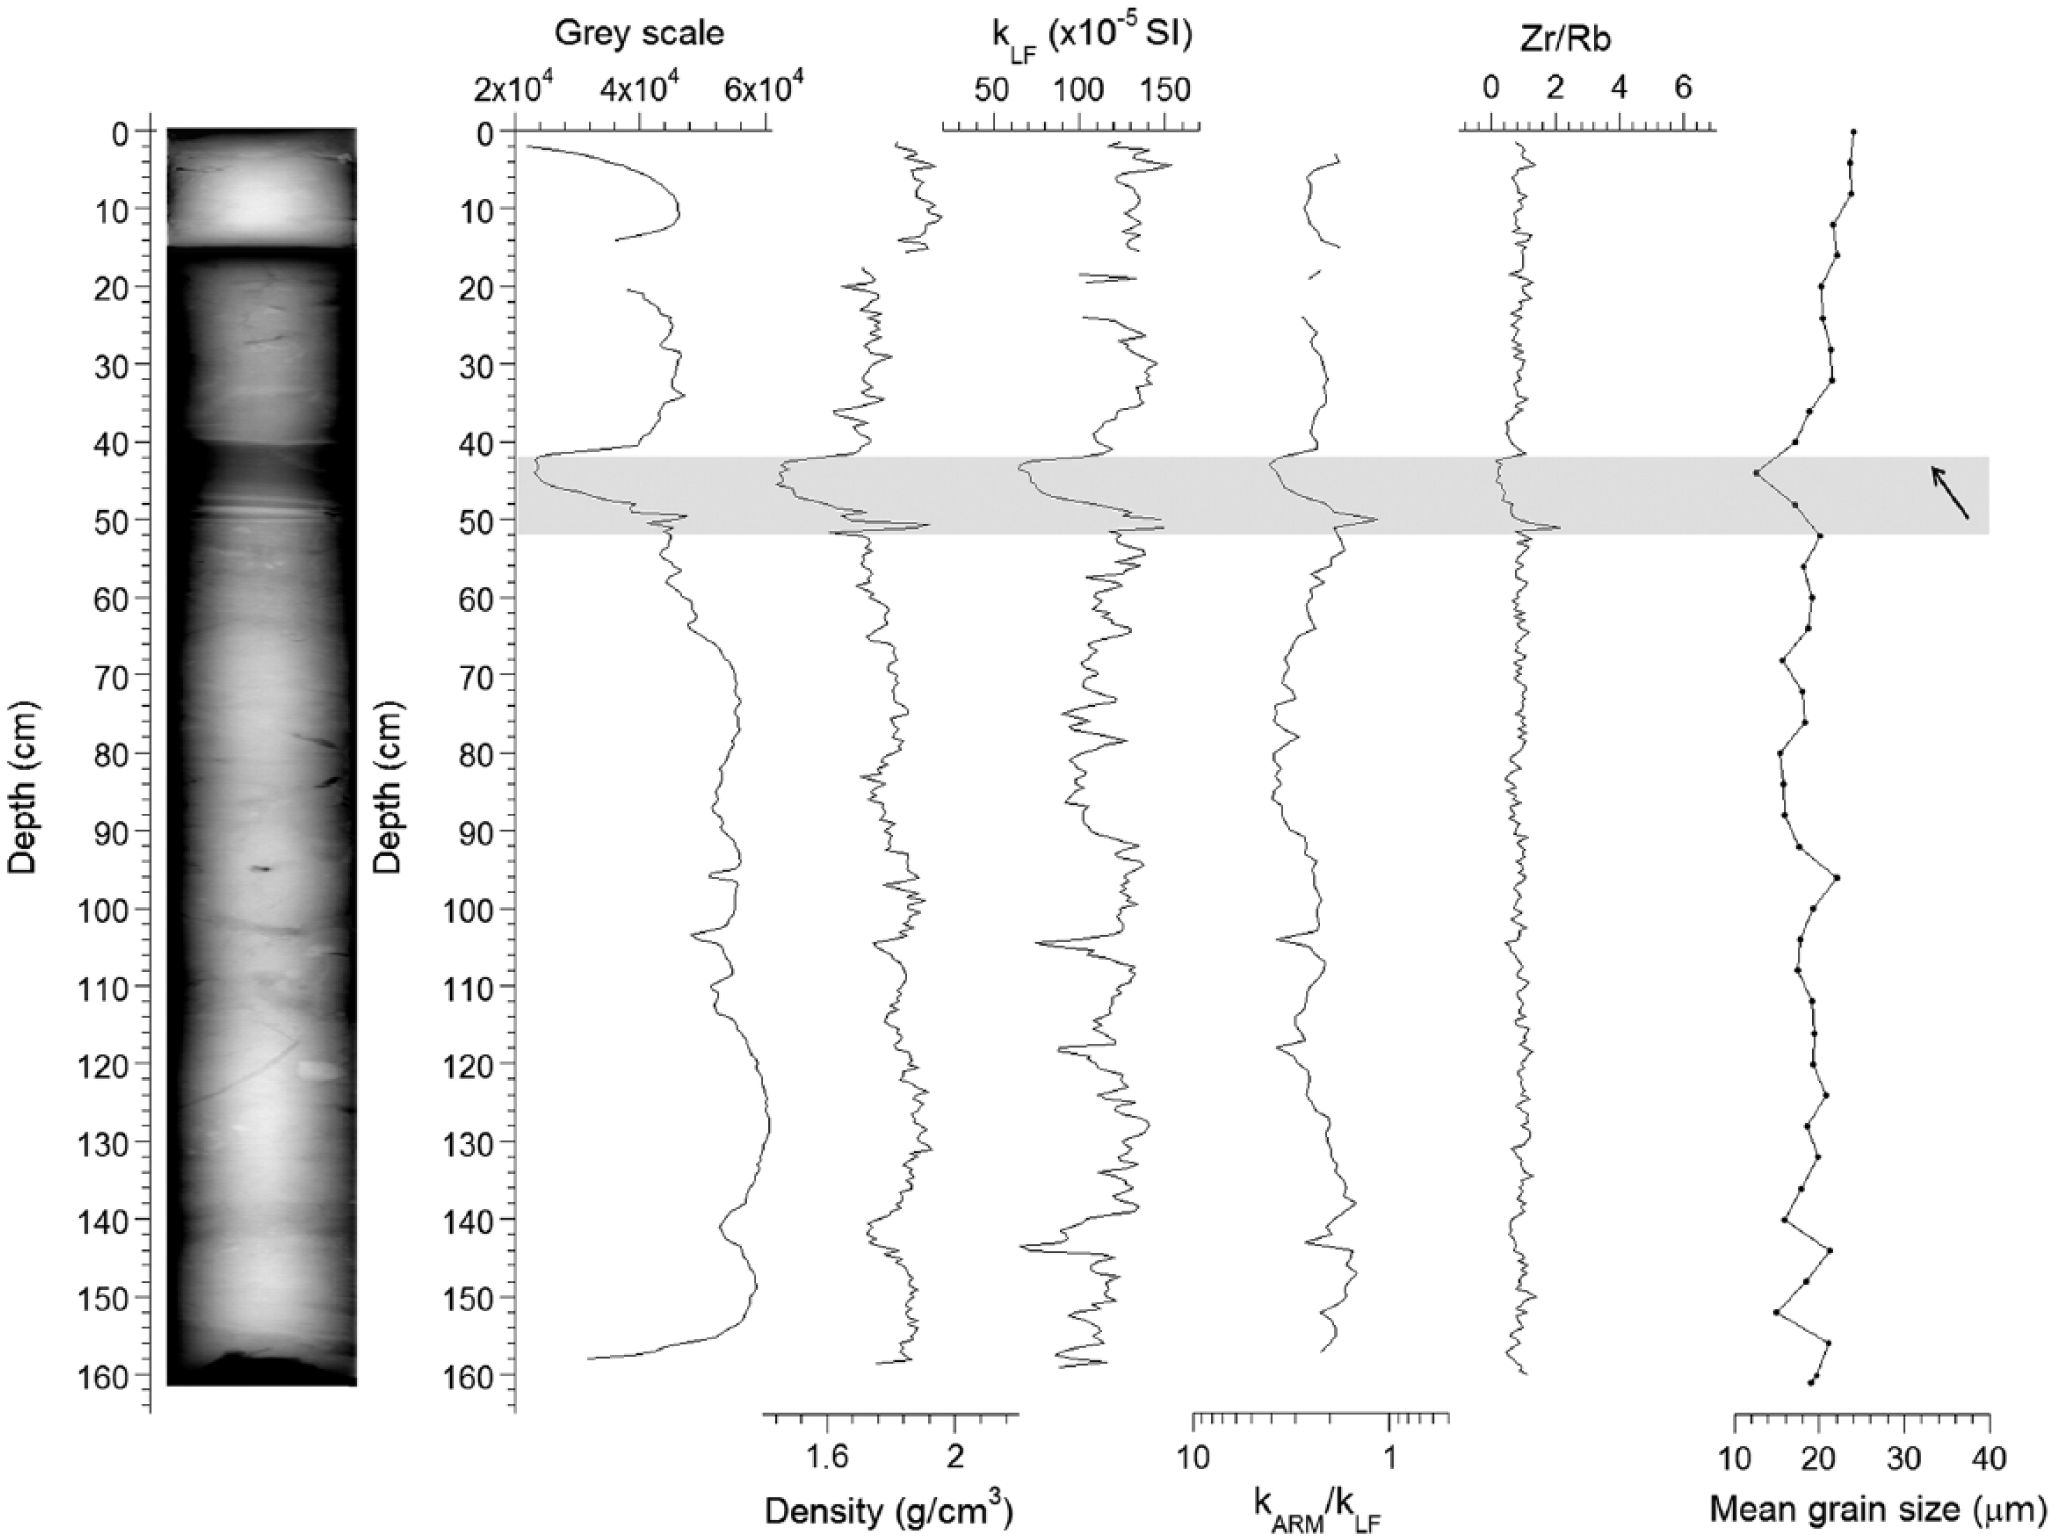
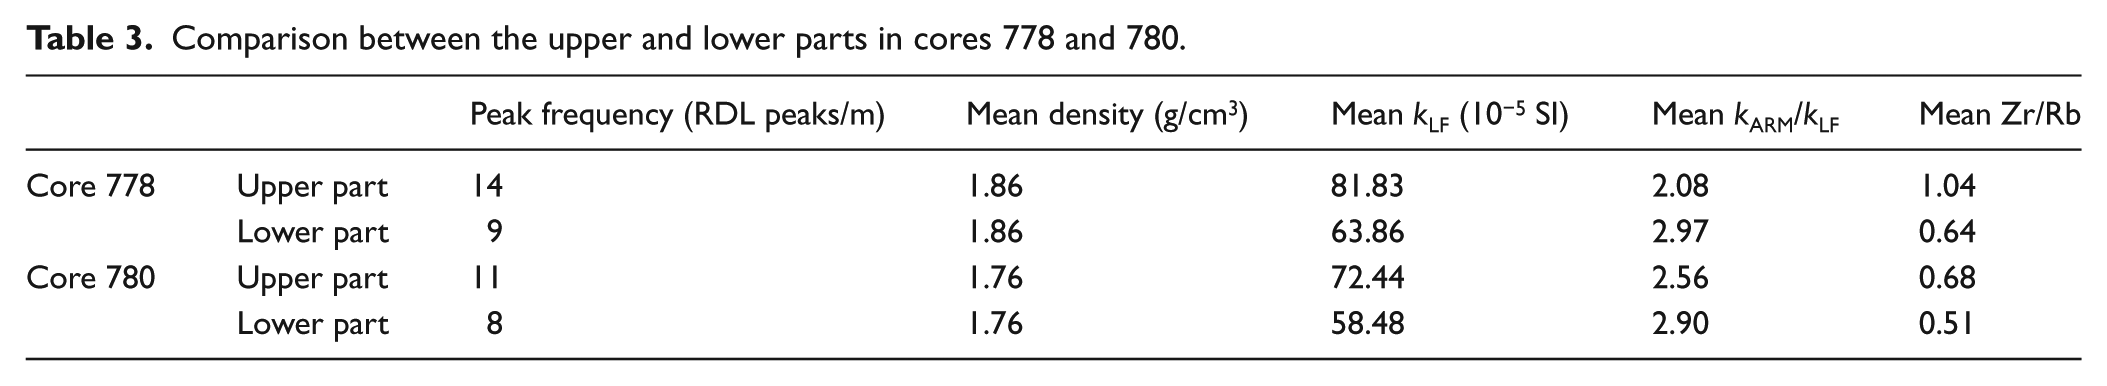
As shown by the x-ray images, cores 778 and 780 depict larger lithological variations than cores 772 and 776 with a composition varying between silty clay and fine sand (Figure 5). Both cores show a similar pattern with a lower part characterized by alternation between coarser and finer layers and an upper part composed by higher frequency variations ranging from fine silt to coarse silt (Figure 5). These differences between lower and upper parts are also highlighted in Table 3: the upper parts show a higher frequency of peaks, higher (lower) mean values for kLF (kARM/kLF ratio) and higher mean values of Zr/Rb ratio. Moreover, mean values from one core to another for the same part are close if we take into account that the lack of data (missing sediment because of coring, Figure 5) in the upper part of core 780 influences some of the results (Table 3).

The x-ray image and derived gray scale values, physical, sedimentological, magnetic, and geochemical properties versus depth for the gravity cores of sites 778 and 780. The 14C ages are indicated. The RDLs are highlighted in gray and the upper part in yellow.
Comparison between the upper and lower parts in cores 778 and 780.
In the upper part of the cores (0–67 cm in 778 and 0–115 cm in 780, given the missing sediment at the top), the variations are thinner, and it is not easily possible to delimitate single events. However, in the lower parts of both cores, the coarse layers, identified as RDLs, contrast clearly with the background clayey silts (Figure 5). Cores 778 and 780 contain, respectively, 12 and 11 of these RDLs. They are characterized by a coarsening upward unit followed by a fining upward unit with a generally gradual, but sometimes sharp, transition (Figure 5). These variations are highlighted by the density profile and the kARM/k and Zr/Rb ratios, which are influenced by grain-size variations (Croudace et al., 2006; Liu et al., 2012). The coarsening upward layers in the RDLs sometimes contain gravel particles usually smaller than 5 mm, and the fining upward layers are often laminated. Using the shape of the different parameters, and the thickness of intervening layers, it is possible to recognize the same RDL from one core to another (Figure 6). On average, the four upper RDLs are the thickest (Table 4). However, whereas the three upper layers are thicker in core 778 than in core 780, RDLs #4–6 are the same size in both cores, and the five lowest RDLs are thicker in core 780 (Table 4; Figure 6).

Comparison between cores 778 and 780 with the density and the kARM/k ratio after depth correction to account for the missing sediment in the upper part of the cores. The RDLs are highlighted in gray, whereas the upper variations are in yellow.
Comparison of the same rapidly deposited layers between core 778 and core 780.
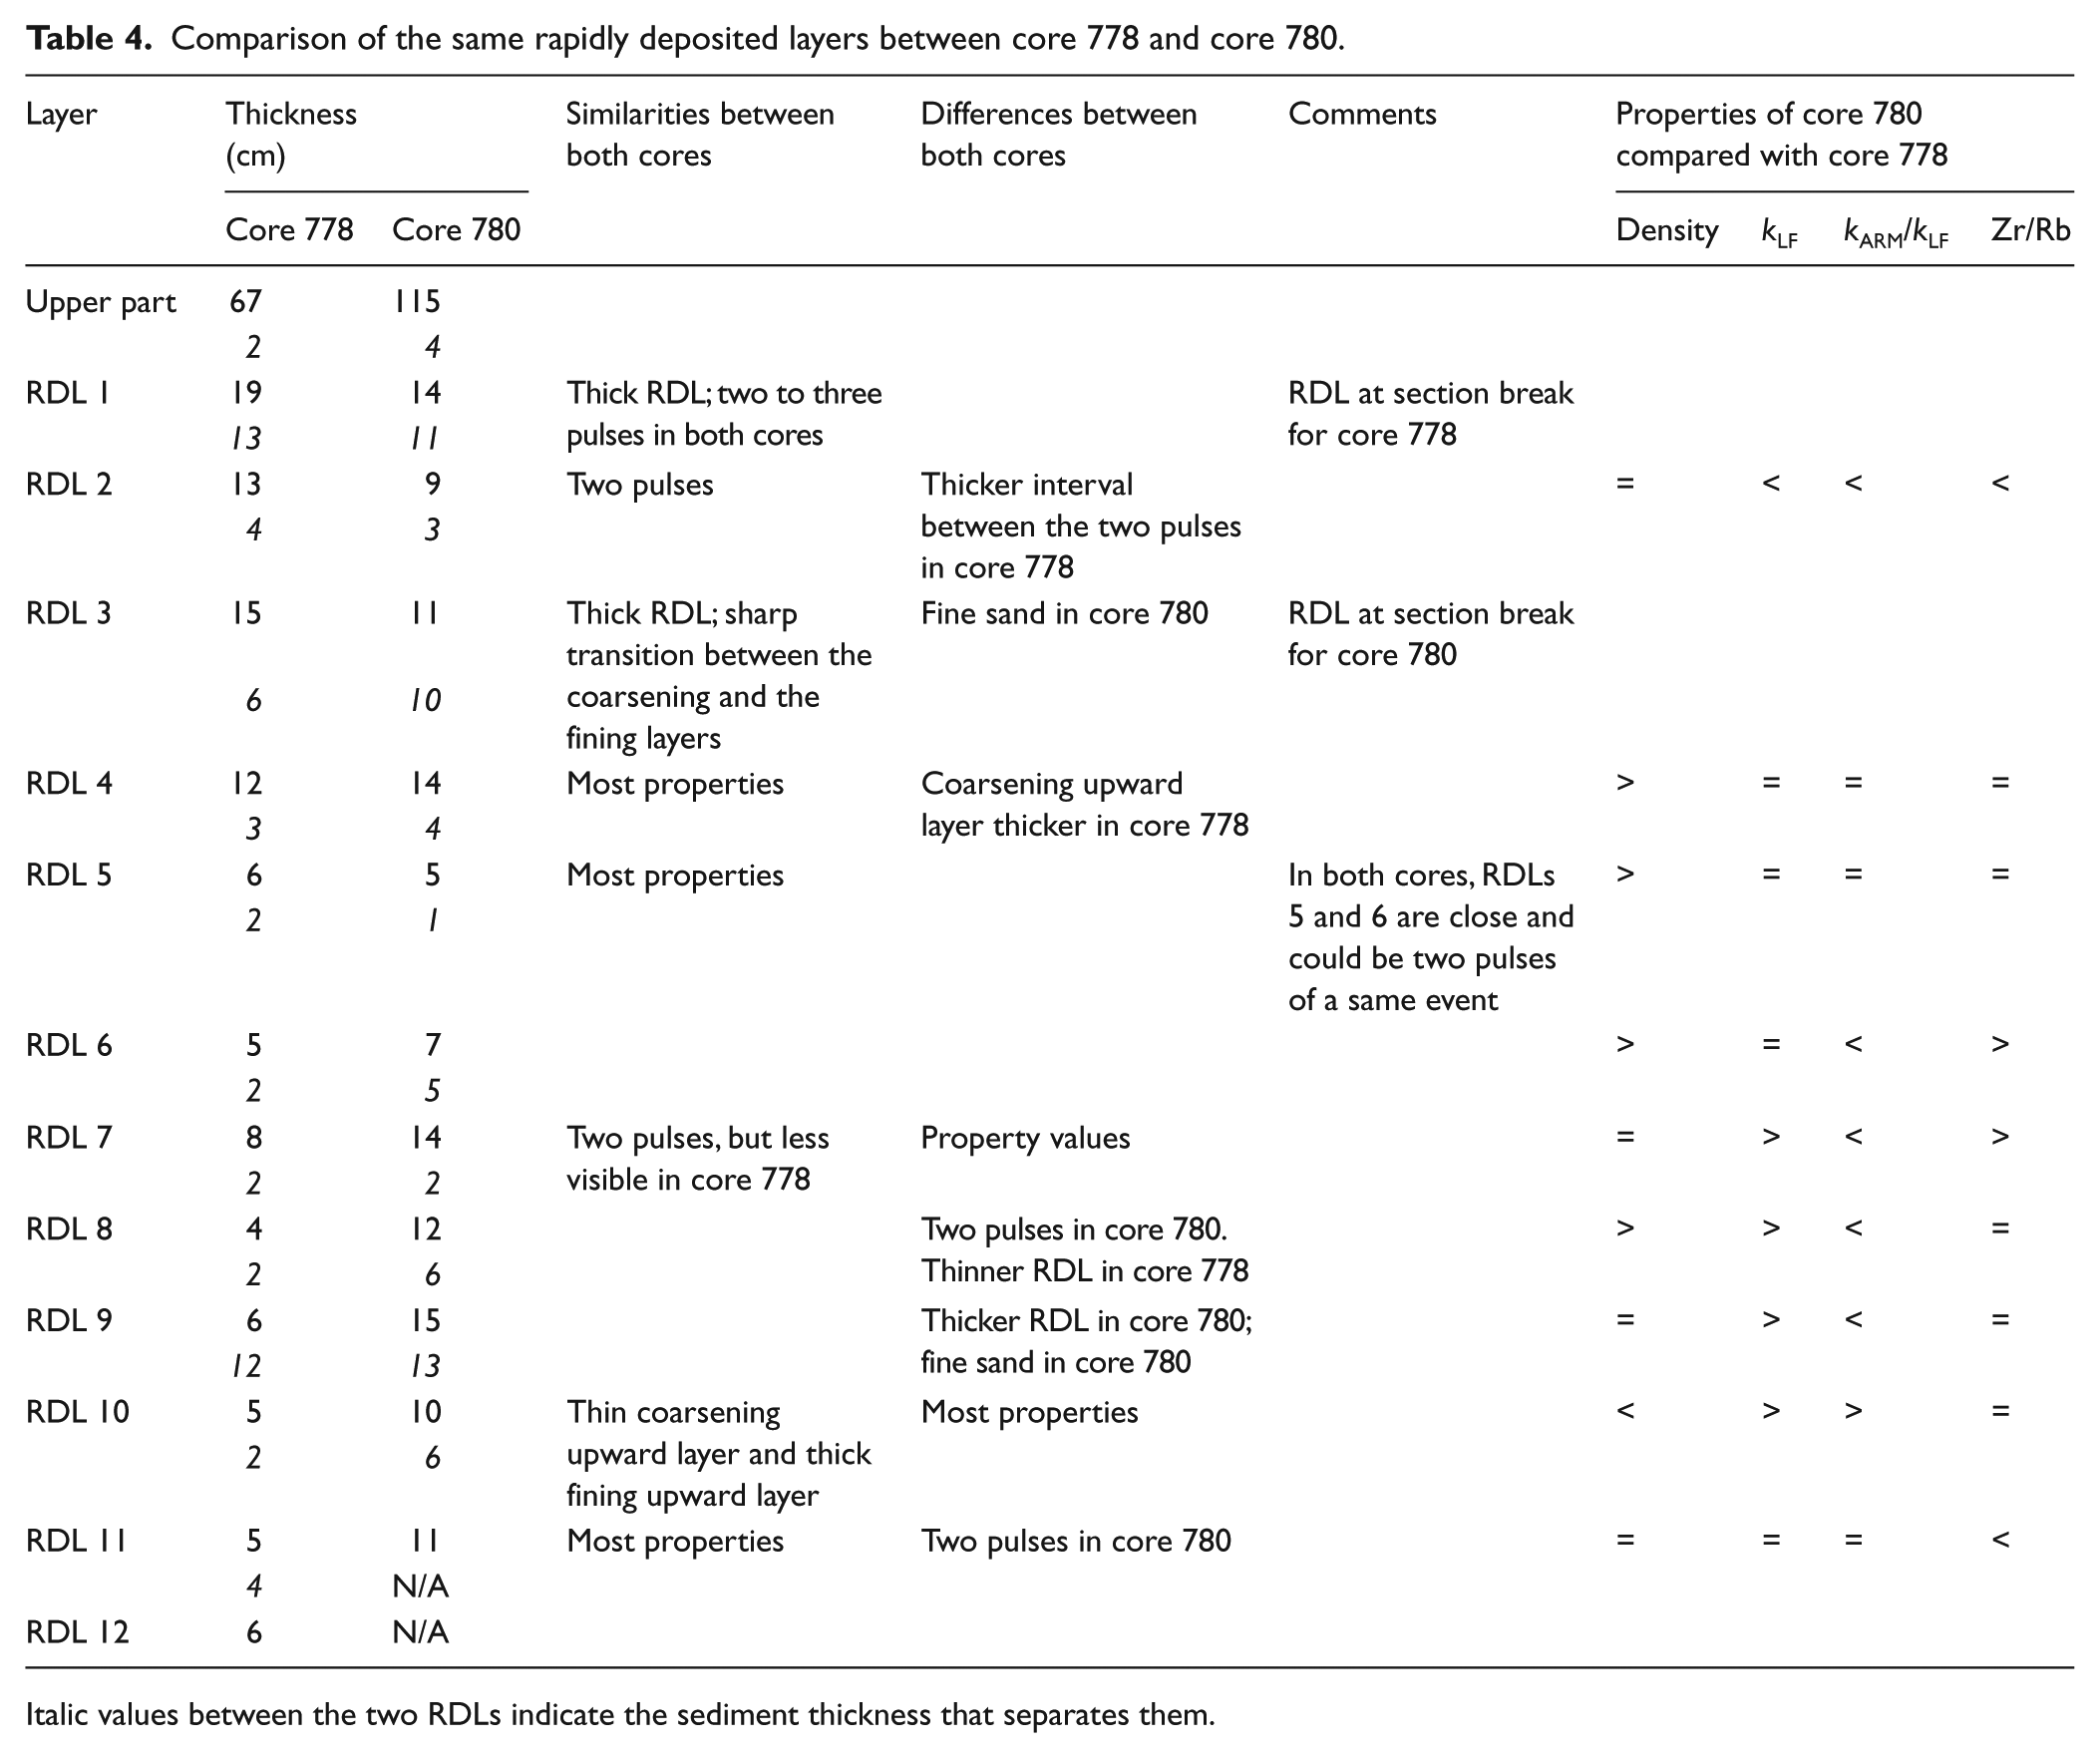
Italic values between the two RDLs indicate the sediment thickness that separates them.
Rock-magnetic data
The hysteresis curves obtained on selected samples from the cores yielded indications on the mineralogy and grain size of the magnetic grains present in the sediment (Tauxe et al., 1996). All curves have the typical shape of the predominance of low-coercivity minerals such as magnetite (Figure 7), and this indicates that the kARM/k ratio can be used as a grain-size indicator (Liu et al., 2012). The difference between the two samples of core 780 highlights the contrast between their grain sizes (Figure 7d and e). The sample D, collected from the background sediments, has a higher value of coercivity because of the finer grains of magnetite, whereas the sample E, from an RDL peak, illustrates the presence of coarser magnetite grains (Tauxe et al., 1996).
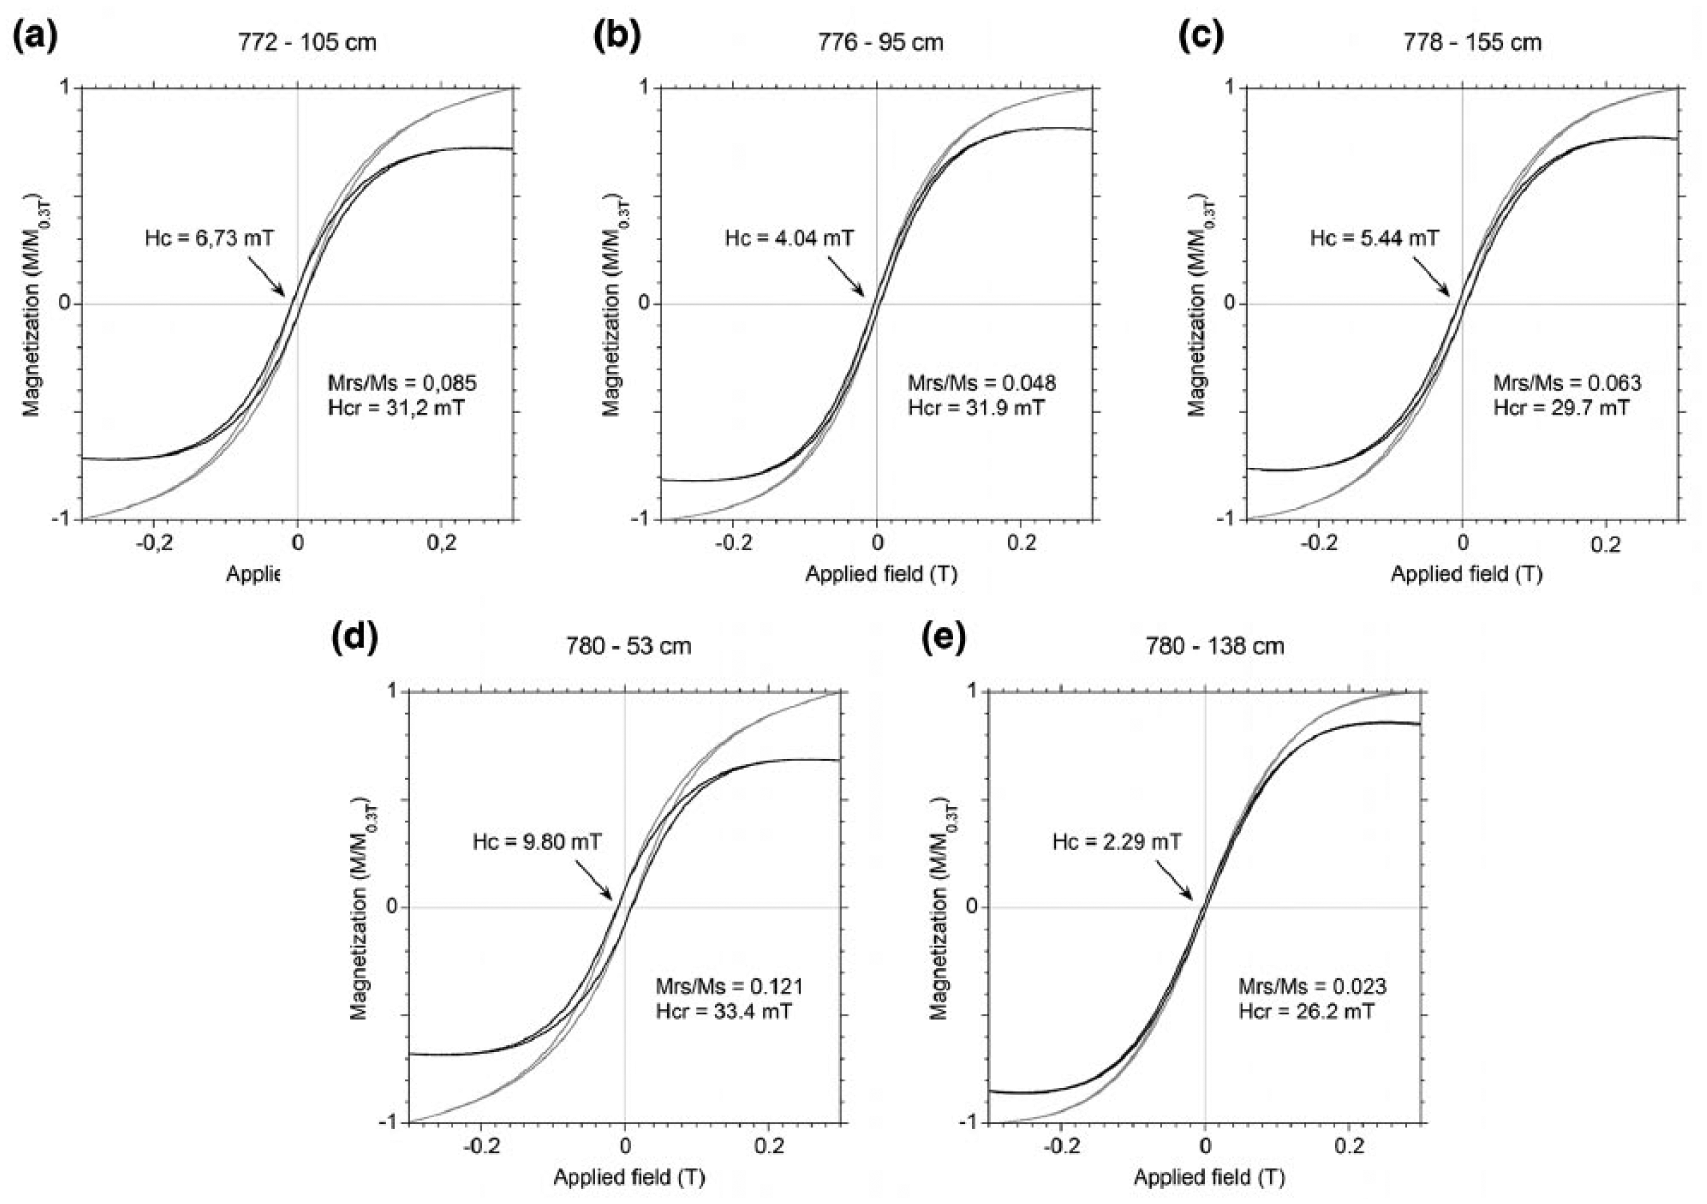
Hysteresis curves and derived parameters of a representative sample from each core: (a) 772, (b) 776, and (c) 778 and (d and e) two samples from core 780. In (d), the sample is from finer background sediments, while in (e) it is from a coarser RDL.
Chronology
Core 772
Several shell fragments were found in core 772 (at 125 cm depth) and were dated to 1415 cal. BP (Table 2). 210Pb activity determined on core 772 is characterized by a clear exponential decrease, corresponding to a SR of 0.082 cm/yr at the top of the core (Figure 8), which is close to the value of ~0.09 cm/yr obtained by Kuzyk et al. (2009) on a nearby core. Together, the 14C age and the 210Pb activity data indicate that core 772 spans the past 1800 years (Figure 9).
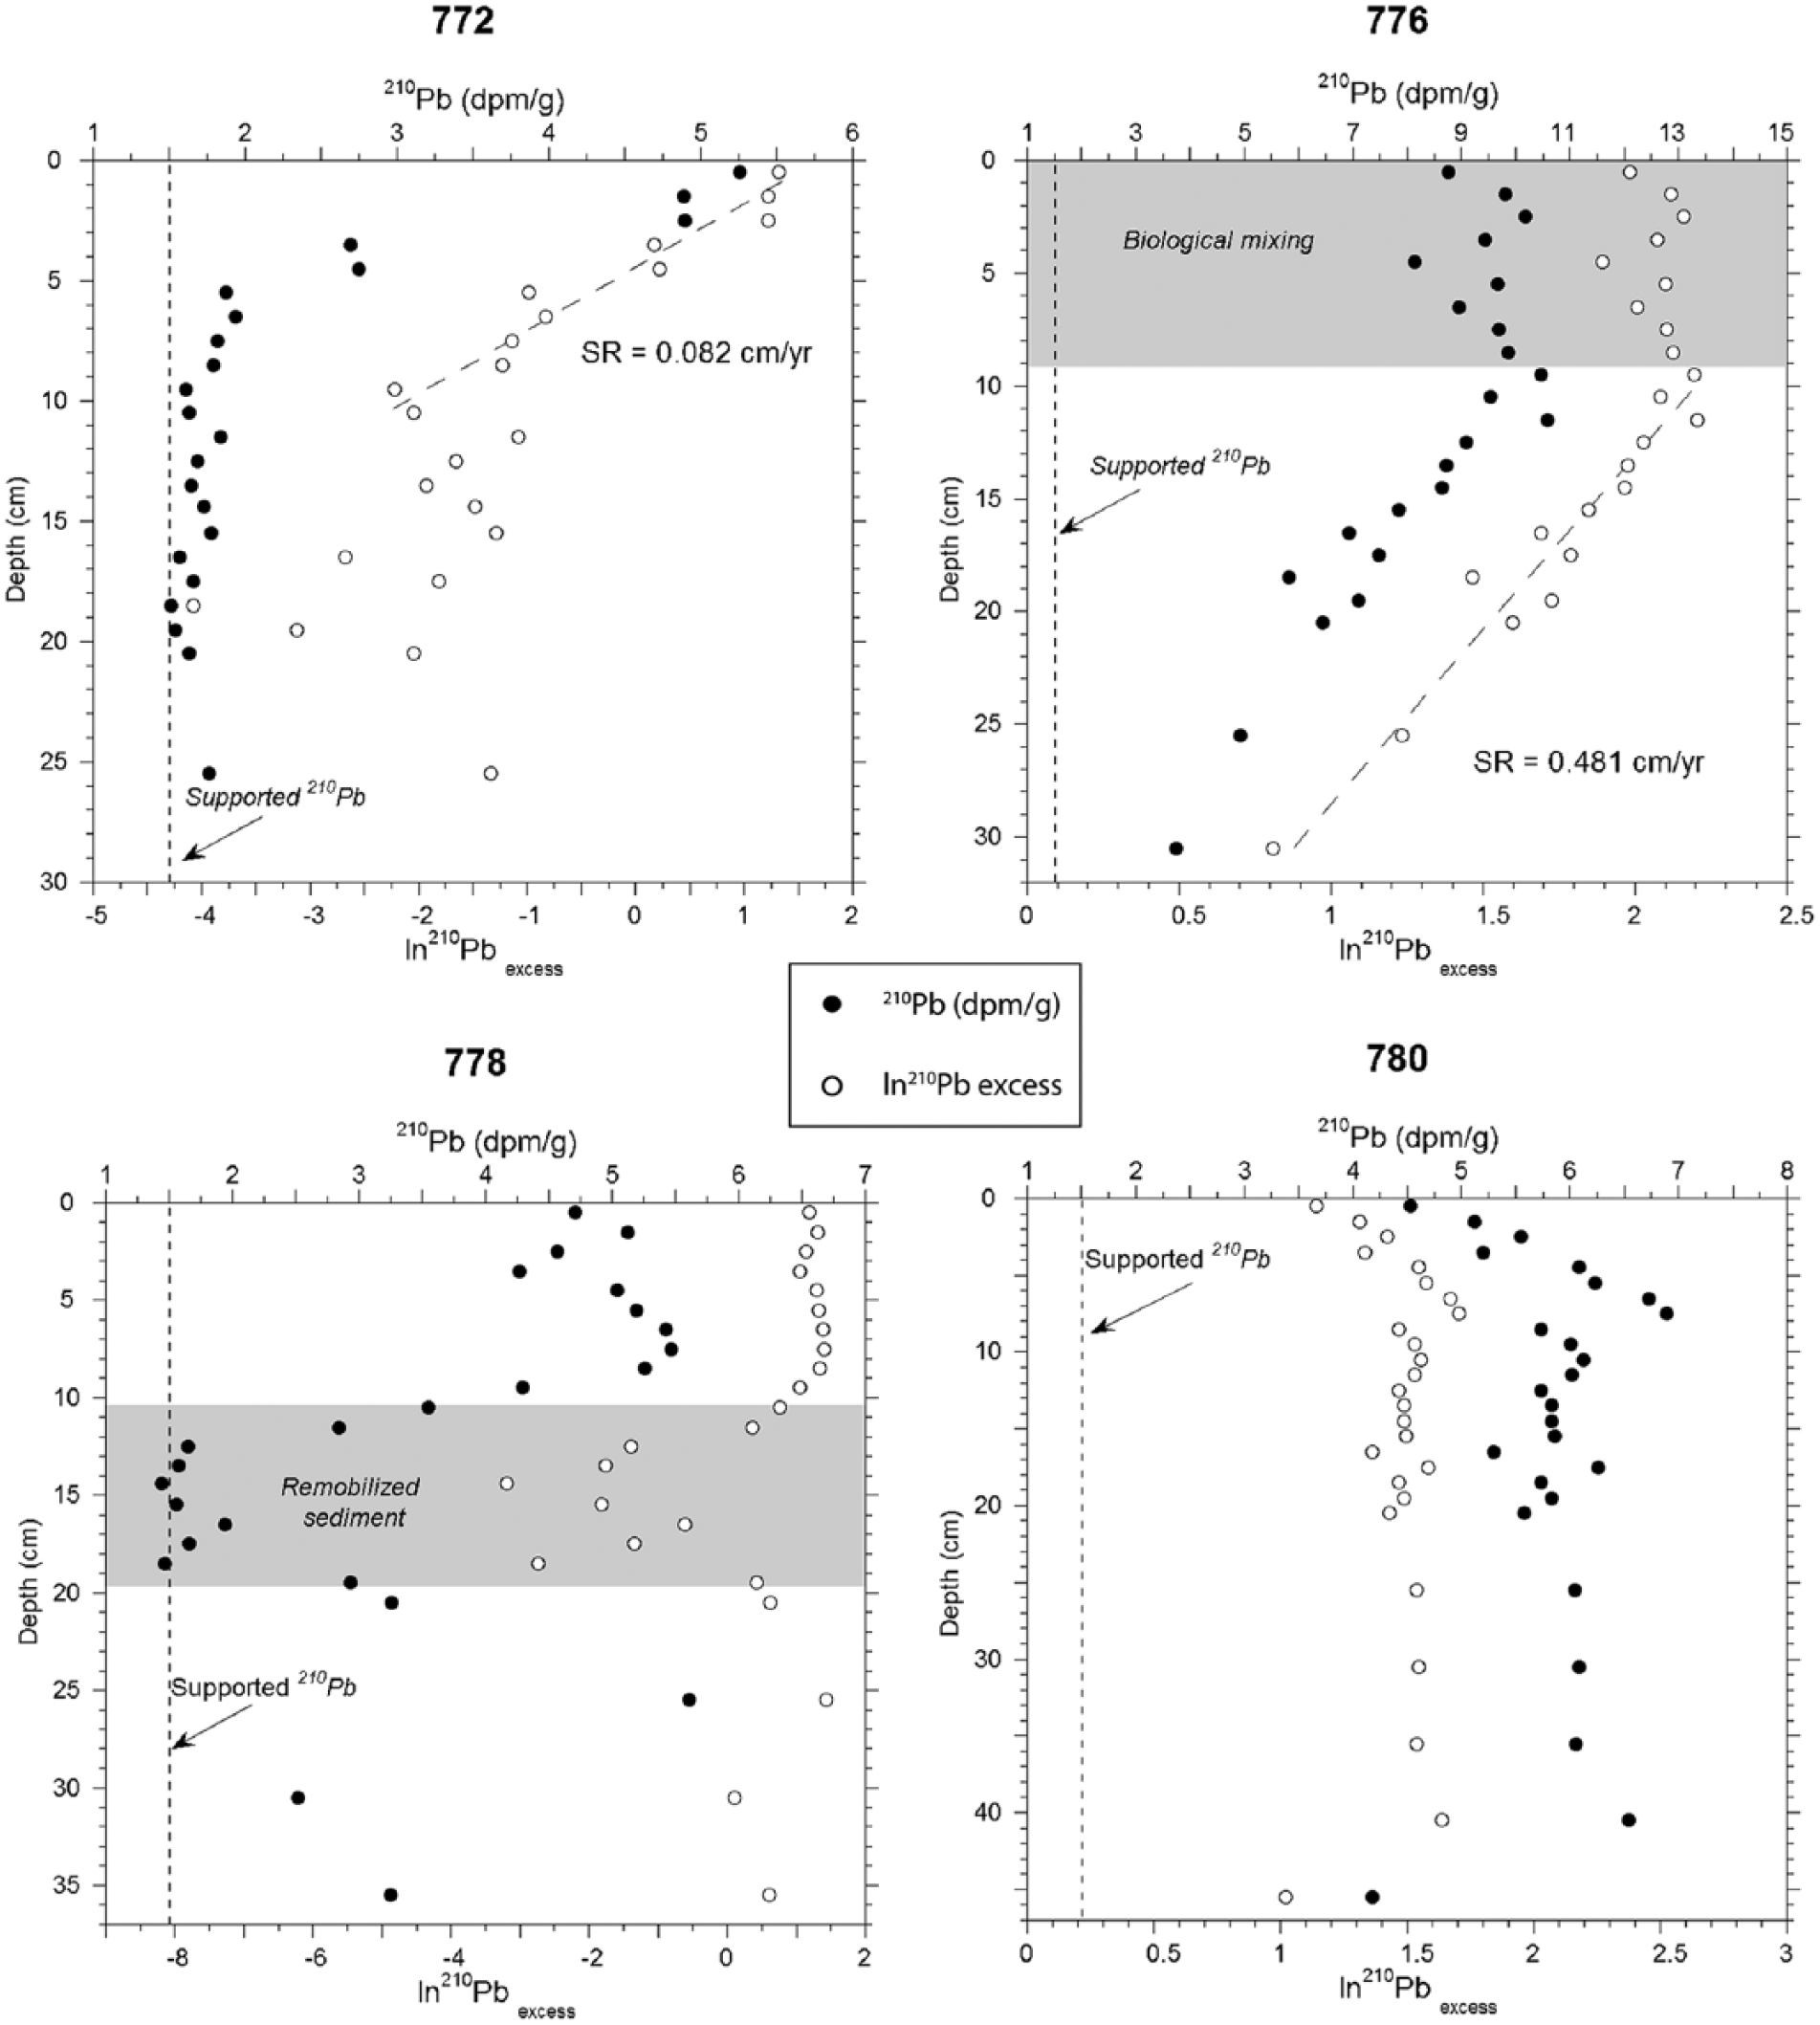
210Pb measurements for the four cores with the derived sedimentation rate (SR). Biological mixing occurs in cores 776, 778, and 780. The regional supported 210Pb is determined by the trend of 210Pb in core 772.

Age model of core 772 based on the 14C age and 210Pb data.
Core 776
For site 776, there is a clear decrease in 210Pb activity between 9 and 31 cm, whereas the upper 9 cm are constant and probably reflect biological mixing (Figure 8). The resulting SR is ~0.48 cm/yr, which is coherent with the 14C ages obtained for this core (Table 1). In addition, since the regional supported value is not reached in this core, SRs could be higher. The result is that this core spans the last 350 years and possibly less.
Cores 778 and 780
For cores 778 and 780, most of the 14C ages are reversed, that is, younger ages were found deeper in the cores (Table 2). Moreover, 210Pb activity does not show a clear decrease in both cores, despite the shift between 10 and 19 cm in core 778 (Figure 8). Therefore, it was not possible to establish a chronology for these cores. However, modern ages were found in the upper part of the cores: at 46 cm in core 778 and at 106 cm in core 780 (taking into account the missing sediment at the top), suggesting that recent SRs are relatively high. Such high rates, or an intense biological mixing, could explain why the sediment in box cores 778 and 780 does not show a 210Pb activity decrease.
Discussion
Environmental changes during the last 1800 years
Core 772, which is more homogeneous than the others, illustrates that sedimentation at this site has not been highly influenced by the climatic variations of the last 1800 years nor by hyperpycnal flows as no RDLs were observed in this core. The core location, farther from the coast than the others, explains the lack of notable variations. This area is less influenced by coastal processes, and the SR is lower than in coastal areas because of its more distal position. The stability of the mean grain size, the density, the magnetic susceptibility, and the Zr/Rb ratio show together that no significant grain-size variation is noticeable. However, the progressive trend observed in other properties from 50 cm to the top could highlight a modification of the sediment composition. The increase in the kARM/k ratio reflects a decrease in the magnetic grain size (Liu et al., 2012), which may not necessarily be highlighted by the mean sediment grain size. The notable increase in organic carbon content and the decrease in the L* value toward the top indicate a higher organic matter content in the uppermost 20 cm. This higher content can be related to organic matter degradation downcore and/or a recent increase in marine production as indicated by the increase in δ13C values (Meyers, 1997). These changes might be explained by the increasing duration of the ice-free season in southwestern Hudson Bay in the last few decades (Gagnon and Gough, 2005; Gough et al., 2004).
RDLs
The structure of the RDLs identified in cores 778 and 780 is typical of hyperpycnites, a type of deposit formed by a turbulent flow carrying a high load of particles making its density higher than the ambient density of the standing waterbody, that is, a hyperpycnal flow (e.g. Mulder and Syvitski, 1995; Mulder et al., 2003). These flows mainly occur during river floods caused by seasonal and/or catastrophic events, and the resulting hyperpycnite contains a reverse graded unit deposited during the waxing phase of the flood and a normal graded unit deposited during the waning phase of the flood (e.g. Mulder et al., 2003; St-Onge et al., 2004). Such floods in cold regions can occur during spring icebreaking, especially with the formation of ice jams (Beltaos, 2007; Prowse, 1994). In this case, the sediment concentration can greatly increase because of the increasing river flow, the higher water level, and the eroding effect of ice on the river bed and reaches (Prowse, 1993).
The Nelson River is not included in the ‘dirty rivers’ identified by Mulder and Syvitski (1995) which are rivers able to often generate hyperpycnal flows. However, Mulder and Chapron (2010) suggested that 71% of rivers discharging into the world oceans may generate a hyperpycnal flow every 1–100 years, exclusively during floods, depending on how clean they are. This percentage increases to 84% if we take into account the convective instability at river mouths (Parsons et al., 2001). Great rivers with a large drainage basin are not normally supposed to generate hyperpycnal flows because of the dilution of the sediment load and the existence of different climatic conditions over the basin (Mulder and Chapron, 2010; Mulder and Syvitski, 1995). However, before the construction of hydroelectric dams, the lower Nelson River had a 250 km long ice cover each winter (Rosenberg et al., 2005) that could form ice jams during the freezing or the breaking (Figure 10a; e.g. Jeffries et al., 2012; Prowse, 1994). The breaking of ice jams is more common if the seasonal advance of snowmelt runoff proceeds in a downstream direction (Prowse, 1994), which is the case of the Nelson River, flowing northeast. At the time of a major ice-jam failure, floods were generated by the retained waters. The erosion was accentuated by the floods, increasing the sediment concentration in the flowing water and, thus, this water became sufficiently dense to produce a hyperpycnal flow downstream (Figure 10b). Each hyperpycnite recorded in cores 778 and 780 (Figure 5) therefore most likely represents one important hyperpycnal flow of the Nelson River triggered by the breaking of a major ice jam (Figure 10a and b). The cores probably do not contain the signature of all the floods of this river but only the floods that can both create hyperpycnal flows and bring sediments to the core sites.

Representation of a river with (a) an ice jam, (b) a subsequent hyperpycnal flow, and (c) hydroelectric dams that prevent the floods.
On the other hand, the difference in hyperpycnites’ thickness from one core to another (Figure 6) shows an evolution in the deposits from the base to the top of the cores (Table 3). These changes may be because of differences in the flood magnitude: higher discharge and velocity can prevent deposition and cause erosion during the peak of the flood (Mulder et al., 2003). Such erosion is more likely to happen at the site of core 778, which is closer from the Nelson River mouth, than at the site of core 780, where the flood magnitude would be less important. Higher hyperpycnal flow intensities and erosion may thereby explain why hyperpycnites 7–11 are thinner in core 778 than in core 780. On the other hand, lower hyperpycnal flow intensities may have prevented erosion and thus created thicker deposits for hyperpycnites 1–3 in core 778.
In the case of core 776, only one layer was identified as an RDL. However, it does not contain a visible inverse-graded layer. This normal-graded layer could be a Bouma-like turbidite, but the fine sand at the base of the RDL suggests that it could be a hyperpycnite deposited by a high-magnitude hyperpycnal flow, which has eroded the waxing-phase layer (Mulder et al., 2003). The lack of other RDLs may be because of the distal location of the coring site and to the shape of the Churchill River estuary, which is enclosed and has a weir located at the upstream end (Kuzyk et al., 2008), unlike the open estuary of the Nelson River mouth. The lower discharge of the Churchill River compared with Nelson River (1350 vs 2240 m3/s, before dams) could also play a role in explaining why hyperpycnal flows did not reach the sampling site.
Impact of river damming on the Nelson River dynamics
Even if a precise chronology cannot be established, it is possible to reach some conclusion. First, most of the pelecypod shells used for 14C dating were sampled in the coarser part of the different hyperpycnites (Figure 5), suggesting that they were remobilized during the peaks of hyperpycnal flows. Only one shell, located at 241 cm in core 780 (266 cm after depth correction), seems to be in situ and has been dated at 174 cal. BP. This age suggests a SR of about 1 cm/yr, but this value is biased by the hyperpycnite layers that are assumed to be deposited almost instantaneously (St-Onge et al., 2012). However, all the identified hyperpycnites are situated below 67 cm in core 778 and 115 cm in core 780, above which the variations are much thinner and where there is no clear distinction between the layers and the background. This contrast suggests a major change in the sedimentary regime and thereby also in the Nelson River hydrodynamics. These transition depths are not far from the modern 14C ages found at a depth of 46 cm in core 778 and 106 cm in core 780. Despite a lack of precise chronological data, this suggests that this major change could have happened around 1950 when important anthropogenic modifications of the area occurred, that is, hydroelectric dams and the Churchill River diversion (Anctil and Couture, 1994; Newbury et al., 1984; Rosenberg et al., 2005).
Dams are well known for trapping sediments in their reservoirs, causing a decrease in sediment transport downstream (Vörösmarty et al., 2003). The thinner layers observed in the upper parts of both cores might therefore be related to less sediment availability for transport. However, the 210Pb data, which do not show any decreasing trend, and the thickness of the upper parts above modern 14C ages suggest that the SR was still relatively high in the last decades and did not change much with damming. It is possible that the Churchill River diversion, which has increased the Nelson River flow (Déry et al., 2011; Prinsenberg, 1980), may have offset this impact of damming by carrying more sediment toward the river mouth. On the other hand, the hydroelectric dams built on the Nelson and Churchill Rivers allow a continuous control of their flow, causing a regulation of their hydrograph (Anctil and Couture, 1994) and preventing the progressive natural river icing and damming (Rosenberg et al., 2005; Figure 10c). Moreover, the control of the river flow prevents high discharge that might trigger ice-jam flooding downstream and the formation of hyperpycnal flows (Beltaos, 1995; Jeffries et al., 2012). These anthropogenic controls of river hydrology are thereby a possible explanation for the absence of relatively thick hyperpycnites in the upper/younger parts of cores 778 and 780. The high-frequency variations observed in these upper parts may be because of smaller ice jams that can still occur downstream from the Limestone Generating Station (North/South Consultants, Inc., 2012). These thinner upper layers might also be caused by sediment flushing or sluicing that is used to increase the lifetime of reservoirs with high SRs (Brandt, 2000).
Conclusion
The physical, chemical, and magnetic properties of sediment cores sampled near the Churchill and Nelson river mouths allowed identification of the impact of damming on the river flow and sediment dynamics. Dam construction on the Nelson River in the 1960s may have changed sediment dynamics downstream by preventing the formation of major ice jams. Prior to this installation, major ice jamming often occurred on the lower Nelson River during the ice breakup and spring freshet. The breaching of such ice jams triggered river floods and increased erosion of the reaches, allowing the formation of hyperpycnal flow during floods. The signature of these floods can be recognized in the lower parts of cores 778 and 780, both sampled near the Nelson River mouth: they contain RDLs identified as hyperpycnites. The upper parts, however, do not show such structures. Despite the lack of precise chronology, modern 14C ages in both cores suggest that the transition toward the upper part of the cores could be concurrent with the dam construction on the Nelson River. The dams allow a control of the floods and reduce the downstream transport of ice, preventing major ice-jam formation and hyperpycnal flows. The Churchill River ends in an enclosed estuary that may reduce the offshore impact of floods and could explain the absence of more than one hyperpycnite in core 776, which also covers a shorter time period than the other cores. Finally, core 772, sampled 200 km offshore, is relatively homogeneous and is used as a reference core without major river influence. To obtain a longer record of past flood events, new cores could be sampled directly in the river mouth, especially in the enclosed estuary of the Churchill River.
Footnotes
Acknowledgements
We wish to thank the captain, officers, and crew of the BaySys 2012 expedition on board the CCGS Pierre Radisson. We also thank J Labrie, M-P St-Onge, E Barris, Q Beauvais, S Leblanc, and M Babin for their help in the laboratory; G Desmeules for his help on board the CCGS Pierre Radisson; and A Normandeau for his help in the selection of the coring sites.
Funding
This study is funded through research grants from ArcticNet and NSERC to GS and PL, as well as a graduate scholarship to QD from the GEOTOP research center.