



Abstract
Boxcore 99LSSL-001 from the southwest Canadian Arctic Archipelago (68.095°N, 114.186°W), studied by multiproxy approaches (sea-ice diatom biomarker IP25, phytoplankton-based biomarker brassicasterol, biogenic silica, total organic carbon, dinoflagellate cysts = dinocysts, diatoms) and their applications (sea-ice index PBIP25, modern analogue technique (MAT) transfer functions), provides a chronologically constrained (210Pb, 137Cs, two 14C dates) palaeoenvironmental archive spanning AD 1625–1999 with which to compare and evaluate proxies frequently used in sea-ice reconstructions. Whereas diatoms are rare, PBIP25, biogenic silica and qualitative dinocyst approaches show good agreement, suggesting that palaeo sea-ice histories based on biomarker and microfossil techniques are robust in this region. These combined approaches show fluctuating long open water to marginal ice zone conditions (AD 1625–1740), followed by high-amplitude oscillations between long open water and extended spring/summer sea ice (AD 1740–1870). Greater ice cover (AD 1870–1970) precedes recent reductions in seasonal sea ice (AD 1970–1999). Dinocyst-based MAT, however, produces a low-amplitude signal lacking the nuances of other proxies, with most probable sea-ice reconstructions poorly correlating with biomarker-based histories. Explanations for this disagreement may include limited spatial coverage in the modern dinocyst distribution database for MAT and the broad environmental tolerances of polar dinocysts. Overall, PBIP25 provides the most detailed palaeo sea-ice signal, although its use in a shallow polar archipelago downcore setting poses methodological challenges. This proxy comparison demonstrates the limitations of palaeo sea-ice reconstructions and emphasizes the need for calibration studies tying modern microfossil and biogeochemical proxies to directly measured oceanographic parameters, as a springboard for robust quantitative palaeo studies.
Introduction
Sea ice plays a fundamental role in the Earth’s climate system via albedo, ocean circulation and deep-water formation (McPhee et al., 2009; Morison et al., 2012; Thomas and Dieckmann, 2010; Vancoppenolle et al., 2013; Vaughan et al., 2013). Indeed, the recent decrease in Arctic sea ice has raised considerable concerns because of its wide-ranging implications for lower latitudes through climate inter-linkages and feedback mechanisms (ACIA, 2005; Bhatt et al., 2014; Collins et al., 2013). However, in order to contextualize modern and recent sea-ice decline, long-term data are needed beyond the time scale of instrumental measurements (post ~1970s). Proxies preserved in marine sediments provide such indirect measurements of sea-ice variability, as inferred from sedimentology (e.g. ice-rafted detritus), micropalaeontology and biogeochemistry (De Vernal et al., 2013a; Polyak et al., 2010). Micropalaeontological approaches to reconstructing palaeo sea-ice histories (De Vernal et al., 2013a) include assemblage analysis of diatoms (Gersonde et al., 2005), ostracods (Cronin et al., 2010), foraminifera (Jennings et al., 2002) and dinoflagellate cysts (‘dinocysts’; De Vernal et al., 2013b; Matthiessen et al., 2005). The geochemical signal in some of these groups can also be used to trace sea ice, as demonstrated by δ18O in foraminiferal tests (Hillaire-Marcel and De Vernal, 2008). Quantitative reconstructions of environmental parameters (e.g. sea-surface temperature (SST), salinity and sea-ice cover (SIC)) have been derived from a variety of methods (Birks et al., 2010), including the application of the modern analogue technique (MAT) to dinocysts. MAT reconstructions, based on the premise that similar dinocyst assemblages occur under similar environmental conditions, rely on a reference database that links dinocyst assemblages quantitatively to sea-surface parameters including the seasonal extent of SIC (De Vernal et al., 2013a, 2013b).
A relatively new spring/summer sea-ice proxy is IP25, a C25 mono-unsaturated highly branched isoprenoid alkene biomarker produced by a few sea-ice diatom taxa (mostly Haslea spp.) inhabiting brine channels within first-year ice (Belt et al., 2007, 2012; Brown et al., 2014). Sea-ice melting releases IP25-producing diatoms to the water column, to accumulate in seabed sediments (Belt et al., 2007; Müller et al., 2011). Although diatoms are prone to dissolution and selective preservation (Bidle and Azam, 1999; Leventer, 1998; Ragueneau et al., 2000; Shemesh et al., 1989), IP25 preserves well in the sedimentary record, is resistant to degradation and detectable and stable on scales of thousands to millions of years (Knies et al., 2014; Stein et al., 2016; Stein and Fahl, 2013; Vare et al., 2009). However, reduced IP25 concentrations can be equivocally interpreted as indicative of perennial sea-ice or open water conditions (Müller et al., 2011). Therefore, other phytoplankton-based biomarkers (brassicasterol and/or dinosterol produced by open water diatoms, coccoliths and dinoflagellates; cf. Volkman et al., 1998, but see Navarro-Rodriguez et al., 2013 and Xiao et al., 2015 for a discussion on brassicasterol and its sources) have been used to validate IP25-based sea-ice reconstructions, in a ratio with sea-ice diatom biomarkers (IP25), known as PIP25 (Belt and Müller, 2013; Müller et al., 2011). A minimal (to zero) IP25 flux with elevated phytoplankton biomarkers is considered indicative of near-ice-free spring/summer conditions, whereas the absence of both biomarkers suggests permanent ice cover. The variable presence of both biomarkers reflects changing seasonal SIC (Belt and Müller, 2013; Müller et al., 2011).
Reliable quantitative sea-ice reconstructions are a priority in polar regions such as the Arctic (De Vernal et al., 2013a; Polyak et al., 2010), not only because they provide a long-term context for current sea-ice decline, but also because they offer an extended data set necessary for accurate model simulations of future and projected climate scenarios (Collins et al., 2013). Such confident application, however, requires a critical appraisal and assessment of correspondence between different sea-ice proxies, such as diatom assemblages, PIP25 and microfossil-based transfer functions using MAT. Here, we assess the agreement between various sea-ice proxies based on biogeochemistry and micropalaeontology, namely, IP25 and PIP25 (PBIP25), dinocyst assemblages and dinocyst-based MAT. Such an appraisal is aided by comparisons with other palaeoenvironmental proxies (biogenic silica, total organic carbon (TOC) and diatoms). To accomplish this, we use a decadal-scale late-Holocene boxcore record from the Northwest Passage (Figure 1), which has previously been described for sedimentological characteristics and organic-walled microfossils (Pieńkowski et al., 2011). Core 99LSSL-001 (Figures 1 and 2) is well dated and represents an ideal archive with which to test palaeoenvironmental interpretations and sea-ice reconstructions derived from differing proxies. This study represents the first of its kind in the Canadian Arctic Archipelago (CAA) and has direct and important implications for marine geological, palaeoceanographic and palaeoenvironmental studies from this crucial region at the intersection between Arctic and Atlantic oceans.
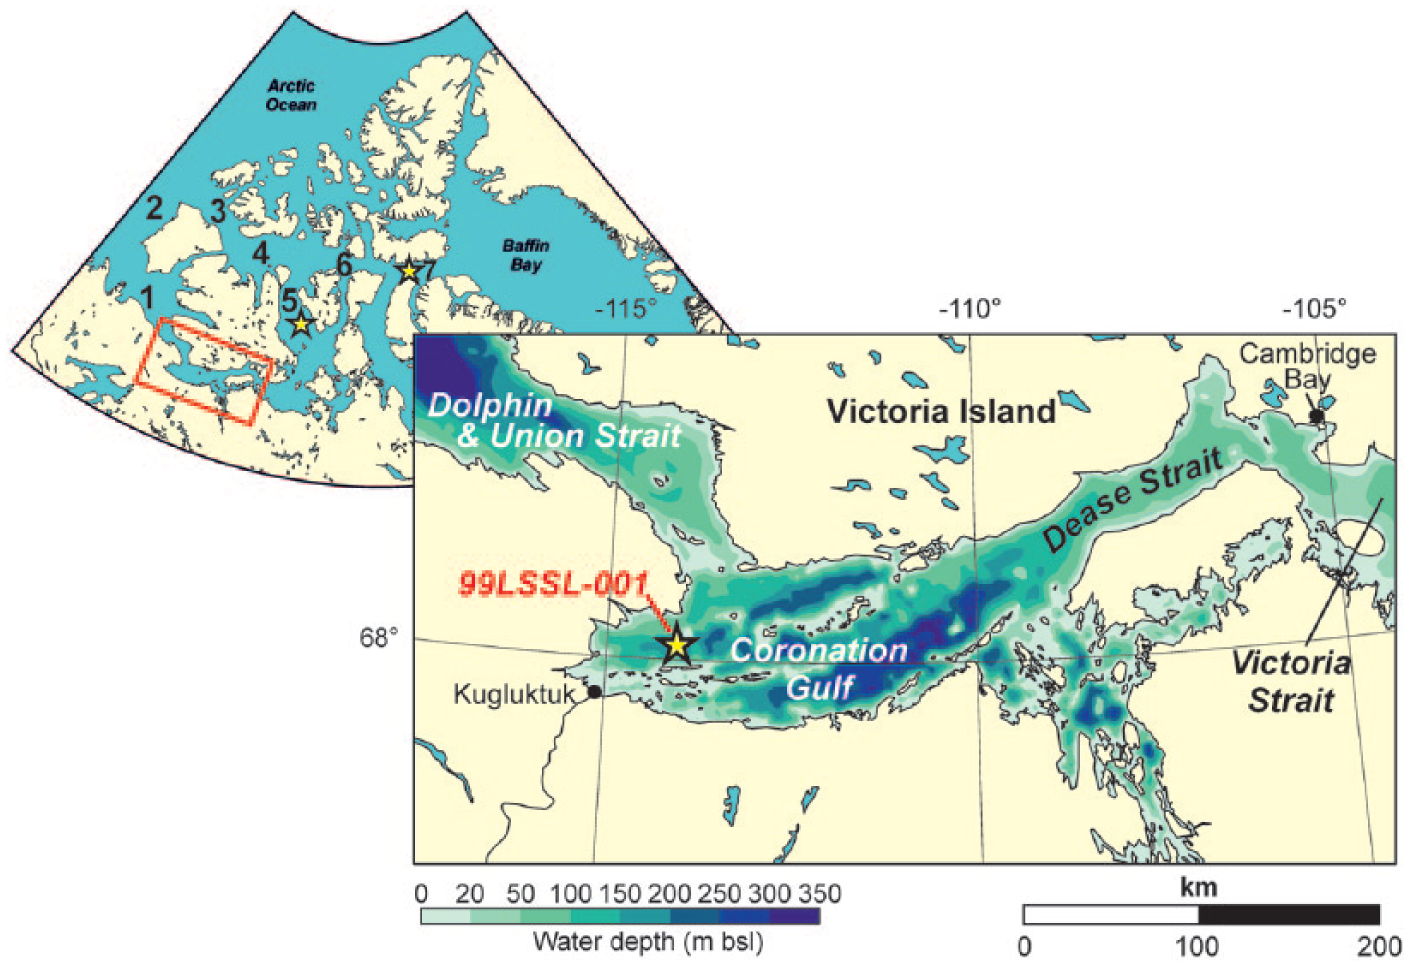
Map of locations mentioned in the text, including study area in Coronation Gulf and core site 99LSSL-001. Surface sediment sampling locations in M’Clintock Channel (station 2011804-003) and Lancaster Sound (station 2011804-009) are shown by stars. 1 = Amundsen Gulf, 2 = Beaufort Sea, 3 = M’Clure Strait, 4 = Viscount Melville Sound, 5 = M’Clintock Channel, 6 = Barrow Strait, 7 = Lancaster Sound and 3–7 = Parry Channel.

Lithostratigraphy, chronostratigraphy and age–depth model of core 99LSSL-001. Note that the age–depth model has been revised from Pieńkowski et al. (2011) and represents a linear extrapolation of 210Pb and 137Cs ages, supported by two radiocarbon dates (Table 1).
Materials and methods
Study site, core materials and previous analyses
This study is based on boxcore 99LSSL-001 collected from Coronation Gulf at 68.095°N, 114.186°W in 211 m water depth (recovered 1999 aboard CCGS Louis S. St-Laurent). The study site and its environmental setting have been described in detail by Pieńkowski et al. (2011). Based on 30 years of satellite data (AD 1981–2010; Canadian Ice Service, 2011), the area is dominated by landfast first-year ice from early November onwards with a minimal presence of multiyear ice. Spring break-up commences in the west of the Gulf from early to mid-July, ice retreating northeastwards to a relatively stable ice margin in southern M’Clintock Channel by late August. As with other Arctic regions, the Western CAA has shown considerable interannual variability in sea-ice extent and seasonal duration over the past four decades, superimposed on a long-term pattern of sea-ice reduction (Canadian Ice Service, 2011; Fetterer et al., 2002; Vaughan et al., 2013). Oceanographic data are extremely limited for the area. Summer salinities of ~22 are shown in the top 10 m, increasing to ~27 below this depth and influenced by freshwater input from the nearby Coppermine River. August water temperatures measure ~6°C in the surface layer to ~0°C below 50 m depth (McLaughlin et al., 2009). Arctic Ocean surface water enters Coronation Gulf from the Beaufort Sea and Amundsen Gulf via the shallow (20–30 m) Dolphin and Union Strait, en route to Baffin Bay (Ingram and Prinsenberg, 1998).
The composite 99LSSL-001 record (immediately adjacent push cores 001E and 001F from the same boxcore correlated to the nearest 0.5 cm by lithostratigraphy, Pieńkowski et al., 2011) consists entirely of clayey silt. These materials were refrigerated during transport and subsequent curation at the Geological Survey of Canada – Atlantic (GSC-A), Dartmouth, Nova Scotia, Canada. The two push cores were split and described in 2001 and exclusively subsampled for micropalaeontology, biogeochemistry and geochronology in 2005. Materials used for IP25 and brassicasterol analysis were freeze-dried immediately on subsampling and stored in cool, dry and dark conditions prior to investigation.
Stratigraphic, sedimentological, some biogeochemical (TOC, total inorganic carbon (TIC)) and organic-walled microfossil (dinocysts and other non-pollen palynomorphs, pollen and spores) characteristics have been previously described in detail by Pieńkowski et al. (2011). A further suite of TIC/TOC analyses were obtained for additional depths investigated for biomarkers that had not been analysed previously. Dried (60–65°C) and powdered TIC/TOC samples were digested in 10% hydrochloric acid and repeatedly rinsed with deionized water prior to secondary oven-drying (60–65°C) and grinding. A LECO CHN analyser (model #630-100-400) was used on 100 mg subsamples for subsequent TOC measurement with values presented as weight percentages. TOC is here used as a crude indicator of palaeoproductivity (and not directly primary productivity or sea ice), it being a function of autochthonous and allochthonous organic matter sources (marine surface, water column and benthic sources, along with terrestrial inputs).
Additionally, biogeochemical data (TOC, biomarkers) were derived from two surface sediment samples (0–1 cm from boxcores; Figure 1) in M’Clintock Channel (2011804-003BC; 71.701°N 101.702°W) and Lancaster Sound (2011804-009BC; 74.122°N 83.409°W) for comparison with the Coronation Gulf record.
Geochronology
A revised age–depth model based on previously published (Pieńkowski et al., 2011) 14C, 210Pb and 137Cs for boxcore 99LSSL-001 is used in this study, superseding that of Pieńkowski et al. (2011). Details of 210Pb, 137Cs and 226Ra methodology and analyses are presented in Pieńkowski et al. (2011). Note that the lead and caesium chronologies suggest minimal bioturbation and mixing as evidenced by the initial appearance of measurable 137Cs (>1.5 Bq kg−1) at a 210Pb date of AD 1950. For this study, all existing 14C dates were newly calibrated in Calib 7.1 (Stuiver et al., 2015) in conjunction with the Marine13 calibration curve (Reimer et al., 2013) and a ΔR of 335 ± 85 (Coulthard et al., 2010). Based on two rather than three radiocarbon dates (Table 1) and the existing 210Pb and 137Cs chronologies, the new age–depth model is a linear one
Details of radiocarbon dates used in this study. A ΔR of 335 ± 85 years (Coulthard et al., 2010) was used for date calibration. Note that the date in grey was excluded from age–depth model construction (Figure 2).

Biogeochemistry
Biomarker analyses encompassed IP25 and brassicasterol (24-methylcholesta-5,22E-dien-3β-ol) of both downcore (n = 25, sampling interval 1–2 cm) and surface samples (n = 2), with preparation following Belt et al. (2012). Note that brassicasterol (opposed to dinosterol) is adopted in this study as the open water component of PIP25 (thus PBIP25), as it represents a reliable proxy for open water conditions in the Arctic Ocean, yielding similar results to dinosterol-based PDIP25 (Müller et al., 2011). Sample preparation comprised the addition of 10 µL of internal standard (9 octylheptdec-8-ene and cholesterol-d6) to samples (1 g of freeze-dried sediment) and a blank, followed by addition of 3–4 mL of DCM/methanol in 2:1 and ultrasonication and centrifugation to separate the supernatant. This procedure was repeated three times in total. The collected supernatant was evaporated under passive flow of nitrogen. Extracted samples were purified by column chromatography using n-hexane and methyl acetate: n-hexane (20:80 v/v).
The extracted sediment samples were purified prior to quantification by gas chromatography–mass spectrometry (GC-MS) using silica column chromatography, along with separation of hydrocarbons and sterols using 6 mL of n-hexane and ethyl acetate: n-hexane (20:80 v/v), respectively. The hydrocarbon fraction was evaporated to dryness, reconstituted in 250 µL of hexane and analysed by GC-MS (Agilent 6890N GC with 5975C MSD). Sterols consisting of brassicasterol and cholesterol-d6 (internal standard) were silylated with 500 µL BSTFA (60°C, 1 h), followed by GC-MS analysis. An Agilent HP-5ms column (30 m × 0.25 m × 0.25 m) was used for both sterols and hydrocarbons with 1 µL of sample splitless injection. A consistent flow of helium was maintained at a rate of 1 mL min−1 with oven temperature increasing from 40 to 300°C at 10°C min−1 for hydrocarbons. For sterols, GC oven was heated from 60 to 150°C at 15°C min−1 and then at 3 to 320°C min−1.
The IP25 peak was identified by running selected samples with data acquisition achieved by selective ion monitoring (monitoring molecular ion m/z 350 and major IP25 fragments m/z 280 and 266). The mass spectra (Figure 3) of the biomarker were also compared with published data (Belt et al., 2007). Following identification of IP25 peak retention time, based on the mass spectrum from selected ion monitoring, samples were routinely analysed via total ion chromatogram mode. To unambiguously identify the IP25 peak, m/z 350, 280, 266 and 140, characteristic ions were extracted from the total ion chromatogram. Following confirmation of the IP25 peak, quantification was carried out by the ratio of the integrated peak areas of IP25 and 9 octylheptdec-8-ene internal standard from the total ion current, multiplied by the response factor and mass of internal standard and divided by the mass of sediment for each sample. This approach is consistent with that of Belt et al. (2012). For sterols, the characteristic mass spectrum peaks of brassicasterol and cholesterol-d6 (for use as internal standard) were determined by analysis of pure standards, with the integrated peak areas from the total ion current used to calculate the response factor. In the samples, the brassicasterol peak was identified by extraction of characteristic m/z 470, 380, 341 and 255 ions from the total ion chromatogram. Quantification of brassicasterol was achieved by taking a ratio of brassicasterol in relation to cholesterol-d6 internal standard peak from the total ion current chromatogram, multiplied by concentration of cholesterol-d6 and the response factor.
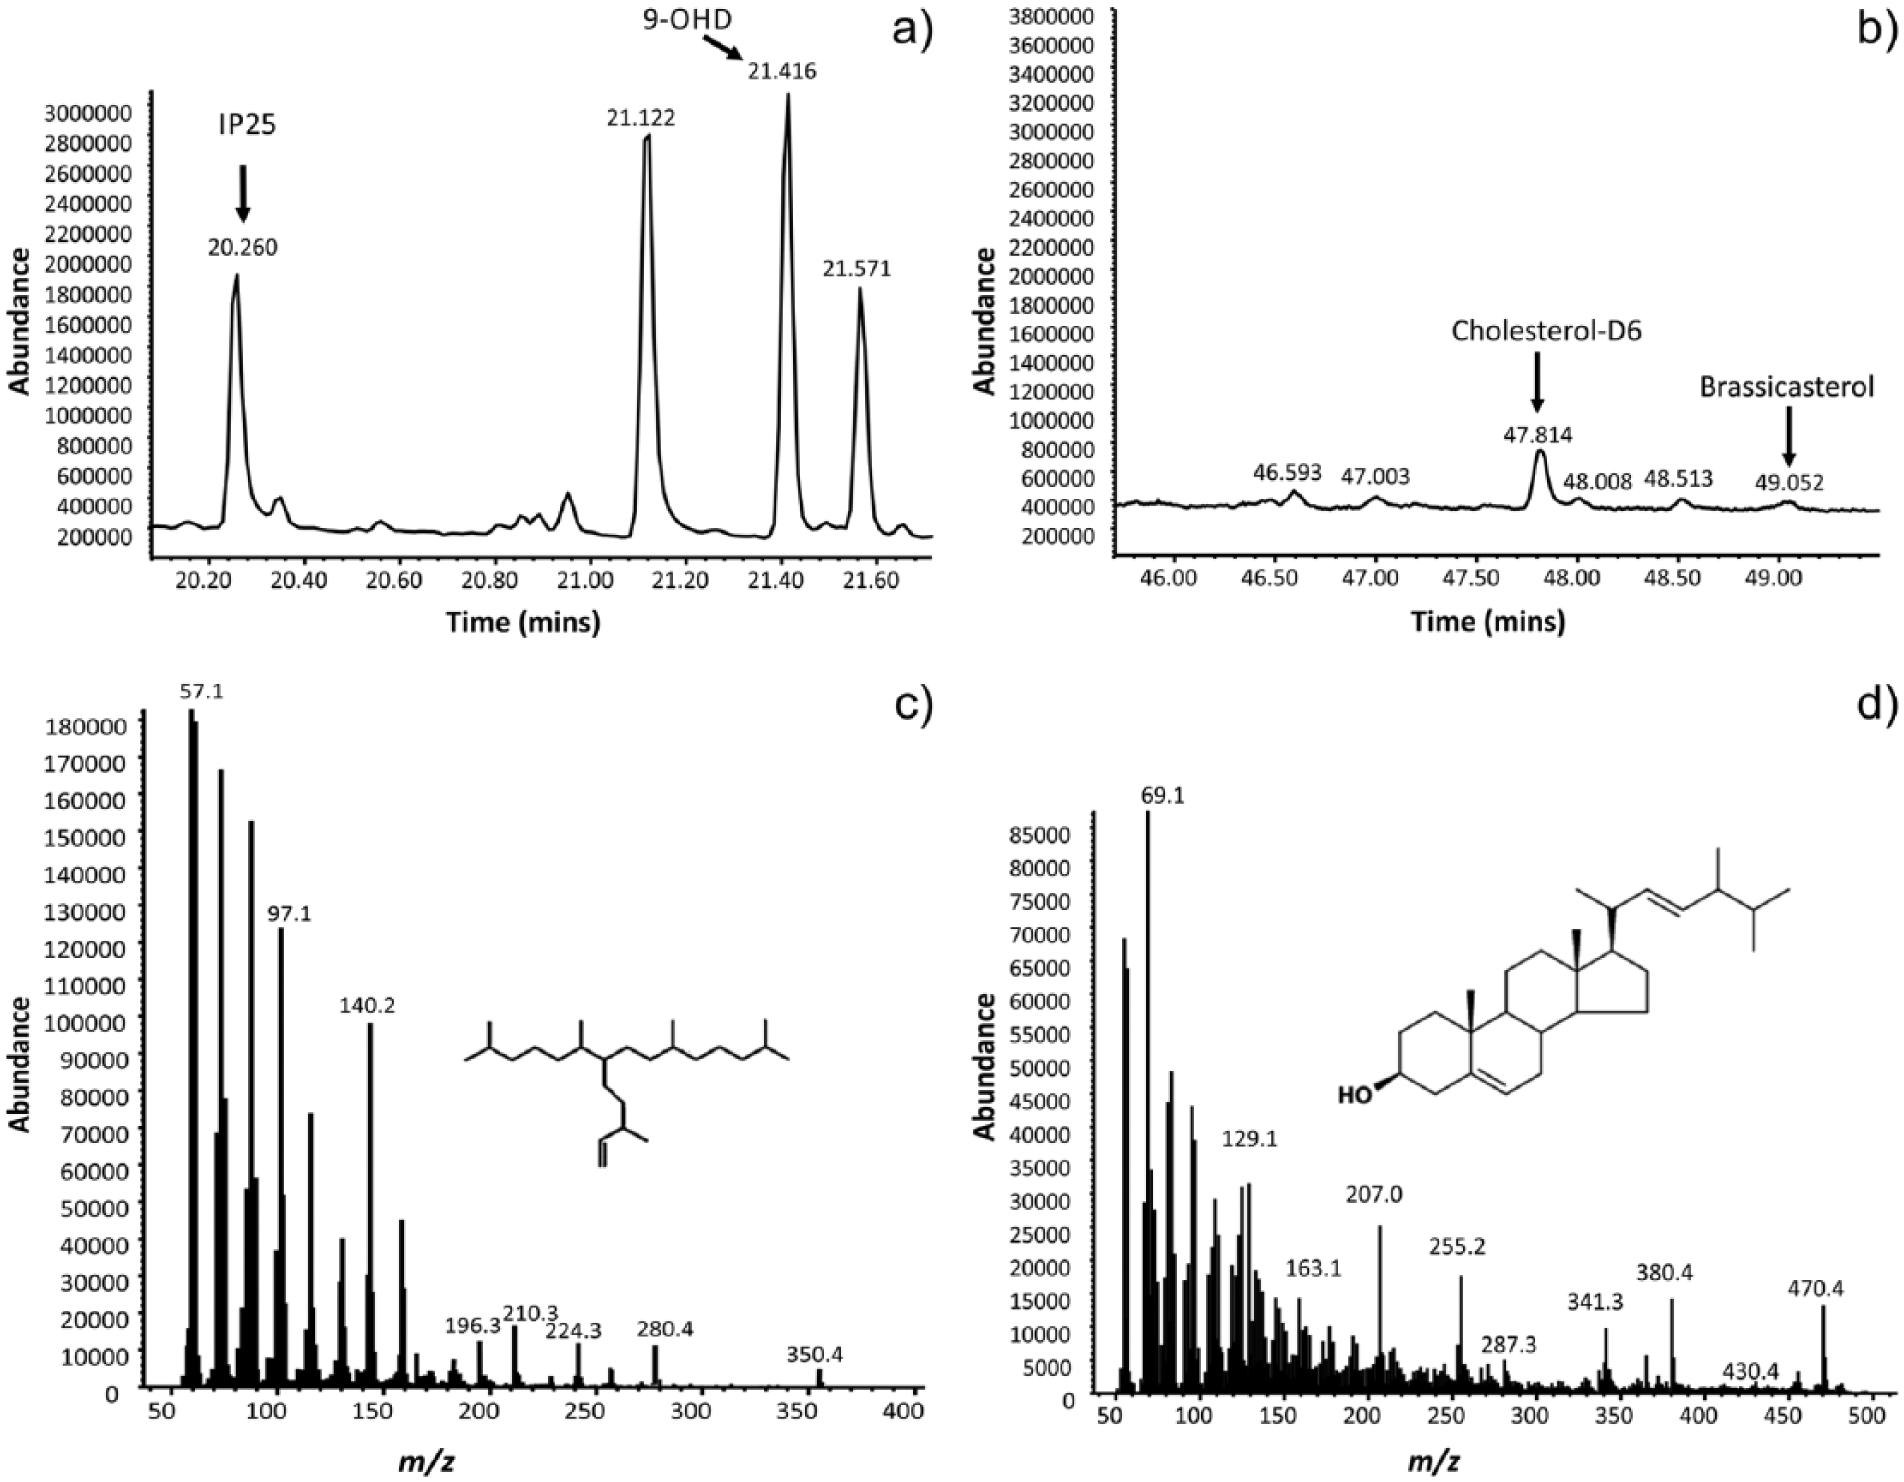
Selected GC chromatograms and mass spectra of biomarkers used in this study: (a) representative portion GC total ion chromatogram of hydrocarbons, including IP25; (b) representative portion of GC total ion chromatogram of sterols, including brassicasterol; (c) selected mass spectrum of IP25; and (d) selected mass spectrum of brassicasterol.
Palaeo-fluxes of IP25 and brassicasterol were calculated from measured concentrations using the total sedimentation rate and water content and volume data of the sediment (Eq. 1).

where Fluxbiomarker is the biomarker flux (µg cm−2 a−1), Stotal is the total sedimentation rate (cm a−1) from the age–depth model and Cbiomarker is the biomarker concentration (µg wet cm−3 sediment, µg cm−3).
For comparison with values from surface sediments from the northern North Atlantic (Müller et al., 2011) and those from the CAA (this study), measured IP25 and brassicasterol concentrations were also normalized to TOC (µg g−1 organic carbon (OC); TOC values from Pieńkowski et al., 2011 and additional measurements for this study).
PBIP25 was calculated using both normalized to TOC and flux-based IP25 and brassicasterol values, using Eq. 2, after Müller et al. (2011).

where c is the balance factor, the mean TOC-normalized IP25 concentration/mean TOC-normalized brassicasterol concentration (when dealing with TOC-normalized PBIP25) or mean IP25 flux/mean brassicasterol flux (in the case of flux-based PBIP25).
According to Müller et al. (2011), the ratio of biomarkers produced by open water algae to those generated by sea-ice diatoms can be used to elucidate spring/summer sea-ice environments. A PBIP25 of >0.75 denotes extended sea-ice conditions with a lasting spring/summer ice cover, whereas a ratio of 0 signifies year-round ice-free conditions. PBIP25 ratios between 0.75 and 0.50 (~0.65) characterize the ‘marginal ice zone’ (MIZ; relatively stable spring/summer ice edge), whereas those between 0.50 and 0.10 (~0.25) can be interpreted as variable or less sea ice (a short sea-ice season). Xiao et al. (2015), however, consider values 0.40–0.70 to be ‘indeterminate’.
Sediment sample (n = 20, sampling interval 1–2 cm) preparations for biogenic silica (BioSil; SiO2) included oven-drying (45°C) and powdering by pestle and mortar. Measurements were conducted at the Pacific Centre for Isotopic and Geochemical Research (University of British Columbia) following Mortlock and Froelich (1989). BioSil concentrations (% by dry weight) are also given as fluxes per calendar year (mg cm−2 a−1), based on a sedimentation rate of 0.12 cm a−1 derived from the age–depth model (Figure 2). Note that BioSil, in this context, is used only as an indirect indicator of primary productivity, being considered a reliable proxy for siliceous microfossil abundance (primarily diatoms in this study) in sediments (Conley and Schelske, 2001) and subject to a variety of complicating factors including significant dissolution within the water column (Ragueneau et al., 2000).
Micropalaeontology
Preparation of samples for diatom analysis (n = 20; sampling interval 2–4 cm) involved digestion in 10% hydrochloric acid to remove calcareous matter, followed by treatment with 30% H2O2 (1–2 h in a 60°C water bath) to digest organic matter, with repeated rinsing with deionized water between and after acid treatments (Battarbee et al., 2001). Sample dilutions were pipetted onto coverslips and air-dried and subsequently mounted in Naphrax™ (refractive index 1.73). Identification of diatoms was carried out by high-power microscopy (×1000) following Witkowski et al. (2000) and Caisse (2012). Although it was aimed to count a statistically valid number of diatoms (400), none of the samples investigated contained sufficient diatoms – typically <20 per slide. Consequently, diatoms only contribute peripherally to the palaeoenvironmental assessments in this study.
Details of sample preparations for, and taxonomy of, dinocyst assemblages (n = 30; sample interval 0.5–2 cm) have been previously published (Pieńkowski et al., 2011). Briefly, preparation followed standard protocols (known volumes and weights of samples sieved at 10 µm followed by digestion in 10% HCl and 49% HF followed by sieving at 10 µm; Marret and Zonneveld, 2003) with a minimum of 300 dinocysts counted from each sample. Taxonomy followed Head et al. (2001), Kunz-Pirrung et al. (2001) and Marret and Zonneveld (2003). Dinocyst data were used for quantitative reconstructions of SSTs, sea-surface salinities (SSSs) and sea ice, based on MAT (Guiot and De Vernal, 2007, 2011), which compares fossil dinocyst data with a modern distribution reference database (n = 1492 sites; De Vernal et al., 2013c). MAT was chosen over techniques such as WA-PLS, as it has been the main quantitative approach to palaeoceanographic reconstructions in the region (e.g. Ledu et al., 2008, 2010). Dinocyst taxa were grouped according to De Vernal et al. (2013c) prior to running MAT transfer functions in the software ‘R’, using the World Ocean Atlas as a reference for modern sea-surface conditions (De Vernal et al., 2013c; Guiot, 2011). Dinocyst data for the ‘R’ program were log-transformed in order to account for less abundant species in the assemblages, prior to statistical analysis for quantitative reconstructions. Five analogues were used for the reconstructions presented here, based on the previous trials of Guiot and De Vernal (2011), with an accuracy of ±1.14°C for winter SSTs, ±1.62°C for summer SST, ±2.08 for winter SSSs, ±2.28 for summer SSSs, ±1.42 months for SIC, ±1.11/10 for sea-ice concentration and ±56.75 g cm−3 yr−1 for primary productivity. The calibration of the modern database of n = 1492 sites has demonstrated no correlation between the different abiotic parameters (Guiot and De Vernal, 2011), suggesting that the reconstructed parameters are independent of each other. Although biogeographical studies have demonstrated that (abiotic) oceanographic parameters are the main drivers for dinocyst distributions (e.g. Marret and Zonneveld, 2003), it should be noted that other additional (possibly biological) factors may also play a role.
Note that no quantitative assessment of foraminifera was undertaken, as reconnaissance for radiocarbon dating showed extremely low-to-absent foraminiferal faunas, apart from those used for dating.
Results and palaeoenvironmental interpretations
Biogeochemistry
TOC fluxes ranges from 0.16 to 1.32 mg cm−2 a−1 (mean = 0.58 mg cm−2 a−1; Figure 4). Relative to the mean, fluxes are low prior to AD 1840. Values of the 20th century are greater, with marked high to low fluctuations. BioSil fluxes range from 0.58 to 3.54 mg cm−2 a−1 (mean = 2.20 mg cm−2 a−1; Figure 4), demonstrating a similar pattern to that seen in the TOC record. Prior to AD 1840, values remain below the mean, followed by an interval of high but variable BioSil fluxes in the 20th century.

Results of biogeochemical analyses on core 99LSSL-001. Note that fluxes (where applicable) are based on the revised age–depth model (Figure 2). Absolute concentrations of IP25 and brassicasterol are shown (in grey) on the same graphs as concentrations normalized to TOC. Error margins around flux curves are those calculated based on 10% confidence interval surrounding the 210Pb and 137Cs chronology. PIP25 sea-ice regimes are those of Müller et al. (2011).
Temporal variations in brassicasterol (Figure 4) are overshadowed by two prominent spikes in flux ca. AD 1850 (1.03 µg cm−2 a−1) and ca. AD 1985 (0.85 µg cm−2 a−1). When the record is examined without these excursions, patterns are similar to TOC and biogenic silica fluxes, with relatively low, though fluctuating, values (0.01–0.06 µg cm−2 a−1) until AD 1900 and higher fluxes in the AD 1930s and 1940s (0.11–0.12 µg cm−2 a−1). The sea-ice diatom biomarker IP25 (Figure 4) also shows two prominent peaks in flux: one in the AD 1850s (0.05 µg cm−2 a−1) and another in the AD 1960s (0.08 µg cm−2 a−1). Similar to the brassicasterol flux, these high points somewhat obscure the rest of the record. IP25 fluxes are generally low (though fluctuating; 0.001–0.014 µg cm−2 a−1) until AD 1840, followed by relatively high values to the core top (0.009–0.077 µg cm−2 a−1). Absolute (per dry g) and TOC-normalized (per g OC) concentrations of IP25 and brassicasterol follow the same patterns as seen in biomarker fluxes (Figure 4). IP25 absolute concentrations typically vary between 0.012 and 0.208 µg g−1, with two major excursions to 0.463 and 0.405 µg g−1 (AD 1850s and 1860s, respectively). Absolute brassicasterol concentrations generally range between 0.076 and 0.760 µg g−1, although again two notable peaks are present (AD 1850s: 9.268 µg g−1; AD 1980s: 6.958 µg g−1). Biomarker concentrations normalized to TOC (Figure 4) generally lie between 2.0 and 33.0 µg g−1 OC for IP25 and between 12.5 and 123.0 µg g−1 OC for brassicasterol. The two high concentration peaks seen in the absolute values are also apparent in the TOC-normalized data (IP25: AD 1850s, 64.304 µg g−1 OC; AD 1960s, 109.961 µg g−1 OC. Brassicasterol: AD 1850s, 1288.477 µg g−1 OC; AD 1980s, 881.074 µg g−1 OC).
In core 99LSSL-001, flux-based PIP25 (PBIP25) shows conditions modulating between reduced and extended seasonal sea-ice duration. This variability is superimposed upon longer term trends more clearly visible in a three-point running mean of the PBIP25 data (Figure 4). Taken together, this illustrates an interval from the start of the record until ca. AD 1740 characterized by an environment fluctuating between longer spring/summer open water conditions and the high-productivity MIZ. Subsequently, the period AD 1740–1870 is marked by dramatic swings between the lasting spring/summer ice conditions of the extended seasonal sea-ice zone and a longer spring/summer open water season. The co-occurring high-magnitude peaks in brassicasterol and IP25 in the mid-1850s result in a markedly low PBIP25 value consistent with reduced SIC. Notably, however, the PBIP25 reconstruction suggests no MIZ conditions in this interval, although the three-point running mean averages the fluctuations to such conditions. Post AD 1870, the PBIP25 data suggest more extensive spring/summer ice, with marked oscillations between the MIZ and extended seasonal sea ice. Less-to-no spring/summer sea ice is implied from AD 1970 onwards (Figure 4).
Micropalaeontology
Unfortunately, diatoms were too sparse to enable a quantitative analysis of the Coronation Gulf record, even when residues were mounted in high concentration (>40%), although plenty of diatom fragments (girdles in particular) are present throughout the samples. Nevertheless, the occurring diatoms (although low in species diversity) are all species affiliated with high-latitude environments characterized by seasonal sea ice. These include the large (>100 µm) centric Actinocyclus curvatulus, an indicator of cold, stratified waters which has been previously found on Arctic sea ice (Hasle and Syvertsen, 1996) and in the MIZ (Von Quillfeldt et al., 2003), as well as Diploneis smithii, a generalist and cosmopolitan taxon previously reported from the Russian Arctic (Bauch and Polyakova, 2000). Several species of the MIZ diatom genus Fragilariopsis (Von Quillfeldt et al., 2003), for example, F. oceanica, were present throughout the core. Although abundant Fragilariopsis spp. have been interpreted as indicative of sea ice (e.g. Katsuki and Takahashi, 2005), the low number of diatom specimens found here precludes any such assessment. Notable other siliceous microfossils found in all diatom samples were silicoflagellates (?Distephanus speculum) which have previously been reported from the Arctic Ocean (Takahashi et al., 2009).
Details of dinocyst assemblage results have been presented by Pieńkowski et al. (2011). A total of 14 species and 24 other taxa (morphotypes, species complexes) of dinocysts are present, with absolute abundances ranging from 1550 to 3990 cysts g−1 (Figure 5). Assemblages are dominated by the heterotrophs I.? cezare and E. karaense, both prominent taxa in polar waters covered by extended seasonal sea ice (De Vernal et al., 2013b; Head et al., 2001; Matthiessen et al., 2005), and the autotrophic and cosmopolitan Operculodinium centrocarpum sensu Wall and Dale (1966) (note that various O. centrocarpum morphotypes (Arctic, truncate and cezare) are present at very low relative abundances; together with O. centrocarpum sensu Wall and Dale (1966), these forms are grouped as O. centrocarpum s.l.), alongside the species complex Brigantedinium spp. produced by several heterotrophic species (Zonneveld et al., 2013). Overall, heterotrophic dinocysts (⩾40%) are proportionally more abundant than autotrophic ones throughout the core. The record is characterized by three prominent dinocyst intervals (Figure 5). From the start of the record until AD 1840, O. centrocarpum sensu Wall and Dale (1966) dominates the dinocyst populations (⩾25%), alongside the heterotrophs Brigantedinium spp., I.? cezare and E. karaense, and elevated abundances of Spiniferites elongatus/frigidus. Consequently, the autotrophic proportion is elevated to as much as 40%. Thereafter (AD 1840–1960), the proportions of autotrophs, dominated by O. centrocarpum sensu Wall and Dale (1966), are much reduced (⩽10%), and I.? cezare and E. karaense become more prominent. From AD 1960 until the core top (AD 1999), the dinocyst assemblages see a dramatic rise in O. centrocarpum s.l. (max. 60% relative abundance) and a pronounced drop in I.? cezare, E. karaense and I. minutum. Overall, these data are interpreted as extended seasonally open water AD 1630–1840, followed by severe SIC AD 1840–1960 and, finally, reduced sea ice AD 1960–1999 (Pieńkowski et al., 2011).

Results of qualitative dinocyst analyses showing relative abundances of species, as well as % autotrophs, dinocyst flux and total (absolute) dinocyst abundance.
MAT reconstructions
Dinocyst-based MAT transfer functions (most probable reconstructions; Figure 6) suggest SSTs between −1.0 and −1.5°C in winter throughout the record, whereas summer SSTs vary from a maximum of 6.0°C to a minimum of 1.0°C, with more variation from the summer SST mean (3.6°C) from the base of the record to AD 1790 and generally lower amplitude variations thereafter. SSSs fluctuate around 22.6–33.9 in winter and 20.9–32.4 in summer, with no clear long-term trends. Most probable sea-ice reconstructions (Figure 6) range from 5.1 to 10.1 months yr−1 (mean = 7.4 months yr−1) cover, with concentrations between 4.0/10 and 8.1/10 (mean = 5.8/10). Only subtle long-term trends are apparent in both parameters, with three-point running mean values suggesting very gradual declines up core. Nevertheless, both reconstructions show pronounced apparent 40-year periodicities post AD 1710, marked by episodic shifts in annual SIC of around 3 months and concentration of around 3/10. Most probable primary productivity reconstructions range from 76.2 to 157.5 g C m−2 a−1 (mean = 133.3 g C m−2 a−1). A gradual increase in primary productivity is suggested by the three-point running mean towards the core top. As with the other parameters, a widely oscillatory signal can be seen in the most probable productivity reconstruction, where declines in productivity correspond with increases in SIC and concentration.

Modern analogue technique transfer function (MAT) reconstructions of dinocyst data from core 99LSSL-001. White lines in MAT plots denote three-point running mean values of most probable reconstructions (solid lines). Grey envelopes show minimum and maximum ranges. See Table S1 (available online as Supplementary Material) for raw numerical results of MAT reconstructions. Also shown are limited qualitative dinocyst and biogeochemical data, alongside PIP25 sea-ice indices.
Discussion
Sea-ice reconstruction comparisons
Several lines of evidence were used in 99LSSL-001 to elucidate late-Holocene palaeoenvironmental conditions in Coronation Gulf (Pieńkowski et al., 2011), augmented by additional biogeochemical and micropalaeontological data (this study). Collectively, these data permit an examination of various sea-ice proxies from a decadal-resolution Arctic archive, enabling inter-comparison between differing approaches to palaeo sea-ice reconstructions.
Biomarker-based PBIP25 (Figure 4) suggests four late-Holocene spring/summer sea-ice regimes of differing duration in Coronation Gulf (see section ‘Biogeochemistry’): fluctuating long open water to MIZ environments during the early part of the record (AD 1625–1740), followed by high-amplitude oscillations between long open water season and extended sea-ice conditions (AD 1740–1870), a shift to greater ice cover marked by swings between MIZ and extended seasonal sea-ice conditions (AD 1870–1970) and finally a recent and pronounced reduction in seasonal sea ice (AD 1970–1999). Biogeochemical proxies are broadly consistent with this reconstruction. Both BioSil and TOC fluxes prior to AD 1740 are marginally elevated in comparison to the proceeding AD 1740–1870 interval, corresponding with increased biological productivity under reduced sea-ice conditions and along the MIZ (Brierly and Thomas, 2002; Smith et al., 1987; Smith and Nelson, 1986) in the early part of the record. The fluctuations between long open water season and extended sea-ice conditions AD 1740–1870 represent swings between two low-productivity environments (compared with the MIZ; Brierly and Thomas, 2002), resulting in reduced, but fluctuating, BioSil and TOC fluxes. Both biogeochemical proxies during AD 1870–1970 show marked fluctuations between high and low values, with negative excursions in TOC flux broadly corresponding with extended sea-ice episodes, as indicated by PBIP25. In the uppermost part of the record (AD 1970–1999), BioSil and TOC fluxes rapidly decline to values in keeping with those recorded in present-day surface sediments throughout the Western CAA, including Dease Strait, Victoria Strait and central Viscount Melville Sound (Pieńkowski, personal observation). This occurs at a time when the PBIP25 record suggests a dramatic shift to less or no spring/summer sea ice, a phenomenon supported by direct satellite observations (Canadian Ice Service, 2011).
The primary micropalaeontological data – dinocyst assemblages (relative abundances; Figure 5) – agree well with the PBIP25 sea-ice regimes (Figure 4). The interval prior to AD 1740 is characterized by a high proportion of autotrophs (particularly O. centrocarpum sensu Wall and Dale (1966)), whose producers require seasonally open water for photosynthesis (and are generally distributed along the inflow of relatively warmer waters within an Arctic context; Kunz-Pirrung et al., 2001; Matthiessen et al., 2005) and a reduced component of heterotrophs found in regions characterized by extended SIC (producing dinocysts such as I.? cezare; De Vernal et al., 2013b; Zonneveld et al., 2013). In the MIZ interval (AD 1740–1870), the proportion of O. centrocarpum s.l. is slightly elevated compared with the previous period, suggesting conditions favourable to primary producers, that is, abundant light (open water) in conjunction with dissolved nutrients (potentially delivered by the many rivers feeding the gulf; Figure 1), consistent with the sea-ice conditions suggested by PBIP25. Further agreement between the qualitative dinocyst and PBIP25 reconstructions is seen towards the core top. The extended seasonal sea-ice interval (AD 1870–1970) indicated by PBIP25 corresponds directly to a marked decrease in autotrophic dinocysts and a rise in heterotrophic species associated with perennial sea ice (I.? cezare and E. karaense; Head et al., 2001; Zonneveld et al., 2013). Post AD 1970 autotrophic species dramatically increase and henceforth dominate the dinocyst assemblages. In agreement, biomarker reconstructions suggest a rapid return to reduced sea-ice conditions, displaying some of the lowest PBIP25 values in the whole record. This is in keeping with the sea-ice decline directly observed by satellite since 1979 (Canadian Ice Service, 2011; Vaughan et al., 2013).
Overall, biogeochemical proxies correspond well with qualitative micropalaeontological reconstructions based on dinocysts (the sparse diatom species are those found in polar environments characterized by seasonal sea ice). Although, aside from 99LSSL-001, late-Holocene marine data are presently lacking from this region, these reconstructions broadly agree with palaeoenvironmental data from adjacent islands (see Pieńkowski et al. (2011) for an in-depth discussion on late-Holocene regional context). In particular, both PBIP25 and dinocyst assemblage reconstructions for the uppermost samples (late-20th century) agree well with observed sea-ice conditions over the last 30 years (Canadian Ice Service, 2011); conditions broadly equivalent with the ‘variable to less sea ice zone’ of Müller et al. (2011). However, MAT reconstructions show relatively poor agreement with the other (biogeochemical and micropalaeontological) proxies, beyond broadly reconstructing a polar marine environment characterized by seasonal SIC throughout the late-Holocene. Specifically, MAT sea-ice reconstructions vary only slightly over the covered time period (Figure 6), with SIC ranging from 5 to 10 months yr−1 and sea-ice concentration between 4/10 and 8/10. Similarly, reconstructed summer SSTs vary only marginally throughout the record; reconstructed SSSs appear the most variable parameter (although these fluctuations are on the scale to be expected for physically dynamic Arctic environments; Michel et al., 2006). Overall, only subtle trends can be discerned from the MAT reconstructions, in contrast to the prominent shifts seen in the other investigated proxies.
Data precision
Both PBIP25 and MAT reconstructions suggest apparent multi-decadal cycles in seasonal sea-ice variability post AD 1710 (Figure 7). However, these ostensible oscillations (~40 years) cannot be assumed real given that their apparent periodicities are less than the chronostratigraphic standard error margins (210Pb: 10%, 14C: 1σ). Notably, the apparent cyclicity in both PBIP25 and MAT reconstructions broadly disappear when the chronostratigraphic error margins are accounted for (Figure 7) suggesting that they are a result of natural noise or minor analytical errors in the proxy data. Longer term (centennial) trends in sea-ice variability can nevertheless be determined from the PBIP25 record when applying a 210Pb 10% error envelope around the age–depth model (Figure 7), corresponding closely to the three-point running mean of PBIP25 sea-ice reconstructions (Figure 4; see section ‘Biogeochemistry’). MAT sea-ice reconstructions, when treated in the same manner, also broadly approximate their centennial-scale three-point running mean trends, although variations in estimated sea-ice season and concentrations are notably limited in amplitude and agree poorly with PBIP25 reconstructions.

Apparent 40-year periodicity in PBIP25 and MAT sea-ice reconstructions. Note that when the errors in the age model are accounted for (210Pb: 10%, 14C: 68.3% confidence interval), much of the apparent periodicity disappears.
Within the context of the low mid- to late-Holocene sedimentation rates throughout the CAA channels (typically <0.6 mm yr−1; Andrews et al., 1991; Pieńkowski et al., 2012, 2013, 2014), 99LSSL-001 represents a relatively high-resolution archive (1.2 mm yr−1 sedimentation rate) for an Arctic marine setting. Given the sediment sample volumes needed to generate meaningful multiproxy (micropalaeontological and/or biogeochemical) data, in combination with typical core barrel diameters and the errors associated with dating, even high-frequency sampling (1 cm slices at 1 cm core intervals) cannot provide sufficient chronostratigraphic resolution to reliably elucidate sub-centennial environmental variability in this polar setting. Therefore, and independent of the uncertainties inherent in reconstructing palaeoenvironmental parameters (Haslett, 2002; Leventer, 1998), such apparent sub-centennial variations in CAA archives cannot be considered meaningful and should be treated with caution. However, using absolute chronologies (and resulting age–depth models) suggestive of decadal precision, nevertheless, remains a useful tool when comparing palaeoenvironmental proxy approaches across the same stratigraphic intervals as well as providing histories that can be compared against instrumental and observational (narrative) data sets. A solution to this low precision problem may be offered by settings characterized by exceptionally high annual sedimentation rates, such as Arctic estuaries or marine embayments (Dale and Dale, 2002; Duboc et al., 2014; Hill et al., 1991), hitherto markedly undersampled even in comparison with the limited number of marine cores from the CAA.
Inter-proxy discrepancies
The use of any (palaeo-) environmental proxy carries inherent caveats (Leventer, 1998), both peculiar to specific techniques and more broadly applied to all proxies. For example, biogeochemical approaches, such as IP25, can suffer from equivocal palaeoenvironmental interpretation if used as a stand-alone proxy (Müller et al., 2011), as well as from issues such as selective and non-uniform depositional and post-depositional degradation (Belt and Müller, 2013) and regional effects (Weckström et al., 2013). Diatoms are prone to dissolution (as suggested in this study), species-selective preservation and under-representation of sea-ice species (Leventer, 1998; Shemesh et al., 1989). Dinocysts, the fossilizable benthic resting stages of planktonic dinoflagellates, are one step removed from the autotrophic and heterotrophic organisms that produced them (Dale and Dale, 2002; Hackett et al., 2004). Notably, different dinoflagellate taxa with different environmental tolerances can produce morphologically similar dinocysts (e.g. the species complex Brigantedinium spp.; Zonneveld et al., 2013).
Although other proxies such as foraminifera and foraminiferal stable isotopes (δ18O) have been used for sea-ice reconstruction (e.g. Schell et al., 2008), such methods should be considered carefully in the CAA where mid- to late-Holocene sediments are marked by poor preservation of biogenic carbonate (Pieńkowski et al., 2012, 2013, 2014), abundance of fragile agglutinate taxa (Schröder-Adams et al., 1990; Vilks, 1989) and a mid-Holocene transition to exceedingly small (<63 µm) faunas below typical sieving protocols (Scott et al., 2008). The near absence of calcareous foraminifera throughout core 99LSSL-001 despite frequently preserved foraminiferal organic linings (Pieńkowski et al., 2011) testifies to the complexity of using this microfossil group in the CAA.
Although any one proxy has its advantages and disadvantages, the good agreement between biomarker and micropalaeontological proxies in this study implies a high degree of confidence in the reconstructed sea-ice regimes, suggesting considerable fluctuations in environmental conditions over the latest Holocene. Notably, however, MAT reconstructions appear to deviate from the consensus seen in other data.
One explanation for this discrepancy may lie in the limited spatial (and environmental?) coverage of modern dinocyst distributions in the study region. The Northern Hemisphere database of modern dinocyst distributions (n = 1492; De Vernal et al., 2013b) used for MAT does not include Coronation Gulf, having relatively poor coverage of the marine CAA south of Parry Channel. Although there are sites in Dease Strait (n = 1; some 325 km from the coring site) and in the Beaufort Shelf and outer Amundsen Gulf (collectively n = 51; closest site 430 km), none of these show an assemblage structure similar to that found at the Coronation Gulf core top (high proportion of O. centrocarpum s.l. and Brigantedinium spp., accompanied by I. minutum, I.? cezare and E. karaense), although a higher autotrophic component (with abundant O. centrocarpum s.l.) was found by Richerol et al. (2008) in the Beaufort Sea. Nevertheless, O. centrocarpum s.l. percentages decreased towards the critically shallow (20–30 m deep) Dolphin and Union Strait, which severely limits the eastward inflow of deeper water (Hare, 1994; Ingram and Prinsenberg, 1998). Notably, the high proportions of I.? cezare and E. karaense seen during the sea-ice interval in the Coronation Gulf core (accompanied by Brigantedinium spp., I. minutum and O. centrocarpum s.l.) are not apparent in the database. Such lack of modern dinocyst spatial coverage south of Parry Channel within this archipelago setting (oceanographically distinctive from adjacent regions such as Baffin Bay or the Beaufort Sea; Ingram and Prinsenberg, 1998) may help explain the poorly nuanced MAT sea-ice (and SST) reconstructions seen in 99LSSL-001, with no meaningful modern assemblages to act as reasonable analogues. The closest modern analogues for the Coronation Gulf core are northern Baffin Bay, the Banks Shelf, and the Kara Sea, the Sea of Okhotsk and Foxe Channel (Table S1, available online as Supplementary Material). The validation step of the MAT with n = 1492 sites gives a RMSE (root square of the mean squared error) of 1.1, which we adopt as a threshold. RMSE falling above this value are deemed a poor reconstruction, while those falling above it are considered reliable (Guiot and De Vernal, 2011). The RMSE for most of the reconstructed parameters fall above the threshold (Table S1, available online as Supplementary Material), although the RMSE for sea-ice concentration close to the threshold (1.12) suggests that the reconstructions of this parameter may not be robust.
Another explanation for the apparent low-resolution MAT sea-ice reconstructions may lie in the broad environmental tolerances of the dominant dinocyst species present in the Coronation Gulf core. Available CAA data from surface sediments (De Vernal et al., 2013b; Zonneveld et al., 2013) suggest a dominance of opportunistic taxa capable of withstanding wide inter- and intra-seasonal fluctuations in physical parameters, an essential adaptation for Arctic environments. Many of these taxa are produced by heterotrophic dinoflagellates, such as the dinocysts I. minutum and Brigantedinium spp., which dominate modern (Mudie and Rochon, 2001) and late-Quaternary environments, with little variation (Pieńkowski et al., 2012, 2013, 2014). While a high proportion of autotrophs, particularly O. centrocarpum s.l., appears unusual within the context of the oceanographically restricted CAA (De Vernal et al., 2013b; Mudie and Rochon, 2001), this taxon is also broad in its environmental preferences (Zonneveld et al., 2013). Collectively, this may contribute to the low-amplitude signature of MAT reconstructions. It is interesting to note that MAT reconstructions on available dinocyst palaeodata (~1–8 cal. ka BP) from a core in Dease Strait – dominated by the species complex Brigantedinium spp. (commonly >70%) with lesser O. centrocarpum s.l. (mostly <20%) – are almost uniform in their most probable reconstructions of SIC (although fluctuations are seen in reconstructed SST and SSS) over 7000 cal. yr (Ledu et al., 2010).
The elevated abundance of autotrophic dinocysts seen in Coronation Gulf may be aided by the high nutrient input via many large rivers flowing into the basin (Figure 1). Similar elevated autotroph assemblages (although far more diverse) are reported farther southeast in Hudson Bay, where Heikkilä et al. (2014) suggest using Polykrikos sp. var. Arctic morphotype as a sea-ice proxy. Given the low relative abundance of this dinocyst in this study (<10%) and the CAA (Mudie and Rochon, 2001) in general, this may not be a viable option for the southwest CAA. Heikkilä et al. (2014) furthermore highlight the importance of regionality of dinocyst assemblages within surface sediments, another point which argues for an increased spatial coverage in the dinocyst database (De Vernal et al., 2013b) and which may help explain the differences between Coronation Gulf and other CAA channels (Mudie and Rochon, 2001).
Complexities in biomarker sea-ice reconstructions
Our biomarker data permit an exploration of methodological questions raised when using this technique in a polar archipelago setting. As demonstrated by Müller et al. (2011), PIP25 (combining IP25 and open water algal biomarkers) represents a more faithful proxy for sea-ice regimes than does IP25 alone, accounting for the absence of IP25 under end-member conditions of zero and multiyear sea ice. However, the way in which the constituent biomarker data are expressed has implications for calculating PIP25 (Müller et al., 2011) and inter-record biomarker comparisons. Calculated palaeo-fluxes of IP25 and phytoplankton-specific biomarkers (µg cm−2 a−1) provide useful values for determining PIP25 in a downcore setting, being independent of sediment physical properties and to a greater extent reflecting production rates in the water column and sea ice. However (and especially beyond the application of 210Pb and 137Cs as reliable chronometers), calculated fluxes are only as reliable as the age–depth models and sedimentation rates on which they are based. While flux-based values are used in this study, chronological imprecisions and inaccuracies inherent in age–depth model construction have the potential to skew palaeo sea-ice reconstructions and make inter-record comparisons challenging. Absolute biomarker concentrations (µg g−1; concentrations normalized to g sediment) are even more problematic because of the effects differing sediment properties (e.g. grain size), sedimentation rates and diagenetic processes may have on measured concentrations (Belt and Müller, 2013; Xiao et al., 2015). To compensate for these factors, Müller et al. (2011) recommend normalizing IP25 and phytoplankton-based biomarkers to TOC content (µg g−1 OC), an approach which not only facilitates inter-comparisons between palaeo records but also permits comparison with ‘modern’ surface sediment values where direct relationships between in-ice production, delivery through the water column and total sediment accumulation rates can be complex (Belt et al., 2008; Belt and Müller, 2013; Fahl and Stein, 2012). It should be noted, however, that fluxes (or rate of inclusion in sediments) of TOC and individual biomarkers should be expected to vary, to some small degree, independently of each other (as per Figure 4), being influenced by a range of largely common, but in some cases potentially independent, environmental factors (e.g. Ding et al., 2015).
In this study, PBIP25 values calculated based on both flux-based and TOC-normalized biomarker data are extremely similar (although not identical; offsets ranging from 0.005 to 0.016, mean = 0.009) thus providing equivalent palaeo sea-ice reconstructions (Figure 4). This suggests little error in our age–depth model and sedimentation rate calculations and that, at least in this study, flux-based and TOC-normalized biomarker terms are equally reliable. Biomarker data normalized to TOC from two sites in the CAA (Figure 1; Lancaster Sound and M’Clintock Channel) show values comparable to core 99LSSL-001 (Table 2). Both Lancaster Sound and M’Clintock Channel samples reconstruct borderline MIZ to variable/less sea-ice regimes (PBIP25 = 0.52) consistent with modern satellite-observed ice conditions (Canadian Ice Service, 2011). This further suggests that biomarker values from the 400-year long Coronation Gulf record are reasonable for this environmental setting. Limited regional palaeodata show broadly similar ranges for IP25 fluxes in Victoria and Dease straits, although Barrow Strait fluxes appear higher (Belt et al., 2010). Direct comparisons between our data and those of Belt et al. (2010) are, however, complicated by chronological factors (ΔR selection, potential inclusion of deposit feeding molluscs) inherent in age–depth model and sedimentation rate reconstructions. While our downcore TOC-normalized IP25 and brassicasterol values are the same order of magnitude as our modern seabed sediment samples, they stand in contrast to values reported from both the northern North Atlantic (Müller et al., 2011) and the Russian Arctic (Xiao et al., 2013, 2015). The majority of Coronation Gulf downcore TOC-normalized IP25 values are higher than the maxima of 8.47 µg g−1 OC from the Fjord Coast of east Greenland (Müller et al., 2011) and 11.43 µg g−1 OC from the northern Laptev Sea (Xiao et al., 2013). Brassicasterol concentrations normalized to TOC are, however, broadly range equivalent to those reported by Müller et al. (2011) and Xiao et al. (2013). The reasons for such disparity are difficult to determine but could lie in the different oceanographic settings (archipelago shelf sea vs open ocean). A notable trend in the North Atlantic IP25 values is an increase in concentration towards and into the fjords of the east Greenland coast, while the shallow and fluvially influenced Laptev and Kara seas show a much more complex biomarker pattern (Xiao et al., 2013). Weckström et al. (2013) have demonstrated that in regions of mobile ice at the southern limit of seasonal sea-ice, PIP25 values are complicated by the combination of advected allochthonous sea ice (thus IP25) with autochthonous phytoplankton biomarker production. However, while some lateral ice transport is to be expected at our study site, the semi-enclosed Arctic archipelago basin setting of Coronation Gulf, characterized by seasonally landfast first-year ice (Canadian Ice Service, 2011; Fetterer et al., 2002), is ideally suited for IP25 and brassicasterol sea-ice reconstructions (comparable to Müller et al., 2011, 2012). Fahl and Stein (2012) and Belt and Müller (2013) have noted the link between increasing water depth and decreasing biomarker concentrations in surface sediments, suggesting biogeochemical degradation and scavenging of organic matter by marine organisms as well as dilution during descent through the water column explain this relationship. These factors may well influence our relatively shallow (~200 m) high IP25 concentration (max. 73.12 µg g−1 OC) record.
Biomarker and TOC data from surface sediment samples in M’Clintock Channel (station 2011804-003) and Lancaster Sound (station 2011804-009). Presented biomarker values are based on averages of three analyses. The balance factor c and the sea-ice index PBIP25 are calculated following Müller et al. (2011).

TOC: total organic carbon; OC: organic carbon.
Ecological and environmental variability may also be an important factor in determining differences in IP25 concentrations under apparently similar sea-ice conditions (Stoynova et al., 2013). Sea-ice diatom communities have been shown to vary widely in species composition and abundance in similar sea-ice habitats in both the Arctic and Antarctic (e.g. Garrison et al., 1987; Moro et al., 2000; Von Quillfeldt et al., 2003). Although these studies have not been directly linked to biomarker production, such natural variability may be expected to influence preserved concentrations of sea-ice biomarkers in underlying sediments. As yet, these considerations must remain speculative, but they highlight the pressing need for characterization and calibration of the biogeochemical signature of surface sediments across the CAA relative to oceanographic, climatological, and environmental parameters.
Given the significant concentration differences between IP25 and phytoplankton-based biomarkers, Müller et al. (2011) recommend the use of a balance factor c in the calculation of PIP25 (Eq. 1) based on mean IP25 and phytoplankton-based biomarker concentrations. However, when concentrations are marked by closely clustered values with a few infrequent outliers, as in this study, these extreme values can act to skew mean biomarker calculations (and thus balance factor c terms), markedly influencing PIP25 results. Where the two high value outliers in both the IP25 and phytoplankton-based Coronation Gulf biomarker data sets are excluded from balance factor c calculation, the resulting PBIP25 values are reduced in magnitude, shifting palaeo sea-ice reconstructions towards more reduced sea-ice conditions (Figure 4). Similar results are seen when the balance factor c is calculated using median rather than mean values. Nevertheless, our PBIP25 sea-ice reconstructions using the full biomarker data sets (including outliers) are in good agreement with other palaeo sea-ice proxies. Xiao et al. (2015) have explored the use of region-specific balance factor terms in correlating surface sediment PIP25 values with modern sea-ice distribution with success across the Arctic Ocean. However, given the absence of a database of modern surface sediment values for the CAA and the lack of an independent means to determine time variance in balance factor c within a single core record, using region-specific balance factors in this study was not possible. Consequently, the degree to which IP25 and phytoplankton-based biomarkers should be scaled prior to PIP25 calculation remains equivocal, especially in regard to handling extreme value outliers, as well as the spatio-temporal appropriateness of the balance factor itself (Belt and Müller, 2013; Xiao et al., 2015).
The degree to which water column and post-depositional (and post-sampling) degradation has influenced biomarkers in this study is difficult to assess, representing highly complex and largely unquantifiable processes (see Belt and Müller, 2013 for a detailed discussion). While Rontani et al. (2011, 2014) indicate that the highly branched isoprenoid IP25 is largely unreactive and thus preserved well in sediments, other biomarkers such as brassicasterol may suffer from photodegradation (Rontani et al., 2012; Stein et al., 2016). Biomarkers may be degraded under surface or subsurface oxic conditions, varying dependent upon sedimentary physical, biological and biogeochemical properties and at non-linear rates (e.g. Brown, 2011; Huguet et al., 2008, 2009). Furthermore, the post-sampling and storage contamination and degradation of biomarkers and pigments have been noted (Cabedo Sanz et al., 2016; Grimalt et al., 1988; Reuss and Conley, 2005; Weller, 2007). However, the susceptibility of IP25 and brassicasterol to these processes remains to be determined (Belt and Müller, 2013). We note, however, that IP25 was present in concentrations comparable to our study, in grab, core and dredge sediments (many oxidized) from the Canadian Arctic, collected by the GSC-A (expeditions 84015 and 91039) in the 1980s and early 1990s (analysed decades later following unknown storage conditions) in the original Belt et al. (2007) study that forms the basis of this method. Although our samples may have potentially been influenced by any or all of the aforementioned factors during deposition, coring and storage, the strong agreement between PBIP25 (biomarker-based) sea-ice reconstructions and those based on qualitative micropalaeontology (dinocysts) argues for the appropriateness of the biomarker approach in this setting.
Correlations between proxies
The biomarker proxies IP25 and PBIP25 are broadly parallel to TOC and BioSil throughout the core (Figure 4). Strong correlations (R2 > 0.75) between TOC and biomarker proxies are evident especially when comparing smoothed (three-point running mean) data sets (Figure 8a and b; Table S2, available online as Supplementary Material). In particular, the three-point mean values of TOC concentration (by weight and %) and TOC flux correlate strongly with three-point mean values of both IP25 concentration and flux (R values >0.8; Figure 8a; Table S2, available online as Supplementary Material). Direct correlations between TOC concentrations and PBIP25 (normalized to OC) are weaker (R = 0.57, R2 = 0.32, n = 20; Figure 8b; Table S2, available online as Supplementary Material). Correlations between BioSil and biomarkers are weaker, with the strongest correlations (R = 0.68, R2 = 0.46, n = 18) shown between IP25 concentration (three-point mean) and BioSil concentration and flux (three-point mean values). Although these relationships are potentially related to elevated productivity at the marginal ice zone (e.g. Brierly and Thomas, 2002) resulting in the positive correlations between TOC and BioSil with IP25 and PBIP25, the complexities of TOC and biogenic silica records reflecting multiple sources, pathways and preservation potentials (e.g. Ragueneau et al., 2000) make drawing direct linkages problematic.

Selected correlations between (a) IP25 concentration (three-point running mean) and % TOC (three-point mean), (b) concentration-based (normal to TOC) PBIP25 and % TOC (three-point running mean), (c) concentration-based (normal to TOC) PBIP25 and MAT sea-ice duration and (d) concentration-based (normal to TOC) PBIP25 and relative abundance of I.? cezare. For basic correlation data, see Table S2 (available online as Supplementary Material).
PIP25 has been recognized as a reliable proxy approach for spring/summer sea-ice conditions (Belt and Müller, 2013; Müller et al., 2011; Stoynova et al., 2013, Xiao et al., 2015), being based on the ratio of IP25 (positively correlating with increased spring/summer sea ice) to open water algae biomarkers (e.g. brassicasterol, negatively correlating with spring/summer sea-ice conditions). As such, PIP25 (and its constituent terms) should be expected to correlate with quantitative MAT reconstructions. In an extended seasonal sea-ice scenario during spring/summer marked by high PIP25 ratios (sensu Müller et al., 2011), a longer sea-ice season and greater sea-ice concentration would be expected. Conversely, low PIP25 periods (variable/less spring/summer sea ice) should correspond to shorter seasonal sea ice and lower sea-ice concentration.
However, in this study, when IP25 and PBIP25 are compared with MAT outputs (most probable reconstructions) of SIC (seasonal duration) and concentration, only very weak correlations are evident (R <0.5; Figure 8c; Table S2, available online as Supplementary Material). Similarly, the MAT sea-ice indicator I.? cezare (Table S2, available online as Supplementary Material) only weakly correlates with IP25, although correlation with PBIP25 is stronger (Figure 8d; Table S2, available online as Supplementary Material). This stands in contrast to the better agreement between biomarkers, biogeochemistry (particularly TOC) and qualitative micropalaeontology. These poor correlations between biomarkers and MAT sea-ice reconstructions are difficult to explain. A lack of regional coverage in the modern dinocyst database (De Vernal et al., 2013b), a strongly regional dinocyst assemblage (sensu Heikkilä et al., 2014) and/or the broad environmental tolerances of many Arctic dinocyst taxa (Zonneveld et al., 2013) may be contributing factors to this apparent disagreement. Nevertheless, such explanations remain speculative until multiproxy surface sediment assays (dinocysts, biogeochemistry and biomarkers) tied to measured physical and chemical oceanographic parameters become available from the Western CAA.
Is there a ‘best’ sea-ice indicator?
Given the discrepancies between some of the proxies investigated in this study, the question arises: what is the best and most faithful sea-ice indicator? Intuitively, the most faithful sea-ice proxies should be those that are intrinsically tied to the sea-ice environment, while those that are only indirectly influenced by sea ice may be less suited to reconstructing ice histories. IP25 is produced by genuinely sympagic organisms and is therefore inherently tied to this environmental parameter (Belt et al., 2012). Nevertheless, a stand-alone proxy IP25 suffers from equivocal interpretation if phytoplankton-based biomarkers are not included (Belt and Müller, 2013; Müller et al., 2011).
Dinocysts are only indirectly influenced by sea ice. Autotrophs such as O. centrocarpum need seasonally open water for photosynthesis (Kunz-Pirrung et al., 2001; Matthiessen et al., 2005). Conversely, heterotrophs (e.g. I. minutum, I.? cezare) are influenced by biotic factors including prey availability such that their occurrence (and abundance) may be favoured by abundant sea ice and its resident biota (Matthiessen et al., 2005). Melnikov et al. (2002) report several motile dinoflagellate species from the Canada Basin that were found within specific sea-ice environments (e.g. ice–water interface). The relatively high diversity of motile dinoflagellates in the Arctic Ocean (~250 taxa; Matthiessen et al., 2005, and references therein) stands in contrast to the low reported diversity of their cysts in Arctic Ocean surface sediments (Zonneveld et al., 2013), including the CAA (rarely >10 species; Mudie and Rochon, 2001). None of these cyst taxa, however, are known to be truly sympagic. Although genetic studies on sea-ice biota show a diverse and substantial dinoflagellate component (including dinocysts; Stecher et al., 2016), only one dinocyst species, produced by Polarella glacialis, a gymnodinoid brine-channel dwelling dinoflagellate, has thus far been reported from within Antarctic fast ice (Montresor et al., 1999, 2003; Stoecker et al., 1993). Although recently found in Hudson Bay (Heikkilä et al., 2014, 2016), its small size (<15 µm) in combination with its poor preservation potential (non-dinosporin cell wall), likely limits its use a palaeo sea-ice indicator.
Marine diatoms frequently dominate sea-ice environments (Brierly and Thomas, 2002; Melnikov et al., 2002) and preserve well in regions such as the Southern Ocean (Armand and Leventer, 2010). However, their poor preservation and/or low frequency in Western CAA environments (Pieńkowski, personal observation) – as suggested in this study – likely limits their use as Holocene palaeoenvironmental indicators (although eastern CAA and Baffin Bay show better preservation; Knudsen et al., 2008). Nevertheless, diatom production may be estimated by biogeochemical methods (e.g. BioSil; Ragueneau et al., 2000; cf. Heikkilä et al., 2014).
In answer to our above question, it is doubtful that a single ‘best’, universally applicable sea-ice proxy exists. New and existing approaches continue to require testing and calibration for each of the diverse existing and palaeoenvironmental settings they are applied in. Especially in areas marked by complex oceanographic histories influenced by a diversity of environmental drivers, a multiproxy approach should provide a more nuanced and in-depth insight into those environmental changes than any one single proxy.
Conclusion
This study provides a first evaluation of different palaeo sea-ice reconstruction approaches for the marine channels of the Canadian Arctic. Of all the groups examined in this study, biomarker-based approaches (PBIP25) appear to provide the most sensitive and nuanced sea-ice information, being supported by broadly accordant biogeochemical (BioSil, TOC) and qualitative micropalaeontological (dinocysts) data, whereas some proxies such as diatoms are exceedingly rare to absent. Dinocyst-based MAT broadly reconstructs a high-latitude environment characterized by seasonal sea ice in Coronation Gulf. However, in this study, MAT provides the least nuanced and least variable sea-ice reconstructions, despite their apparent precision. Until the construction of a wider, more spatially and environmentally representative database of dinocyst–oceanographic relationships for the Western CAA, MAT-based reconstructions for this region should be interpreted in tandem with other proxies with a closer direct relationship to sea ice. Nevertheless, and aside from the criticisms levelled at MAT approaches (Dale and Dale, 2002; Telford, 2006), the excellent preservation potential of dinocysts in the CAA (compared with other microfossils) argues for their continued development as environmental proxies, including quantitative reconstructions of oceanographic parameters.
Finally, while PBIP25 is considered a broadly reliable sea-ice proxy in this study, further systematic work across the CAA is needed to clarify the relationships between surface sediment proxies (biomarkers, biogeochemistry and micropalaeontology) and modern oceanographic parameters. Such an approach, combined with robust and standardized geochronological protocols, will enable the development of reliable quantitative reconstructions of palaeoenvironmental parameters, including sea ice, in this climatically sensitive region.
Footnotes
Acknowledgements
We thank the Geological Survey of Canada – Atlantic, in particular, Robbie Bennett, for access to core materials. Thanks are also extended to the crew of the CCGS Amundsen and Bob Murphy for surface sediment recovery. Simon Belt (University of Plymouth) kindly provided the standard needed for IP25 analyses. We are particularly grateful to Juliane Müller (Alfred Wegener Institut) and Anne de Vernal (GEOTOP) for the fruitful discussions surrounding sea-ice proxies. We extend our thanks to three anonymous reviewers and the editor Atle Nesje whose valuable detailed comments greatly improved this manuscript.
Funding
This research was made possible by a Marie Curie Career Integration Grant awarded to A Pieńkowski (FP7-PEOPLE-2011-CIG 304178 The Quaternary Environmental Evolution of the Northwest-Passage). We acknowledge the receipt of a MacEwan University Undergraduate Student Research Initiative Fund awarded to N. Gill. This paper is a contribution to the ArcticNet Phase IV project ‘Mapping of Arctic Canada’s Seafloor: Contributions to Global Change Science, Sustainable Resource Development, Safe Navigation of the Northwest Passage, Geohazards and Arctic Sovereignty’.