
Abstract
Wetlands are very vulnerable ecosystems and sensitive to changes in the ground water table. For the last few thousand years, hydrological balance has also been influenced by human activity. To improve their cropping features, drainage activity and fertilizing were applied. The drainage process led to an abrupt change of environment, the replacement of plant communities and the entire ecosystem. The problem of carbon sequestration is very important nowadays. A higher accumulation rate is related to higher carbon accumulation, but the intensity of carbon sequestration depends on the type of mire, habitat, and climatic zone. The main aim of this article was an examination of the changes in poor-fen ecosystem during the last 200 years in relation to natural and anthropogenic factors, using paleoecological methods (pollen and macrofossils). The second aim was a detailed investigation of the sedimentary record to aid our understanding of carbon sequestration in the poor fen of temperate zone. This case study shows that fens in temperate zones, in comparison with boreal ones, show higher carbon accumulation rates which have been especially intensive over the last few decades. To reconstruct vegetation changes, detailed palynological and macrofossil analyses were done. A 200-year history of the mire revealed that it was influenced by human activity to much degree. However, despite the nearby settlement and building of the drainage ditch, the precious species and plant communities still occur.
Introduction
Wetlands are dependent on water supply, and their hydrology is a decisive factor conditioning their sustainable development (Charman, 2002; Holden, 2005; Tobolski, 2003). These are very vulnerable ecosystems and sensitive to changes in the ground water table (Holden, 2005; Querner et al., 2010). There are periods of prosperity, related to higher precipitation and/or lower temperature resulting in positive hydrological balance. There are also periods of worse conditions when high mean annual temperature and high ecosystem respiration cause a shortage of water and lower net growth of organic matter (OM) or even its decomposition (Bellen et al., 2011; Starkel et al., 1996; Street-Perrott and Harrison, 1985). Thus, the rate of peat accumulation results from climatic changes; however, various local factors, for example, geological structure, geomorphologic features of the catchment, shape of the accumulation basin, and hydrology, influence this process to a higher degree (Bellen et al., 2011; Glaser et al., 2004). For the last few thousand years, hydrological balance has also been influenced by human activity, but pronounced changes have appeared over the last ages (Berglund et al., 1996; Göttlich et al., 1993; Ralska-Jasiewiczowa and Van Geel, 1992). Apart from the nemoral forests, wetlands were the main types of ecosystems in Central Europe (Latałowa, 2003). The need for open space for cultivation and pastures, settlements and communication routes (human pressure) caused the gradual diminishment of these natural ecosystems (Göttlich et al., 1993). Apart from fertile areas of deciduous forest, wetlands and oxbows were also used. To improve their agriculture properties, drainage activity and fertilizing were applied. The drying process led to an abrupt change of environment, the replacement of plant communities and the entire ecosystem (Charman, 2002).
The hydrological system controls mire type development (Tobolski, 2003). Generally, a higher peat accumulation rate (PAR) is related to higher carbon accumulation, but the intensity of carbon sequestration depends on the type of mire, habitat, and climatic zone (Joosten, 2009). Peatlands have the long-term ability to sequester carbon (Turunen et al., 2001) and play a major role in moderating atmospheric CO2 concentrations. Time-weighted peat carbon accumulation rates (CARs) for the Northern Hemisphere during the whole Holocene averaged 23 ± 2 g C m−2 yr−1 (Loisel et al., 2014). It can be estimated that over the past 10, 000 years, the atmospheric carbon stored in peats has served to reduce global temperatures by about 1.5–2°C (Loisel et al., 2014). However, drainage, fire, or climatic factors can easily negate this advantage and turn peatlands from a net sink to a net source of CO2 in the atmosphere (Holden, 2005). A significant decrease in water level results in a range of consequences that impact on the ecosystem greenhouse gas budget in particular. This causes increased emission of carbon dioxide (CO2) and, in some cases (in aerobic conditions), nitrous oxide (N2O; IPCC, 2014; Silvola et al., 1996). Nevertheless, higher temperatures and increasing water levels by rewetting peatbogs may also increase at least temporarily methane emissions (CH4), which also impacting the greenhouse gas budget (Couwenberg, 2009; Van Winden et al., 2012). Fires in such overdried peatlands release huge amounts of CO2 to the atmosphere (Dunn and Freeman, 2011). That is why maintenance of the Earth’s carbon balance depends greatly on the appropriate functioning of peatlands (Maltby, 2009; Silvola et al., 1996; Wieder, 2006).
Unfortunately, past exploitation, which led to the draining of these ecosystems, destabilized the natural balance of the peatland and reduced its ability to sequestrate carbon. Peatlands are able to self-restore; however, this is only the case if suitable water conditions occur (Hendon and Charman, 2004; Tobolski, 2003). Because of the large total area of wetlands in boreal and subarctic zones and the large amounts of carbon sequestered there, most research has been carried out on ombrotrophic boreal peatlands and fens (Gorham, 1991; Leslie et al., 2010; Mäkilä, 2011; Mäkilä and Saarnisto, 2008; Minkkinen and Laine, 1998; Yu, 2006). Less is known about temperate bogs and fens and almost nothing about eutrophic peatlands (Malley et al., 2002; Thormann and Bayley, 1997; Thormann et al., 1999). Central Europe, in particular, has far fewer sequestration records (Fiałkiewicz-Kozieł et al., 2014b; Marcisz et al., 2015); however, this region deserves our attention because of the considerable peatland areas and their high participation in the release of carbon dioxide to the atmosphere. The development of civilization and the economy in the countries of the temperate climate zone have transformed peatlands into pastures, cultivated fields, or settlements, which in turn cause the CO2 release to be more intense in these areas than in the boreal zone (Joosten, 2009).
Rzecin mire was selected for our study because of the monitoring station, which has been located there for 12 years (Chojnicki et al., 2007; Juszczak et al., 2012a). The station was established by Poznań University of Life Sciences and provides a lot of data on current meteorological and biochemical phenomena at the mire. There has also been botanical research on modern plant communities found at Rzecin (Wojterska et al., 2001). The history of the mire and problem of its pristine nature or human influences and the possibility of carbon sequestration were the next focuses of scientific interest.
The main aim of this article is as follows: (1) an examination of the changes in the Rzecin peatland ecosystem during the last 200 years in relation to natural and anthropogenic factors, using paleoecological methods (pollen and macrofossils), and (2) a detailed investigation of the sedimentary record to aid our understanding of carbon sequestration in fens. The results allow an estimation of human impact and the direct and indirect influences of nearby settlement. Our interpretation is supported by the record of water level changes based on testate amoebae analysis in an R1 core (Lamentowicz et al., 2015). Particular attention was given to the rate of carbon accumulation of two profiles from Rzecin peatland representing two different trajectories of peatland development during the last 200 years.
Study site
Rzecin peatland (52°45′N, 16°18′E, 54 m a.s.l., 114 ha) is located in Puszcza Notecka (W Poland, Figure 1), within the ice-marginal Toruńsko-Eberswaldzka valley (Kondracki, 1998). Its surface, young geological layers of quaternary origin, was created by the last glaciation (Mojski et al., 1977). It is not more than 30–70 m in thickness (Radaszewski, 2003). According to Tobolski (1962), there were two dune-forming phases after the Vistulian glaciations: during the late glacial and in the Preboreal period. Today, dunes cover the surface between the Warta and Noteć rivers over an area of 80 × 10 km2. The study area is influenced by both oceanic (more often) and continental climates, as is typical for Central Europe (Woś, 1994). The mean annual air temperature in the years 1951–1980 was 8.0°C, with January and July means being −2.0°C and 17.8°C, respectively (Woś, 1994). The average annual precipitation amounts to 526 mm (Farat et al., 2004), with the lowest and the highest sum of 377 and 867 mm (Woś, 1994).

Location of the research site, cross sections RA and RB, and coring sites R1 and R2.
Rzecin peatland is situated on the northern edge of the dune field and is bounded by isolated dunes to the south (Pilarczyk, 1958). Historical and cartographic data indicate that the peatland is a result of the shallowing of the lake, which is much diminished but still exists (Barabach, 2012). There is a runoff (outflow) in the southern part of the peatland. There was a natural spring which is identifiable on old maps from the 18th and 19th centuries; however, in the second half of the 19th century, it joined a drainage ditch (Barabach, 2012). Since 1697, there has been a village situated in the close vicinity of the mire (Rusiński, 1939–1947), which developed intensively in the second half of the 19th century and at the beginning of 20th century. The peatland is surrounded by a relatively tight ring of pastures and cultivated fields and pine forest outside of it.
Since 2006, Rzecin peatland has been one of the sites of the Nature 2000 network in Europe (PLH300019) because of its unique flora and plant communities, biodiversity, and presence of relics and rare species (Górski and Rusińska, 2001; Wojterska et al., 2001).
As a result of such geomorphological and climatic conditions, poor, acidic soils cover 90% of the area of Puszcza Notecka (Bartkowski, 1970). There are also small areas of organic soils, peats, and alluvials (Olędzki, 2007). According to Matuszkiewicz (2008), there are potential habitats for Leucobryo-Pinetum in the inter-fluvial interior and Salici-Populetum, Fraxino-Ulmetum, and Ficario-Ulmetum in alluvials. Sphagnetalia magellanici and Vaccinio uliginosi-Pinetum are found on wetlands. Currently, the share of Pinus sylvestris in the forest is about 92% (Lis and Popyk, 2003) because, regardless of the habitat, pine has been planted. There are also some Betula pendula, Alnus glutinosa, Quercus robur, and Quercus petrea on wetter and/or more fertile habitats. Deforested areas are covered by heaths and swards (Wojterska et al., 2001).
In 2004, a permanent monitoring station was established in the middle of study area, where micrometeorological (heat, carbon dioxide, and methane fluxes between atmosphere and peatland) measurements are carried out (Chojnicki, 2013; Chojnicki et al., 2007, 2012; Juszczak, 2013; Juszczak et al., 2012a, 2012b; Kowalska et al., 2013). These observations are augmented with standard meteorological parameter measurements, for example, temperature, precipitation, and radiation.
Methods
Field work
Two geological cross sections (RA and RB) were made with a Russian core sampler to test the thickness and sequence of sediments in the accumulation basin. Additionally, single cores of the upper layer of the peatland were taken out of the line of cross sections with a Waardenar sampler. Two of these (R1 and R2) were chosen for detailed paleoecological analyses and radiocarbon dating. We made this choice because of their varied location on the peatland (distance from the lake and border of the peatland) and because they were representative and provided a repeating sequence of sediments and a relatively high thickness of peat layer. This last reason was especially important for the possibility of preparing high-resolution paleoenvironmental analyses. Some results of the paleoecological analyses of R1 were published by Lamentowicz et al. (2015).
Physical and chemical analyses
Bulk density (BD) was determined on two very precisely collected 5-cm3 subsamples which were dried at 105°C for 24 h and then weighed. The dry weight (g) was divided by the fresh sample volume (cm3). The ash content (AC) was obtained by measuring the loss on ignition at 550°C for 4 h (Heiri et al., 2001). AC was calculated using the equation AC = 100% − LOI550, where LOI550 is the loss on ignition as defined by Heiri et al. (2001). The ash-free BD used to determine the CAR was obtained by multiplying the OM content (calculated from LOI550) by the BD (Chambers et al., 2010).
The concentration of total carbon (TC) was determined using a multi-TC-/N 3100 analyzer. Standards were used for calibration. Analytical precision and accuracy exceeded ±2%.
The PAR was assessed using the thickness of the peat profile and the obtained age according to the formula: lower depth − higher depth/older date − younger date. Following Chambers et al. (2010), age–depth models were used to assess rates of carbon accumulation using the ash-free BD and carbon content.
Dating
Age–depth models of the profiles Rzecin 1 and Rzecin 2 were based mostly on radiocarbon dates of plant remains collected from the cores (Bryales and Sphagnum remains for R2, Sphagnum and Carex fruits for R1; Lamentowicz et al., 2015). 14C dating was performed in the Poznań Radiocarbon Laboratory (Goslar et al., 2004), and the measured 14C ages were calibrated against the IntCal13 (Reimer et al., 2013) and BombNH1 (Hua et al., 2013) datasets. The models were constructed with the free-shape algorithm (Goslar et al., 2009) that – besides the calibrated 14C dates – allowed for taking into account independent information on changing PARs and other chronological markers (for details, see section ‘Chronology’).
Radiocarbon dating (accelerator mass spectrometry (AMS)) of plant macrofossils as well as some local and regional events (pollen) confirmed by historical sources (Barabach, 2014) formed the base for the detailed chronology.
Pollen analysis
Cores for pollen analyses were sampled every 1 cm. Samples were prepared according to standard procedures (Berglund and Ralska-Jasiewiczowa, 1986), using acetolysis for 3 min. Before preparation of pollen slides, samples were stained with safranin. Every pollen spectrum was counted to at least 500 pollen grains of land plants: trees, shrubs, and herbs except for a couple of samples in which very low pollen concentrations occurred. Aquatics, telmatophytes, and nonpollen palinomorphs (NPPs) were counted as well; however, these were not included into the calculation sum. Pollen diagrams were prepared in Tilia and Tilia Graph programs (Grimm, 1992).
Macrofossil analysis
Cores for macrofossil analysis were sampled every 2 or 4 cm. Samples (10–15 cm3 each) were prepared using standard methods for macrofossil analysis (Birks, 2007; Tobolski, 2000). The material was sieved on 0.125-mm mesh sieves. The residue was sorted under a stereoscopic microscope at 10–200× magnifications. Selected macrofossils were transferred to Petri dishes into a mixture of distilled water, glycerine, and ethyl alcohol with the addition of thymol. Stratigraphic diagrams were plotted with Tilia version 2 and Tilia Graph (Grimm, 1992).
Results
Chronology
14C dates from the Rzecin 1 (R1) core have been already published (Lamentowicz et al., 2015, Table 1), and the age–depth model has been constructed (see Figure 2 therein) as a compromise between the fit of the 14C dates to the radiocarbon calibration curve and the general smoothness of the age–depth line. However, recently obtained records of AC and BD strongly indicated an enhanced supply of allochthonous mineral matter that drastically increased accumulation rates between ca. 43 and 52 cm of the core (see Figure 5, gray field) and caused an inversely proportional drop of OM content. So, the age–depth model for Rzecin 1 was recalculated, including information on relative changes in accumulation rates in the section of interest, incorporated using the option offered by the free-shape modeling algorithm (Goslar et al., 2009, see section ‘Modeling wiggles of the age-depth curve’ therein). The new model (Figure 3) is similar to that published by Lamentowicz et al. (2015), with a distinct difference only occurring in the critical 43- to 52-cm section.
Results of radiocarbon dating of profile Rzecin 2.
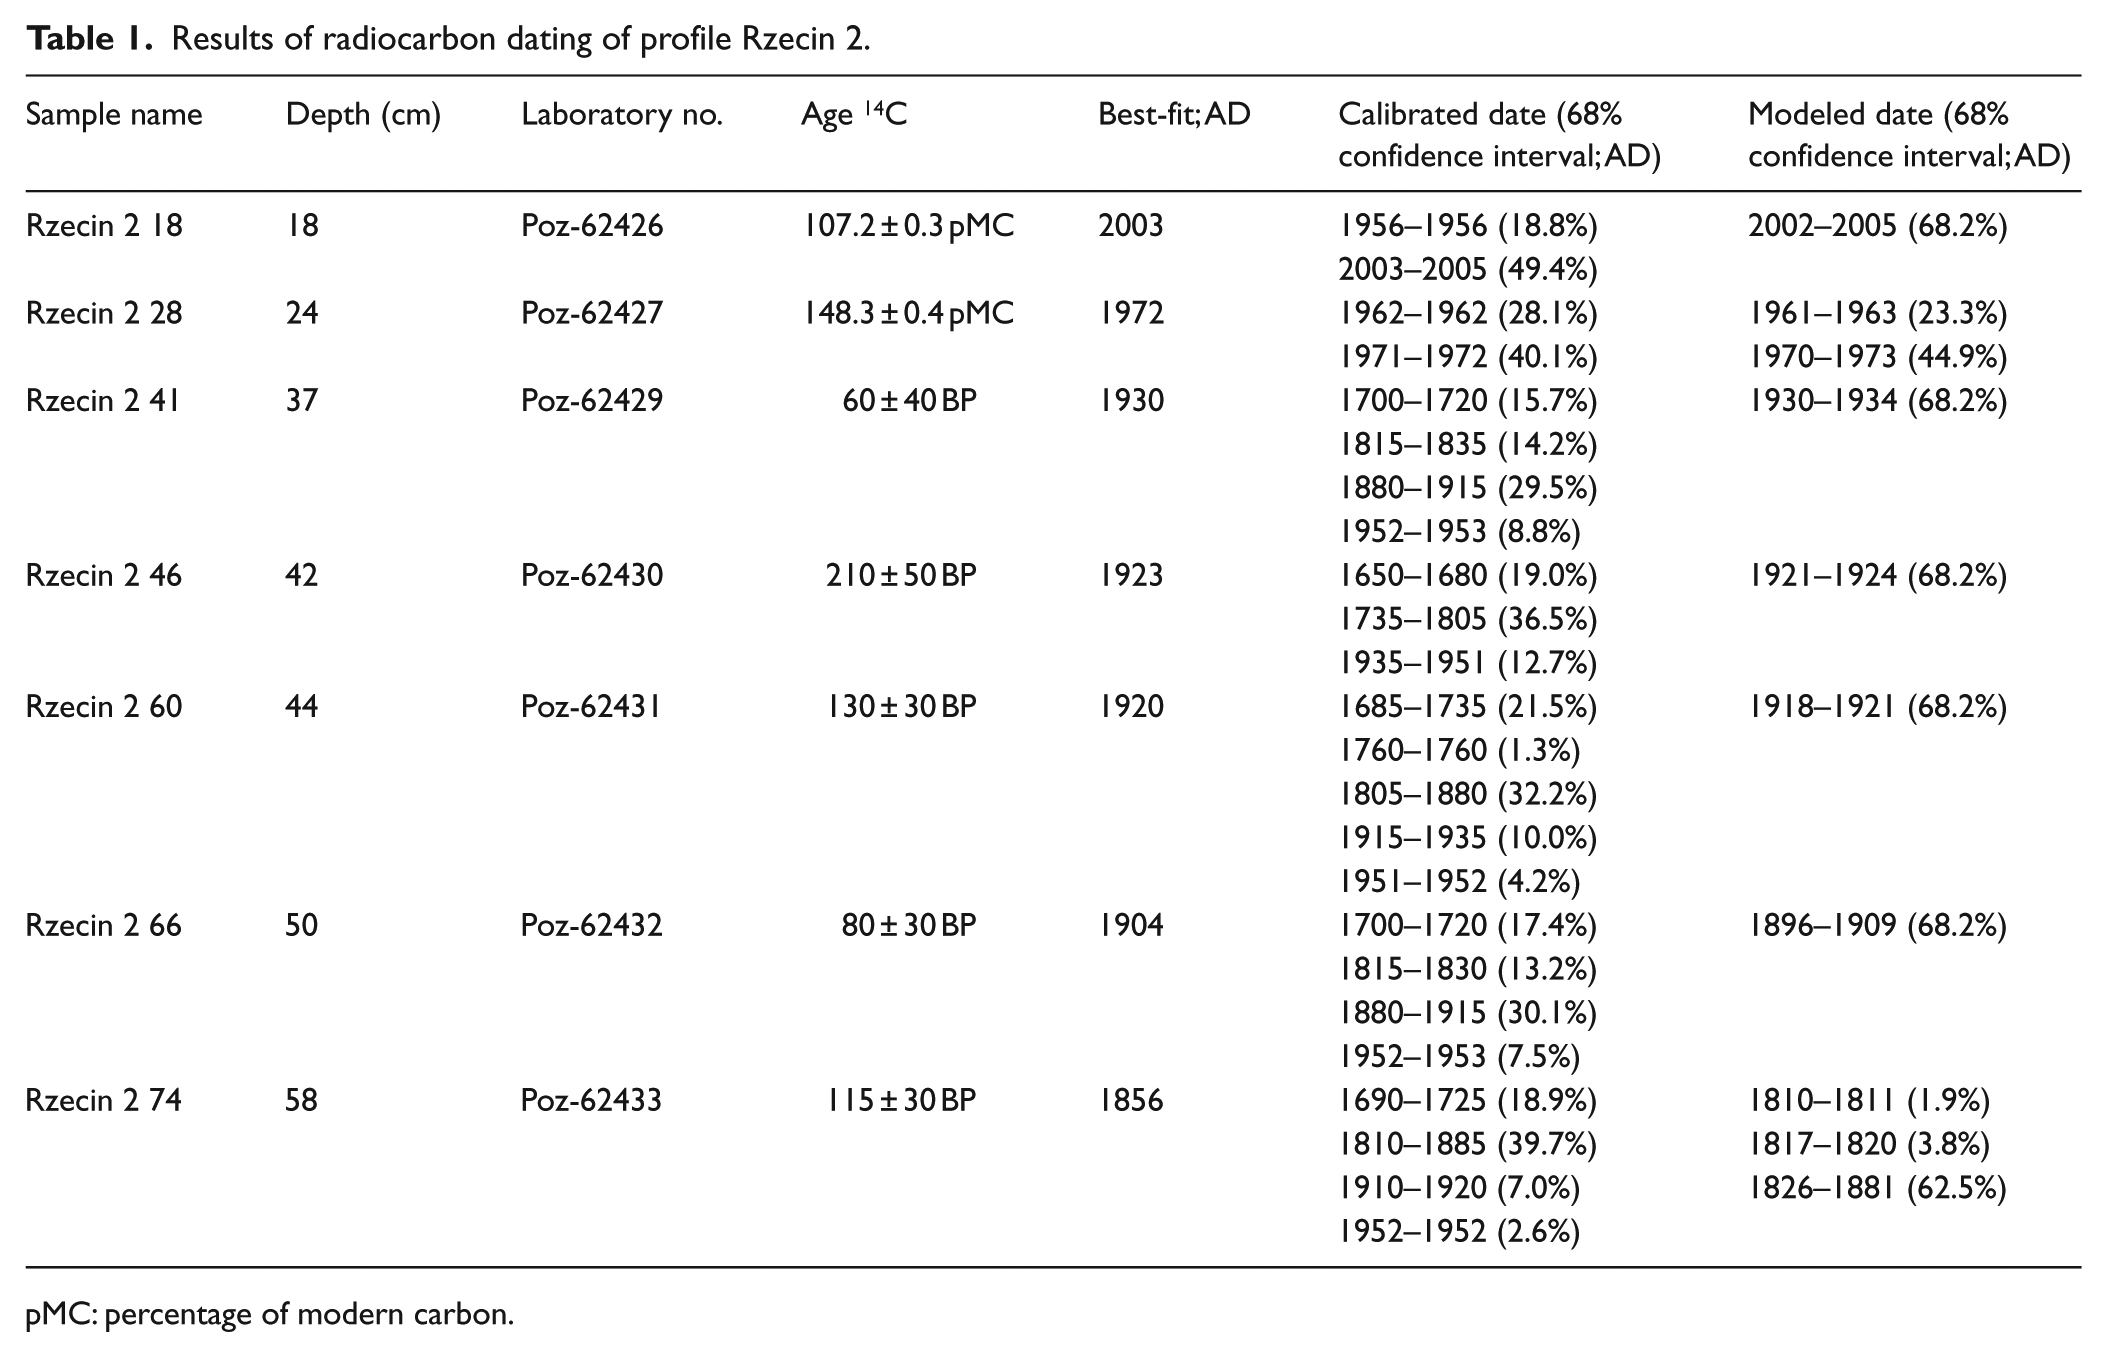
pMC: percentage of modern carbon.
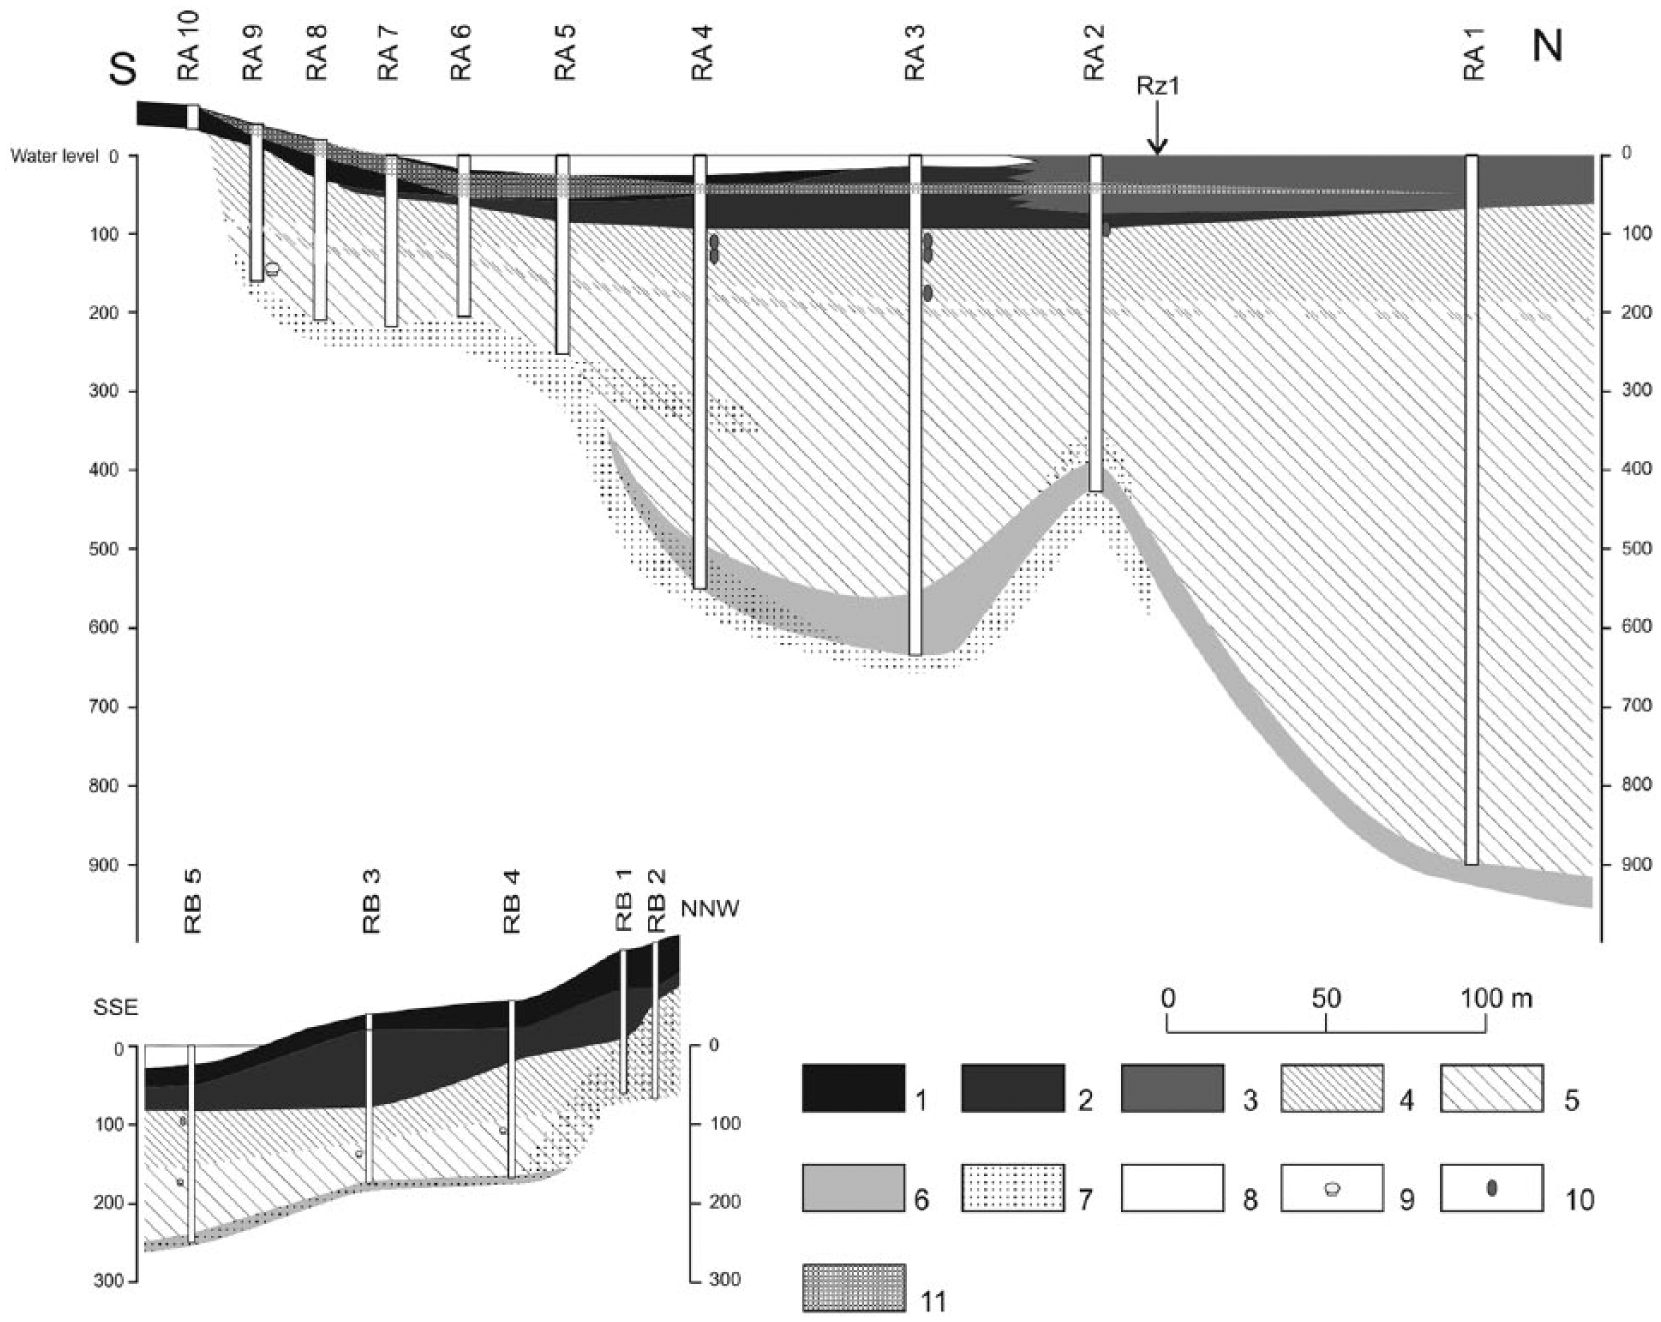
Geological cross sections A and B through Rzecin peatland.
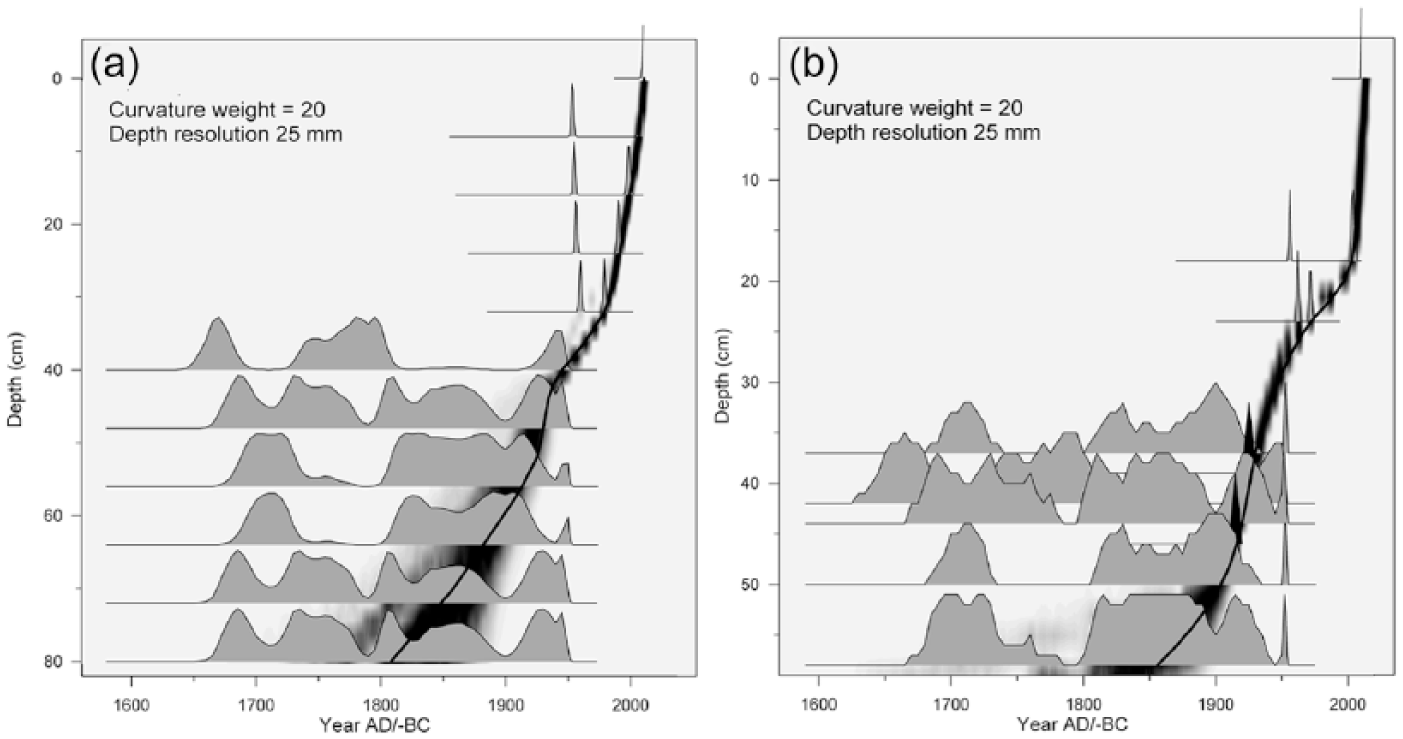
Age–depth models of the cores (a) R1 and (b) R2. Gray silhouettes represent probability distributions of individual calibrated 14C ages. The best-fit age–depth model is shown by a solid line, and its uncertainty by a gray-scale band around the line. The two black peaks at B (at 39 and 45.5 cm) represent the time markers independent of 14C dates (1916 – a big fire, 1927 – documented high water level after Panolis flammea disaster, described in the text).
From core Rzecin 2 (R2), 12 samples of plant macrofossils were dated. 14C analysis revealed the seven uppermost samples to come from the last ca. 120 years (Table 1), while the remaining samples represented earlier time periods beyond the scope of this paper. The free-shape age–depth model (Goslar et al., 2009) constructed for this core (Table 1, Figure 3) also used two independent chronological markers. One marker was a distinct peak of charcoal concentration in the sediment at the depth of 45.5 cm, which – when relying on 14C dates alone – could be dated at between AD1890 and 1920. Here, we attributed the charcoal peak to the huge fire that occurred in AD 1916 and deforested a large area near the study site (Figure 6). The second marker was the small peak of Pediastrum and remnants of aquatic invertebrates such as Chironomidae head capsules and ephippia of Ceriodaphnia and Simocephalus at the depth of 39 cm (Figures 6 and 7), which, supported by macrofossil and pollen indicators, show the event of extreme high water level which was historically documented in AD 1927 (Kopytowski, 1931). One must stress that these two markers did not push the age–depth model beyond the range suggested by 14C dates alone, but only allowed for adjustment of the model at these two levels and between them (Figure 3). Results of 14C dating and age–depth modeling are presented in Table 1.
Physical and chemical properties
Changes in physical properties reflected status of humic conditions of peatland and alterations of plant composition. In R1, differences in AC, BD, OM, and carbon content (Figure 4) allowed three main zones with significant changes to be distinguished.

Peat accumulation rate (PAR, cm yr−1), carbon accumulation rate (CAR, g m2 yr−1) and physical and chemical properties in two profiles from Rzecin peatland versus modeled age. The time of disasters and big changes is marked in grey.
In AD 1810–1916, average BD values at a depth from 79.5 to 67.5 cm varied from 0.11 to 0.16 g cm−3 and then from 66.5 to 57.5 cm, BD slightly decreased to 0.07–0.09 g cm−3. From 56.5 cm, BD increased to 0.12–0.13 g cm−3, except for 54.5 cm (0.07 g cm−3). AC fluctuates (10–39%) with maxima at 67.5 cm (27%; AD 1868) and 56.5 cm (39%; AD 1908). Changes in OM are inversely proportional to AC. The values of BD and AC are typical for poor fen.
Significant changes occurred from AD 1916–1937, where BD reached a maximum from 0.51 to 0.58 g cm−3 at a depth of 49.5–44.5 cm. This corresponded with abrupt changes in plant composition and occurrence of substance humosa. AC increased to the extremely high level of 73–82% (50.5–43.5 cm). A dramatic decrease in OM and carbon content was noted at this depth. Dramatic supply of mineral matter supported by AC significantly slowed down the process of sequestration.
From 42.5 cm to the top of the profile (AD 1937–2011), a permanent decrease in BD and AC is observed − 0.13–0.04 g cm−3. OM and carbon content increased and reached values from 80% to 96% and from 40% to 48%, respectively.
Mean PAR in R1 equaled 0.68 cm yr−1. From AD 1810–1974 (79.5
In peat profile R2, the highest BD value was observed on the bottom − 0.13 g cm−3 (Figure 4). Then, BD displayed a decreasing upward trend with slightly higher peaks at 38.5 and 32.5 cm − 0.11 and 0.10 g cm−3, respectively. On the top of the profile, 0.03 g cm−3 was determined.
AC (Figure 4) fluctuated at the depth of 54.5–42.5 cm (AD 1877–1921). On the bottom of the profile, a maximum of AC was observed − 19%, and this then dropped to 12–14%. At 42.5 cm, a distinct pick of 17% was observed, then AC dropped again to 12% (40.5 cm), and rose sharply to 15% at 38.5 cm. From 34.5 cm to the top of the profile, a gradual decrease in AC occurred.
OM and carbon content gradually increased to the surface. The values varied from 81% to 98% for OM and from 40% to 49% for C content.
Mean PAR equaled 0.75 cm yr−1. From 54.5 to 42.5 cm, it gradually increased from 0.17 to 0.57 cm yr−1. At 40.5 cm, a distinct peak of 1.33 cm yr−1 occurred, and this then dropped to 0.57 cm yr−1. Until 19.5 cm, slow PAR was recognized, and this then jumped to 1 cm yr−1. From AD 2006 to 2011, PAR equaled 2 cm yr−1. In 2012, it was twice as low.
CAR
R1 and R2 span 200 and 140 years of peat and carbon accumulation, respectively (Figure 4). Despite some small differences between the two profiles, they revealed very similar trends. The mean CAR value was 171 and 191 g m−2 yr−1 for R1 and R2, respectively. Five zones of different carbon accumulation could be distinguished within each of the investigated profiles. The most significant changes were detected in the profile at the level of AD 1922–1937, as well as on the top of the profile where an increasing trend is observed. This is in a close agreement with other proxies. The values varied from 60 to 450 g m−2 yr−1 in R1 and from 53 to 655 g m−2 yr−1 in R2.
Pollen analysis
Pollen analysis shows the changes in local plant communities and regional ones in the area surrounding the fen. Pollen diagrams reveal the state of regional and local plant communities during the last 200 years (Figures 5 and 6). Pollen zones (local pollen assemblage zone (LPAZ)) are based mainly on pollen of local origin and CONISS zonation (Tables 2 and 3). Variation of regional pollen (trees and shrubs) is less.

High resolution, percentage pollen diagram of Rzecin 1, selected pollen taxa, and charcoal content.

High resolution, percentage pollen diagram of R2, selected pollen taxa, and charcoal content.
Local pollen assemblage zones of the core R1.

LPAZ: local pollen assemblage zone; NAP: non-arboreal pollen.
Local pollen assemblage zones of the core R2.
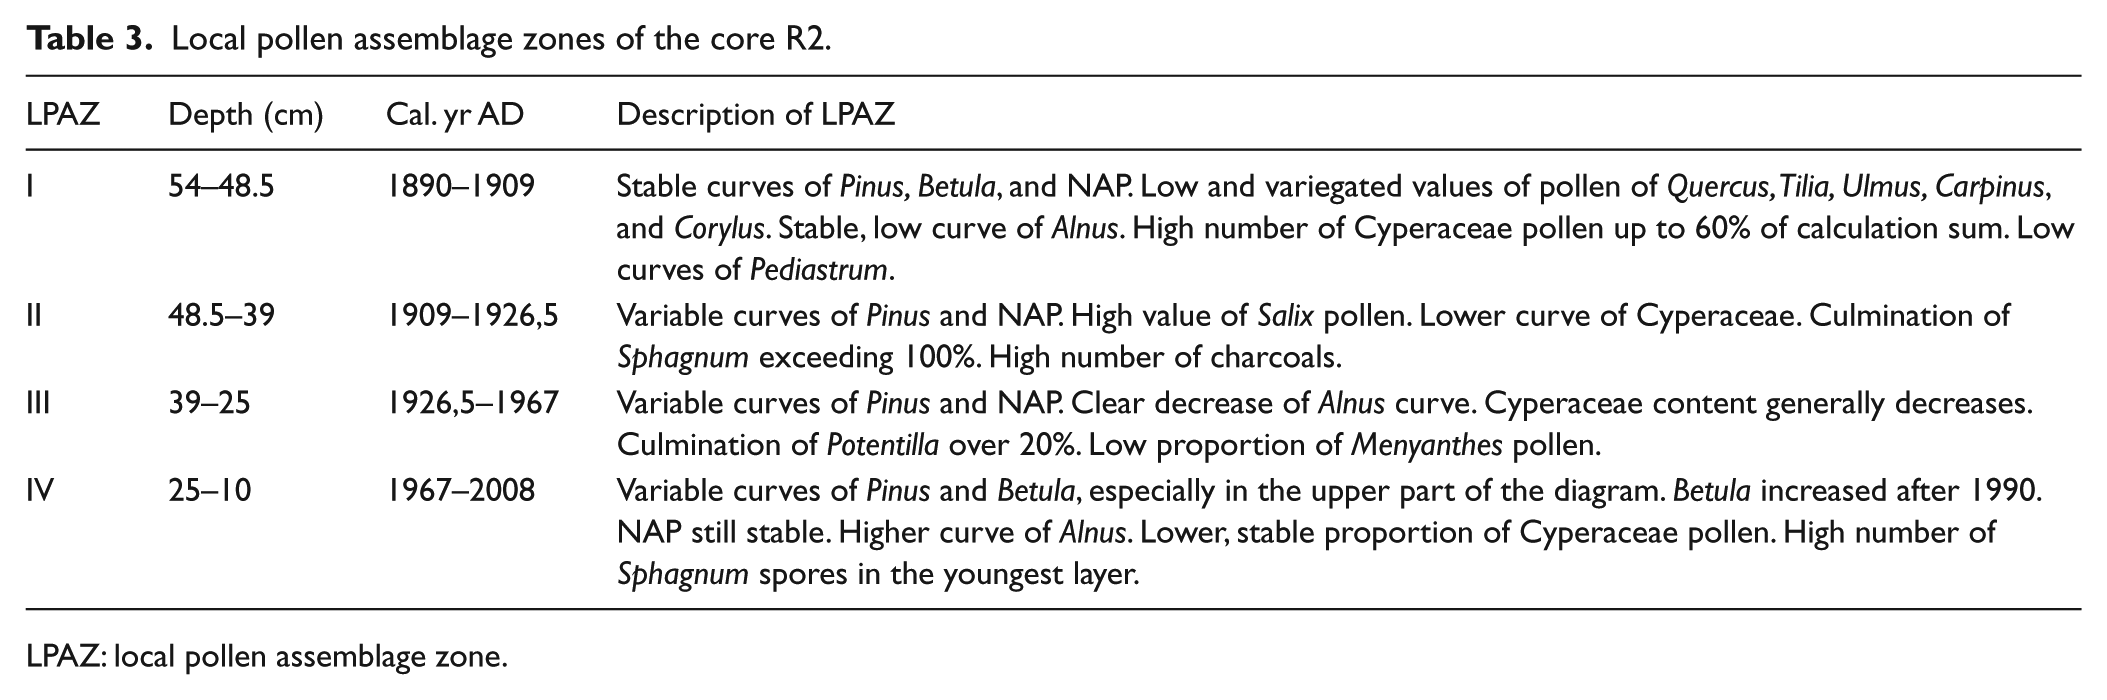
LPAZ: local pollen assemblage zone.
Pinus sylvestris has been the main forest component in the region during the last 200 years, as a consequence of poor, sandy soils (Bartkowski, 1970) and human activity (Barabach, 2014; Barabach and Milecka, 2013; Rusiński, 1939–1947). The presence of Quercus is low, and Carpinus betulus, Ulmus, and Corylus avellana were only a rare mixture. Tilia and Ulmus were hardly noted, so probably all these species are represented on the site only through the distant transport of pollen.
On wetland areas, there have been two dominant species, Alnus and Salix. To AD 1907, Alnus developed and then Salix replaced alder near R2. This is confirmed by the Salix curve exceeding 10% of calculation sum in the pollen diagram (Figure 6). In the 1920s (since AD 1918), Salix disappeared almost completely and gradually Alnus communities developed again. Locally, during 19th century, the aquatic macrophytes were overtaken by telmatophytic communities dominated by Equisetum, Cyperaceae, Potentilla type (most probably Comarum palustre), and then Cyperaceae and Sphagnum.
Pollen grains of cereals, buckwheat, flax (Secale, Triticum type, Zea mays, Linum catharticum, and Fagopyrum), and weeds (Polygonum aviculare and Papaver rhoeas) indicate cultivated fields. Plantago lanceolata and Rumex came from pasture areas (Behre, 1981). Anthropogenic changes in vegetation related to the village are more clearly seen in earlier layers of sediments, but since 1970, these have hardly been noticeable, which is a result of an almost complete disappearance of cultivated fields.
Macrofossil analysis
Macrofossil analysis of R1 (Figure 7) revealed a full succession of peatland development from the top of limnic sediments (Lamentowicz et al., 2015). In the R2 core, four macrofossil assemblage zones were distinguished (Table 4).
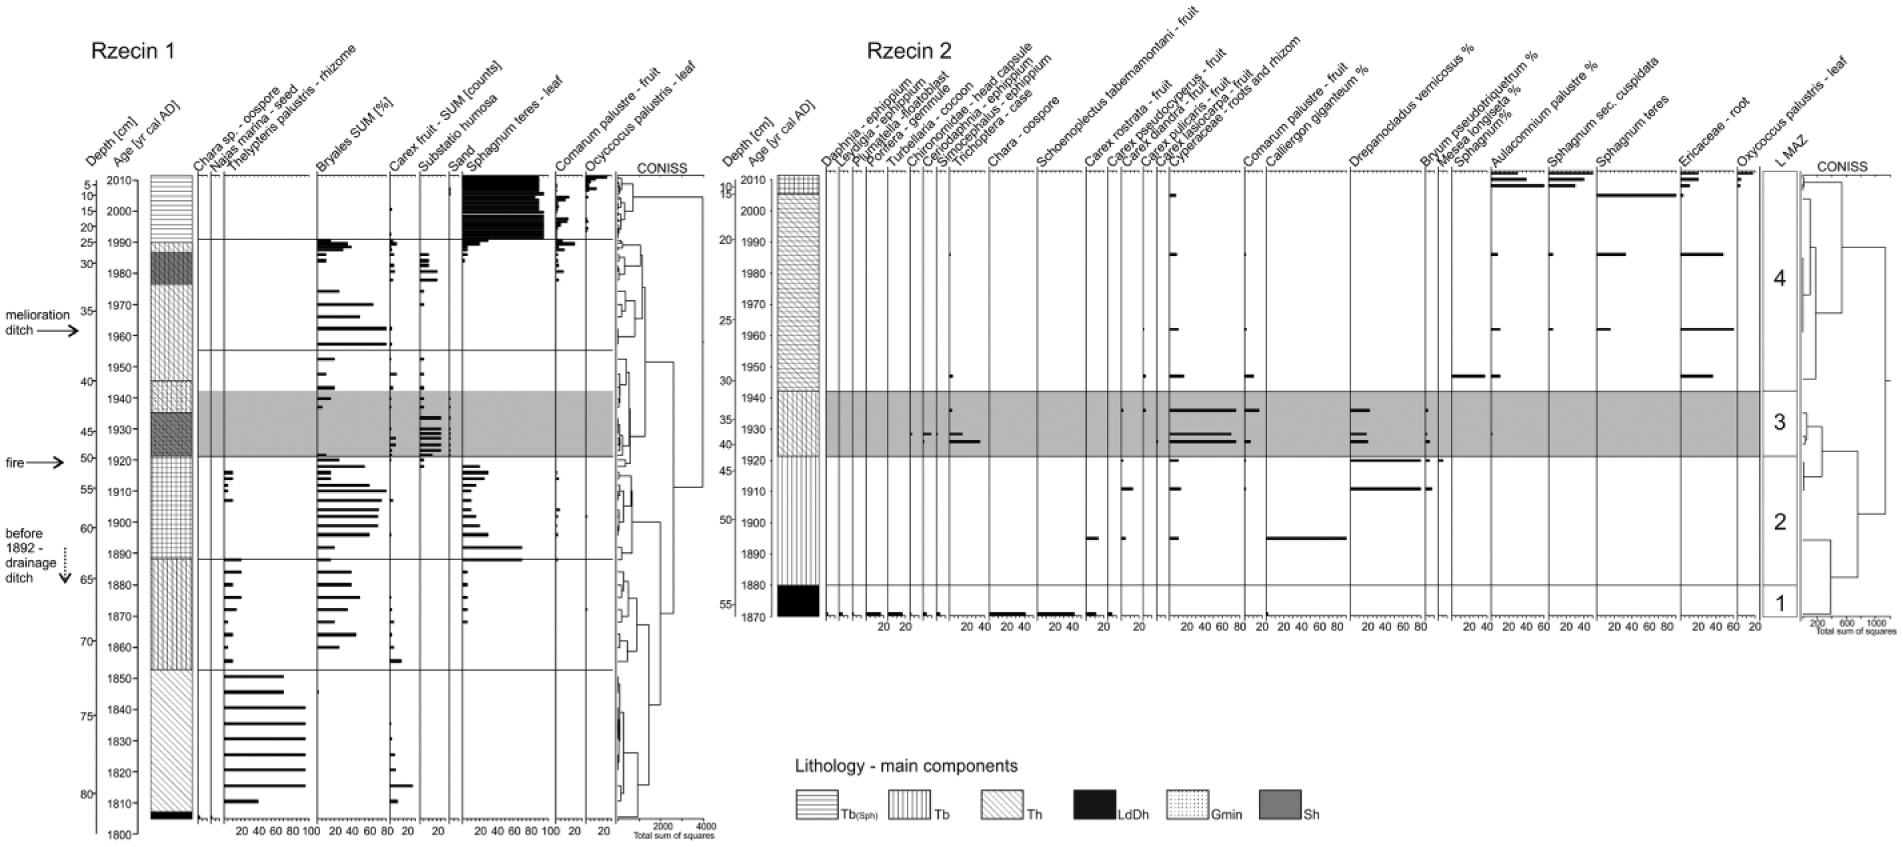
Macrofossil diagram of Rzecin 2 (selected taxa only) and the most important curves of Rzecin 1 (Lamentowicz et al., 2015).
Macrofossil zones of the core R2.
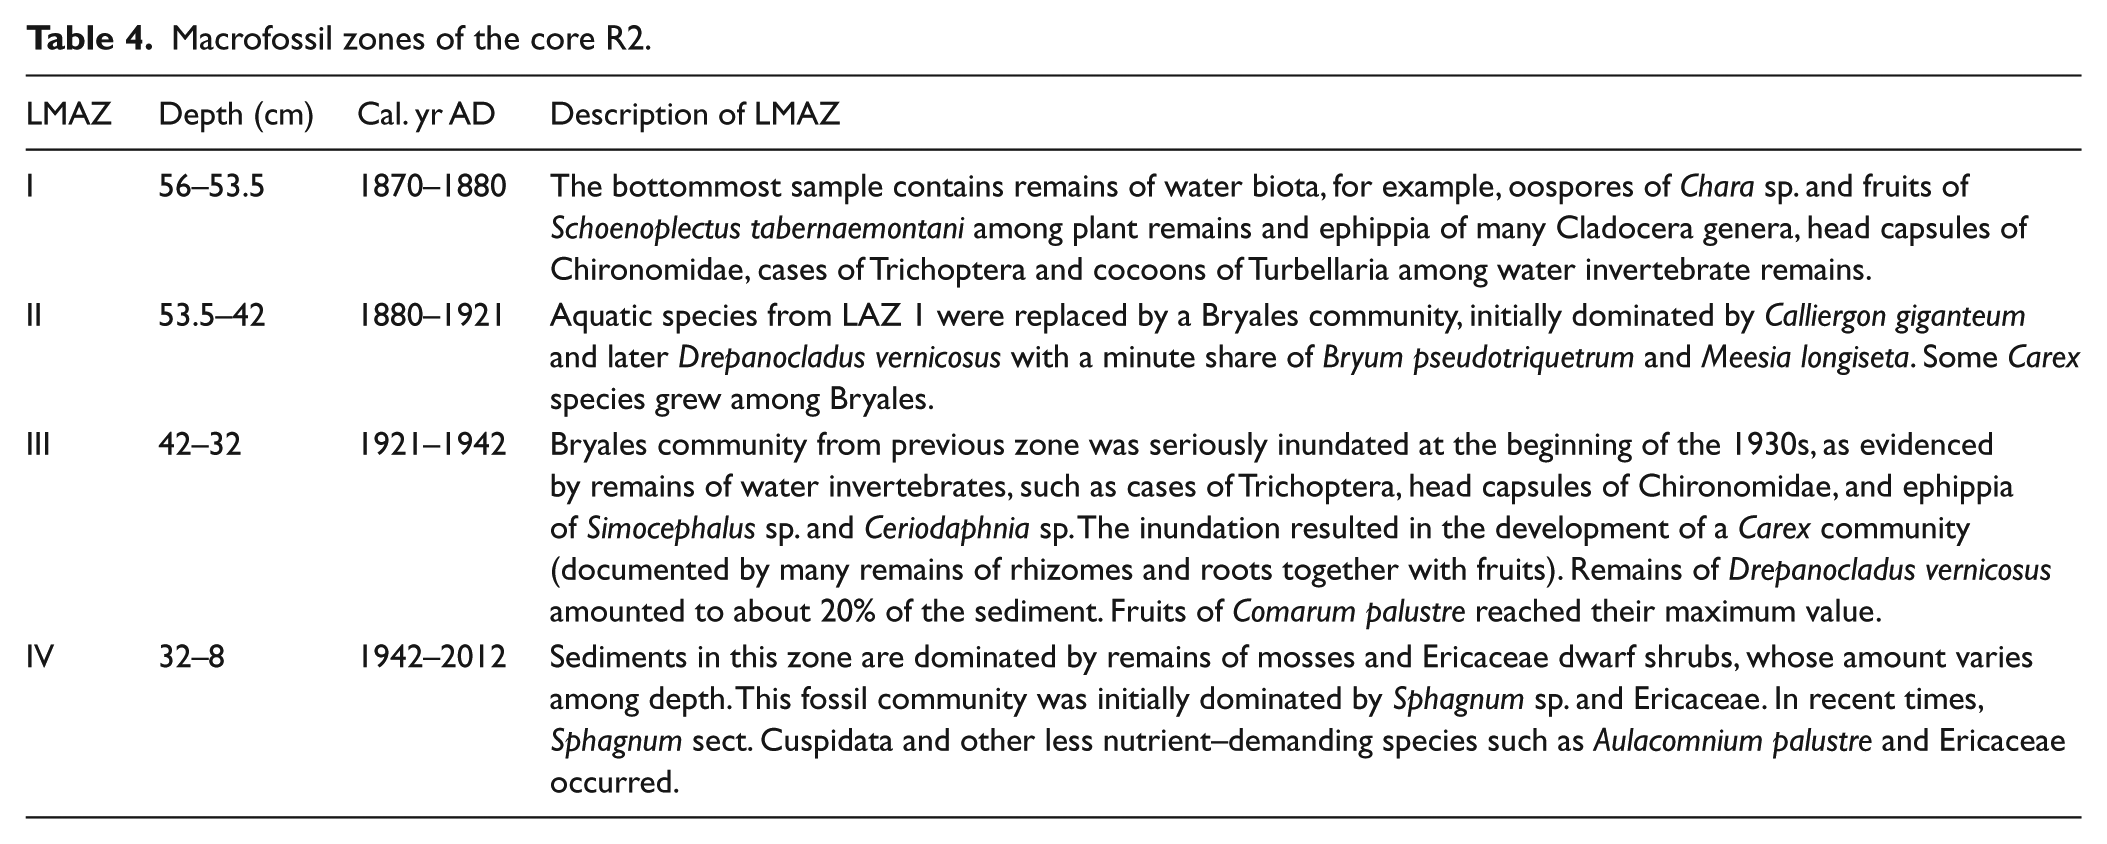
The bottommost sample contains remains of water organisms (Table 4, Figure 7). These aquatic species were replaced by a Bryales community, initially dominated by Calliergon giganteum and later Drepanocladus vernicosus with a minute share of Bryum pseudotriquetrum and Meesia longiseta. Some Carex species grew among Bryales. This community was seriously inundated at the beginning of the 1930s, as evidenced by remains of water invertebrates which resulted in the development of a Carex community with Comarum palustre. Later, this was succeeded by Sphagnum mosses and other less nutrient–demanding species, for example, Aulacomnium palustre and Ericaceae. This community was initially dominated by Sphagnum teres and, in recent times, Sphagnum sect. Cuspidata.
Discussion
Successional stages of the peatland
Both cores of sediments show the stage of the lake’s shallowing on the bottom and then the stage of accumulation of terrestric sediments, namely, peat. Their composition and accumulation rate changed with regard to location (distance from the existing lake) and hydrological factors. The latter consists of (1) annual precipitation, varying over time, influencing water budget (Przybylak, 2010; Woś, 1994); (2) construction of a drainage ditch in the southern part of the peatland and stages of improvement or deterioration of its flow capacity (Barabach, 2012); and (3) natural or anthropogenic external events, for example, complete deforestations because of fire or gradation of insects, strongly influencing the hydrology of this area (Hernik, 1979; Kusiak and Dymek-Kusiak, 2002).
Lake stage
We do not know the exact lake formation period because neither paleobotanical analyses nor dating were performed for the bottom sediments. However, palynological expertise and geological analyses of the oldest examined layer show that it has existed for at least 2000 years and occupied significantly more area than today (Figure 2). The bottom layers of the examined sediments were gyttjas accumulated in shallow water, as is evidenced by the few macrofossils of water plants and invertebrates (Figure 7). In the pollen spectra, coenobia of algae (Pediastrum and Botryococcus) were found, and among vascular plants, there was only a single pollen grain of Nymphaea in profile R2 (Figure 6). Both profiles contain Chara oospores and Najas marina seeds (Figures 2 and 7). The presence of both these species and Pediastrum boryanum and Pediastrum duplex, which are indicative algae for water rich in nutrients (Komarek and Jankovská, 2001), suggests eutrophic features of the lake (Figure 8). At site R1 at the beginning of the 19th century, a eutrophic lake existed with Najas marina and Typha latifolia (Zarzycki et al., 2002). Algae Scenedesmus, Pediastrum boryanum, Pediastrum duplex, and Pediastrum integrum are also thought to occur in eutrophic water (Jankovská and Komarek, 2000). After AD 1820, the proportion of Tetraedron algae increased; these live in mesotrophic or eutrophic lakes (Goslar et al., 1999), so slight mesotrophication was in operation. Ca content in R1 is more than 60 mg L−1 and approximate pH is 6.4 (Lamentowicz et al., 2015). The presence of calcium carbonate in the lake is confirmed by frequent Bithynia opercula found during geological analyses (Figure 2). Past water depth related to the transfer function of testate amoebae for core R1 (Lamentowicz et al., 2015) indicates, for this period, the wettest conditions during the last 200 years.

Crucial events during the 200-year history of the Rzecin peatland.
19th century – A change of sedimentation into peat accumulation process
Lake shallowing as a result of the sedimentation of gyttja triggered sedentation processes and the development of peatland ecosystems which ceased the process of lake overgrow that site (Tobolski, 2000, 2003). This process was not time dependent but dependent on periodical changes of water level (Douglas et al., 2003; Harison and Digerfeld, 1993; Starkel et al., 1998). Lake to peatland transition at R1 and R2 was not synchronous but was separated by about 30 years (Figure 8) because of various core locations in relation to the lake shore. In both sites, this transition occurred under conditions of high trophy.
After AD 1835, at site R1, floating mate appears on the shallow water of the lake with mesotrophic–eutrophic elements such as ferns, mainly Thelypteris palustris and Menyanthes trifoliata (Figure 5) and less commonly of Carex pseudocyperus (Lamentowicz et al., 2015). Such very wet conditions existed to ca. AD 1860. and gradual terrestrialization of the R1 site occurred slowly (Figure 8). Analysis of historical documents has not revealed any kind of human activity supporting the natural process overgrowth at this time (Barabach, 2012; Bartkowski, 1970; Hładyłowicz, 1932). We believe that this resulted from the natural shallowing of this part of lake–mire complex. Transfer function analysis of testate amoebae revealed that the first half of 19th century up to AD 1860 was the period of the wettest habitat during the last 200 years at Rzecin mire (Lamentowicz et al., 2015). The alkalinity of water was found stable, slightly acidic (Figure 8). At the same time, sedge communities developed, and after AD 1860, the proportion of Bryales increased as a result of a lowering of the water table and lower trophy. The beginning of terrestrialization was characterized by only slight changes in physical properties indicating relatively stable hydrological conditions.
At site R2, terrestrialization occurred before AD 1890 (Figure 8) and was most possibly induced by anthropogenic activity. Fluctuation of hydrological systems within Puszcza Notecka and drainage of its wetlands took place since the 1840s and were forced later in the second half of 19th century together with the development of an oleander colony (Kusiak, 2002b). Construction of the drainage ditch running from Rzecin Lake was part of such an activity. Its occurrence is noted on cartographic materials, for the first time on the map published in1892 (Barabach, 2012); so, it must have been constructed earlier. The change of sediment features at site R2 before AD 1890 and the subsequent abrupt decrease in lake area (Barabach, 2012) must have been a direct consequence of rapid water runoff. Thus, the date of ditch digging just before AD 1890 seems to be most probable.
A ditch draining Rzecin Lake caused a significant response from the fen. The definite disappearance of algae Pediastrum after 1880 was one of the results, showing a lack of open water at the R1 site. Thelypteris palustris spores were no longer present in the pollen diagram (Figure 5) neither were the roots of this species seen in the macrofossil diagram (Lamentowicz et al., 2015). The construction of the drainage ditch and the decrease in the water table were probably the trigger for the spread of Sphagnum teres. The appearance of Sphagnum teres indicates a gradual isolation of the ground water in the sampling site. This species usually begins ombrotrophication or fen acidification (Granath et al., 2010; Hajkova and Hajek, 2004; Hölzer, 2010). Therefore, remains of Sphagnum teres are often found in the initial phase of the development of ombrotrophic bogs (e.g. Gałka et al., 2015; Gałka and Sznel, 2013).
For the same reason, that is, the building of the ditch, the shallowest part of the lake dried out, this included the area surrounding core R2. The change was not a long-term process of overgrowth, but an abrupt decrease in the water table and a simultaneous rapid spread of Bryales over a larger uncovered surface of the boggy bottom. The scheme of such sudden processes was discussed by Ireland and Both (2011) and Kowalewski (2014). Bryales overtook earlier components of the lake ecosystem: Characeae and Pediastrum (Figures 6 and 8). Aquatic animals such as Turbellaria, Porifera, or Daphnia disappeared as well. Eutrophic elements of the limnic ecosystem were replaced by less-demanding telmatic plants as a result of water acidification (fall of pH) and a decrease in conductivity (Lamentowicz et al., 2015).
Development of the Rzecin peatland in 20th century – Disasters
During the first few decades of 20th century, a slow increase in water level is suggested by paleobotanical indicators (Figures 5–7). Spread of Thelypteris palustris was the result of flooding of some parts of the mire which enabled growth of this species on those areas with open water table. This was accompanied by dynamic development of Bryales population and, at the end of this period, a short phase of Sphagnum teres occurrence. Such a situation probably resulted from the increasingly lower efficiency of the drainage ditch because of neglect of its maintenance. Given the historical background (the First World War, Polish independence, and Russo-Polish War of 1919–1920), when economic problems were less important, this neglect seems quite possible.
Settlement within Puszcza Notecka and economic activity located and related to the forest, for example, charcoal and pine tar industries, caused a higher degree of fire hazard (Hernik, 1979). Fires in the 1920s and 1930s resulted in a clear rise of water level. One ecological disaster, namely, the outbreak of Panolis flammea in 1922–1924, was an additional, important factor supporting this phenomenon in the mid-1920s. Panolis flammea is a species almost exclusively feeding on Pinus sylvestris (Kiełczewski, 1947) and preferring older tree stands (Szmidt, 1993). Hence, Puszcza Notecka, built mainly of Scots pine communities, was a very susceptible forest for such an attack. According to the then-press news (Rynek drzewny i budowlany, 1929) during the second stage of the disaster, large losses were also incurred by other tree species. The disaster was so big that Panolis flammea attacked spruce, birch, aspen, forest grasses, and cereals because of the lack of pine food. Over the next few years, loss of deciduous tree populations reappeared as a result of hydrological changes within Puszcza Notecka. At the inter-dune areas, small closed water bodies arose (Kusiak, 2002a) and caused dieback of living trees (Kopytowski, 1931). Abrupt deforestation of many hectares was the reason for the significant decline in respiration levels in the ecosystem. According to Przybylski (1993), pine forests in temperate climates soak up 66–85% of precipitation, so sudden deforestation must result in arise of the water level.
In the second decade of 20th century, a higher content of ash and a higher concentration of charcoal were found in the sediments (Barabach, 2014). There was also a clear decrease in carbon accumulation in core R1 (Figure 4). Charcoal analysis gives a good record of fires; however, it might be supported by historical data (Clark, 1990; Tinner et al., 1998). Concurrency of Panolis flammea gradation and charcoal peak has been found (Figure 8), and this could have two causes. Open landscape after deforestation favored transport of charcoal from a large area. Furthermore, a method was used to fight the pest by gathering and burning litter containing chrysalises of Panolis flammea (Śliwa, 1991). So, there was a supply of charcoals from small, controlled fires, which increased the signal compared with the earlier and later records.
These important changes in regional plant communities surrounding Rzecin obviously influenced local succession on the mire, mainly because of hydrological changes. At both sites, these fluctuations manifest in different ways. At site R1, an abrupt decrease and disappearance of Thelypteris palustris (macrofossils and not pollen) and Sphagnum teres and a dynamic but short lasting drop of Bryales were observed at the turn of the 1910s and the 1920s. A short-term increase in the proportion of Sphagnum teres in AD 1920–1927 finished quickly, as a result of an increase in the water table, after the mass occurrence of Panolis flammea and the almost complete deforestation of the surroundings of the mire. During the 200-year history of Rzecin mire, Sphagnum teres, according to its ecological demands, always developed in coring site at times of decreasing and low water levels (Lamentowicz et al., 2015). In the R1 core, peat accumulated during the Panolis flammea disaster, and later, to 1937 AD, a thick mineral layer was found (Figure 2). This was probably blown by the wind and/or flowed with the water from the catchment where, because of deforestation, erosion processes occurred on a large scale (Solon et al., 2012; Solon and Lechnio, 2013). The high content of mineral components, confirmed by the extreme AC of the sediment (86%; Figure 4), was an additional factor influencing the removal of oligotrophic Sphagnum teres. The occurrence of windblown and/or flowed mineral layer is confirmed by the presence of seeds of weeds (Lamentowicz et al., 2015). These undoubtedly came from segetal and ruderal ecosystems present in the surrounding area influenced by human activity. Such an interpretation is suggested by settlement which existed nearby (Figure 1) and the dominant westerlies in this region (Woś, 1994). Pinus sylvestris pollen, the proportion of which did not decrease despite strong deforestation, was undoubtedly allochthonous. We think that pollen was blown by the wind quelling the forest litter and taken with the water floating down from the open area to the mire and flushing the surface. The presence of numerous pine stomata identified during pollen analysis (Figure 5) seems to confirm this idea, the more so that macrofossils of Pinus sylvestris proving growth of this species in situ were not found at that time. Probably, pine needles from the forest cover were transported with the floating water. The mineral layer identified in the peat caused a discontinuity of mire succession and a decomposition of OM in the bottom of the mire. Roots and rhizomes of Cyperaceae coming from overlying sediment layers were the main organic components of this layer, so this extreme caused a dramatic decrease in carbon content in the part of the peatland represented by Rzecin 1 (Figure 4).
In site R2, in contrast to R1 provided almost no supply of mineral matter. A significant increase in water level is found because of deforestation after Panolis flammea disaster (Kopytowski, 1931). This is confirmed by the presence of subfossil remnants of aquatic invertebrates such as Chironomidae head capsules and ephippia of Ceriodaphnia and Simocephalus (Figure 7). Earlier these had been found only in the bottom layer of limnic sediments of the R2 core. A short-lived enlargement of the lake area took place after Panolis flammea disaster, and this was also observed in cartographic sources (Barabach, 2012). Apart from the increase in the lake, periodic flooding of the mire must have appeared during the spring – summer seasons, long enough for the development of algae populations such as Pediastrum boryanum, Pediastrum duplex, Botryococcus, and others in plankton (Figure 6). There were some increased water level, and the occurrence of Bryales caused an increase in PAR.
1940–2010 peatland development
After the disaster in the 1920s and dynamic changes both in the mire and within Puszcza Notecka (local and regional ecosystems), Bryales and Cyperaceae communities developed again post ca. 1940 at site R1. Because of the forest plantation, the water level gradually decreased; however, after 1950, it stopped because of the straitened flow of water out of the drainage ditch (Barabach, 2012). The neglected drainage canal was less and less effective and influenced the short stabilization at the mire until its clearing in 1962, which resulted in the next drop of water level. A reduced proportion of Bryales which was overtaken by Cyperaceae was a response to this slight drying. However, this situation must have been balanced by high precipitation in 1970s and 1980s in this part of Poland (Woś, 1994) because no changes in carbon content, PAR, or BD are found (Figure 4).
At the R2 site after the Panolis flammea disaster, there was a significant oligotrophication of habitat. Poor Sphagnum, Ericaceae communities, and Aulacomnium palustre appeared on acid habitats of Oxycocco-Sphagnetea (Longton, 1982; Matuszkiewicz, 2001). They can still be observed (Wojterska et al., 2001; Figure 7). Plants of higher trophic demands were also found, for example, cattails (Typha latifolia, Sparganium emersum type – most probably Typha angustifolia; Figure 6) or Menyanthes trifoliata. At the R1 site, oligotrophic trends are observed as late as after AD 1990 after a decrease in Bryales–Cyperaceae communities and the development of Sphagnum teres. The presence of Oxycoccus palustris in the youngest layers of sediments confirms low trophy in both sites. This species prefers acidic soils, up to pH 4.7 and spreads quickly on wetlands after burning (Rook, 2002; Zarzycki et al., 2002).
Macrofossil analysis revealed fruits of Comarum palustre; however, at the R2 site, it appeared in the 1940s and at R1 over 30 years later. In the pollen diagram, sporomorphs of Comarum palustre are identified within the type Potentilla (Beug, 2004), which has been found since 1870 at R1 (Figure 5) and almost throughout the diagram, except for the 21st century.
The last two decades after 1990 are marked by changes resulting from a big fire in 1992. The growth of birch trees, a light-demanding species, is thought to be a result of the renewed use of even-aged management in Puszcza Notecka (Barabach, 2014).
Carbon sequestration
Despite the fact that the onset of terrestrialization and the history of the peatland plant community development of R1 and R2 sites were different, both profiles revealed similar, very high accumulation rate values: 170 and 190 g m−2 yr−1, respectively. These are the highest CARs detected in Polish mires. Fiałkiewicz-Kozieł et al. (2014b) provided an estimated value of 140–142 g m−2 yr−1 for a waterlogged poor fen, Mikołeska, and 85–86 g m−2 yr−1 for a drained fen, Bagno Bruch, from the Silesian Upland, S Poland. In the Puścizna Mała raised bog in the Orawa-Nowy Targ Basin, S Poland, the mean CAR is 41.2 g m−2 yr−1 (Fiałkiewicz-Kozieł et al., 2014a). Described values from Poland are much higher than in boreal ecosystems (e.g. 12–23 g C m−2 yr−1 Turunen et al., 2001). However, it should be noted that high CAR is not connected with biogeography but rather with the floating mat that is usually very wet. It promotes very high CAR, but it does not reflect moister climate in Poland than in the boreal areas. The accumulation rate in both profiles is relatively similar until the end of the 19th century (Figure 4).
Then, deforestation caused dramatic changes in R1. An extreme drop in CAR value is observed. The deceleration of CARs after extreme mineral matter input to the peatland was also observed by Yu (2006) after a volcanic eruption and in Bagno Mikołeska (Fiałkiewicz-Kozieł et al., 2014b) after climatically or anthropogenically driven releases of sand. These events strongly altered the trophy and made conditions more oligotrophic and drier. In R1, the supply of the inorganic fraction was so dramatic in 1920s (86% of ash) that it enriched peatland plant composition with the grassland and meadow species such as Ranunculus and Polygonum persicaria (Lamentowicz et al., 2015). Carbon accumulation almost stopped. Such an extreme drop was not detected in R2 (Figure 4). Changes in CAR were slighter there. However, the decrease in CAR lasted only a few years. Then, the peatland started to accumulate again, indicating self-restoration ability. Experimental research by Graf and Rochefort (2009) indicates the great potential of both natural and harvested fens to accumulate carbon. Fiałkiewicz-Kozieł et al. (2014b) also highlight the recovery of peatland after a drainage event.
From 1970, an increasing trend in CAR is observed in both profiles, which is in close agreement with other past records of carbon sequestration (Fiałkiewicz-Kozieł et al., 2014b). Minor fluctuations are related to water level changes and seasonal dryness. This is in particular observable at R1 (from ca. AD 2000 to 2005). The maximum increase is noted after 2005 in both profiles (Figure 4). However, at Rzecin 2, which was collected 2 years later, values half this maximum level are observed, which might indicate the influence of modern dryness and climate warming. Drainage of the investigated area influenced the water regime and peat accumulation. However, settlement, presence of pastures, and cultivated fields in the neighborhood of the peatland have also changed botanical and phytosociological features influencing the sequestration.
Natural and anthropogenic factors influencing the development and current state of Rzecin mire
The current state of Rzecin mire, the variety of plant communities, and the presence of rare and precious species could suggest that this is a pristine ecosystem, almost not influenced by human activity. In fact, anthropogenic pressure was not intensive on adjacent areas. One village, whose habitants through the ages have carried on extensive agriculture with cultivation and inbreeding, has not resulted in strong human-induced changes to the mire. This might have been because the village was surrounded by pine forest protecting it from both abrupt hydrological changes and inflow of overabundant nutrients from other directions (N, E, and S). The stability of tree stands was the condition of the protection effectiveness. Current phytosociological research (Wojterska et al., 2001) shows that all the peatland consists of a mosaic of over 20 plant communities. On the other hand, paleobotanical analyses reveal relatively quick variability of these communities and dynamic precedence of particular succession stages. This has been caused by local hydrological differentiation of habitats, pH, nutrients availability, and type of soil (organic or mineral). This variety of habitats and their instability was influenced by intentional and unintentional anthropogenic activity in relation to the mire. Construction of the drainage ditch was undoubtedly intentional. Fires in Puszcza Notecka leading to deforestation and increases in water level were unintentional. A special unintentional activity was negligence of drainage ditch clearing, leading to the cessation of its flow captivity and irregular flow out of water from the peatland.
Gradation of pathogens could also be counted among natural factors. This results in deforestation, and consequences for the mire are similar to those observed after fire. However, it is debatable whether this factor is exclusively natural. One must consider that mistaken human economy concerning forestry, and the planted, monospecies tree stands led to gradation of pathogens or at least made them much more likely to occur (Bernadzki, 1993; Broda, 1993; Przybylski, 1993). The loss of a large area of forest is a further consequence. So, we can conclude that the pristine nature of the mire is only a mirage.
Conclusion
The Rzecin peatland existed from few thousand of years and was influenced by natural process of development and weak human activity. During the last 200 years, the natural and anthropogenic factors influencing this development were recorded. Disasters in the surrounding forest, such as fires or Panolis flammea gradation, resulted in abrupt and clear changes within the peatland. This led us to the first conclusion that existence of the forest is a necessary condition for the good status of this peatland. Both natural and human-induced reasons for deforestation have caused disturbances to its functioning, as seen in lithological structure and paleoenvironmental record. A significant human activity, namely, digging of the drainage ditch and negligence of its clearing then, was the direct reason for the water-level changes. They were related to trophy changes and, indirectly, to vegetation succession on the peatland. Generally, anthropogenic factors influenced the peatland to higher degree, and therefore, it cannot be regarded as a pristine one.
The Rzecin peatland case study provides some implications for nature protection: the peatland has high level of ability for rapid self-restoration, even after dramatic hydrological events, and the CAR is very high and increased significantly after 1970.
Footnotes
Acknowledgements
We thank Piotr Kołaczek for the support in pollen analysis identification and interpretation and Kazimierz Tobolski for valuable discussion. We appreciate valuable remarks and improvement of the manuscript by Julian Wiethold and the second anonymous reviewer.
Funding
This study was funded by the National Science Center, Poland, project no. N304078440.