
Abstract
In order to clearly understand the response of raised mires to past climate change, it is important to consider the full range of drivers and responses of these ecohydrological archives. To this end, a high-resolution ecohydrological record from Littleton Bog, Co. Tipperary, Ireland, was generated utilizing a combination of plant macrofossils, testate amoebae and humification analysis. Chronological control for this record was provided by a Bayesian age–depth model based on AMS radiocarbon dates. Testate amoebae–derived reconstructed peatland water tables indicate a series of sudden shifts to dry bog surface conditions at c. 3140, c. 2510 and c. 1540 cal. BP. These events display a distinctive palaeoecological signal and chronological tempo that is best explained as a result of a series of bog burst events and which seem inconsistent with other explanations. The chronological correspondence between the bog bursts at Littleton and a set of similar events at Derryville Bog, c. 5 km to the north, is noted, as is the broad correspondence of these events with wet shifts indicated in regional peatland water table compilations from Britain and Ireland. A range of possible driving mechanisms for these events is proposed, including anthropogenic disturbance of the bog surface, non-linear response to climate forcing, internal bog dynamics, vegetation succession or a combination of factors. We illustrate the need for further multi-proxy investigations to fully understand these phenomena.
Introduction
Since Barber’s (1981) falsification of the cyclic model of peat bog growth, raised mires have been recognized as important archives of Holocene environmental change (Barber and Charman, 2003; Charman, 2010; Swindles et al., 2013). As a result of its oceanic climate that is strongly influenced by the North Atlantic Drift and variability in westerly airflow, Ireland has been identified as a key region for Holocene palaeoclimatic studies (Lehman and Keigwin, 1992; Swindles et al., 2013). Irish peatland palaeohydrological records have provided evidence for regional climatic teleconnections (Barber et al., 2000; Langdon et al., 2013; Swindles et al., 2010) revealing centennial-scale climatic variability during the mid Holocene to late Holocene (Swindles et al., 2013) and allowing the examination of discrete climatic ‘events’ at 5.2 ka (Roland et al., 2015), 4.2 ka (Roland et al., 2014) and 2.8 ka (Plunkett, 2006; Swindles et al., 2007) that have been identified in records in other regions and at the hemispheric to global scale (Barber et al., 2004; Bond et al., 2001; Mayewski et al., 2004; Van Geel et al., 1996).
Recently, the complexities of the peatland palaeohydrological record have become increasingly apparent. When examined in detail, regional coherence between records has often been found to be unclear (Blackford, 2000; Payne and Blackford, 2008; Swindles et al., 2013). At least some of this inconsistency can be attributed to complexities in proxy environment responses (e.g. Caseldine and Gearey, 2005; Mauquoy and Barber, 1999a; Swindles and Roe, 2007; Yeloff and Mauquoy, 2006), imprecision in statistical reconstruction methods (Telford and Birks, 2005, 2011a, 2011b) and, above all, chronological uncertainties (Baillie, 1991; Blaauw, 2012; Blaauw et al., 2007; Plunkett, 2006). It is nevertheless apparent that the peatland palaeohydrological record is typically ‘noisy’ and may not reflect a ‘pure’ palaeoclimatic signal, but one that is modulated both by localized variability and internal, autogenic, feedback mechanisms (Morris et al., 2011, 2015; Swindles et al., 2012) and, in some cases, also potentially human impact (Casparie, 2001; Turner et al., 2014).
In addition to the complexities inherent in the peatland palaeohydrological record itself, other poorly understood phenomena such as bog bursts provide a further, and currently unquantified, source of uncertainty. Bog bursts are defined as catastrophic mass movements in the surface of a raised mire resulting in the outflow of saturated peat and the lowering of the water table (Dykes and Warburton, 2007). Since 1900, over 50 bog burst events have been recorded in Ireland (Kiely et al., 2010), although most of these recent events have occurred in blanket peatlands (Feehan and O’Donovan, 1996: 399–401) and would therefore mostly be classified as ‘bogflows’ or ‘bog slides’ rather than ‘bog bursts’ (sensu Dykes and Warburton, 2007). Nevertheless, there are contemporary eyewitness accounts of bog bursts in lowland raised bogs during the historic period, for example, at Kilmalady (Woodfield Bog), Co. Offaly, in 1821 (Feehan and O’Donovan, 1996: 402; Tallis, 2001: 219–220).
In palaeoenvironmental records, these events are typically identified through the presence of erosional features, reversals in peat age–depth relationships and sudden dry shifts in BSW records. At present, there are only a few palaeoenvironmental records that unambiguously show bog bursts including sites in the Netherlands (e.g. Van Geel et al., 2014), Tumbeagh Bog, Co. Offaly (Casparie, 2006) and Derryville Bog, Co. Tipperary (Caseldine and Gearey, 2005). It has been suggested that bog bursts might have been a relatively common phenomenon associated with the normal development of raised bogs in Ireland (Casparie, 2005: 25); however, the evidence for this in the palaeoenvironmental record is sparse. Part of the reason for this may be the inherent difficulty in conclusively identifying such events in peat sequences: those studies which have identified these events have done so based on widespread mapping of peat stratigraphy (including in section) and the analysis of multiple peat sequences from the same site. Such detailed and time-consuming studies – which have generally been driven by wetland archaeological rather than purely palaeoecological research questions – are unsurprisingly rare, and therefore, at present, it is not only difficult to determine how widespread such events were, but the drivers and palaeoecological consequences of bog bursts are still not fully understood.
These uncertainties highlight the importance of both a multi-proxy approach to palaeohydrological reconstruction and the consideration of records from multiple sites to fully investigate these complexities. To this end, a palaeohydrological record from a site in Central Ireland is presented, displaying just such a range of complex forcing mechanisms and palaeohydrological responses reflected in multiple palaeohydrological proxies.
Site
Littleton Bog is a milled peat production bog, and former raised bog, located c. 8 km east of Thurles, Co. Tipperary, Ireland (52°41′56″N, 7°39′40″W, altitude: 125 m O.D., ~300 ha in area; Figure 1). The solid geology of the area consists of carboniferous limestone overlain by superficial deposits of glacial till (diamict). The site, which measures c. 2 km from N-S and 1 km E-W, forms part of a larger chain of peatlands lying within a possible glacial valley or tongue basin stretching for 40 km between the Slieve Bloom Mountains in the north to the Slieveardagh Hills and Cashel in the south (Casparie and Gowen, 2005). At Gurteen, Co. Offaly, 50 km north of the site, mean annual rainfall of 948.2 mm and mean temperature of 9.8°C were recorded for the period 1981–2010 (Met Éireann 2012).
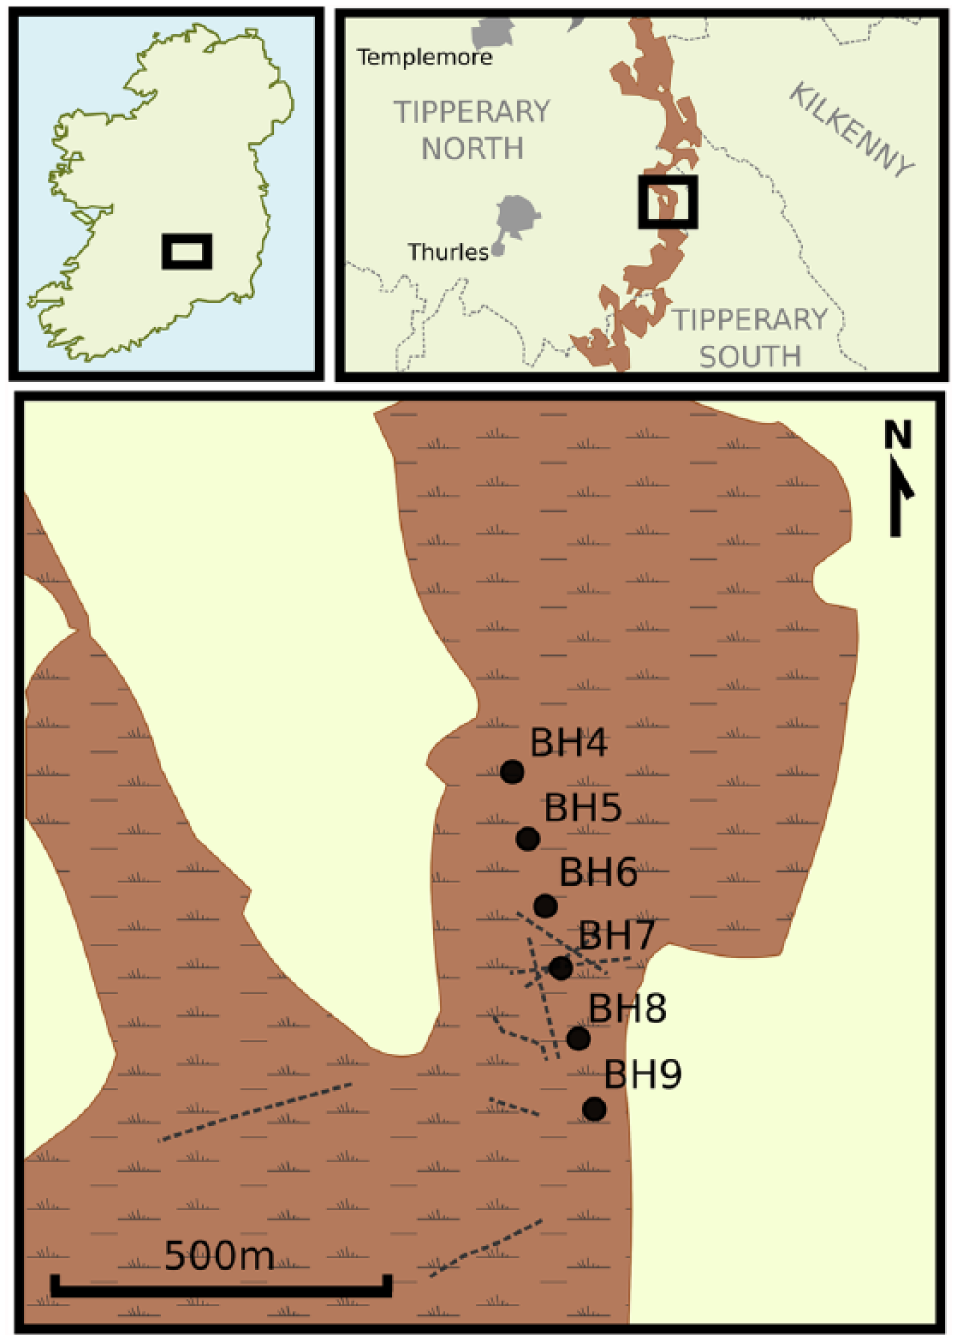
Site location. Shaded areas indicate areas of raised mire and milled production bogs. In the lower panel, the location of the borehole transect is marked by the black circles and known extent of archaeological trackways are marked by dashed lines.
The Littleton group of bogs is notable for palynological work carried out in the mid-20th century by Mitchell (1956, 1965). This work defined the main phases of recent vegetation history, with Littleton recognized as the type site for the Holocene in Ireland – the ‘Littletonian’ in older literature (Mitchell, 1981).
Archaeological investigations at Littleton Bog, carried out between 2006 and 2008, revealed more than 30 archaeological features, mainly wooden trackways and ‘platform’ structures, dating between c. 3500 and 1600 cal. BP, that is, Early Bronze to Iron Age (Turrell, 2008; Whitaker, 2006). Similarly, other former raised bogs in the vicinity of the site have been subject to archaeological study in advance of industrial peat harvesting and mineral extraction, revealing a similar pattern of widespread past human activity (Gowen et al., 2005; National Monuments Service, 2013).
Methods
A transect of six boreholes (BH4–BH9), at 100-m spacing, was put down using a ‘Russian’ peat sampler between two NNW-SSE-aligned drainage ditches. In order to avoid areas of direct anthropogenic disturbance, boreholes were situated a minimum of 50 m away from the conjectured alignment of any known archaeological structures. The peat stratigraphy was described in the field using standard criteria (Kershaw, 1997; Troels-Smith, 1955), and the location with the deepest and most representative ombrotrophic peat sequence was selected for re-sampling to recover peat cores for laboratory analysis.
A total of 10 samples of picked and cleaned aerial plant remains for AMS 14C dating were taken from the core between 26 and 369 cm below ground level (bgl). Nine samples consisted of stems or branches of Sphagnum spp. and one of stems of Eriophorum sp. Dates were calibrated using the IntCal13 calibration curve (Reimer et al., 2013) in the Bacon v.2.2 software package (Blaauw and Christen, 2011) that runs in the R statistical environment (R Core Team, 2013). A Bayesian age–depth model was then developed using Bacon which generated 95% confidence intervals and weighted mean age estimates at 1-cm intervals along the core through several million MCMC iterations (Blaauw and Christen, 2011). In the following text, dates prefixed by ‘c’ are weighted mean values from the Bacon age–depth model, rounded to nearest 10 years.
The upper 250 cm of BH6 was subsampled at 4-cm intervals for colorimetric humification analysis. Subsamples of ~4 cm3 were prepared using standard methods (Blackford and Chambers, 1993; Chambers et al., 2010), and the percentage light absorbance at 540 nm was measured.
Subsamples for plant macrofossil analysis were taken at 4-cm intervals through the uppermost 250 cm of BH6. Subsamples of 4 cm3 volume were analysed using the Quadrat and Leaf Count (QLC) method developed by Barber et al. (1994): proportions of peat components were estimated under ×10 magnification, and a random selection of Sphagnum leaves (>100 per sample) were identified at ×400 magnification to the lowest possible taxonomic level. Identifications were made using the University of Reading reference collection and published sources (Hill, 1976; Hill et al., 1992; Mauquoy and van Geel, 2007). Detrended correspondence analysis (DCA) was carried out on the plant macrofossil data, following the methods of Barber et al. (1994), with rare taxa removed, and values for all variables (including identified Sphagnum taxa) calculated as a percentage of the total peat matrix in each sample. Additionally, a variant of the Dupont (1986) Hydrological Index (DHI) with additional taxa scores from Mauquoy et al. (2008) and Daley and Barber (2012) was applied to the macrofossil data from the ombrotrophic part of the sequence only.
Subsamples for testate amoebae analysis were taken at 2-cm intervals through the uppermost 250 cm of BH6. Subsamples of 1 cm3 volume and 1 cm stratigraphic thickness were prepared following standard methods (Booth et al., 2010; Charman et al., 2000). Samples were mounted in distilled water and examined at magnifications of between ×200 and ×1000 until counts of 50–150 tests were reached; samples with fewer than 50 tests were excluded from further analysis. Test identifications were made using published guides (Charman et al., 2000; Corbet, 1973; Ogden and Hedley, 1981) and followed the taxonomy of Charman et al. (2000) except that Amphitrema flavum is placed in the genus Archerella (Gomaa et al., 2013). Quantitative reconstructions of BSW, expressed as depth to water table (DWT), were obtained using the pan-European transfer function of Amesbury et al. (2016), with sample-specific errors generated using 1000 bootstrap cycles (Line et al., 1994).
Peat stratigraphy and chronology
Figure 2 shows a stratigraphic cross section across the site based on the borehole transect. The present surface profile of the bog is slightly concave because of drainage, peat removal and subsequent shrinkage and compression of the peat; nevertheless, in the centre of the basin (BH5-7), up to 500 cm of peat was recorded. Detrital lake sediments were encountered at the base of the peat sequence within the centre of the basin, with clastic mineral sediments beneath the peat at the edges. The basal lacustrine and minerogenic strata were overlain by up to 3–4 m of predominantly herbaceous, and occasionally woody, humified fen peat. Sphagnum-rich ombrotrophic peat of varying humification, up to 170-cm thick in BH6, caps the sequence. In BH6, there is a transition from well-humified herbaceous peat to well-humified Sphagnum-Eriophorum-Ericaceae peat at 170 cm bgl, followed by a further transition to generally less-humified Sphagnum-rich peat at 100 cm bgl. The top 18 cm of the sequence was composed of desiccated and disturbed peat that is thought to have been redeposited by peat harvesting machinery.

Stratigraphic cross section of Littleton Bog. Sampling depths for radiocarbon dating are indicated by the triangles to the left of BH6, and the humification curve is plotted to the right.
Results of the AMS 14C dating of the sequence are given in Table 1, and the age–depth model is presented in Figure 3. Peat accumulation in BH6 began before 7500–7330 cal. BP, while the top of the sequence dates to the modern period, indicating that relatively little peat, if any, has been removed from this part of the bog. The dates indicate an overall peat accumulation rate of ~21 yr cm−1, although this varies between ~24 yr cm−1 in the lower part of the sequence (369–167 cm bgl) and ~17 yr cm−1 in the upper part (167–26 cm bgl). Two inversions in the expected age–depth relationship were noted: between 240 cm (LLNL-164207) and 202 cm bgl (BETA-304237) and between 98 cm (BETA-304236) and 86 cm bgl (OxA-32928). Although the latter inversion is relatively minor and may be attributed to statistical scatter, the inversion at 240–202 cm bgl is more notable, and BETA-304237 (202 cm bgl) is identified as an outlier by the age–depth model, potentially indicating the redeposition of older material within this part of the peat sequence, perhaps because of root penetration.
AMS 14C dates from BH6, Littleton Bog.

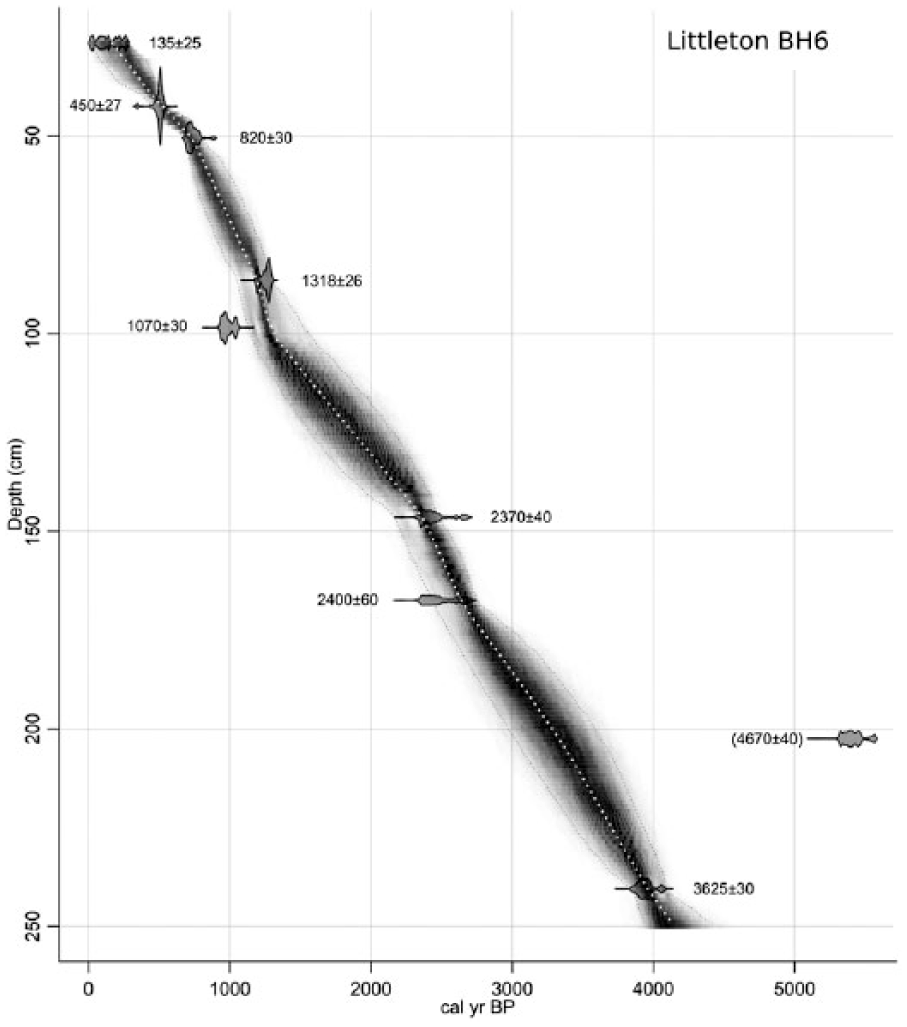
Age versus depth model. Note that only the section of core analysed, to a depth of 250 cm bgs, is shown.
Plant macrofossil analysis
The results of the plant macrofossil analysis of the upper 250 cm of BH6 are presented in Figure 4. The diagram has been subjectively divided into plant macrofossil assemblage zones (PM-LTN1–PM-LTN6) which reflect changes in the degree of mire surface wetness based on the ecology of mire flora (sensu Mauquoy and Barber, 1999a). The plant macrofossil assemblage shows a variety of taxa and associated niches, indicating that the sensitivity of the mire to BSW changes is not limited by the presence of single eurytopic taxa (e.g. Sphagnum fuscum) (Barber et al., 1994).

Plant macrofossil diagram, BH6 Littleton Bog.
PM-LTN1, 250–210 cm bgl, c. 4140–3470 cal. BP
Zone PM-LTN1 is dominated by Eriophorum sp. (cf. vaginatum) with abundant undifferentiated monocots, occasional ericaceous remains and high proportions of decomposed unidentifiable organic material (UOM) <125 μm. Very low percentages of Sphagnum spp. are recorded, but these include Sphagnum sect. Acutifolia, Sphagnum sect. Cuspidata, Sphagnum papillosum and Sphagnum austinii. In general, this zone is indicative of base-poor, relatively dry, bog surface conditions with no evidence for the mesotrophic fen taxa seen in the subsequent zone PM-LTN2 (described below).
PM-LTN2, 210–170 cm bgl, c. 3470–2690 cal. BP
This zone is dominated by remains of Carex sp. and, in the lower part of the zone, Phragmites australis, indicative of a fen intermittently or permanently flooded with shallow or still water (Haslam, 1972). Carex sp. (including Carex limosa and Carex rostrata) occur in mesotrophic and poor fens, although C. limosa can also be found in pools in ombrotrophic bogs (Mauquoy and van Geel, 2007). The absence of Sphagnum in this zone is indicative of peat accumulation in a mesotrophic/base-poor fen.
PM-LTN3, 170–100 cm bgl, c. 2690–1320 cal. BP
PM-LTN3 is dominated by Sphagnum spp. (predominantly S. sect. Acutifolia with some S. papillosum, S. sect. Cuspidata and S. austinii), Eriophorum sp. (cf. vaginatum), Ericaceae and undifferentiated monocots. The abundance of Sphagnum and Eriophorum in this zone is indicative of a transition to ombrotrophic conditions, suggesting that the fen–bog transition (FBT) occurs at c. 170 cm bgl. The pioneer raised mire flora in this zone is indicative of a relatively dry bog surface, the dominant component of the Sphagnum community being S. sect. Acutifolia. Sphagnum species within this section are difficult to differentiate and can occupy a range of microforms from high hummocks to lawns (Mauquoy and van Geel, 2007); however, their presence in the BH6 assemblage appears to correlate well with more humified peat containing increased abundances of UOM and ericaceous remains. Zone PM-LTN3 is therefore considered to indicate an assemblage typical of drier bog surface conditions, comparable with the Acutifolium or Acutifolia–Cymbifolium communities defined by McMullen et al. (2004), thought to indicate water table depths of between 2 and 15 cm. This interpretation is supported by the presence of Scirpus cespitosus at the base of this zone, which is typically found on drier areas of raised bogs (Mauquoy and van Geel, 2007).
PM-LTN4, 100–50 cm bgl, c. 1320–730 cal. BP
PM-LTN4 is dominated by S. austinii and S. papillosum. Sphagnum papillosum is dominant at the base of the zone, indicative of relatively wet conditions since it grows on low lawn microforms (Mauquoy and van Geel, 2007). For the remainder of the zone, S. austinii is dominant; this taxon has occupied a range of microforms in the past, from low lawns to hummocks (Hill, 1988). However, studies have demonstrated the ability of S. austinii to grow in abundance in relatively dry ombrotrophic bogs (Mauquoy and van Geel, 2007), and a compact, hummock-building form is currently particularly characteristic of the oceanic NW seaboard of Europe (Daniels and Eddy, 1985). The relatively high percentages of both S. austinii and S. papillosum are perhaps indicative of moderately wet conditions throughout this zone.
PM-LTN5, 50–29 cm bgl, c. 730–230 cal. BP
Sphagnum sect. Acutifolia dominates zone PM-LTN5, along with high percentages of undifferentiated monocots, ericaceous remains and UOM. As discussed above, the dominance of S. sect. Acutifolia in conjunction with high proportions of ericaceous remains and UOM is interpreted to be indicative of dry BSW conditions.
PM-LTN6, 29–18 cm bgl, after c. 230 cal. BP
This zone is dominated by S. papillosum, indicative of wetter conditions on the bog surface (Mauquoy and van Geel, 2007).
Statistical analysis of plant macrofossil data
DCA axis 1 (eigenvalue 0.6395) appears to represent a hydrological gradient: taxa indicative of wet conditions (S. papillosum and S. sect. Cuspidata) have high axis 1 scores, and low scores are recorded for drier indicators (e.g. Eriophorum sp., Ericaceae and S. sect. Acutifolia). However, it is notable that S. austinii has the highest axis 1 score, potentially suggesting an affinity with wetter conditions at the site.
DHI scores generally show good agreement with DCA axis 1 score, especially in zones PM-LTN4–PM-LTN6, although agreement between the two indices is less clear in PM-LTN3. DHI scores range from ~700 (indicating dry conditions) to ~400 (wet). The DHI values indicate dry, but variable, BSW conditions in zone PM-LTN3 and wet conditions in PM-LTN4 and PM-LTN6, punctuated by a shift towards drier conditions in PM-LTN5. DHI scores were not calculated for PM-LTN1 or PM-LTN2, as these assemblage zones are not interpreted as being definitely indicative of ombrotrophic conditions, and thus plant macrofossil assemblages are likely to reflect changes in trophic status as opposed to reflecting a BSW-dominated signal. Since subsequent discussion of these data will focus predominantly on the BSW signal from the site, DHI scores will be used for comparison with other proxy data.
Testate amoebae analysis
The results of the testate amoebae analysis of the top 238 cm of BH6 are presented in Figure 5. Based on a visual assessment of the data, the diagram has been divided into testate amoebae assemblage zones (TA-LTN1–TA-LTN12) which are summarized in Table 2. Test concentration, although generally high, was occasionally poor, and samples yielding counts of <50 tests were excluded from further analysis; this included all samples below 238 cm bgl and some samples in zone TA-LTN3. Although test counts in zone TA-LTN1 were generally high, samples in this zone displayed some of the lowest diversity index scores for the entire sequence; this may either be an indication of ecological stress (Magurran, 1988) or, alternatively, the predominance of taxa only with relatively robust tests might be indicative of issues with differential preservation in this zone (Swindles and Roe, 2007). A total of 34 taxa were encountered in the assemblages from BH6.
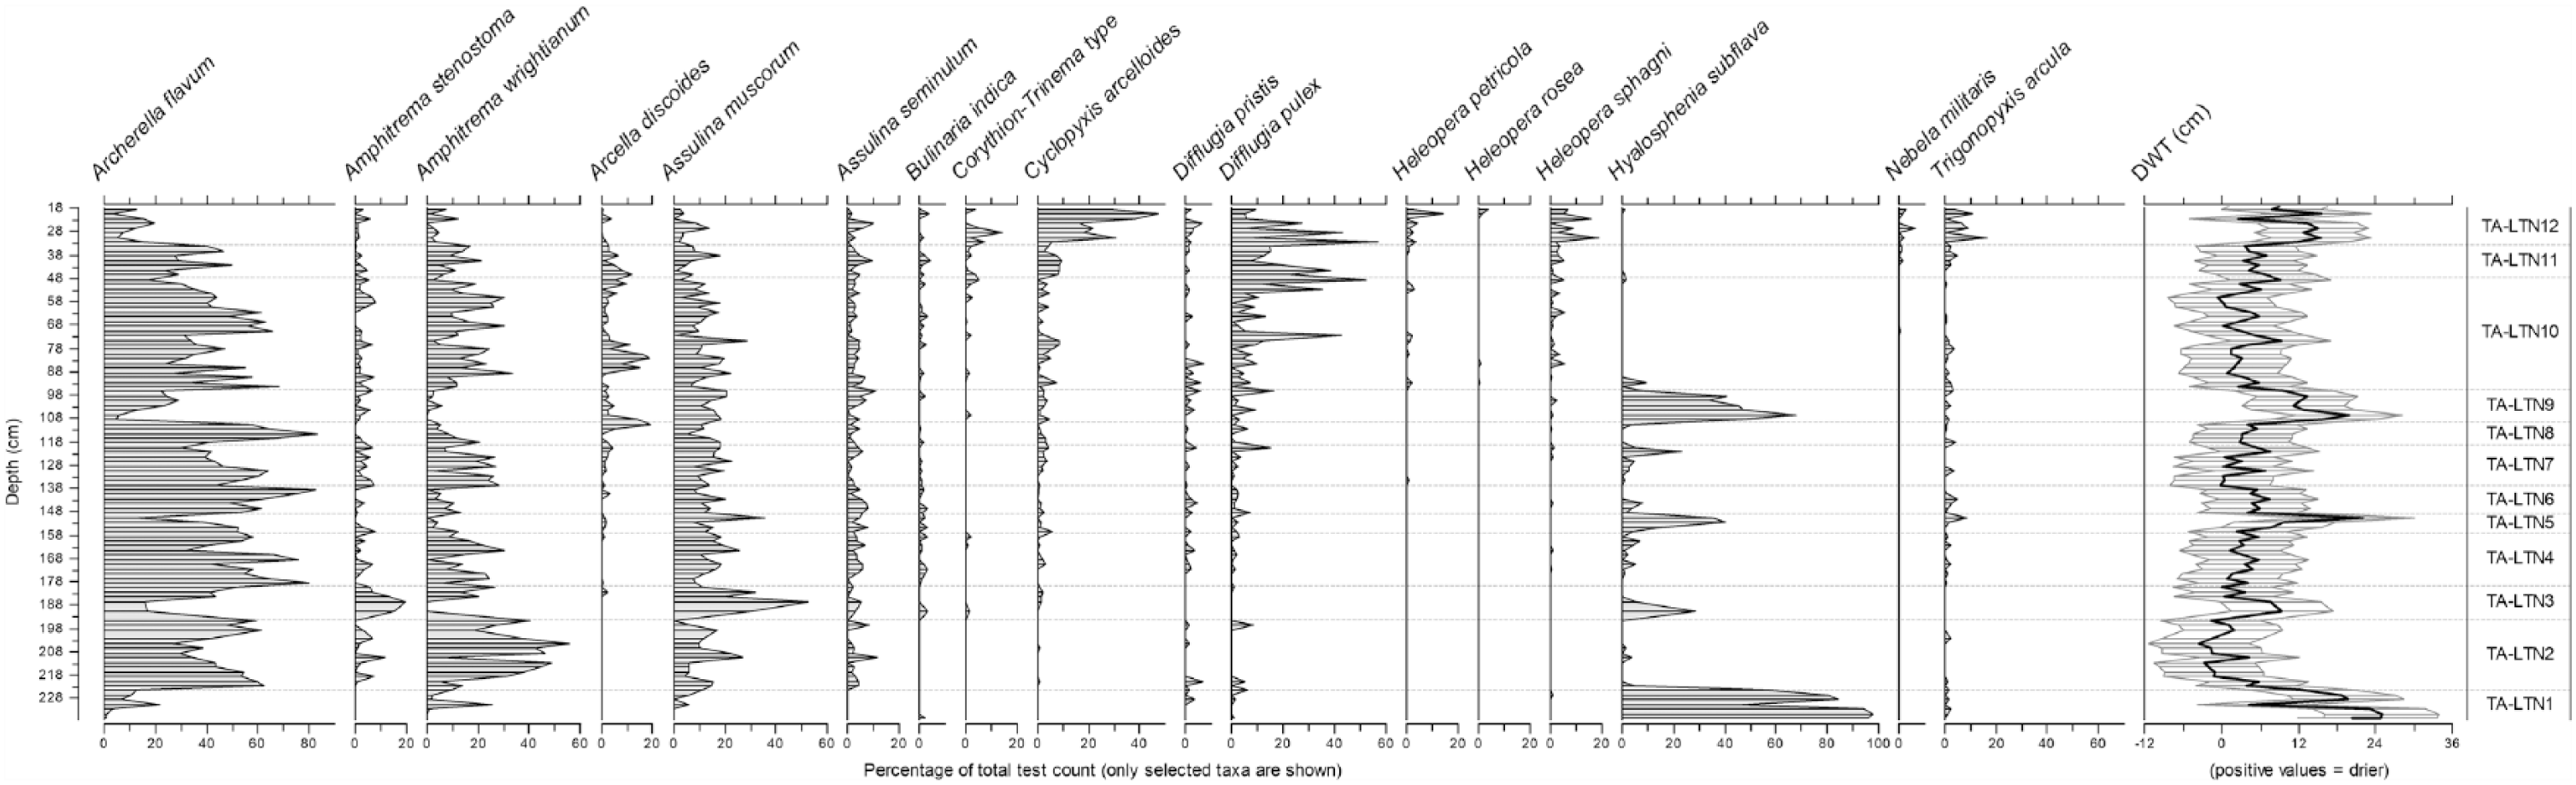
Testate amoebae diagram, BH6 Littleton Bog. Only main taxa are shown.
Summary of testate amoebae assemblage zones.
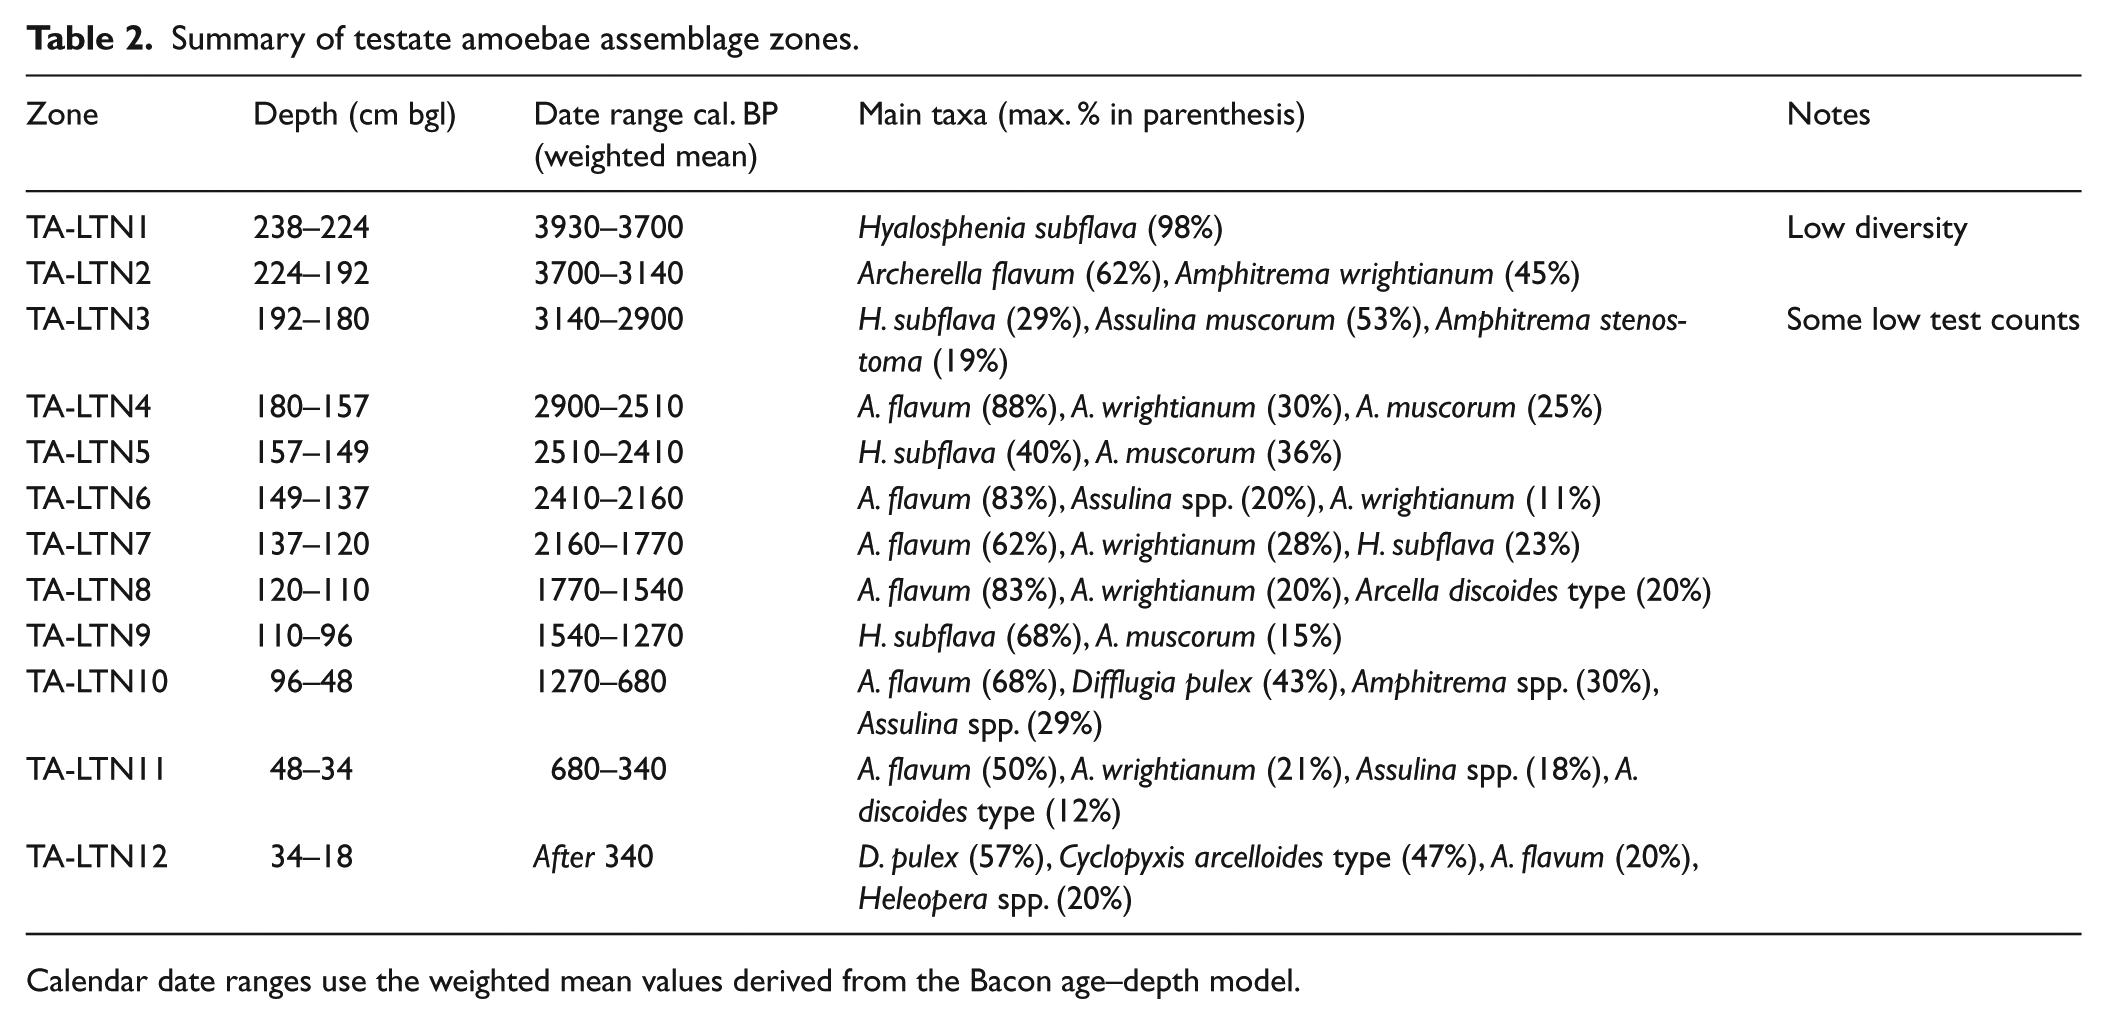
Calendar date ranges use the weighted mean values derived from the Bacon age–depth model.
DWT reconstruction
DWT values reconstructed using the pan-European transfer function of Amesbury et al. (2016) range from −3.5 to 25 cm and have a mean value of 5.7 cm (σ = 6.01) throughout the sequence from BH6. DWT values of ~20cm in TA-LTN1 indicate dry surface conditions and are followed by a distinct shift towards wetter conditions in TA-LTN2. Generally, wet to moderately wet conditions are then punctuated by a series of sharp shifts to dry conditions (DWT values >9 cm) in TA-LTN3, TA-LTN5 and TA-LTN9. Wet conditions, with reconstructed water tables at, or near, the surface return in TA-LTN10, followed by variable BSW conditions in TA-LTN11 and TA-LTN12. While absolute DWT values are shown in Figure 5, values were converted to standardized residual z scores, following the recommendations of Amesbury et al. (2016), in order to facilitate comparison with other records in the following ‘Discussion’ section.
Discussion
The central box in Figure 6 shows summaries of the three palaeohydrological proxies from BH6: plant macrofossil DHI scores, standardized humification values and testate amoebae-derived DWT z scores (Amesbury et al., 2016) plotted against weighted mean age estimates from the age–depth model.
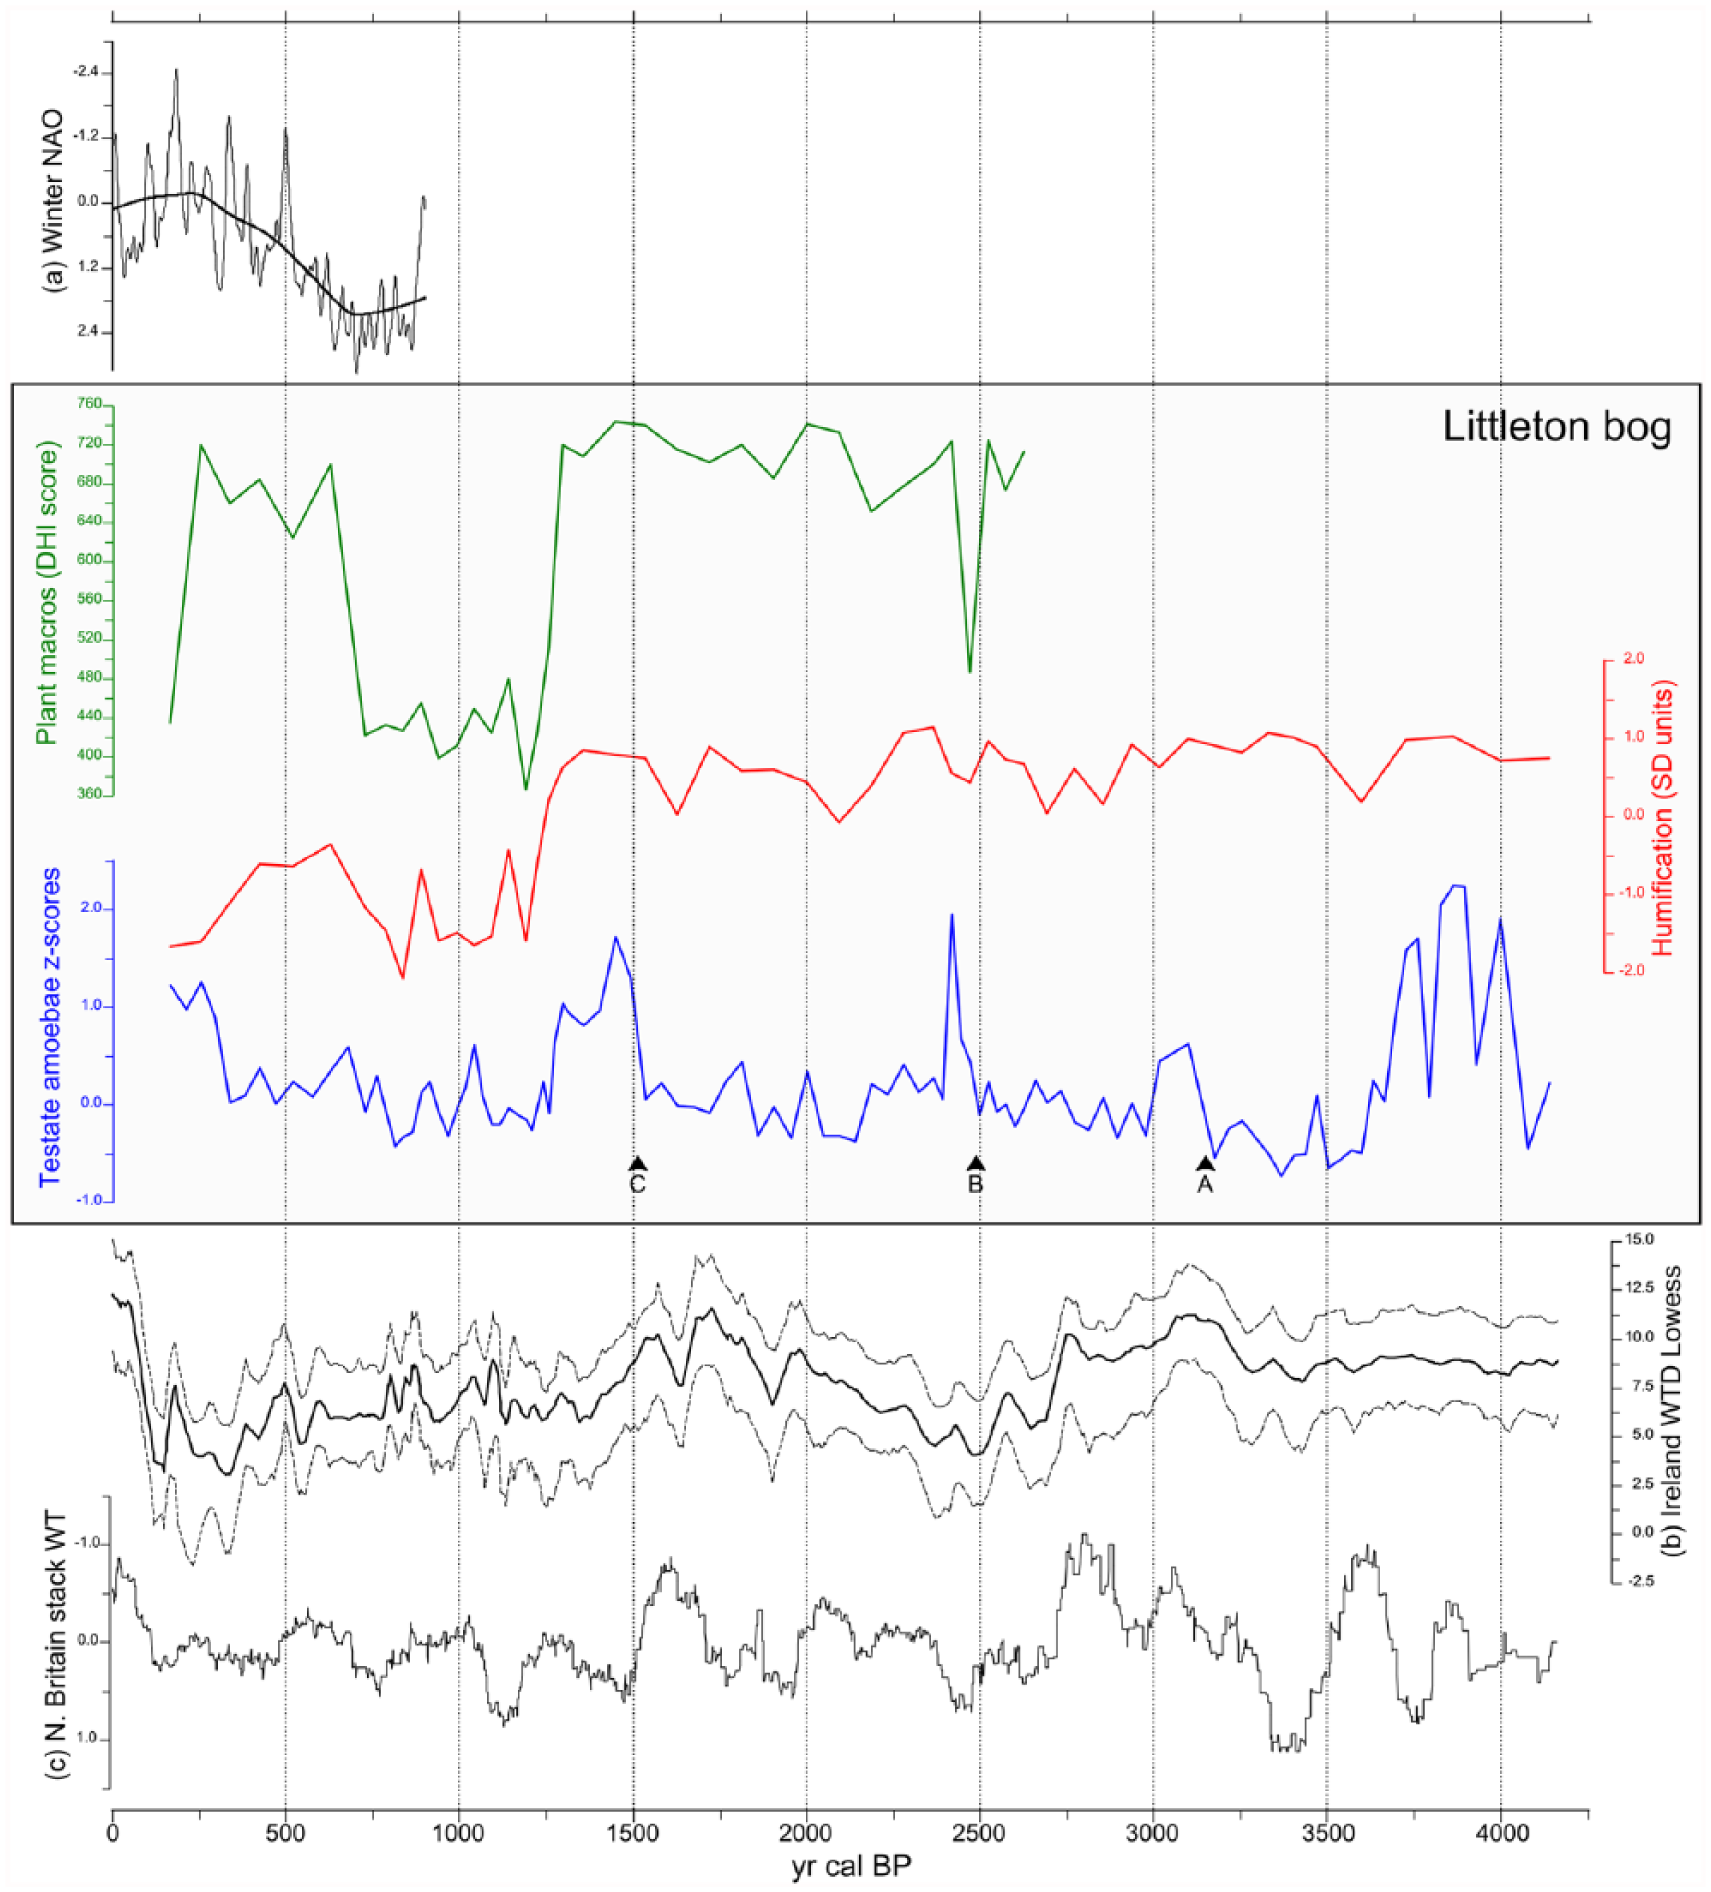
Comparison of data from Littleton Bog with other proxy records. In box: BH6 Littleton Bog – top, plant macrofossil DHI scores; middle, standardized humification values; bottom, testate amoebae–derived DWT z scores, with bog bursts A, B and C labelled. Above box: (a) reconstructed winter NAO index values (Trouet et al., 2009), shown with a bold smooth line (span = 0.45). Below box: (b) composite Irish peatland water table (WTD Lowess) (Swindles et al., 2013) and (c) Northern Britain stacked water table (Charman et al., 2006).
Visual assessment of the three palaeohydrological proxies from BH6 shows limited overall agreement in the period between c. 4100 and 1300 cal. BP. Humification values show moderate variability, but few obvious trends and little clear agreement with testate amoebae–derived DWT z scores, although plant macrofossil–derived DHI scores (only calculated for assemblages indicative of ombrotrophic conditions, from c. 2700 cal. BP onwards) do appear to show some agreement with the humification data after c. 2000 cal. BP. Between c. 4100 and 2700 cal. BP, plant macrofossils indicate changes in trophic status at the sampling location: oligotrophic conditions are indicated between c. 4100 and 3470 cal. BP, followed by a switch to assemblages characteristic of more mesotrophic conditions occurring at 3750–3160 cal. BP (95% confidence interval, weighted mean = 3470 cal. BP). This may indicate a complex pathway towards ombrotrophic conditions (sensu Hughes and Barber, 2004) at Littleton: earlier development towards ombrotrophic conditions before c. 4100 was followed by a reversion to a mesotrophic fen environment prior to the final (re)establishment of fully ombrotrophic conditions at 2840–2470 cal. BP (95% confidence interval, weighted mean = 2700 cal. BP). Widely fluctuating water tables indicated at the beginning of the record, between c. 4100 and 3700 cal. BP, may be an artefact of variable test preservation or the changes in trophic status indicated by the plant macrofossil assemblages, or both (Payne, 2010), and should therefore be regarded with caution.
The period from c. 3700 to 1300 cal. BP was characterized by somewhat variable but moderately wet conditions punctuated by a series of sudden and drastic falls in water table (DWT z scores >0.6); these events, indicated by the onset of assemblage zones TA-LTN3, TA-LTN5 and TA-LTN9 which are characterized by testate amoebae assemblages strongly dominated by Hyalosphenia subflava, are labelled A, B and C on Figure 6. The onset of events A, B and C are dated to 3440–2850 cal. BP (95% confidence interval, weighted mean = 3140 cal. BP), 2640–2301 cal. BP (95% confidence interval, weighted mean = 2510 cal. BP) and 1830–1290 cal. BP (95% confidence interval, weighted mean = 1540 cal. BP), respectively. Macrofossil assemblages during this period were generally dominated by monocotyledons reflected in generally high DHI scores; meanwhile, humification values were high but variable. An identical situation was noted by Caseldine and Gearey (2005: 598) who suggested that such monocot-dominated communities may be tolerant of (and therefore potentially insensitive to) shifts towards dry BSW conditions. The interpretation of these events is discussed below.
At 1572–1150 cal. BP (95% confidence interval, weighted mean = 1300 cal. BP), all three proxies indicate a consistent shift towards wetter conditions, which persist, with some variability reflected in all three proxies, until at least c. 750 cal. BP when DHI scores increase, lagging slightly behind an increase in humification values. This shift towards drier BSW conditions indicated by the plant macrofossil and humification data is not immediately reflected by DWT z scores, although DWT does increase later. Between c. 580 and 420 cal. BP, all three proxies indicate moderately dry BSW conditions, followed by a wet shift reflected in falling DWT and humification values and a lagged fall in DHI scores after c. 250 cal. BP. After c. 250 cal. BP, DWT values are variable but show increases not reflected in the plant macrofossil or humification data.
Evidence for bog bursts at Littleton Bog
As discussed above, the most striking feature of the testate amoebae data in the lower part of the sequence from Littleton (below ~100 cm bgl, before c. 1300 cal. BP) is a series of sudden and sharp increases in DWT values (shifts to dry conditions), labelled A, B and C on Figure 6. These events are most obvious in the testate amoebae data but are associated with broadly consistent floristic assemblages and display a distinctive chronological tempo. The defining characteristics of these events area as follows:
Sudden and sharp increases in the abundance of testate amoebae taxa indicative of dry conditions, most notably H. subflava followed by a return to dominance of wet indicators (A. flavum, Amphitrema spp. etc.) reflecting a recovery in the peatland water table after an interval of up to a few centuries. The age–depth model suggests that the re-establishment of wet conditions occurred after intervals of 0–799 years (based on the full range of the 95% confidence intervals), with weighted mean estimates for the duration of dry conditions of 242, 105 and 263 years for events A, B and C, respectively.
Plant macrofossil communities dominated by monocots with high (>20%) abundances of UOM. Remains of other taxa are typically present in only low abundances and often decline at the onset of the events. Sphagnum, where present, is typically dominated by sect. Acutifolia.
Generally high standardized humification values (>0.6 SD units for events A and C; event B displays values of >0.4 followed by a lagged increase).
Repeated events with multicentennial to millennial return times (from the onset of one event – defined by the sudden increase in H. subflava – to the onset of the following event). Based on the full 95% confidence intervals of the age–depth model, the minimum gap between events is 197 years (between events A and B, gap in weighted mean estimates = 630 years) and the maximum is 1358 years (event B to event C, weighted mean estimate = 975 years).
Generally, slower weighted mean peat accumulation rates – the section of the sequence in which the events occur (192–96 cm bgl) has a mean accumulation rate of 19 yr cm−1, compared with 16 yr cm−1 between 96 and 26 cm bgl.
While it is clear that these events represent repeated episodes of sudden drying and subsequent re-wetting of the bog surface, the reasons for these hydrological shifts are not clear. Five plausible explanations, which will be assessed in turn below, are as follows:
A series of sudden and severe droughts;
Direct human impact – artificial drainage of the bog or peat cutting;
Bog bursts at a distant site elsewhere in the Littleton Bog complex;
Bog bursts at Littleton Bog;
Some other unexplained, and as yet untheorized, mechanism.
Drought
Given that there is evidence to suggest that the BSW record is driven by summer precipitation deficit (Charman et al., 2009), the hypothesis that the dry shifts were caused by repeated droughts is theoretically reasonable. The magnitude and duration of the dry shifts indicated by the testate amoebae would, however, require a series of extremely sudden large-magnitude droughts lasting a century or more which would be expected to be clearly visible in other proxy reconstructions; regional BSW reconstructions (see section below) do not show any evidence for such droughts. Therefore, this explanation is regarded as unlikely.
Drainage or peat cutting
This hypothesis is difficult to test because of a lack of evidence, both from Littleton Bog itself and a general lack of evidence for or against direct human impacts on raised mires in prehistory. The archaeological evidence from Littleton clearly demonstrates that people were active in and around the site at around the times of the drying events, and activities such as localized peat cutting or drainage of the bog surface could indeed account for the sudden onset and large magnitude of the drying indicated by DWT values. While human exploitation of the bog, for example, through peat cutting, might well be expected to produce a pattern of repeated signals, the long gaps between events – at least 197 years, perhaps more likely >600 years, and therefore spanning several generations – are not especially consistent with a pattern of sustained economic or cultural activity by local groups. Although difficult to test outright, there is insufficient evidence to support the hypothesis that prehistoric drainage or peat cutting occurred at Littleton and could account for the drying events.
Bog bursts at another site in the Littleton Bog complex
Derryville Bog – one of the few sites in Ireland where prehistoric bog bursts have been positively identified is the site of Derryville Bog, Co. Tipperary (Caseldine and Gearey, 2005). Derryville Bog is less than 5 km to the north of Littleton Bog and is part of the same hydrologically connected complex of wetlands; it is therefore plausible that the variations in the DWT curve observed at Littleton could be caused by the bog bursts at Derryville rather than by more local events. Bog bursts at Derryville were dated to c. 3200 and c. 2550, with a further possible burst at 1400 cal. BP (Caseldine and Gearey, 2005), and are therefore consistent, within the 95% confidence intervals, with the dating of the events at Littleton. The testate amoebae and plant macrofossil assemblages at Littleton are also highly similar to those identified at Derryville (Caseldine and Gearey, 2005) supporting the notion that the proxy signal at Littleton is consistent with a bog burst. If the proxy signal at Littleton is reflecting the bursts at Derryville, 5 km to the north, and not a similar set of local events, this would imply that the Derryville Bog bursts would have been a catastrophe of regional significance. The magnitude of the variability in reconstructed DWT at both sites is similar, which would be surprising if one record were proximal to the location of the bog bursts, and the other several kilometres away (therefore resulting in different magnitudes reflected in the proxy data). Furthermore, DWT reconstructions from other nearby sites in the same interconnected complex of mires, at Longfordpass and Inchirourke (Stastney, 2015), do not show a similar sequence of dry shifts, indicating that while the underlying basins are interconnected, the hydrology of the individual areas of ombrotrophic bog was more or less independent; indeed, Casparie (2005) observed just such a situation at Derryville Bog, where discrete areas of ombrotrophic peat developed independently.
Bog bursts at Littleton Bog
As discussed above, the testate amoebae, plant macrofossil and humification data as well as the chronological tempo of the events at Littleton are very similar to those associated with bog bursts at Derryville Bog (Caseldine and Gearey, 2005). Additional supporting evidence for bog bursts at Littleton is provided by the archaeological record: Brindley and Lanting (1998: 55) suggested a bog burst as a possible explanation for the discovery of a trackway (radiocarbon dated to the Iron Age) at a lower elevation than two nearby structures known to be earlier in date (Bronze Age).
Other
Given that the palaeoecological and chronological characteristics of the rapid dry shifts observed at Littleton are consistent with a series of bog burst events, there is, at present, no need to invoke any other, hitherto unexplained, mechanism.
For the reasons outlined above, it is concluded that the most likely interpretation of the sudden drying events at Littleton is that they represent a series of local bog bursts. While at Derryville Bog burst events could be positively identified with the support of extensive peat stratigraphic mapping and multiple core and column sequences, the similarity in proxy signals between both sites may raise the possibility of developing a set of criteria for the identification of bog bursts from a single core sequence (see section ‘Future work’).
The decline of Sphagnum austinii Sull. ex Aust at Littleton
The decline of Sphagnum austinii Sull. ex Aust. (formerly Sphagnum imbricatum Hornsch. Ex Russ.) has been described as ‘the most striking vegetation change on the raised bogs of Britain and Northwest Europe during the last 2000 years’ (Hughes et al., 2008: 1033). In common with many raised mires in the British Isles, S. imbricatum (austinii), a taxon that first occurs in BH6 at c. 3930 cal. BP (4080–3780 cal. BP 95% confidence interval) and is a dominant peat component between c. 1140 and 790 cal. BP, declines and disappears in the late Holocene (Barber, 1981; McClymont et al., 2008; Mauquoy and Barber, 1999b; Van Geel and Middeldorp 1988). Recent investigations (see Hughes et al., 2008) have shown that the contraction in its range shows no uniformity, either temporally or spatially, and several factors have been suggested for the cause of its decline, including climate change (increased bog surface wetness), competition between species, an increase in atmospheric inputs, human disturbance of peatlands and genetic erosion (see Swindles et al., 2015).
Following a peak in abundance at c. 890 cal. BP (1030–780 cal. BP 95% confidence interval), S. austinii permanently declines and the final occurrence of the taxon is dated to 530–480 cal. BP (95% confidence interval, OxA-33794 450 ± 27 BP). This timing of this event is similar to that noted elsewhere in the British Isles: although generally not a synchronous event, S. austinii typically disappears during the later medieval or pre-industrial modern periods. At several sites, this decline is associated with a shift towards wetter conditions (e.g. McClymont et al., 2008; Mauquoy and Barber, 1999b); however, at Littleton, the decline occurs during a period of moderately dry BSW conditions, with testate amoebae–derived DWT values rising during the period of decline and immediately after the disappearance. Therefore, at Littleton Bog, changes in BSW conditions do not appear to be implicated in the local disappearance of S. austinii.
Regional comparisons
Figure 6 shows palaeohydrological proxy data from Littleton presented alongside: (a) the 947-year-long reconstruction of the winter North Atlantic Oscillation (NAO) index of Trouet et al. (2009), shown overlain with a smoothed line (span = 0.45) in bold, (b) the composite Irish peatland water table record of Swindles et al. (2013) and (c) the Northern Britain stacked peatland water table record of Charman et al. (2006); data sets available online via NOAA (https://www.ncdc.noaa.gov/data-access/paleoclimatology-data). While it is important to bear in mind that ‘visual’ comparisons between different proxy archives can be confounded by chronological uncertainties in turn potentially leading to significant interpretational pitfalls (Baillie, 1991; Blaauw, 2012), the approach can nevertheless be useful to provide broad contextual frameworks.
Before c. 1300 cal. BP, agreement between the proxy data from Littleton Bog and the Irish (Swindles et al., 2013) and N British (Charman et al., 2006) composite water table records is generally poor. Between c. 4000 and 3700 cal. BP, both the Littleton DWT data and the N British stacked record show highly variable BSW conditions, although this may be an artefact of non-hydrological factors in the former (see above) and sparse data coverage in the latter; the Irish composite record shows consistently moderate BSW conditions during this period. Both the Irish and N British records indicate clear wet shifts at c. 2750 cal. BP, but this is not obviously reflected in either the humification or DWT data from Littleton, although plant macrofossil assemblages do switch to Sphagnum spp. dominance for the first time at c. 2700 cal. BP (2840–2470 cal. BP 95% confidence interval). Bog bursts B (2650–2300 cal. BP 95% confidence interval, weighted mean = 2510 cal. BP) and C (1830–1290 cal. BP 95% confidence interval, weighted mean = 1540 cal. BP) both broadly occur at around the time of marked wet shifts in both the Irish and N British composite records.
From c. 1300 cal. BP onwards, there is good visual agreement between the Littleton DWT data and the Irish composite water table record. The plant macrofossil and humification data also show similar trends to the regional composite water table between c. 1300 and 730 cal. BP; however, both proxies appear to show closer correspondence with the reconstructed winter NAO record, with the low DHI scores and humification values coinciding with the period of persistently positive NAO during the Medieval Climate Anomaly (MCA) and increasing humification values broadly coinciding with the trend towards a less-positive NAO thereafter. The plant macrofossil data appear to cross a threshold towards assemblages indicative of drier BSW conditions soon after the smoothed line shows a trend towards a less-positive NAO, but before the occurrence of the first negative NAO indicated at c. 500 cal. BP (Trouet et al., 2009).
Drivers of bog bursts at Littleton
The exact cause of bog burst events is, at present, uncertain, and a range of both autogenic and allogenic forcing mechanisms have been proposed. Studies focused on modern bog bursts have suggested that sharp increases in effective precipitation following prolonged periods of dry conditions appear to have been the proximal cause of bog burst events (Dykes and Warburton, 2007; Feldmeyer-Christe et al., 2011; Tallis, 2001), although exactly how this hypothesis, based on data resolved at monthly–daily timescales, might be applied to palaeoenvironmental data sets that are probably decadally resolved at best, is uncertain. Nevertheless, this accords with the suggestion that the bog burst at Bargerveen, Netherlands, at c. 2800 cal. BP, was ultimately climatically driven (Van Geel et al., 2014). At Littleton, the plant macrofossil DHI scores and, to a lesser extent, the humification data indicate a wet shift immediately prior to bog burst B at c. 2510 cal. BP (95% confidence interval 2650–2300 cal. BP), and both this event and bog burst C (1830–1290 cal. BP 95% confidence interval, weighted mean = 1540 cal. BP) do occur at around the time of wet shifts recorded in composite water table records in the British Isles (Charman et al., 2006; Swindles et al., 2013).
There is less evidence for a climatic driver for bog burst A (3437–2846 cal. BP, 95% confidence interval, weighted mean = 3140 cal. BP), although this does occur during a broad period of hemispheric-scale climatic variability, between 3500 and 2500 cal. BP (Mayewski et al., 2004) that would also encompass bog burst B. Both regional composite water table records show drying trends at the time of this bog burst. Bog burst A does, however, occur during a period before fully ombrotrophic conditions are established at the sampling location, and therefore, the internal dynamics of the site in relation to the morphology of the bog surface and of the underlying basin may have been at a critical stage at this time (Belyea and Clymo, 2001), thus indicating an autogenic driver for this event.
A third causal factor which has been proposed is that disruption caused by human activity, specifically the construction of timber structures on the bog surface, might have been the proximal cause of a bog burst evident at Derryville, just to the north of Littleton Bog (Casparie, 2001). At Derryville, construction of timber trackways was shown to have blocked localized bog drainage systems, ultimately leading to bursts. An anthropogenic driver for the bog bursts is equally plausible at Littleton, since all three bog bursts occur at around the time that similar timber trackways and platforms were constructed at the site (Brindley and Lanting, 1998; Turrell, 2008; Whitaker, 2006). However, the detailed stratigraphic information required to identify a precise mechanism for any anthropogenic disturbance leading to a bog burst is lacking at Littleton. More widely, there is, at present, little unambiguous evidence for the extent and character of direct human impacts on raised mires during prehistory; future research should address this issue.
On the available evidence from Littleton Bog, it is unclear which factors, climatic, autogenic or anthropogenic, either alone or in combination, might have caused the bog bursts. The bog bursts at Littleton broadly coincide (~±150 years and thus within the uncertainty limits of the age–depth model) with those at Derryville, which occur at c. 3200 and c. 2550 and a further possible burst at 1400 cal. BP (Caseldine and Gearey, 2005). Given that both sites are situated within the same larger system of wetlands, and that there are close parallels both in terms of date and form between the archaeological structures at both sites, the coincidence of bog bursts at both Derryville and Littleton might plausibly support any of the three main causal factors.
Future work
Previous studies which have positively identified bog bursts in the palaeoenvironmental record have relied on the collection of substantial amounts of detailed stratigraphic data including the recording of numerous long sections, multiple core sequences and extensive archaeological survey (Bermingham and Delaney, 2006; Gowen et al., 2005). Such extensive studies are, however, rare and are unlikely to be repeated with any great regularity in the future. The probable identification of bog bursts at Littleton Bog, therefore, raises the possibility of developing a set of criteria for the identification of such events from single-core-based investigations. Application of these criteria, and testing them against competing explanatory mechanisms, may potentially allow the identification of previously unrecognized bog bursts at other sites, both in Ireland and more generally in NW Europe. These criteria should be used to seek potential bog burst signals at other sites since, if they do prove to be more common than previously assumed, this may have significant implications for the interpretation of peatland palaeoclimate records and our understanding of peatland carbon dynamics. At present, however, the most significant ‘unknown quantity’ is the role of past human impact on raised mires. Although certain activities such as deliberate drainage of peatlands or the cutting of peat during prehistory might not be archaeologically visible, this issue is yet to be explicitly examined. The construction of trackways and other peatland archaeological structures is, however, archaeologically visible. While previous work has compared the peatland archaeological record of Ireland as a whole with palaeoenvironmental records in order to test environmentally deterministic models of human–environment relationships at the regional scale (Plunkett et al., 2013), further site-by-site comparison of palaeoenvironmental and archaeological data sets might draw out potentially significant patterns to elucidate the local impact of humans on individual raised mire systems.
Conclusions
The multi-proxy palaeohydrological record from Littleton Bog spans almost the whole of the late Holocene from c. 4140 to after c. 170 cal. BP.
The three proxy data sets display complex relationships reflecting the varying influence of internal bog dynamics and allogenic climatic forcing. A notable example of this complexity is the identification of a series of bog bursts, dated to c. 3140, c. 2510 and c. 1540 cal. BP. These events are characterized by testate amoebae assemblages dominated by H. subflava, plant macrofossil assemblages dominated by monocots and generally high humification values.
The driving mechanisms of the bog burst events are uncertain: bog burst A seems to have been linked to the internal dynamics of bog development; however, it is possible that the two later bog bursts might have been at least partially climatically driven. A further complicating factor is the possibility that the construction of prehistoric trackways on the bog surface might have been a proximal driver of the bog burst, as has been suggested at Derryville Bog.
Given that more than 50 bog bursts were recorded in Ireland between 1900 and 2010, it seems likely that these events are, at present, under-reported in the palaeoenvironmental literature. Further work is necessary not only to investigate how widespread these events were in the past and what caused them but also to understand their potentially significant implications for peatland palaeoclimate studies and carbon dynamics.
From c. 1300 cal. BP, during the MCA, all three proxies show improved agreement, displaying generally good agreement with the Ireland and N Britain composite water table records. The plant macrofossil and humification data sets in particular show linkages with the 947-year-long winter NAO reconstruction. Such potential linkages suggest that longer proxy reconstructions of winter NAO should be sought, in order to examine the relationship between peatland hydrology and changes in atmospheric circulation for the middle and late Holocene.
The disappearance of S. austinii at Littleton Bog is dated to 530–480 cal. BP and occurs during a period of moderately dry BSW conditions, suggesting that non-climatic factors are likely to have been the dominant cause of the local decline.
Footnotes
Acknowledgements
The authors gratefully acknowledge and thank Bord na Móna and ADS Ltd (Ireland) for access to the study site. They are grateful to the two anonymous reviewers for their helpful and constructive comments which helped improve this manuscript.
Funding
Three dates were provided by the NERC radiocarbon dating facility (project ID NF/2015/1/23 awarded to NPB). PS was supported by a PhD studentship funded by SAGES (formerly SHES) and QUEST, University of Reading.