



Abstract
The mega-diverse, Mediterranean-type fynbos biome may be vulnerable to future changes in climate and associated fire regimes, in particular to increasing summer-drought intensity and associated potential expansion of adjacent semi-arid vegetation types. Studying Holocene vegetation dynamics at the fynbos–succulent karoo boundary may provide insights into the resilience or sensitivity of fynbos to climate change. In this study, fossil pollen, non-pollen palynomorphs and charcoal data spanning ~5500 to −50 cal. yr BP were generated from an accelerator mass spectrometer (AMS) radiocarbon-dated sediment core extracted directly at the present-day fynbos–succulent karoo biome boundary at Groenkloof, a site in the Kamiesberg Mountains of Namaqualand, South Africa. Contrary to expectations, during the Mid-Holocene Altithermal from 5480 to 4025 cal. yr BP, fynbos and fire thrived through summer moisture subsidies associated with enhanced sub-tropical easterly flow. Subsequent cooling from 4025 to 2005 cal. yr BP resulted in enhanced summer drought and overall fynbos biome contraction, though woody fynbos shrubs persisted through physiological adaptations to drought. Desert succulents typical of the succulent karoo, such as those of Aizoaceae and Crassulaceae, failed to colonise the emergent niche space, resulting in dominance of an ambiguous grassy, asteraceous fynbos. More recent wetting associated with the ‘Little Ice Age’ Holocene temperature minima from 695 to 100 cal. yr BP prompted a resurgence in fynbos abundance, but frequent fire driven by pastoralists appears to have reduced the fynbos community’s functional diversity. Palaeoecological data from the Kamiesberg suggest that both climatic buffering of mountain refugia and high physiological resistance among certain fynbos taxa have contributed to the biome’s long-term resilience. Summer rainfall associated with the sub-tropical easterlies has been key in maintaining eastern fynbos refugia in past interglacial temperature maxima. The data also suggest that pre-historic land use and resulting fire-regime manipulations have resulted in the development of a taxonomically and functionally simplified alternative fynbos ecosystem state.
Introduction
The fynbos ecosystem is a fire-prone, Mediterranean-type shrubland that is restricted to the south west of South Africa (Figure 1) (Bergh et al., 2014). It is a Global Biodiversity Hotspot, harbouring around 8600 species, 1736 of which feature on the Red Data list as being ‘in danger of extinction’ (Raimondo et al., 2009). A number of anthropogenic factors, including climate change, land-use and invasive species, pose significant threats to biodiversity in the region (Altwegg et al., 2014; Bomhard et al., 2005; Driver et al., 2012; Hannah et al., 2005; Kraaij and van Wilgen, 2014; Midgley and Chapman, 2005; Midgley and Hannah, 2003; Slingsby et al., 2017). These potential threats necessitate greater understanding of the complex factors governing fynbos structure, function and distribution at its biogeographical, climatic and ecological limits in order to develop appropriate adaptive strategies (Slingsby et al., 2014).

Vegetation maps at (a) regional scale showing biome-level distributions. The area indicated is enlarged in (b) which shows sub-biome types relative to the core extraction location. Data according to Mucina and Rutherford (2006) (see ‘Site Description’ for further details).
Fynbos is considered a Mediterranean-type biome because of the physiognomy and functional ecology of its flora, as well as being associated with a climate characterised by winter rainfall and hot, dry summers (Ackerly et al., 2014). The vegetation is dominated by sclerophyll shrubs and there is a prevalence of fire which is fundamental to the biodiversity and ecological processes within all Mediterranean-type ecosystems, including reproduction, dispersal regeneration and generation and maintenance of biodiversity. Dominant families within fynbos vegetation include Proteaceae, Ericaceae, Restionaceae, Asteraceae, Iridaceae and Poaceae (Bergh et al., 2014). True Mediterranean climate occurs only in the extreme south west around Cape Town, where mild, wet winters and hot dry summers dominate. This occurs because of the seasonal shifts between the winter-rain bearing temperate westerlies and the dry sub-tropical anticyclone (Figure 2). Northwards from this Mediterranean climate zone along the western flank of South Africa, rainfall amount, biomass production and fire prevalence decrease as the climate transitions to semi-arid. This semi-arid region is dominated by the succulent karoo biome, a shrubland dominated by dwarf leaf-succulents, in particular of Aizoaceae, Euphorbiaceae and Crassulaceae, and by annuals of Asteraceae (Cowling et al., 1999; Desmet, 2007). In contrast to fynbos, succulent karoo is neither fire prone nor adapted to fire, although it is much more tolerant of aridity. Therefore, at this low latitude margin of fynbos distribution, it is expected that climate will dominate fynbos dynamics. This may occur both directly by limiting fynbos growth and persistence and also indirectly by reducing fire prevalence through limitation of biomass production and ignition, thereby allowing fire-sensitive succulent karoo species to establish (Esler et al., 2015).
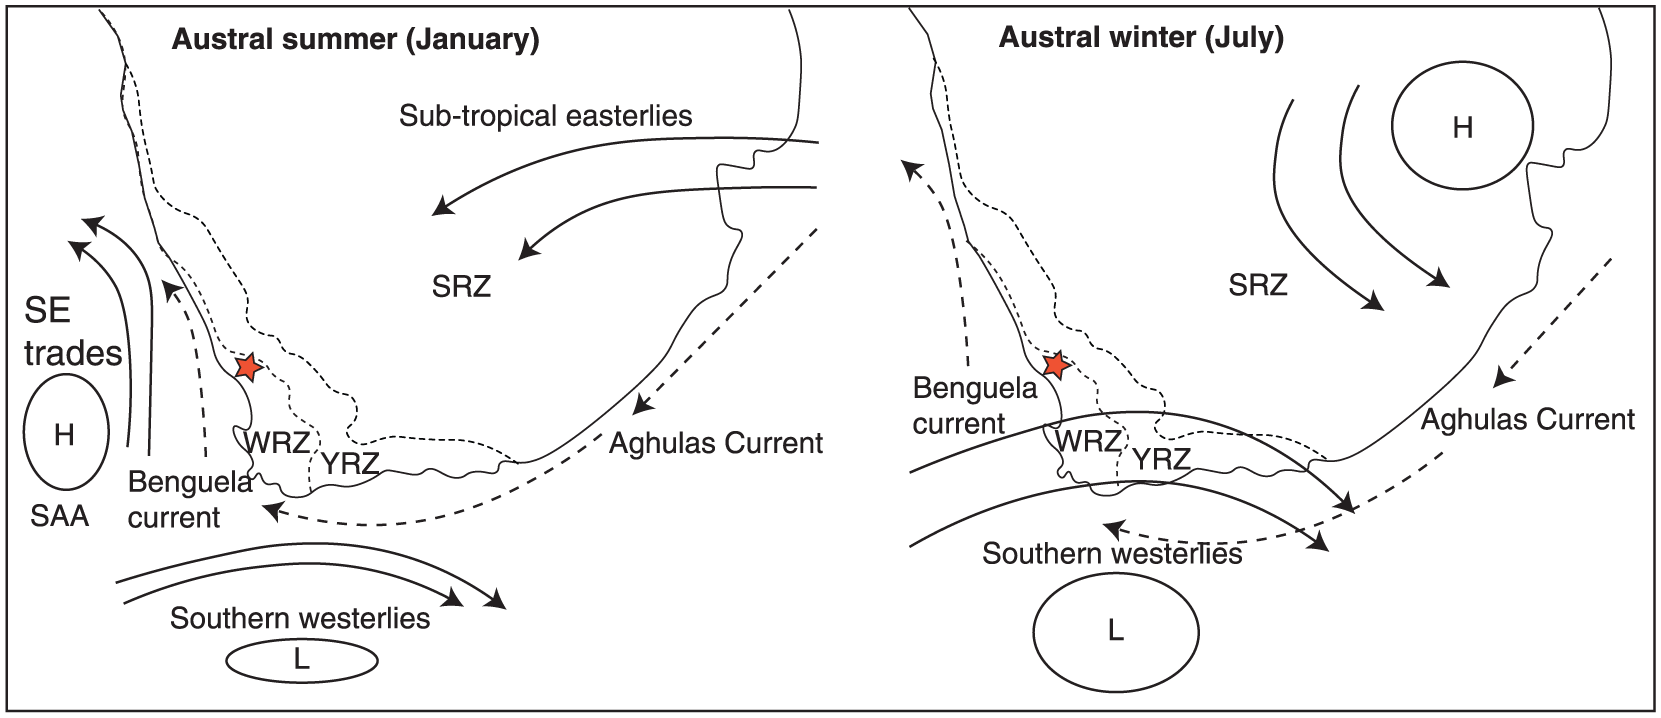
Schematic representation of heuristic southern African climate mechanisms.
The fynbos and succulent karoo biomes together constitute the dominant flora of the Greater Cape Floristic Region (GCFR). Climate data from the last century show that the GCFR has become significantly warmer (Haensler et al., 2010; Hoffman and Carrick, 2009; Midgley and Chapman, 2005; Midgley and Hannah, 2003; New et al., 2006). This trend is very likely to continue and climate in the GCFR could be 1–3°C warmer than present by 2100 (Engelbrecht et al., 2009; Hewitson and Crane, 2006; Tadross et al., 2005). Rainfall trends are more spatially complex. Winter rainfall will likely be reduced causing those areas in the heart of the current winter rainfall zone (WRZ) to become drier overall. Areas associated with the year-round rainfall zone (YRZ) toward the east of the region are also likely to see decreases in winter rainfall, though this may be offset by increases in summer rainfall as the present summer rainfall zone (SRZ) is expected to become wetter (Altwegg et al., 2014; Engelbrecht et al., 2009; Hewitson and Crane, 2006; MacKellar et al., 2007).
Early modelling of the effects of climate change highlighted the potential vulnerability of the current fynbos bioclimatic envelope to substantial reductions in regional extent of the biome, with associated implications for species losses (Bomhard et al., 2005; Hannah et al., 2005; Midgley and Chapman, 2005; Midgley and Hannah, 2003; Rutherford et al., 2000). More recent studies projections suggest much less drastic reductions in biome extent, with localised shifts and reshufflings of species as opposed to broad-scale reductions in fynbos bioclimatic space (Driver et al., 2012), requiring understanding of local rather than regional processes (Gillson et al., 2013). Importantly, these modelling studies stress the multiplicity of potential future change scenarios resulting from factors such as such as uncertainties in (bio-)climate projections, the complexity of plant physiological responses, the interacting effects of other stressors such as alien species and land-use change and interactions at the climate-vegetation-fire nexus (Altwegg et al., 2014).
Empirical studies of fynbos and succulent karoo distributions highlight the importance of fire and competitive relationships in delimiting the biomes, the former being fire prone and adapted with relatively high growth rates (where water is not limiting to growth), the latter being fire intolerant and slower growing but more adapted to drought (Esler et al., 2015; Lechmere-Oertel and Cowling, 2001). Indeed, it has been suggested that increased aridity and associated reductions in fire prevalence might lead to localised replacement of fynbos by drought-tolerant, fire-sensitive and retardant succulent karoo species as fynbos post-fire regeneration time is slowed by drought-induced growth limitation (Rebelo et al., 2006; Wilson et al., 2015).
Previous palaeoecological studies in the fynbos biome (Meadows and Sugden, 1993; Meadows et al., 2010; Quick et al., 2011; Valsecchi et al., 2013) have suggested that fynbos has a high capacity for resilience to climate change, which is maintained by internal adaptation through overturning among fynbos sub-types with varied capacities for resistance to climate and fire (e.g. mesic, frequent-fire loving ericaceous fynbos versus drought-tolerant, slower maturing proteoid fynbos) (Valsecchi et al., 2013). Research on drought resistance in fynbos (Agenbag et al., 2008; Mustart et al., 2012; Slingsby et al., 2017; West et al., 2012) has yielded three main findings: (1) responses to drought are highly variable among co-occurring species with some groups, for example, Ericaceae being especially drought sensitive; (2) mature woody plants are highly resistant to drought; and (3) rainfall seasonality is the primary factor determining drought response (Altwegg et al., 2014). Interactions among climate and fire are particularly important, with pre- and post-fire conditions influencing sensitive ecological processes owing to the high diversity of plant functional traits that together determine post-fire succession (Keeley et al., 2011). Furthermore, land-use changes and the presence of alien species may interact with fire and climate and modify their effects (Altwegg et al., 2014; Slingsby et al., 2014).
During cool, glacial phases of the Quaternary Period, equatorward propagation and intensification of the westerlies temperate storm track resulted in enhanced winter rainfall in the GCFR (Chase and Meadows, 2007). This affected more mesic regional conditions than in the present interglacial, and fynbos expanded into regions currently occupied by dry succulent karoo. During interglacial phases, the winter rainfall system weakened and contracted, leading to aridification and recession of fynbos to cooler refugia at higher latitudes and altitudes (Chase and Meadows, 2007; DuPont et al., 2007, 2011). The easterly flow of moisture from sub-tropical climate systems (Figure 1) to mountainous regions of the Cape Fold Belt during summer has been suggested as key in determining fynbos persistence in the geological past by reducing summer aridity stress (Quick et al., 2011; Valsecchi et al., 2013). The resilience and longevity of fynbos evolutionary lineages is therefore likely dependent on the capacity of fynbos to retreat to such refugia (Deacon et al., 1992; Dynesius and Jansson, 2000; Jansson and Dynesius, 2002; Linder, 2005; Linder et al., 1992; Verboom et al., 2009, 2014) and subsequently recover its broader regional distribution when conditions ameliorate. It is yet to be determined whether fynbos diversity reflects wide physiological tolerance in relation to climatic variability, the accumulation of species over millions of years within a climatically buffered region or a combination of these factors (Altwegg et al., 2014; Verboom et al., 2009).
Land-use has a substantial impact on fynbos structure, function and distribution. Historically, large swathes of natural vegetation have been destroyed for conversion to high-intensity agriculture, directly decimating biodiversity (Altwegg et al., 2014). On a global scale, the primary drivers of loss and threats to biodiversity are over-exploitation and agricultural activity, more so than climate change. Also more significant than the latter are invasive species (both native and exotic) and ecosystem modification (e.g. fire-regime manipulation). Over the coming decades, climate is predicted to become a more substantial threat and will interact with the more direct impacts of land-use and other stressors (Bomhard et al., 2005; Maxwell and Fuller, 2016). Understanding of long-term human impacts and how they have interacted with climatic change in the recent geologic past (i.e. Holocene) is therefore a research priority.
Predictions of fynbos dynamics are highly uncertain, and an understanding of the ecological processes and interactions that maintain or erode resilience in fynbos are poorly understood (Altwegg et al., 2014). Palaeoecology offers a window into the long-term nature of ecosystem dynamics at the fynbos–succulent karoo transition, allowing testing of hypotheses regarding the nature and causes of between- and within-biome dynamics (Quick et al., 2011; Scott and Woodborne, 2007a, 2007b; Valsecchi et al., 2013). Palaeoecological studies are especially powerful at biome boundaries, where vegetation assemblages are at an environmental and/or ecological limit.
Study site and methods
Site description
Groenkloof is located in the Kamiesberg Mountains (900–1500 m asl) at the arid extension of the present-day fynbos biome (Figure 1). Precipitation for the region varies between <100 and around 450 mm per annum, falling mostly in winter (June–July–August; CV = 33%) (Todd and Hoffman, 1999). The Kamiesberg escarpment is approximately 50 km in width, surrounded by the Namaqualand Hardveld Bioregion of the succulent karoo biome (winter rainfall; MAP = 150 mm; CV = 38%) to the north, south, west and east. Some 40 km east of the site, a rapid transition from dominant winter rains to late summer/autumn rainfall occurs where the Kamiesberg ecozone transitions to Bushmanland (Desmet, 2007; Mucina et al., 2006). Therefore, the Kamiesberg is located at an important interface between winter, year-round and summer rainfall and so is likely over time to be subject to changes in the dominance of the respective rainfall systems.
The sediment core used in this study was extracted from a perennial wetland at Groenkloof, located at S 30°21′17.06, E 18°07′03.15 (Figure 1). The wetland is located within an enclosed basin that accommodates fynbos and succulent karoo vegetation types. Kamiesberg Granite Fynbos occurs at the mid-to-upper elevations of Groenkloof between around 1530 and 1200 m asl in small pockets within a matrix of renosterveld. It is tall, dense asteraceous fynbos (Rebelo et al., 2006). Localised patches of Kamiesberg granite fynbos occur on mountaintops, particularly at seeps and alluvial washes. Current prominent taxa include Cliffortia ruscifolia, Metalasia densa, Anthospermum spathulatum and Ischyrolepis gaudichaudiana. Thicket and succulent species (described below) are also present in fire-free micro-habitats such as rocky outcrops. Namaqualand Granite Renosterveld is distributed to the east of Kamieskroon and northeast of Garies at higher elevations of the Kamiesberg, predominantly on mountain peaks and plateaus at altitudes 1100–1450 m asl, where MAP is 130–370 mm. This mountain renosterveld does not form part of the renosterveld biome found elsewhere (see Bergh, 2014). Rather, it is a tall (1–1.5 m) shrubland with an understory of grasses, being particularly dominated by ‘renosterbos’ (Elytropappus rhinocerotis) and other asteraceous shrubs including Chrysanthemoides monilifera. It may therefore be considered both taxonomically and phytochorologically intermediate between fynbos and succulent karoo (Colville and Potts, 2014).
Kamiesberg Mountain Shrubland is a succulent and non-succulent dense shrubland and is classified as part of the succulent karoo biome (Mucina and Rutherford, 2006). It occurs on steep or rocky south facing topography within Groenkloof. It is generally typical of more arid fynbos types with MAP around 230 mm and occurs only at the lowest elevations within Groenkloof. It can be referred to as thicket-like, with small trees such as Rhus undulata and Dodonaea viscosa and a herbaceous understory. More open areas are dominated by succulent and non-succulent shrubs such as Aloe kamiesbergensis, Euphorbia mauritanica and Eriocephalus spp. Namaqualand Klipkoppe Shrubland is widespread in the Kamiesberg at altitudes between 120 and 1260 m and MAP is around 160 mm. It is a low shrubland with both ericoid and succulent types, typically supported by granitic domes and rocky outcrops that typify the landscape. Another succulent karoo vegetation type occurs slightly below Groenkloof on commercial grazing land that is referred to as Namaqualand Blomveld (Mucina et al., 2006), presumably due to the dominance of annual members of Asteraceae that produce renowned floral displays in spring.
Methods
The core Groenkloof 3 was extracted from the centre of the sedimentary basin using a vibracorer (Meadows and Baxter, 2001). Sediments were described according to the classification schemes of Troels-Smith (1955) and Munsel Color Company (1954). Compositions of total organic carbon (TOC) and total inorganic carbon (TIC; measured as carbonate) within the core was then determined by loss-on-ignition (LOI) in the Palaeoecology Laboratory, Department of Biological Sciences, University of Cape Town. Sediment of volume 2 cm3 was extracted at 8 cm increments through the profiles, weighed, dried in a drying cabinet and weighed again. The samples were placed in porcelain crucibles and combusted in a muffle furnace at 500°C for 12 h to determine TOC content and for a further 12 h at 800°C for TIC. Numerous methods for LOI are used in palaeoecological analyses, but according to Wang et al. (2011), this combustion process is optimal for accurate measurements of wetland sediment.
A chronology for the core was established by means of accelerator mass spectrometer (AMS) radiocarbon dating. Three radiocarbon ages were determined from the humin fraction of the bulk sediment, to reduce methodological error associated with organic carbon mobility within the sediment column. The material was analysed at Queens University, Belfast. Subsequent linear age–depth modelling was done in the package CLAM (Blaauw, 2010) of the open source software RStudio (2014) using the SHCal13 calibration curve (Hogg et al., 2013). Goodness-of-fit was consistently <−log 4, based on 1000 iterations, confirming adequate model performance.
Pollen and spores were extracted from sediment sub-samples using standard methods which sequentially removed carbonate, humic acids, silicates and cellulose (Bennett and Willis, 2002; Moore et al., 1991). Pollen and spores were analysed using a Leica DM 750 high powered light microscope at ×400 and ×1000 magnification. Identification of pollen was facilitated by use of published sources including the African Pollen Database (2004), as well as the pollen reference collection in the Department of Biological Sciences, University of Cape Town. At least 250 land pollen grains were enumerated per sample. This threshold value has been widely adopted in fossil pollen studies in the Cape to ensure an adequate representation of parent plants in the landscape (e.g. Meadows and Baxter, 2001; Quick et al., 2011; Scott and Woodborne, 2007a). A lower threshold for inclusion of pollen taxa in the pollen diagram was set at ≥2% of total land pollen (TLP) in any one sample. This was done in order to exclude pollen transported by wind or water in long distance dispersal events that might cause misinterpretation of local plant community dynamics (Sugita, 1994). No unidentified taxa were recorded at levels ≥2% of the TLP sum. Pollen and other palynomorph data were plotted in the programme C2 (Juggins, 2007).
Spores and other non-pollen palynomorphs (NPPs) were prepared and counted along with the pollen samples until the minimum TLP sum of 250 grains was reached. A number of NPP types with potentially useful (in terms of undertaking palaeoecological reconstructions) autecological characteristics were identified. These include trilete and monolete fern spores: Zygnema-type (zygospores of green Algae), Riccia-type (liverwort spores) and Sordariaceae (fungal spores). The latter taxon represents an aggregate of Podospora-type and Sordaria-type, which have been suggested among the most reliable indicators of large herbivore abundance (Baker et al., 2013). Identifications of NPPs followed Almeida-Leñero et al. (2005), Gelorini et al. (2011), van Geel et al. (1981, 1983), as well as personal correspondences with A Ekblom, B van Geel and L Scott. NPPs and pollen not derived from land plants (e.g. Gunnera) are expressed as accumulation rates rather than relative to the TLP sum. This was done to ensure that these environmental indicators are independent of the pollen spectra, for which they are used as explanatory variables. Fossil spore data are also presented independent of the total pollen sum as accumulation rates so as to avoid distortion of subtle trends by variability in the pollen data (Baker et al., 2013).
Microcharcoal (<150 µm) was analysed on the same slides as the pollen and spores using the point-count method (Whitlock and Larsen, 2002). At least 200 items (i.e. the sum of charcoal fragments and Lycopodium) were counted per sample to ensure statistical significance (Finsinger and Tinner, 2005). Fossil macrocharcoal (>150 µm) was separated during pollen extraction by sieving and was enumerated using a dissecting microscope as the total number of fragments per 1 cm3 sediment. The macro- and microcharcoal concentration data were converted to accumulation rates by expressing concentration as a function of age (Whitlock and Larsen, 2002). A number of samples contained extremely high charcoal contents which distorted trends in the data. A scatter plot of microcharcoal versus macrocharcoal revealed outliers with extremely high values of microcharcoal at 5205, 5070 and 4245 cal. yr BP and of macrocharcoal at 4630 cal. yr BP. A range of transformations were applied according to Juggins and Telford (2012) but did not adequately reduce distortion. Therefore, these samples were excluded from the presented charcoal profile.
Statistical analysis
Zonation techniques allow the delimitation of statistically significant portions of a pollen diagram stratigraphy (Legendre and Birks, 2012) and have been used to identify ecological transitions in pollen records (e.g. De Boer et al., 2013; Gil-Romera et al., 2014; Gillson and Ekblom, 2009). Using the software Psimpoll, optimal splitting by least-squares was used to determine the maximum statistically significant number of zones (Bennett, 1996, 2007; Grimm, 1987). An additional sub-zone was identified qualitatively based on the abundance of the coprophilous fungal spores of Sordariaceae and corresponding subtle changes in the pollen spectra.
Multivariate ordination models provide additional tools for analysis. In contrast to zonation techniques, they are not stratigraphically constrained and can reveal ecological relationships between temporally distal taxa and samples (Legendre and Birks, 2012; McCune et al., 2002). Non-metric multidimensional scaling (NMDS) analysis was performed on the terrestrial pollen stratigraphic data in RStudio using the packages vegan (Oksanen et al., 2015) and MASS (Ripley and Venables, 2015). The numbers of dimensions to be included in the ordinations were determined by calculating ‘stress’, which is an inverse measure of fit between the original Bray-Curtis dissimilarity matrix and the NMDS ordination model (Kruskal, 1964; McCune et al., 2002). At least a three-dimensional solution was required to produce an acceptable ordination (stress <20). Where data values were larger than the common class scales, a Wisconsin double standardisation and square-root transformation were performed. Down weighting of rare (<5% of TLP) taxa was performed to reduce distortion of the model. Several model runs were performed to be confident that a global solution was found.
Results
Sediment description
The core is 209 cm in length and from visual inspection four broad units emerged (Figure 3, Table 1). The lower most (GRNK3-A, 209–176 cm) is believed to represent the base of the deposit and consists of sand and gravel, but did not contain pollen. The overlying unit (GRNK3-B, 175–144 cm) consisted mostly of highly humified peat and some sand. Stratigraphically above this was a highly variable unit (GRNK3-C, 143–60 cm) that was primarily minerogenic but with intercalated sand and peat components. The uppermost unit (GRNK3-D, 59–0 cm) was composed of highly humified peat. No erosional contacts were observed between units.

Groenkloof 3 sediment profile displaying identified units and associated lithological descriptions, calibrated ASM 14C dates, and inorganic and organic carbon content.
Groenkloof sediment classification.

Generally, organic carbon (TOC) was of a much greater abundance than was total inorganic (TIC) carbon in the core (means = 15% and 0.8%, respectively). Both types exhibited similar trends through their respective profiles. Concentrations in sediment unit GRNK3-B (175–144 cm) were between 2% and 11% (TOC) and 0.1% and 0.8% (TIC) and peak to 15% in unit GRNK3-C (143–60 cm). Values decreased particularly after around 120 cm (<2% TOC; <0.1% TIC). At around 95 cm depth, an increase occurred to 12% TOC and 1.0%TIC. Carbon was then low (<5% TOC; <0.4%TIC) again until the onset of the uppermost unit GRNK3-D (59–0 cm), which contained the highest carbon proportions of 6–22% TOC and 0.4–1.5% TIC.
Chronology and age–depth model
Results of the AMS 14C analysis are displayed in Table 2 and plotted in Figure 4. An age–depth model was constructed based on mean median probability ages of 5480 ± 130, 3980 ± 105 and 785 ± 95 cal. yr BP. Three phases of deposition with associated accumulation rates are identified in the age–depth model. Each 0.5 cm depth sediment sub-sample extracted for fossil extraction can tentatively be suggested to incorporate 15, 20 and 10 years of average sediment accumulation, respectively.
Groenkloof 3 radiocarbon dating results.

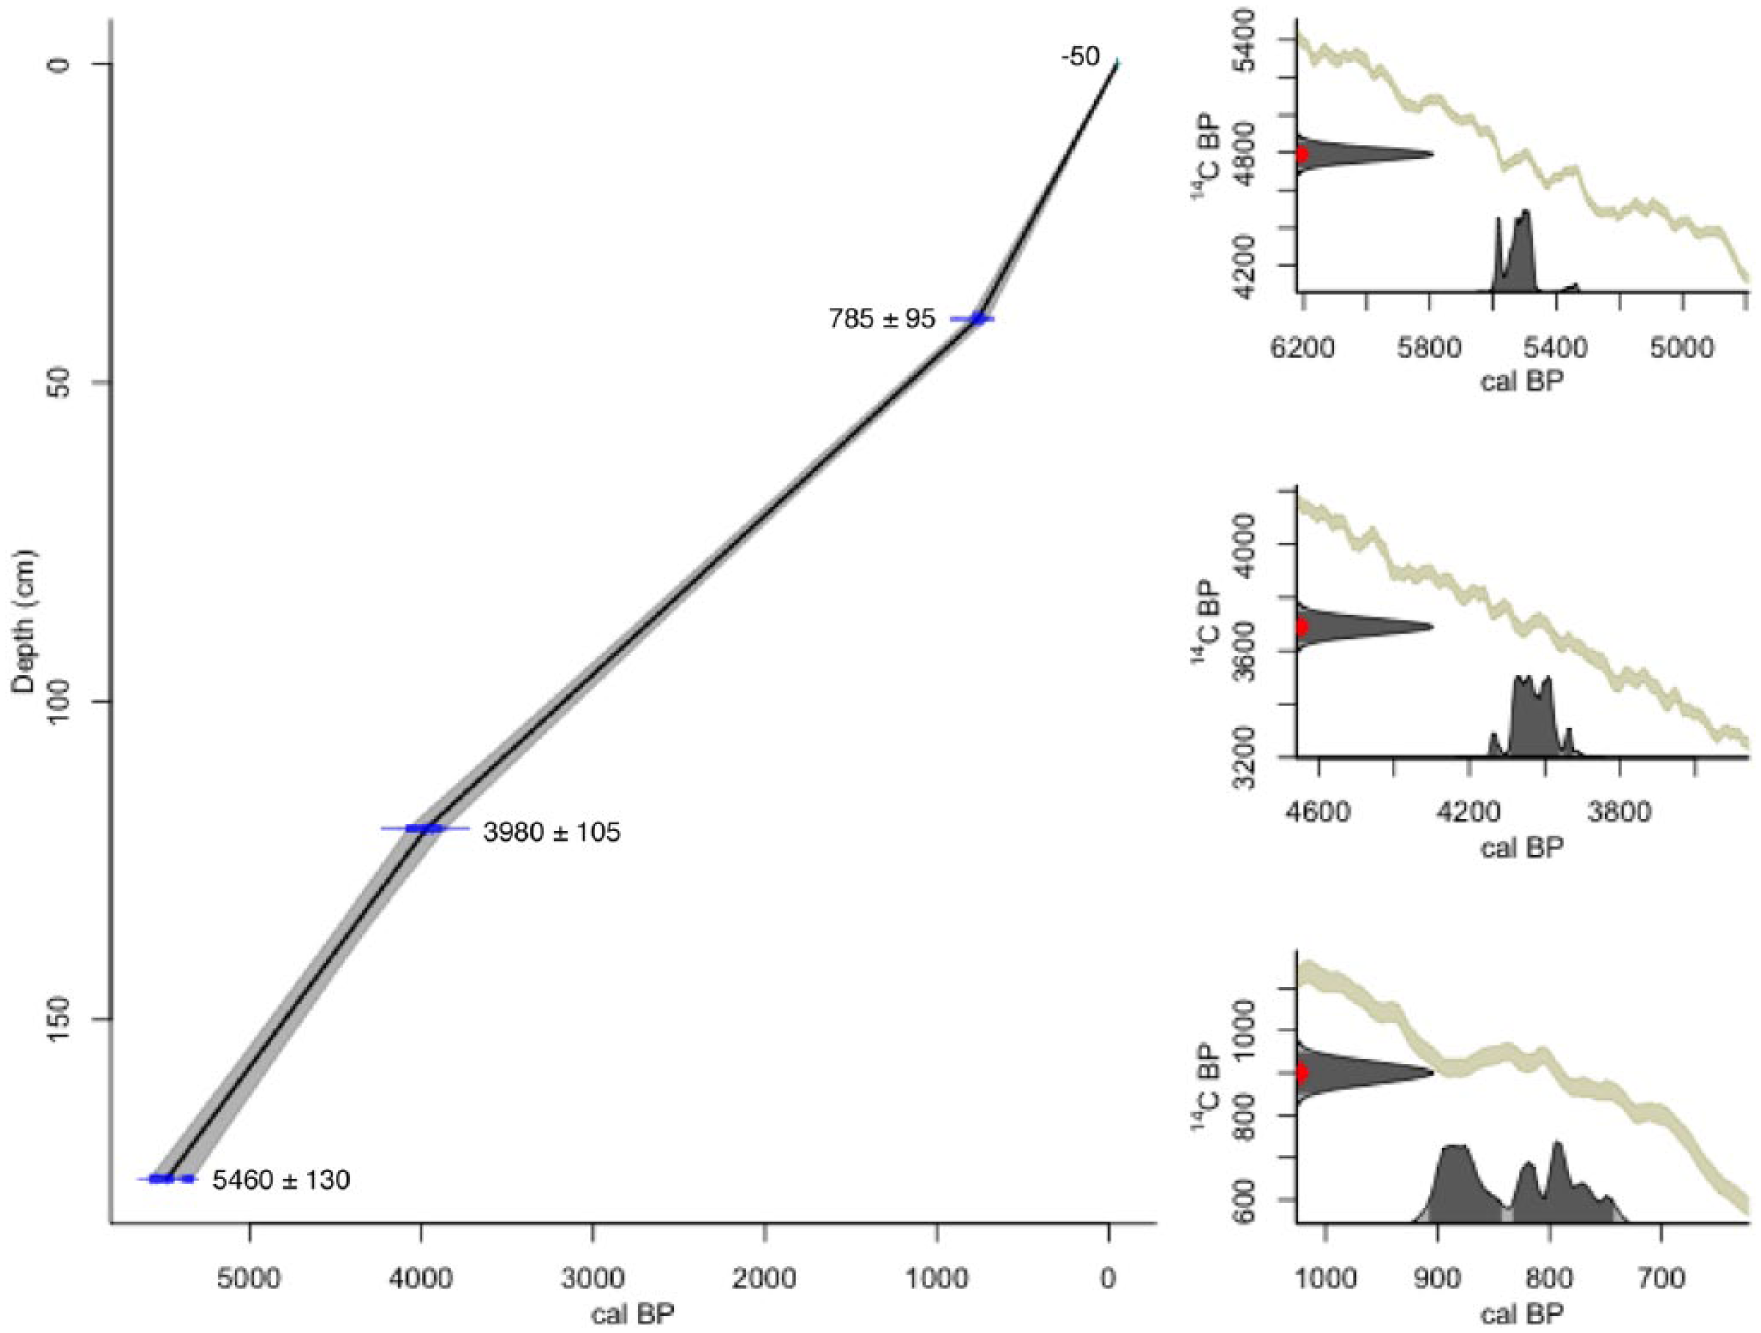
Groenkloof 3 age–depth model (left) and HPD distributions for each of the three calibrated AMS radiocarbon dates (right).
Zonation
Optimal splitting by least-squares highlighted three significant assemblage zones in the terrestrial pollen data. Based on visual analysis of the pollen spectra, as well as patterns in the abundance of coprophilous Sordariaceae fungal spores, an additional sub-division was made. Zones are defined as 5480–4025 cal. yr BP (GRNK3-1), 4025–2005 (GRNK3-2a), 2005–695 (GRNK3-2b) and 695 to −50 cal. yr BP (GRNK3-3) (Tables 2 and 3).
Details of Groenkloof 3 pollen diagram zonation.

Pollen diagram
Overview of biome abundance
It is clear that both fynbos and succulent karoo vegetation persisted at Groenkloof for the entire duration of the record (Figure 5), though in varying proportions. Fynbos pollen dominated the record but was variable, constituting 70–90% of the TLP sum in GRNK3-1 (5480–4025 cal. yr BP), 55–85% in GRNK3-2a (4025–2005 cal. yr BP), 55–80% in GRNK3-2b (2005–695 cal. yr BP) and 75–95% in GRNK3-3 (695 cal. yr BP to near present). Succulent karoo pollen, in contrast, was relatively rare and consistent in abundance, varying between 2% and 10% through the entire sequence. Slightly higher proportional abundance occurred in the central zones (GRNK3-2a and GRNK3-2b), with a maximum of 10% being reached around 2005 cal. yr BP. The generalist group of taxa was more abundant and dynamic, varying between 10% and 20% in GRNK3-1, subsequently increasing rapidly at the onset of zone GRNK3-2a and reaching a maximum of 35% by 2005 cal. yr BP. A steady decrease then occurred towards the top of GRNK3-2b, and on into GRNK3-3 at around 10–15% by the top of the core.
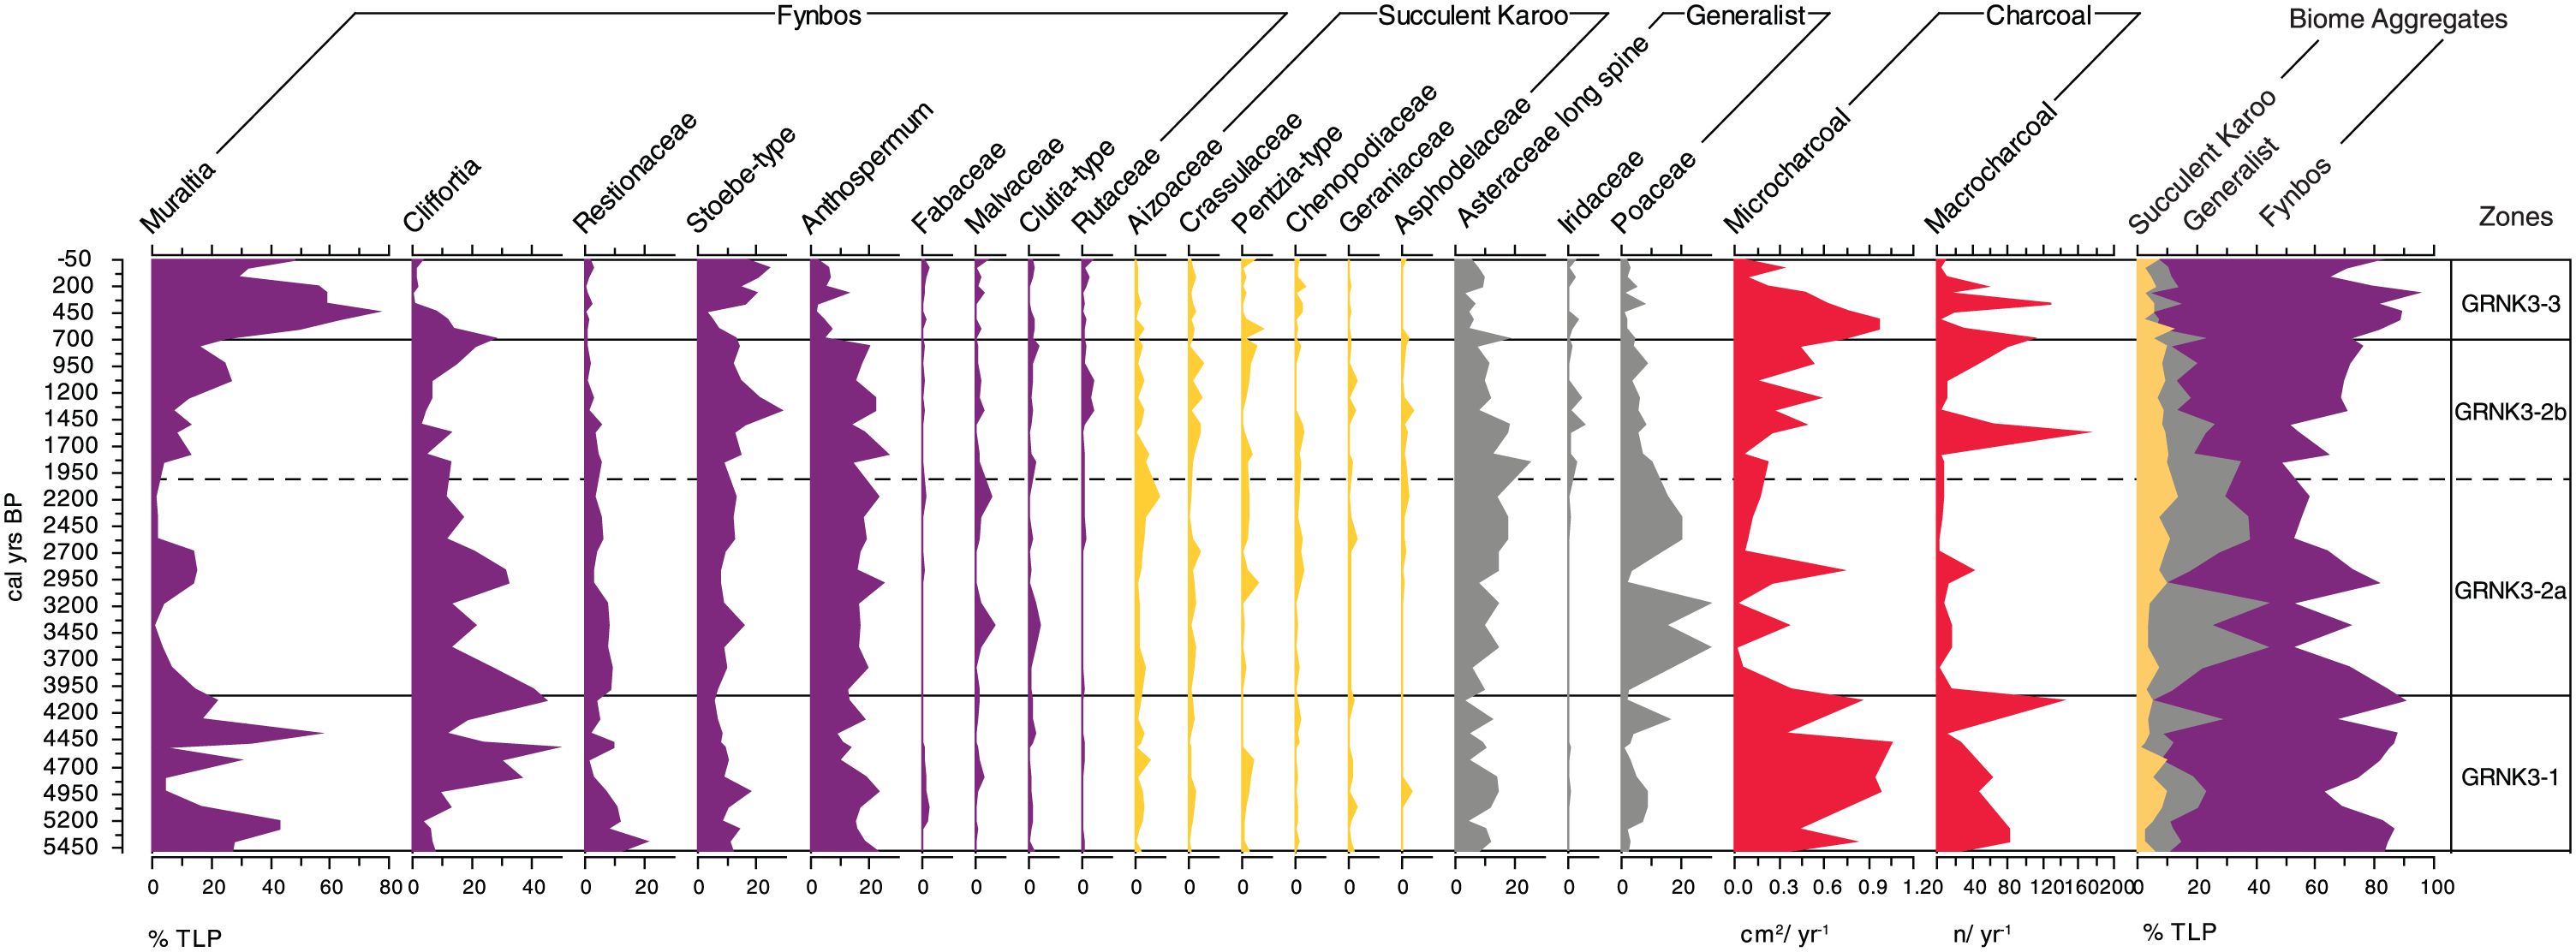
Groenkloof 3 percentage pollen diagram (includes all taxa constituting >2% abundance relative to total land pollen). Charcoal data are also displayed.
Zone GRNK3-1 (5480–4025 cal. yr BP)
The most prominent taxon was Muraltia, which fluctuated at high amplitudes between 56% and 3% of TLP. High values were recorded around 5480–5070, 4630, 4385 and 4245–4080 cal. yr BP, respectively (Figure 5). Lower abundances occurred around 4930–4795 and 4515 cal. yr BP. Abundances of Cliffortia, the next most prominent taxon, loosely reflected an inversion of this pattern. Restionaceae was most abundant lower in this zone, constituting some 20% at 5400 cal. yr BP, but then declined. Stoebe-type pollen generally declined from 12% at 5480 cal. yr BP to 5% at 4080 cal. yr BP, and a similar pattern was exhibited by Anthospermum which declined from 23% to 13% between 5480 and 4080 cal. yr BP. Other fynbos taxa in this zone included Fabaceae, Malvaceae and Clutia-type, but these were rare (<3%). Succulent karoo pollen types Aizoaceae, Crassulaceae, Pentzia-type, Chenopodiaceae, Geraniaceae and Asphodelaceae were all recorded, though in abundances of <5%. Of the generalist taxa, Asteraceae long spine and Poaceae contributed significantly to the pollen sum. Asteraceae fluctuated between 3% and 13% without a directional trend. Similarly, Poaceae fluctuated between abundances of 0.5% and 16%.
Zone GRNK3-2a (4025–2005 cal. yr BP)
Muraltia pollen was substantially reduced in abundance ranging between 14% and <1% of TLP. Cliffortia, in contrast, was generally more abundant than in the preceding zone, though declined from 41% at 3970 cal. yr BP to 11% at 2165 cal. yr BP. Restionaceae increased by 10% at the base of the zone, then gradually decreased to 3% at 2165 cal. yr BP. Stoebe-type was slightly more abundant than in the preceding zone, fluctuating between 8% and 15%. Similarly, Anthospermum became marginally more abundant, typically 15–20%. Succulent karoo taxa were again not very abundant relative to those of fynbos. They were however slightly more abundant than in GRNK3-1, particularly towards the top of the zone. The most notable feature was a peak in Aizoaceae abundance to 8% at 2165, which was the uppermost sample in GRNK3-2a. The generalist taxa showed appreciable changes in GRNK3-2a. Asteraceae increased through GRNK3-2a from 10% at 3970 to 17% at the top of the zone. Poaceae was much more abundant than in the preceding zone and was the dominant graminoid. Abundances ranged from 13% to 30% through most of this zone, except for at 3970, 2970 and 2850 cal. yr BP where values of <4% were recorded.
Zone GRNK3-2b (2005–695 cal. yr BP)
Muraltia abundance resurged, increasing from 4% at 1845 cal. yr BP to 27% at 1080 cal. yr BP, though declined to 15% in the uppermost sample at 760 cal. yr BP. Cliffortia fluctuated between 3% and 13% until the upper portion of the zone, whereupon it increased in abundance from 6% at 1080 cal. yr BP to 21% at 760 cal. yr BP. Restionaceae almost disappeared from the record, accounting for <1% of TLP by the top of this zone. Stoebe-type and Anthospermum exhibited little change in their nature and abundance compared with the preceding zone, except for a peak in the abundance of the former to 28% centred on 1365 cal. yr BP. All other fynbos elements constitute <4% each to the total pollen sum. Both Asteraceae and Poaceae declined through GRNK3-2b; the former from 25% to 7% between 1845 and 760 cal. yr BP and the latter from 10% to 4% over the same time period. Iridaceae is represented for the first time, though in low amounts (<3%). In contrast to the dynamism expressed by the fynbos and generalist taxa, the succulent karoo pollen types again showed little change, with all abundances remaining below 5%.
Zone GRNK3-3 (695 cal. yr BP to near present)
Muraltia increased rapidly at the onset of the zone, from 25% at 680 cal. yr BP to a peak of 76% at 535 cal. yr BP. Subsequent decline occurred, but Muraltia remains the dominant taxon through to the surface of the core. In contrast, Cliffortia is abundant at the onset of this zone (27%) but then declines sharply to 0% by 255 cal. yr BP and is almost absent thereafter. Both Stoebe-type and Anthospermum also recorded sharp declines from the onset of the zone. Stoebe-type reached a low of 5% by 535 cal. yr BP, but then recovered to 17% by the top of the core. Similarly, Anthospermum reached a low of 2% between 535 and 355 cal. yr BP and remained substantially reduced through to the surface. Restionaceae, Fabaceae, Malvaceae, Clutia-type and Rutaceae were all rare, with none constituting more than 3% of the land pollen sum. Asteraceae and Poaceae were less abundant still, with the former declining from 18% at 680 cal. yr BP to 5% at the surface and the latter varying between 7% and <1%, while Iridaceae is again present in small amounts (<5%). As through much of the preceding record, succulent karoo taxa were rare (<3%), with the exception of a peak in Pentzia-type pollen to 7% at 600 cal. yr BP.
Fossil charcoal
Microcharcoal was generally most abundant in GRNK3-1, where influx rates varied between 0.4 and 1.0 cm2/cm3 (Figure 5). From 4025 to 2005 (GRNK3-2a), influx rates of this class were substantially reduced, typically <0.4 cm2/cm3, then increased through to the top of GRNK3-2b at 695 cal. yr BP and continued to do so into GRNK3-3 (695 to −50 cal. yr BP). Maximum influx rates in this zone were reached at around 600 cal. yr BP and subsequently declined. Macrocharcoal, too, was perhaps more consistently represented in GRNK3-1, with influx rates generally remaining above 40 fragments/year (though ranging between 20 and 130 fragments/year). Rates were notably low (<40 fragments/year) between 4025 and 1845. In the upper portion of the core, substantial influx peaks of between 165 and 55 fragments/year occurred centred on 1565, 680, 355 and 195 cal. yr BP.
Non-land pollen and NPPs
Pollen taxa that could be derived from either land or non-land plants, as well as from spores/NPPs, are displayed in Figure 6. Only two non-land pollen taxa were identified in significant amounts. Gunnera influx in GRNK3-1 (5480–4025 cal. yr BP) was typically between 0 and 600 grains/year. Cyperaceae became increasingly abundant through the zone, peaking from around 600 grains/year at the base to 1900 grains/year by 4245 cal. yr BP.
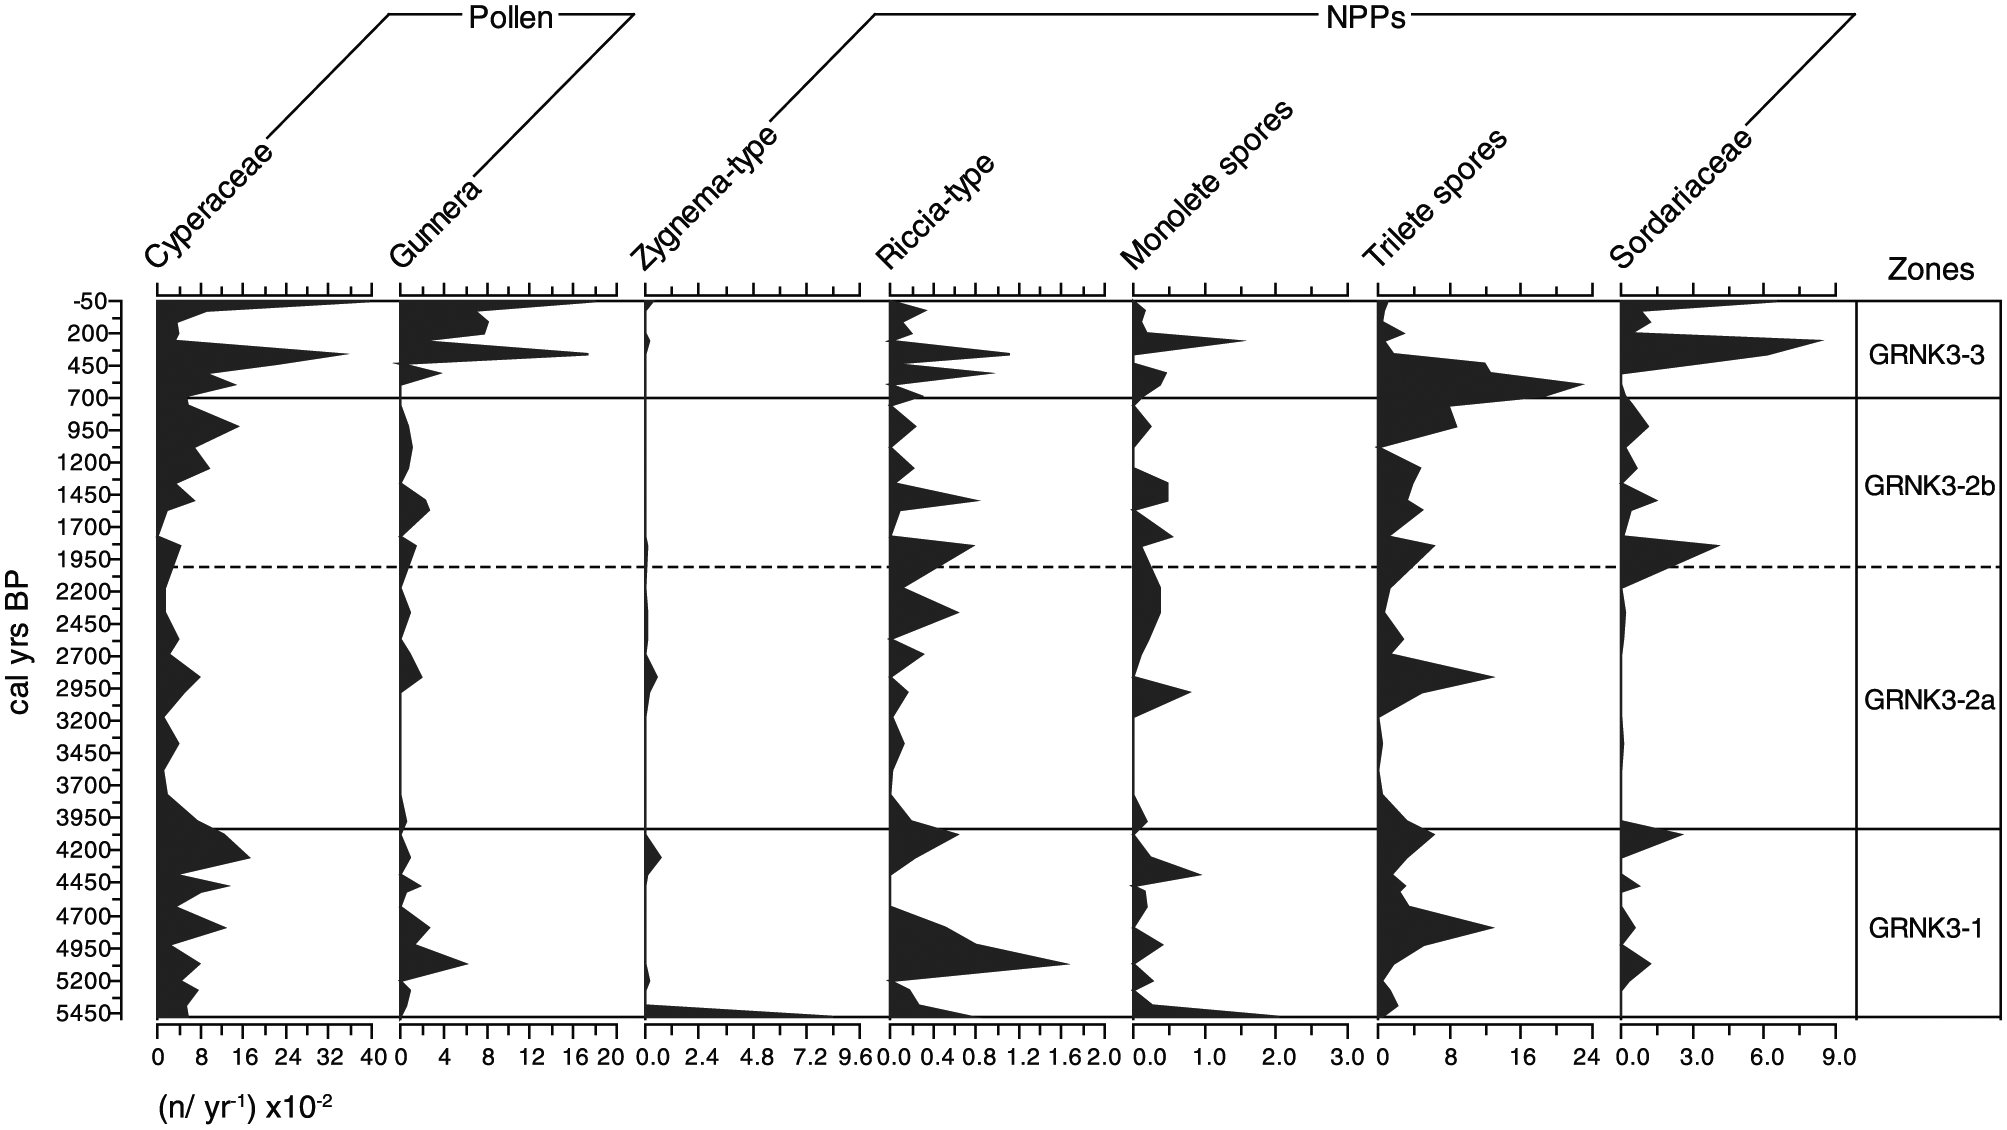
Non-land pollen and non-pollen palynomorphs from Groenkloof 3. Data are influx rates and are expressed as n spores/year × 10–2.
In Zone GRNK3-2a (4025–2005 cal. yr BP), the influx rate of Gunnera was lower still, being between 0 and 200 grains/year. Cyperaceae influx was also lower than in the preceding zone, not reaching abundances of >800 grains/year. Later, in Zone GRNK3-2b (2005–695 cal. yr BP), Gunnera remained scarce, with its influx not exceeding 250 grains/year. The rate of Cyperaceae influx increased from <500 grains/year at the base of the zone to 1500 grains/year by 920 cal. yr BP, which is similar to the maximum reached in the basal zone.
The uppermost zone, GRNK3-3 (695 cal. yr BP to near present), was characterised by much higher values of both Gunnera and Cyperaceae than recorded in the preceding zones. Influx rates of 1845 and 3400 grains/year were recorded for the respective taxa at 355 cal. yr BP. Sharp declines to 200 and 300 grains/year are recorded at 255 cal. yr BP and influxes then resurge to 1845 and 3900 grains/year by the surface of the core.
Spores of Zygnema-type, Riccia-type, Sordariaceae and the morphological taxa monolete spores and trilete spores are displayed in Figure 6. Influx rates of all taxa were erratic, yet some trends are discernible.
In zone GRNK3-1 (5480–4025 cal. yr BP), Zygnema-type was only of significant abundance in the lower most sample, where it accumulated at a rate of 720 spores/year. Influx peaks of Riccia-type of 80–160 spores/year occur around 5480, 5070 and 4080 cal. yr BP. Monolete spores were also only abundant in the most basal sample, and trilete spore influx rates were the highest of all the spore taxa. The latter taxon was present throughout the zone, with peaks to 1200 and 600 spores/year occurring at 4795 and 4080 cal. yr BP, respectively.
All spore taxa declined in abundance at the onset of zone GRNK3-2a (4025–2005 cal. yr BP). Most were absent or present at very low rates of influx (<100 spores/year) from the base of the zone until 3170 cal. yr BP, whereupon Riccia-type, monolete spores and trilete spores increased in abundance and remained significant features of the record through to the surface of the core. Notable peaks in the influx of Riccia-type occurred around 2365, 1845, 1485, 515 and 355 cal. yr BP. Monolete spores peaked at 3355, 1765, 1845, 680 and 255 cal. yr BP. Trilete spores were again the most abundant spore type, peaking at 2850, 1845, 1485 and 1365 cal. yr BP. Following this, trilete spores became very abundant with influx rates of between 800 and 2000 spores/year between 920 and 515 cal. yr BP. Peak trilete spore influx occurred at 600 cal. yr BP, and this was the most prominent feature of the spore record.
Sordariaceae influx did not increase until the onset of zone GRNK-2b (2005–695 cal. yr BP). A peak to 350 spores/year occurred at 1845 cal. yr BP, where after rates were similar to those recoded in the basal zone. Between 535 and 110 cal. yr BP, a striking increase in influx occurred, peaking to 820 spores/year at 255 cal. yr BP. The uppermost sample was also rich in Sordariaceae, with an influx of 650 spores/year recorded.
NMDS
A three-dimensional solution produced an NMDS model with a stress value of 18. A plot of NMDS1 versus NMDS2 (Figure 7) showed that neither samples nor taxa are strongly partitioned through time and by biome/aggregate taxonomic grouping. The only clear distinction was the segregation of samples from 600 to 0 cal. yr BP, primarily in association with Muraltia, Rutaceae, Fabaceae and Iridaceae. Almost no partitioning of samples and taxa through time was evident when NMDS1 is plotted against NMDS3.
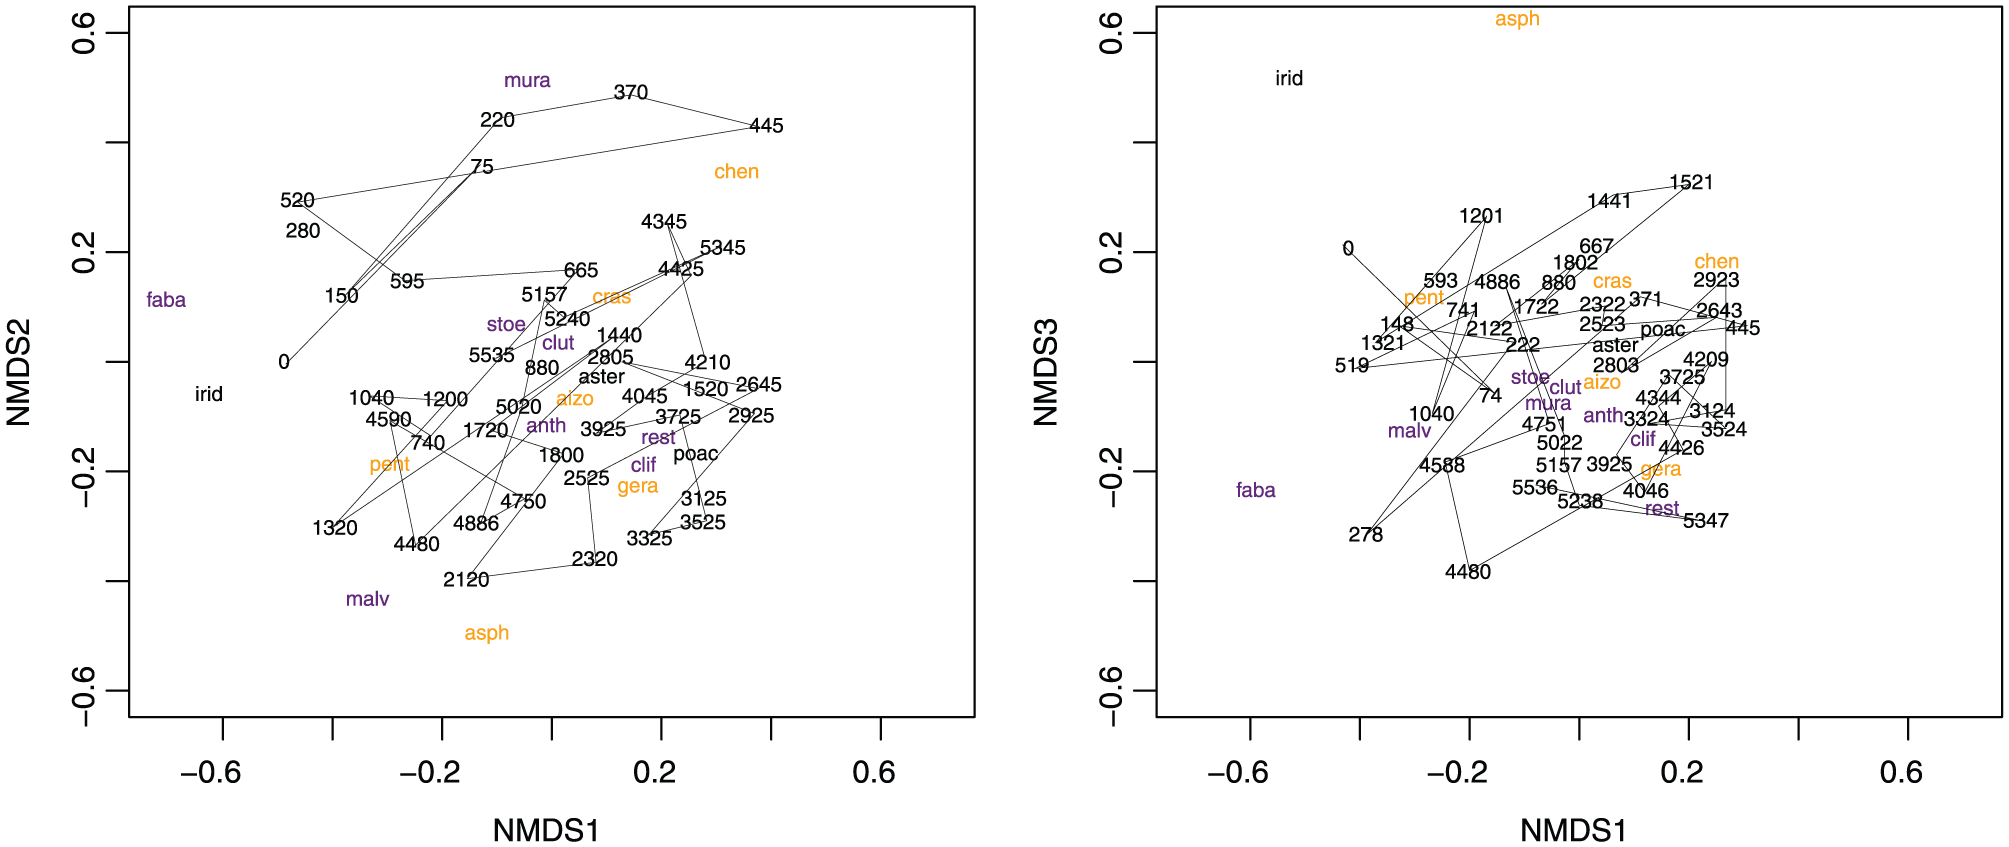
NMDS bi-plots of dimensions 1 and 2 (top) and 1 and 3 (bottom).
Discussion: Environmental and ecological impacts at the fynbos–succulent karoo boundary
Fire and fynbos in the mid-Holocene Altithermal (5480–4025 cal. yr BP)
The basal portion of the Groenkloof record (5500–4000 cal. yr BP) overlaps with the mid-Holocene Altithermal (MHA, 8000–4000 cal. yr BP). At this time, fynbos taxa and frequent fire dominated the ecosystem at Groenkloof (Figure 8), with a low representation of succulent karoo taxa. This period is characterised by what were likely the warmest (pre-industrial) Holocene temperatures across southern Africa (Chase and Meadows, 2007; Chase et al., 2013; Fitchett, 2016; Talma and Vogel, 1992). Inferred palaeotemperatures vary across the sub-continent and have been cited as great as 1–3°C warmer than present averages (Heaton, 1983, in Chase and Meadows, 2007). However, reliable palaeotemperature estimates for both Namaqualand and southern Africa as a whole are few and sparse. Despite this shortcoming, a qualitative interpretation of the nature of the palaeoenvironmental circumstances surrounding this phase of the record can be made with reference to locally inferred changes in vegetation, moisture and fire, comparable published records in the region, and the heuristic climatic template.
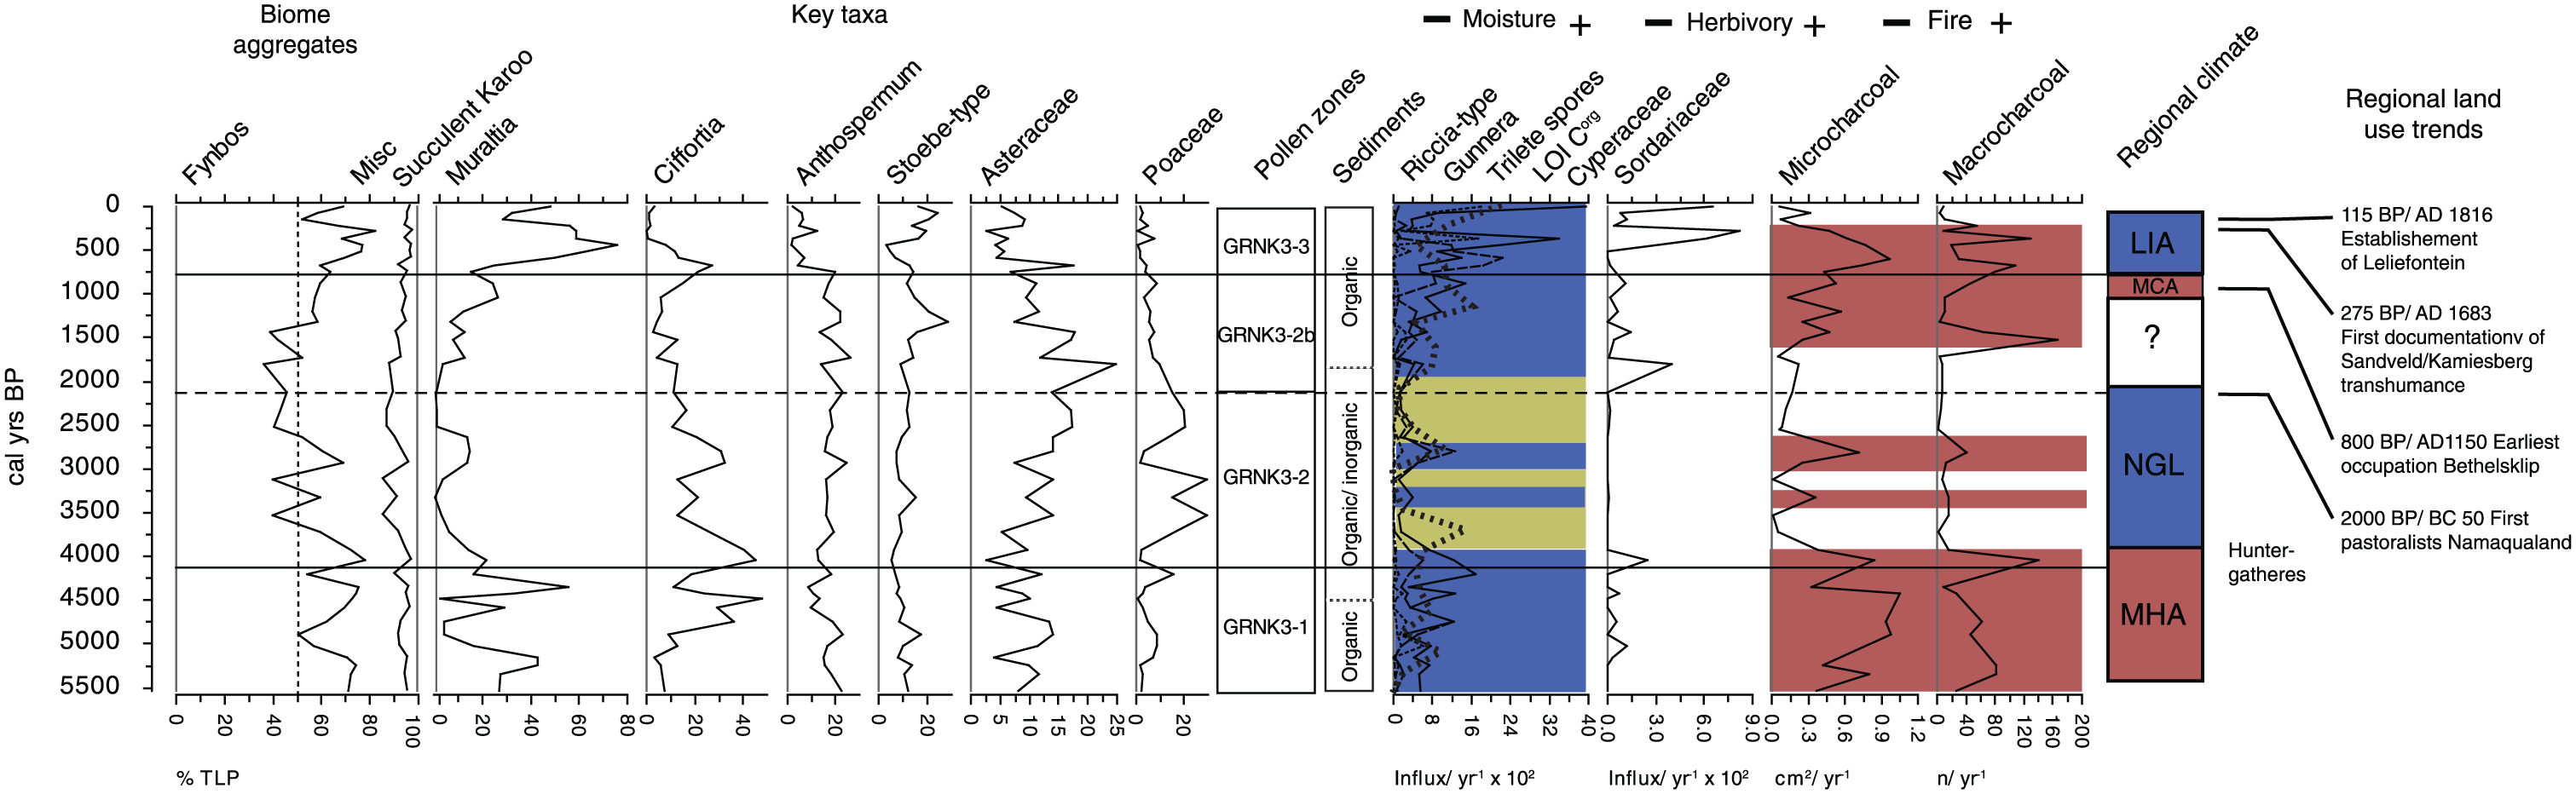
Ecological summary diagram for Groenkloof 3. Shown are (from left to right) biome aggregate data, key pollen taxa, pollen zones, sediment profile, moisture proxies, herbivory proxies, fire proxies and regionally recognised climate phases. Kamiesberg land-use history, derived from Webley (2007).
Warmer regional temperatures than present likely resulted in enhanced summer rainfall associated with the sub-tropical easterlies (Chase et al., 2009; Eitel et al., 2002; Stute and Talma, 1998; Figure 4.10). Groenkloof is positioned close to the boundary of the WRZ and YRZ systems (Figure 1), and this study therefore offers valuable insight into fluctuations in the position and nature of regional climatic systems. It is proposed here that a poleward contraction of the westerlies during the MHA would lead to a reduced influence of the South Atlantic Anticyclone (SAA) on climate in the Kamiesberg. This would result in reduced intensity of summer aridity through increased easterly flow and convective rainfall in summer. This scenario is supported in the Groenkloof record by the abundance of wetland indicators (Cyperaceae, Zygnemataceae, Riccia-type and Gunnera) as well as organic sediment accumulation (Figure 8). Through reduced summer moisture deficit, increased biomass productivity and frequent lightning as source of ignition (see Kraaij and van Wilgen, 2014), vegetation at the boundary was dominated by fynbos. Therefore, warmer temperatures were not associated with drought stress and increased succulent karoo abundance – as has been observed further to the south west, closer to the core region of the fynbos biome – during the period contemporaneous with the MHA (Meadows and Baxter, 2001; Quick et al., 2011; Scott and Woodborne, 2007a, 2007b; Valsecchi et al., 2013).
It has long been suggested that interglacial climatic refugia are required to account for the apparent antiquity of some fynbos evolutionary lineages (Deacon et al., 1992; Dynesius and Jansen, 2000; Jansen and Dynesius, 2002; Linder, 2005). Verboom et al. (2009) suggest that, based on the present geographical concentration of palaeoendemic species (Linder et al., 1992), the moister, cooler, less seasonal environments of the Cape Fold Mountains south of the Great Escarpment may have acted as long-term fynbos climatic refugia through not only the Quaternary but possibly the entire Cenozoic. The palaeoclimatic mechanism described above may have ensured refugial microclimatic conditions suitable for fynbos persistence in the Kamiesberg through the warmest parts of the present interglacial because increased summer rainfall would buffer the effects of higher temperatures on plant effective aridity (i.e. vapour pressure deficit), and perhaps through others with even warmer interstadial conditions, such as marine isotope stage 5e of the Eemian (the ‘Last Interglacial’) (Quick et al., 2015). Multi-model climate projections for the Kamiesberg in the 21st century suggest that late summer convective precipitation in the region will increase (MacKellar et al., 2007). As such, easterly moisture delivery in summer could potentially offset summer heat and aridity under future warm scenarios, as it did in the past.
However, the relevance of the MHA to understanding potential future changes is limited by a number of factors. The paucity of reliable palaeotemperature and moisture records in southern Africa, and Namaqualand in particular (see Chase and Meadows, 2007), restricts analysis of the degree and type of climatic stress that the system was subject to in the past. Moreover, projected potential future ecological scenarios are subject to considerable uncertainties emanating from both methodological problems in modelling earth and biological systems and social/economic factors contributing to future greenhouse gas emissions (Altwegg et al., 2014). Furthermre, the effects of elevated atmospheric CO2 concentrations on plant growth and interactions, in particular between herbaceous and woody plants, has been shown to have substantial impacts on biome dynamics in other semi-arid lands (West et al., 2013). Carbon dioxide concentrations were significantly lower during the middle Holocene than those in the present and projected future and could conceivably alter ecosystem dynamics at the fynbos–succulent karoo boundary.
Emergence of a drought-adapted Poaceae- and Asteraceae-dominated flora in response to cooling, aridity and decreased fire (4025–2005 cal. yr BP)
Termination of the MHA has been linked to a cooling event in the region that is expressed variably from around 4000 cal. yr BP, termed the ‘neoglacial’ (Chase and Meadows, 2007; Jerardino, 1993; Talma and Vogel, 1992). From 4000 to 2100 cal. yr BP, cooling is evident at both the Stampriet aquifer in east central Namibia (Stute and Talma, 1998) and at Uitenhage in the Eastern Cape of South Africa (Heaton et al., 1983). Temperature decreases of magnitudes 0.5 and 3°C relative to present are estimated, respectively. These estimates are broadly contemporaneous with cooler temperatures registered in the Cango Cave speleothem record from the southern Cape (Talma and Vogel, 1992), and the Tortoise Cave in the south western Cape (Jerardino, 1993). The transition in vegetation from fynbos to an Asteraceae–Poaceae-rich community and increased fire at Groenkloof at this time, as indicated by the pollen and charcoal data (Figure 8), reflects a response to a regional cooling temperature gradient associated with increased aridity. This is likely due to intensification and north westerly shifting of the SAA resulting from the effects of climatic cooling on regional ocean and atmospheric circulation (Chase et al., 2009, 2010; Eitel et al., 2002; Stute and Talma, 1998). The charcoal record suggests that the shift to a cooler, drier climate reduced fire at Groenkloof by limiting biomass production and ignition by lightning. This resulted in an overall decline in abundance of fynbos taxa, which is primarily reflected in decreases in fire-dependent functional types such as Muraltia. Typical fynbos taxa that reproduce independent of fire such as re-seeding species of Cliffortia, Anthospermum and Stoebe-type, persisted and even proliferated at this time, apparently unhindered by pronounced aridity, suggesting high physiological resistance to drought. This is consistent with current understanding that drought responses among co-occurring fynbos species are highly variable, that mature woody plants are highly resistant to drought and that seasonality of drought is the primary factor determining drought response (Agenbag et al., 2008; Altwegg et al., 2014; Mustart et al., 2012; West et al., 2012).
The community that emerged at Groenkloof in response to the MHA–Neoglacial transition (4000 cal. yr BP) was not characterised by a dominance of taxa ‘typical’ of fynbos nor succulent karoo. Instead, members of the Asteraceae and Poaceae, both considered generalist groups because of their wide array of ecological affinities, came to dominate the flora (Figure 8). The low responsiveness of key succulent karoo types such as Aizoaceae, Crassulaceae and Asphodelaceae to increased aridity and reduced fire is attributed to differing dispersal syndromes and competitive relationships. Succulents within the Aizoaceae produce seeds held in hygrochastic capsules. This dispersal strategy does not allow rapid or large-scale shifts in population distributions. In contrast, members or Asteraceae (particularly annuals) produce abundant, wind-dispersed small seeds, making their population distributions more dynamic (Midgley and Thuiller, 2007; van Rheede van Oudtshoorn and van Rooyen, 1999; van Rooyen, 1999). Furthermore, the comparatively slow growth rates and low physical form prevalent among succulent types in relation to woody fynbos taxa (Agenbag et al., 2008; Jacobsen et al., 2009; Lechmere-Oertel and Cowling, 2001) is likely to have further impeded establishment and population expansion of succulent species. As environmental niche space opened up in response to increased aridity, fynbos productivity declined leading to fire inhibition, while grasses and Asteraceae were likely more adept at establishing within the empty ‘space’ (both physical and niche) at the fynbos–succulent karoo boundary.
The Poaceae/Asteraceae-dominated community that emerged in response to increased aridty and reduced fire may well have been dominated by taxa typical of the intermediate band of ‘mountain renosterveld’ (Colville et al., 2014) such as Chrysanthemoides and Danthonia. Indeed, the surge in Stoebe-type abundance (likely representing Elytropappus rhinocerotis) through this arid phase would appear to support this interpretation. Alternatively, the pollen spectra may reflect proliferation of a plant community that has no modern analogue. This finding is significant in anticipating how the biome boundary might respond to future warming and drying, in particular that relatively rare regional vegetation – such as that at the contemporary biome boundary – may proliferate as low adaptive rates inhibit the attainment of equilibrium between climates and biomes, or that novel biotic communities may emerge (Jackson and Williams, 2004). Clarification of the precise nature of the emergent community is however limited by the low taxonomic resolution within these two ubiquitous families that is inherent in this study and typical of pollen analysis studies in the region (e.g. Meadows and Sugden, 1991, 1993) and may be advanced by further studies of plant responses to drought and fire exclusion at the contemporary fynbos–succulent karoo transition (for example, see Esler et al., 2015).
Re-establishment of fynbos dominance with neoglacial easing (2005–695 cal. yr BP)
As the neoglacial eased and temperatures increased regionally from around 3000 to 2000 cal. yr BP (Talma and Vogel, 1992), it appears that summer aridity and associated plant moisture stress decreased at Groenkloof, while fire gradually became re-established as a key ecosystem process. Even though Riccia-type pollen resurges from around 3000 cal. yr BP, it is not until around 2005 cal. yr BP that all mesic hydrological indicators re-emerge in the record, and charcoal influx increases even later at around 1500 cal. yr BP. The temporal variability in this change suggests that the neoglacial termination and its ecological effects were both variable and gradual. Increased moisture supply likely afforded a competitive advantage to fynbos herbs and woody shrubs over Poaceae and Asteraceae (Lechmere-Oertel and Cowling, 2001; West et al., 2012), and this advantage would be furthered by biomass accumulation and fire. Thus, both direct abiotic, biotic and disturbance factors allowed the fynbos community to gradually become re-established (Figure 8).
Later, around the time of the Medieval Climate Anomaly (MCA; 1000–300 cal. yr BP/AD 950–1250) (Nicholson et al., 2013), further environmental and ecological changes occurred at Groenkloof, with fynbos, moisture and fire continuing to increase. However, these trends appear to be a continuation of the neoglacial easing rather than a distinct climatic anomaly. The MCA therefore did not have a pronounced impact at Groenkloof, which is consistent with regional observations (Holmgren et al., 2003; Huang et al., 2000; Lee-Thorp et al., 2001; Talma and Vogel, 1992; Tyson and Lindesay, 1992). The MHA may therefore provide more valuable insights as to the effects of future warming than the MCA.
Pastoralist impact and the ‘Little Ice Age’ (695 cal. yr BP to near present)
For the western margin of South Africa, the ‘Little Ice Age’ (LIA; 300–100 cal. yr BP) was likely the coldest and wettest phase in the Holocene (Benito et al., 2011; Chase et al., 2013; Stager et al., 2012; Weldeab et al., 2013). This climatic scenario contrasts with that during the neoglacial, where cooling resulted in drying. This apparent paradox reflects the geographical position of Groenkloof in relation to regional climatic phenomena during Holocene temperature maxima and minima (Figure 1). During the MHA, Groenkloof experienced a positive moisture balance because of increased easterly flow and reduced influence of the SAA. In the LIA, the westerlies system intensified bringing increased winter rainfall reflecting a similar mechanism to that which occurred around the Last Glacial Maximum (though proportionally lower in magnitude) (Chase and Meadows, 2007).
Despite winter rainfall being the dominant source of increased moisture during the LIA, pollen of Muraltia which is adapted to a frequent-fire regime was more abundant than during the MHA. Under a winter rainfall regime, electrical storms produced by advective sub-tropical cyclonic weather systems would, presumably, have been much less common than during the MHA. So what was the ignition source for these frequent fires?
At the same time as these climatic changes, the first evidence of Khoi pastoralism in the Kamiesberg is found from around 760 cal. yr BP (Webley, 1986, 2007). Their presence is associated with increased large herbivore abundance, as indicated by the influx of Sordariaceae spores (Figure 8). The expected decrease in fire did not occur, suggesting that burning by humans may account for such frequent fires and associated changes in vegetation, despite the cooler and wetter conditions. Humans during this most recent phase of the record may have performed a similar functional role to that of summer lightning in the MHA. However, important differences in the plant community between the LIA and MHA emerged from this new anthropogenic influence. Increased land-use intensity resulted in reductions in all but the most disturbance-adapted taxa (i.e. to those taxa adapted to high herbivory and frequent fire, such as Stoebe-type and Muraltia), and a functionally and taxonomically depauperate alternative ecosystem state (Figure 8).
Conclusion
The mega-diverse fynbos biome may be vulnerable to increasing temperatures and aridity in the future, but responses to future climate change and interactions with fire are uncertain. Past warm periods can provide insights into ecosystem dynamics that may help in understanding potential future responses.
From 5480 to around 695 cal. yr BP, vegetation at the fynbos–succulent karoo boundary at Groenkloof in the Kamiesberg responded principally to changes in climate and fire. Fynbos was resilient during the MHA from 5480 to 4025 cal. yr BP, probably because increasing temperatures were buffered by increased summer moisture associated with enhanced sub-tropical easterly flow, and because high fire frequency would have further hampered any expansion of succulent karoo taxa. Between 4025 and 695 cal. yr BP, regional neoglacial cooling was associated with increased summer aridity and intensification of the SAA. This resulted in reduced biomass production, fire inhibition and substantially reduced fynbos abundance. Specifically, Asteraceae, Poaceae and drought-adapted woody fynbos shrubs of Cliffortia and Stoebe-type dominated the vegetation community. This emergent community either resembled mountain renosterveld vegetation that presently typifies the boundary or a no-analogue community. The turnover in taxa buffered the fynbos biome and allowed it to persist through periods of pronounced aridity and infrequent or absent fire, which in theory could have benefitted succulent karoo taxa. From 735 BP to present, human land-use interacted with fire and climate, with human fire management decoupling the climate-fire-vegetation system to some extent. Anthropogenic ignitions and disturbance by herbivores led to frequent fire and a depauperate ecosystem. This change associated with the pastoralist footprint represents the most substantial change in the entire record at Groenkloof. The internal dynamics and disturbance impacts observed in this record might help to explain why fynbos does not appear to be tightly coupled to recent warming temperatures.
Palaeoecological data from this study therefore suggest that the Kamiesberg fynbos is afforded resilience both extrinsically through its position within the abiotic template (i.e. its orographic setting in close proximity to the summer rainfall system) and intrinsically through functional diversity that allows the system to persist with low or no fire during times of drought. In terms of the effects of future climate change on fynbos, high drought resistance among a number of fynbos taxa (particularly woody shrubs) afforded intrinsic resilience to the system in the past. However, the interacting effects of fire, alien species, CO2 and possible summer-drought stress may lead to different responses in the future. More detailed understanding of the nature of these characteristics and their relevance to potential future changes will require development of palaeotemperature records in the region, further studies of drought and fire exclusion impacts at the contemporary biome boundary, as well as understanding of the role of changing atmospheric CO2 concentrations, past and future, on plant growth and interactions.
Footnotes
Acknowledgements
AJM made substantial contributions to the conception or design of the work and the acquisition, analysis and interpretation of data for the work; drafting the work and critical revision for important intellectual content; final approval of the version to be published; agreement to be accountable for all aspects of the work in ensuring that questions related to the accuracy or integrity of any part of the work are appropriately investigated and resolved. LG and MTH made substantial contributions to the conception and design of the work, interpretation of data; critical revision for important intellectual content; assistance with drafting and editing of the manuscript; final approval of the version to be published; agreement to be accountable for all aspects of the work in ensuring that questions related to the accuracy or integrity of any part of the work are appropriately investigated and resolved.
Data availability
The primary data used in this research article will be submitted to an online repository in due course. Please contact authors for details.
Declaration of conflicting interests
The authors declare that the research was conducted in the absence of any commercial or financial relationships that could be construed as a potential conflict of interest.
Funding
The African Climate and Development Initiative (UCT) provided the primary funding for this research. Additional financial support was received from NRF South Africa (African Origins Platform) and the Dorothy Cameron Memorial Fund, Botany Department, UCT. The Mazda Wildlife Fund provided a research vehicle for fieldwork.