
Abstract
Studying past climate change has important scientific significance in exploring long-term climatic variability, assessing the nature and human’s contribution to climate warming, and predicting future climate change. Here, we presented a data synthesis of pollen records, organic geochemical proxies, as well as lake-level records, along with numerical climate classification and lake-level simulations to show temporal and spatial evolution of past vegetation and hydrologic change during the Holocene in China. Both geological data and numerical modeling indicated that the evolution of vegetation shows out-of-phase relationships with lake hydrological status in various regions. China as a whole experienced optimal vegetation cover in the mid-Holocene. However, areas dominated by the Asian monsoon and the Westerlies did not uniformly show an early Holocene hydrological optimum. For the Westerlies-controlled regions, optimal conditions prevailed during the mid-Holocene. These apparent contradictions were closely related to various driving factors in different geographical regions. Precipitation has been recognized as a major influence on lake hydrological status of arid and semi-arid in northeast China, whereas in other regions of China, the combined effect of evaporation and precipitation was more influential. Likewise, the limiting factor of vegetation conditions was asynchronous in China, for example, moisture in northwestern China, temperature in the Qinghai-Tibet Plateau, as well as moisture and temperature in the monsoon marginal zones and monsoonal regions. The results provide insights into the underlying climate-forcing mechanisms, and demonstrate a new perspective on Quaternary environment change research.
Keywords
Introduction
Many studies have been conducted regarding Chinese vegetation and lake hydrological status during the Holocene in particular regions using numerous proxy data from different sources (An et al., 2000; Chen et al., 2008; Herzschuh, 2006; Li et al., 2009b; Liu et al., 2005, 2013; Long et al., 2010; Parmesan, 2006; Qian et al., 2009; Yu at al., 2000). A recent synthesis of Chinese lakes showed that the highest stands of most lakes in the Tibetan Plateau occurred during the early Holocene, while the arid region lakes in northwestern China reached their maximum lake level in the mid-Holocene, and overall high lake-levels in the monsoonal regions were observed during the mid-Holocene (Shen, 2013). A paleovegetation pattern reconstructed by Yu et al. (2000) indicated that favorable vegetation conditions in China prevailed during the mid-Holocene when the forest biomes in eastern China systematically shifted northward and extended westward. These findings have been supported by other studies. For example, shorelines of a series of lakes on Tibetan Plateau showed a humid climate with a persistent and stable high lake level occurred during the early Holocene (Liu et al., 2013). Paleoclimate records on sedimentology, lake-level, and geochemistry data indicated that maximum moisture conditions with the highest lake levels and densest vegetation cover prevailed on the mid-latitude arid Asian region in the mid-Holocene (Chen et al., 2008). Fossil pollen records from 20 sites in the East Asian monsoon margin region indicated that during the Holocene, the region was dominated by steppe vegetation, except for the mid-Holocene period when forest patches were relatively common (Zhao and Yu, 2012). However, as documented by lake-level records in southwest China, high lake-level conditions existed in the area dominated by the Indian monsoon for the early Holocene (Zhang et al., 2016). Based on the numerical modeling and geological data, Li and Morrill (2010) found that most of the lake levels in monsoonal Asia began to rise in the post-glacial or beginning of the Holocene, and reached their highest level during the early Holocene. Although previous records and simulations as discussed above have paid much attention to millennial-scale variations in vegetation and lake hydrological status, few studies have shown a comprehensive understanding for the out-of-phase relationship between them during the Holocene. In addition, some scientists have proposed the hypothesis that lake evolution was asynchronous among various climate zones (Shen, 2013; Wu and Ma, 2011).
In order to explore the temporal and spatial evolution patterns and forcing factors for Holocene vegetation and lake hydrological status in China as well as investigate the relationship between them, this paper presents an analysis and synthesis of various proxies including organic geochemical data, pollen records, and lake-level records from various Köppen climate zones and different geographical regions of China. Organic geochemical proxies and pollen records, providing direct information on past changes in the regional vegetation and climate, were used to reconstruct Holocene vegetation history (Aravena et al., 1992; Bowen, 1991; Krishnamurthy et al., 1986; Li et al., 2009b; Stuiver et al., 1975; Tian et al., 2008; Xiao et al., 2004; Zhao et al., 2010, 2011). Artemisia (%) Chenopodiaceae (%), Pinus (%), Betula (%), Quercus (%), Cyperaceae (%), trees (%), herbs (%), and A/C were collected for inferring the specific plants types. Lake-level records with rich resources for past hydrologic changes (Li and Morrill, 2010; Street-Perrott and Harrison, 1985; Street-Perrott and Roberts, 1983) were chosen to imply long-term changes of lake hydrological status. Meanwhile, 22 lake-level records were verified by the Community Climate System Model (CCSM 3.0), a lake energy-balance model, and a lake water-balance model. Our results help to provide a deeper understanding for Quaternary environment change research and will provide the basis for the reconstruction of past climate change and prediction of future climate variability.
Data, methods, and simulations
Numerical climate classification
Köppen-Geiger climate classification is one of the most widely used climate classification system, which is developed based on the vegetation distribution connected to annual cycles of precipitation and temperature (Lohmann et al., 1993; Naipal et al., 2015; Peel et al., 2007). This modified classification identifies five main climate regions: tropical (A), arid (B), temperate (C), cold (D), and polar (E) (Table 1). The A-, C-, and D-zones are further subdivided closely related to the seasonality of temperature and precipitation (Baker et al., 2010).
Description of Köppen climate symbols and defining criteria (from Peel et al., 2007).

MAP: mean annual precipitation; MAT: mean annual temperature; Thot: temperature of the hottest month; Tcold: temperature of the coldest month; Tmon10: number of months where the temperature is above 10; Pdry: precipitation of the driest month; Psdry: precipitation of the driest month in summer; Pwdry: precipitation of the driest month in winter; Pswet: precipitation of the wettest month in summer; Pwwet: precipitation of the wettest month in winter; Pthreshold: varies according to the following rules (if 70% of MAP occurs in winter then Pthreshold = 2 × MAT, if 70% of MAP occurs in summer then Pthreshold = 2 × MAT + 28, otherwise Pthreshold = 2 × MAT + 14). Summer (winter) is defined as the warmer (cooler) 6-month period of AMJJAS (ONDJFM).
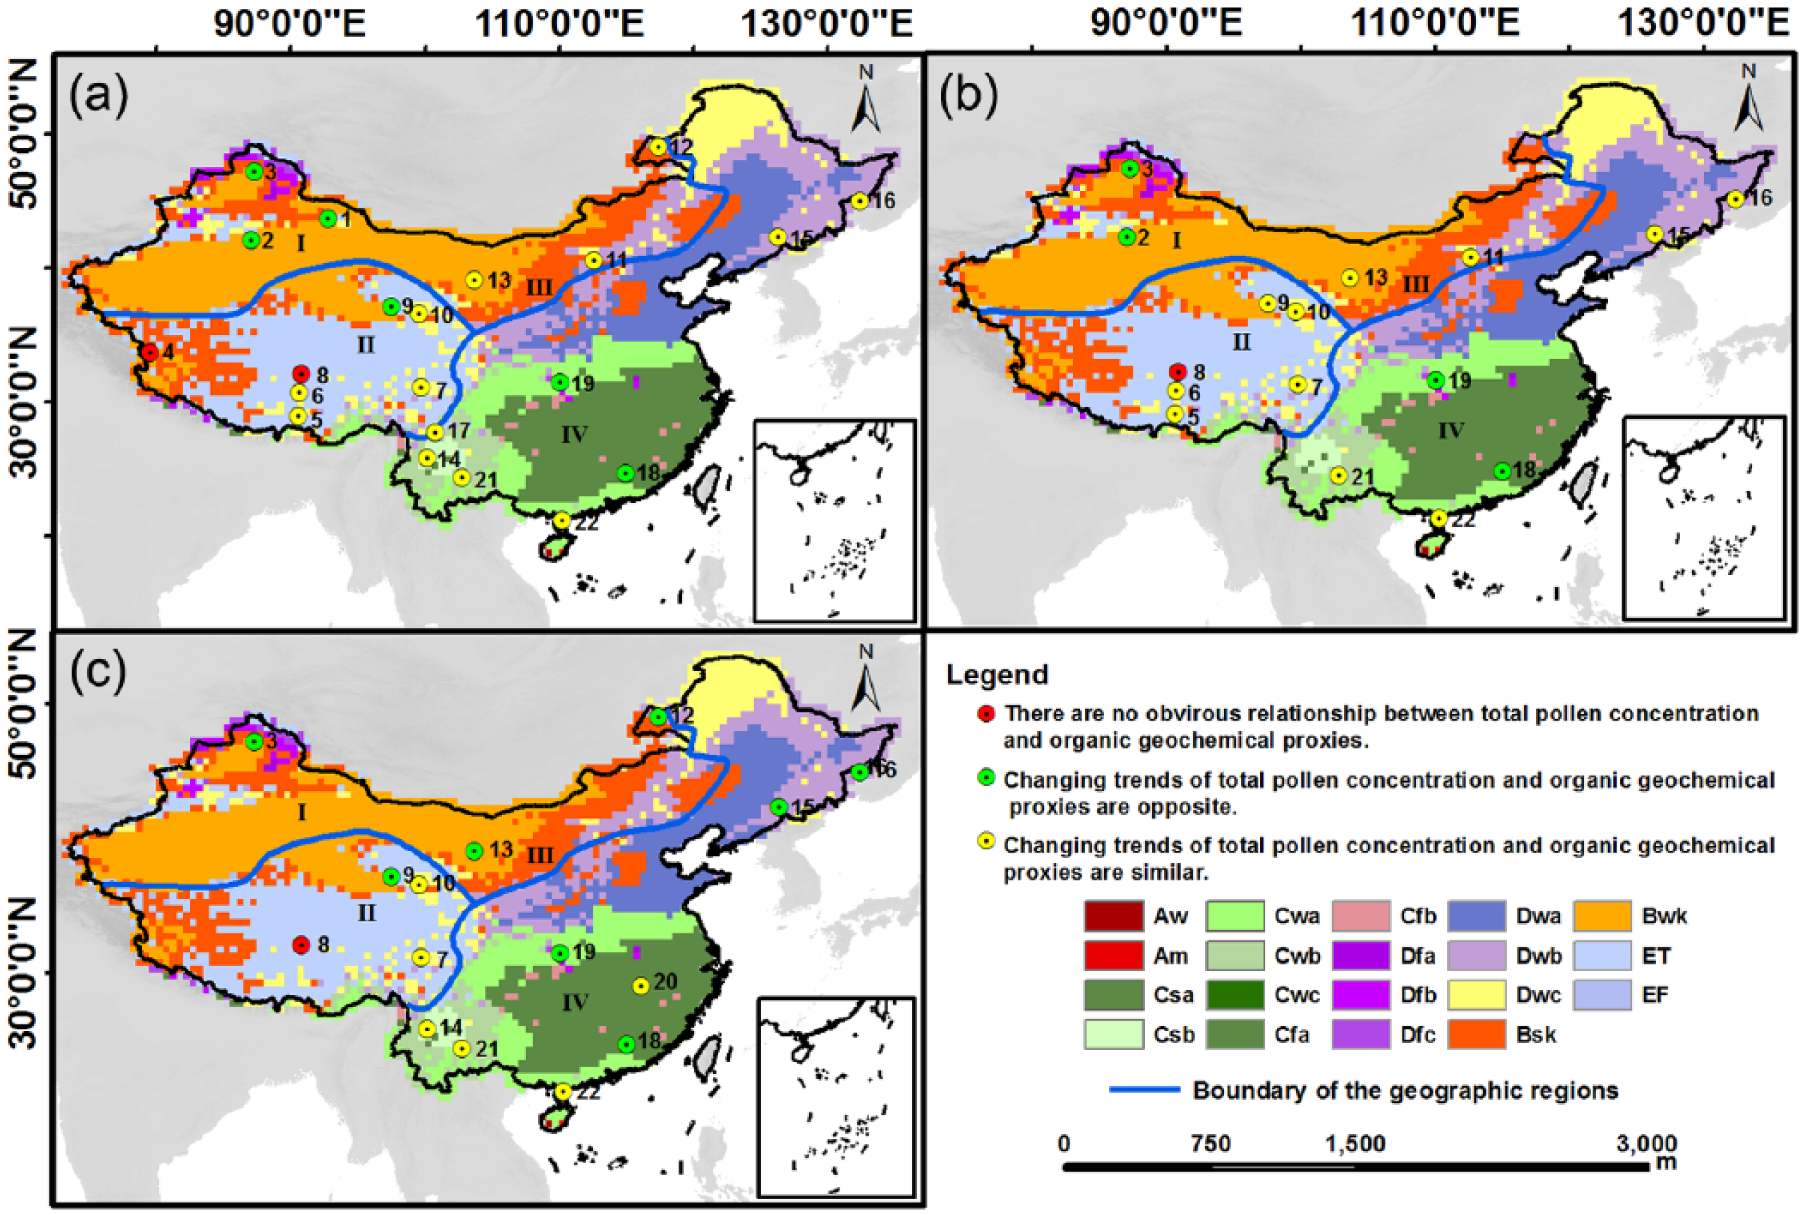
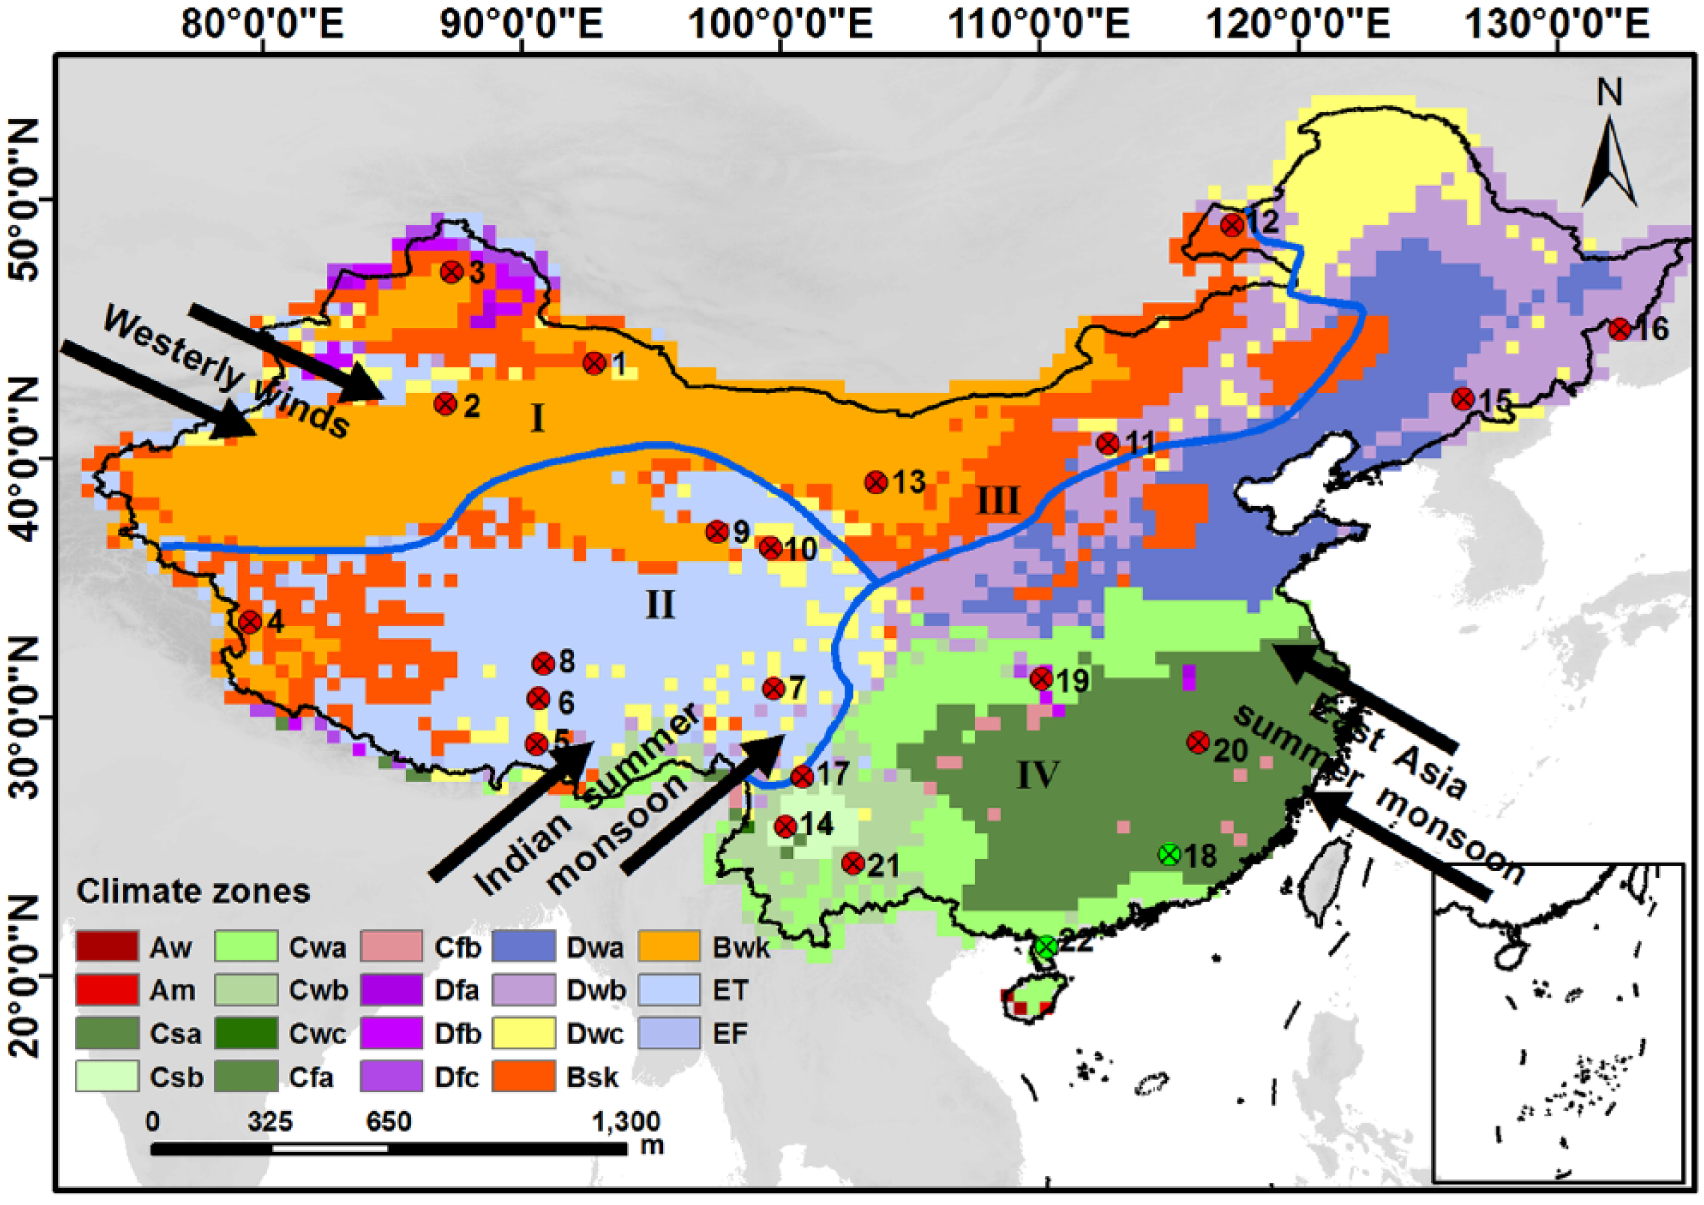
Based on a series of 0.5°×0.5° monthly gridded precipitation and temperature datasets during 1961–2013 at meteorological stations released by the National Meteorological Information Center, and a 0.5°×0.5° gridded elevation dataset downloaded from http://www.ngdc.noaa.gov/mgg/topo/globe.html, we divided China’s climate into five main climate groups, 12 types, and 28 subtypes according to criteria of Table 1. As depicted in Figure 1, China’s main climate groups are Arid (B), Temperate (C), Cold (D), and Polar (E), and main climate types include Steppe climate (Semi-arid) (Bs), Desert climate (Bw), Mild temperate with dry winter (Cw), Mild temperate, Fully humid (Cf), Snow with dry winter (Dw), and Tundra climate (ET).
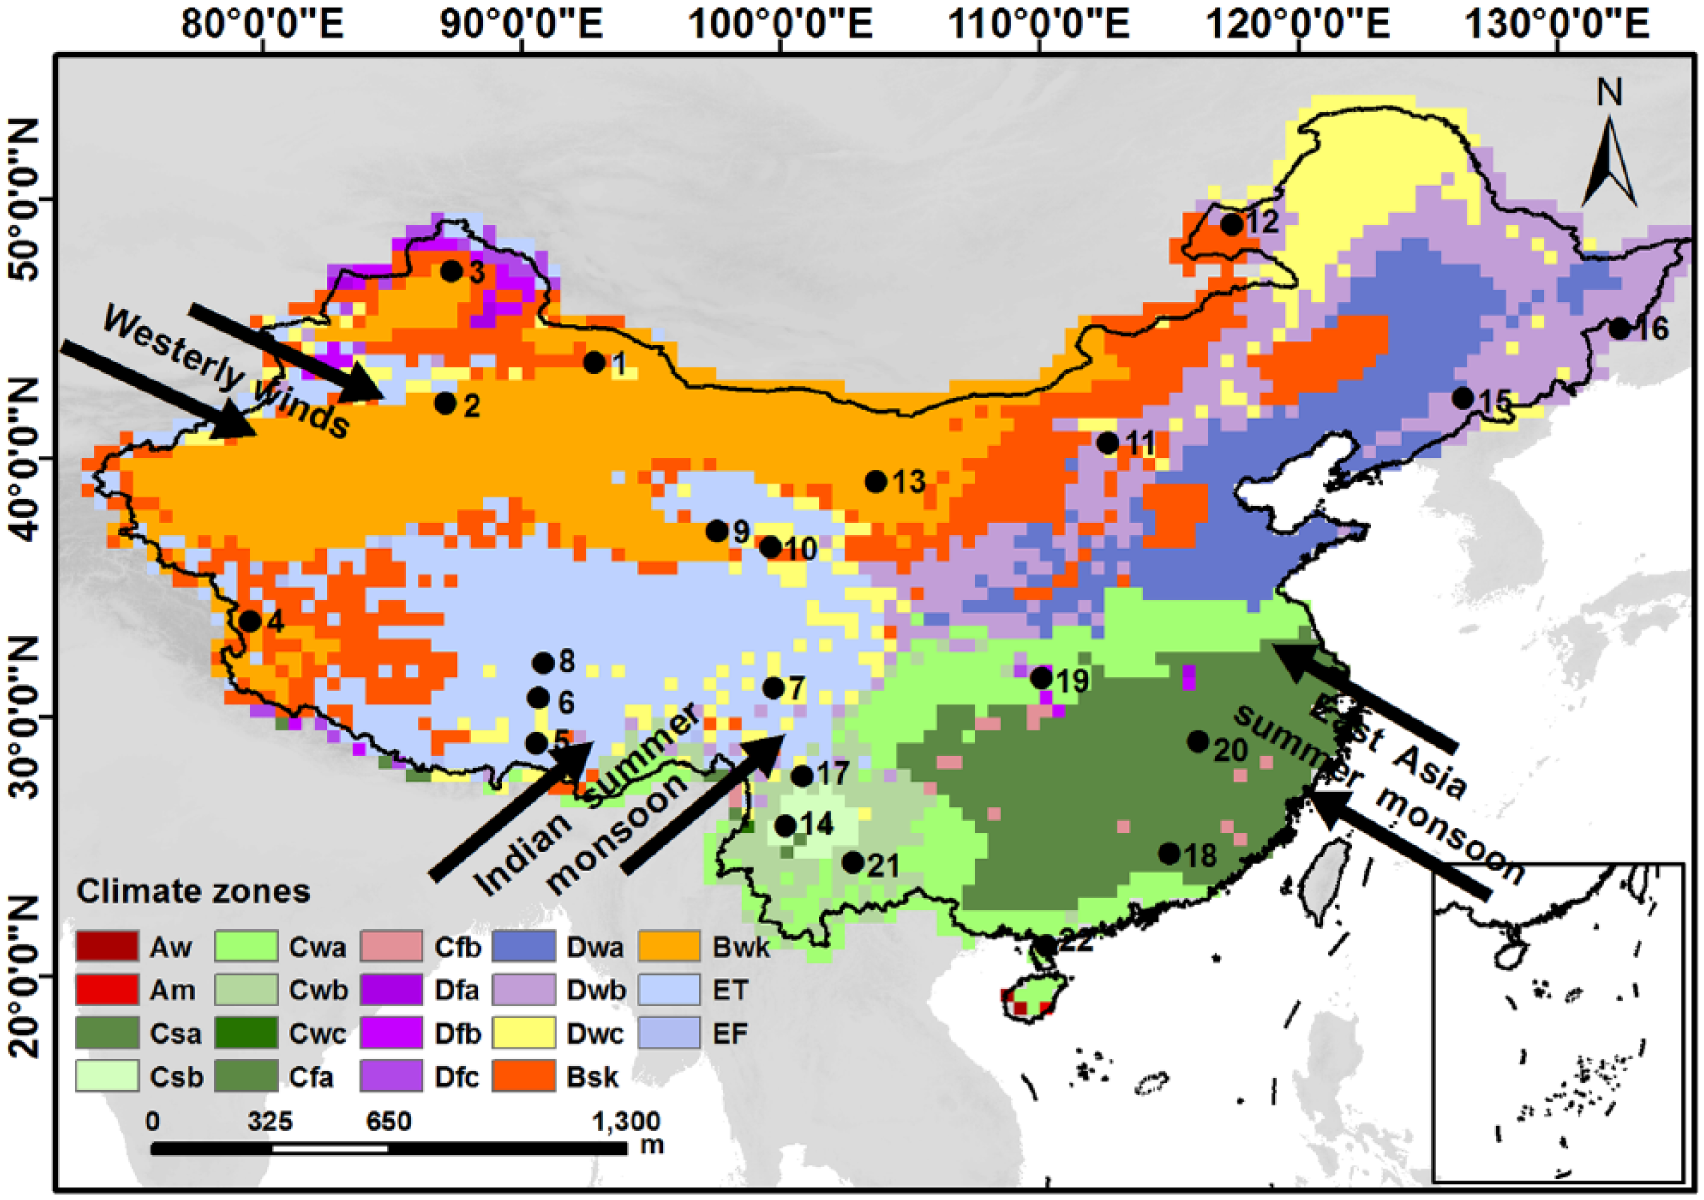
Overview map showing the lake sites selected in this study (numbers indicated refer to the lakes, see Table 2), the dominant circulation systems, and the numerical climate classification.
Data sources and analyses
Holocene lake records in this paper were chosen based on four criteria. (1) The selected lakes must have reliable chronologies and successive sedimentary sequences in the Holocene. (2) The record length should cover most of the Holocene without documented depositional hiatuses. (3) The indicators derived from the records must include pollen records, lake-level records, and at least one type of organic geochemical proxies. (4) The selected lake-level records should be reconstructed by the effective proxies except organic geochemical proxies and pollen records. Considering the above-mentioned criteria, 22 lakes derived from various Köppen climate zones and different geographical regions of China were selected (Figure 1), in which 21 lakes contain total organic carbon (TOC) records, 15 lakes contain C/N records, and another 15 lakes contain δ13C records (Table 2). The radiocarbon ages (14C yr BP) of lakes were calibrated to calendar years (cal. yr BP) by the software of Calib611; if necessary, we removed all possible old-carbon effects using information provided in the original publications. The calibrated ages were used in compiling organic geochemical proxies and total pollen concentration throughout the text (Figures 2–4), and lake-level records and representative pollen indicators are shown in Tables 2 and 3.
Information on lake records in organic geochemical proxies, pollen, and lake-level datasets from China.
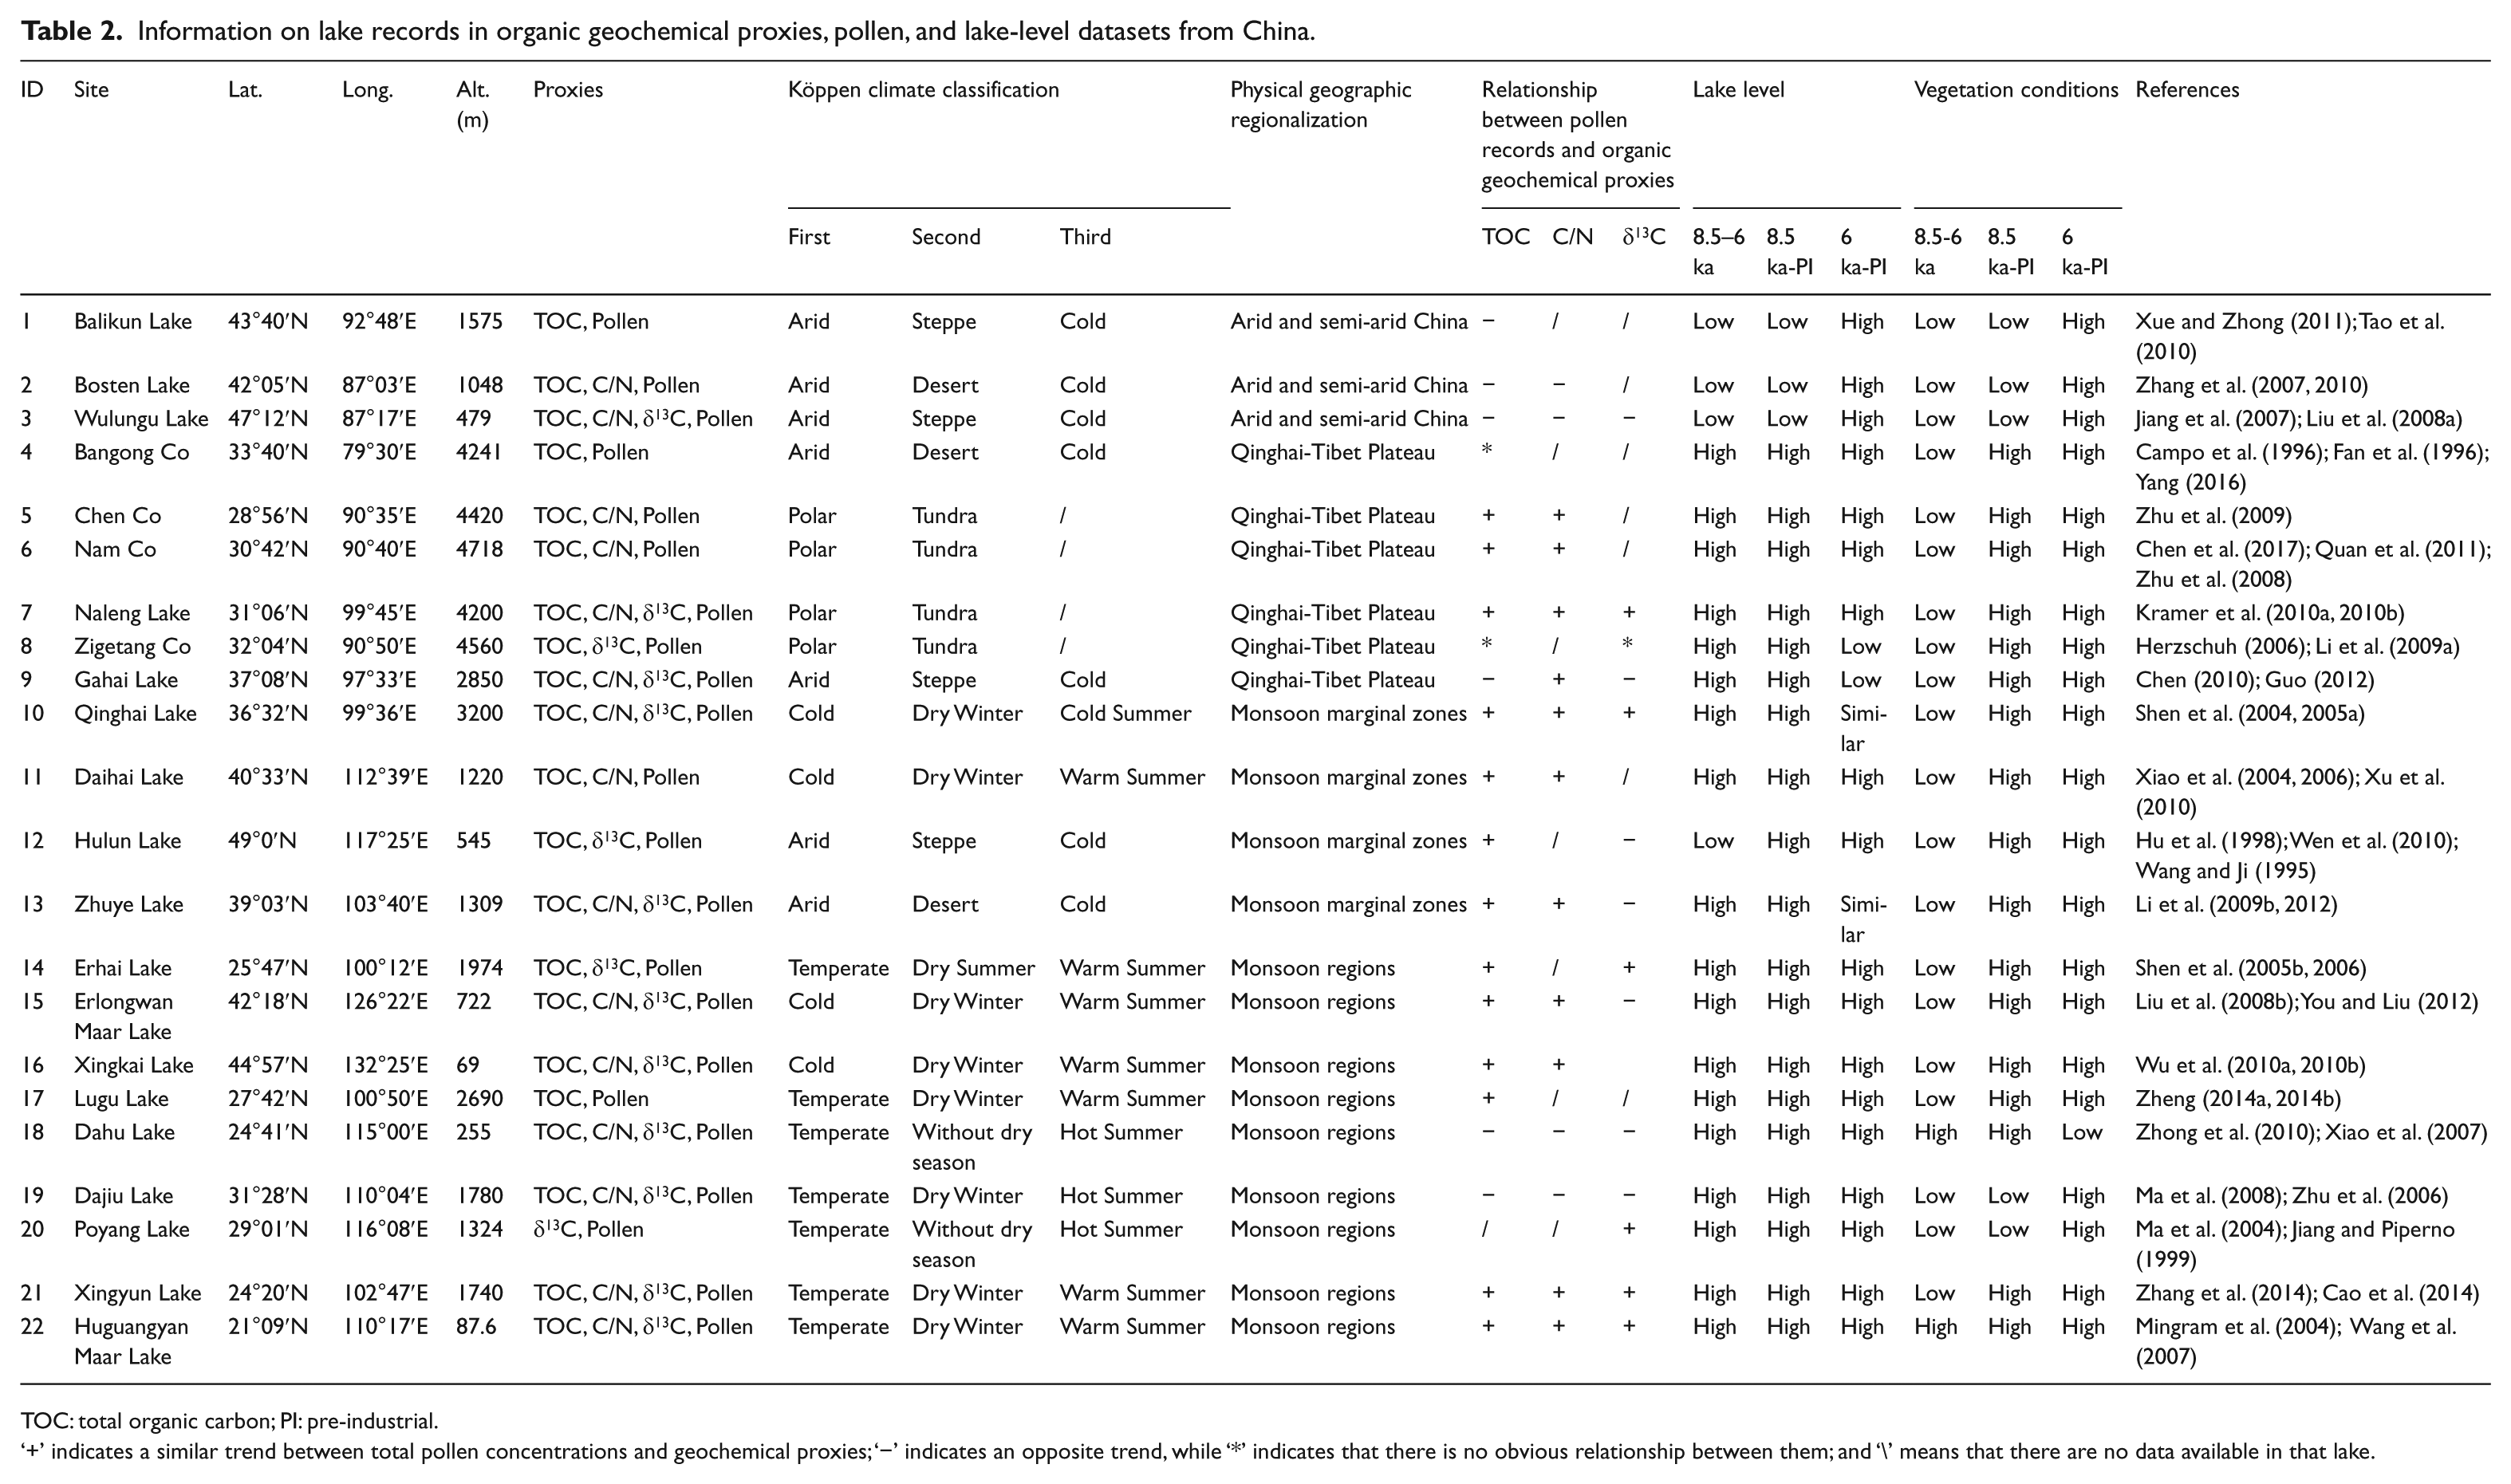
TOC: total organic carbon; PI: pre-industrial.
‘+’ indicates a similar trend between total pollen concentrations and geochemical proxies; ‘−’ indicates an opposite trend, while ‘*’ indicates that there is no obvious relationship between them; and ‘\’ means that there are no data available in that lake.
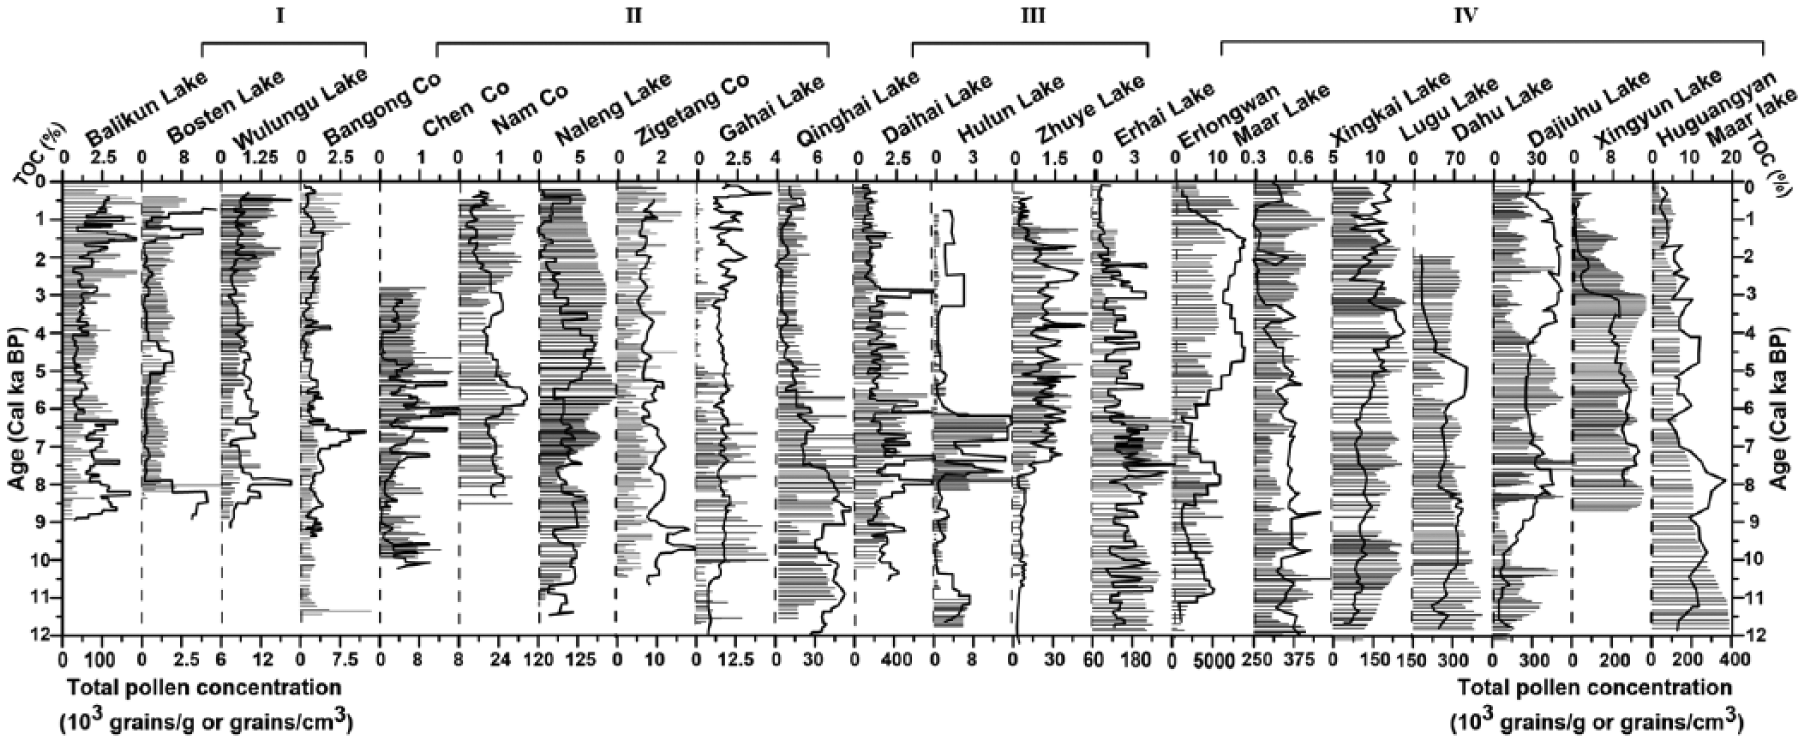
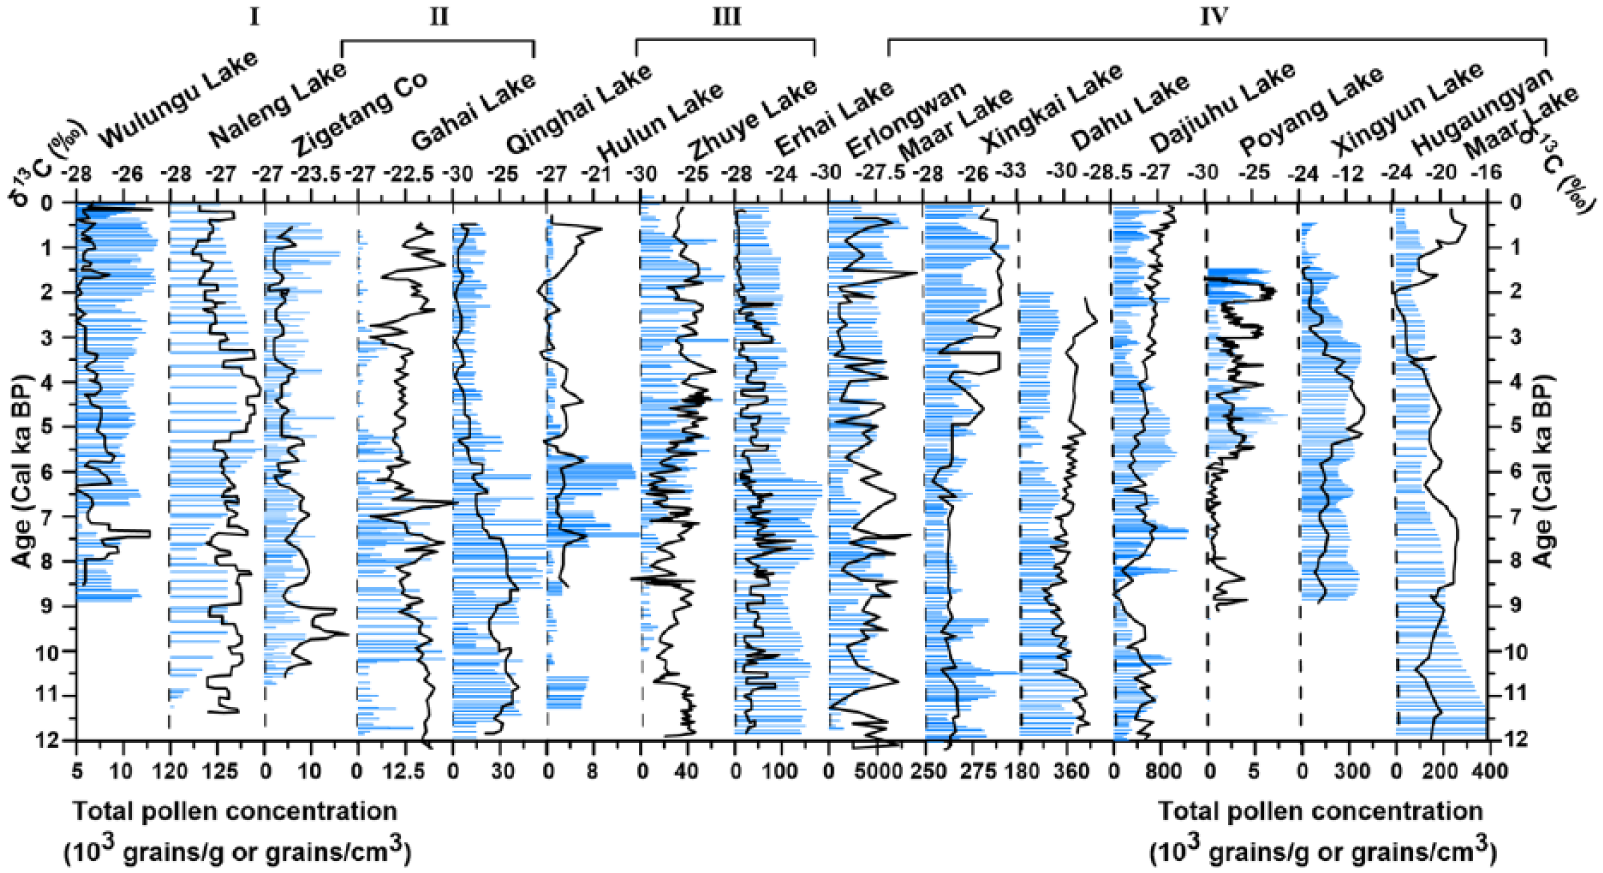
Relationship between total pollen concentration (103 grains/g or grains/cm3) and total organic carbon (TOC, %). Gray bars suggest pollen concentration and black curves indicate TOC. Roman numerals show the geographical zones of China: the arid and semi-arid area in northwest China (I), the Qinghai-Tibet Plateau (II), the monsoon marginal zones (III), and the monsoonal regions (IV).
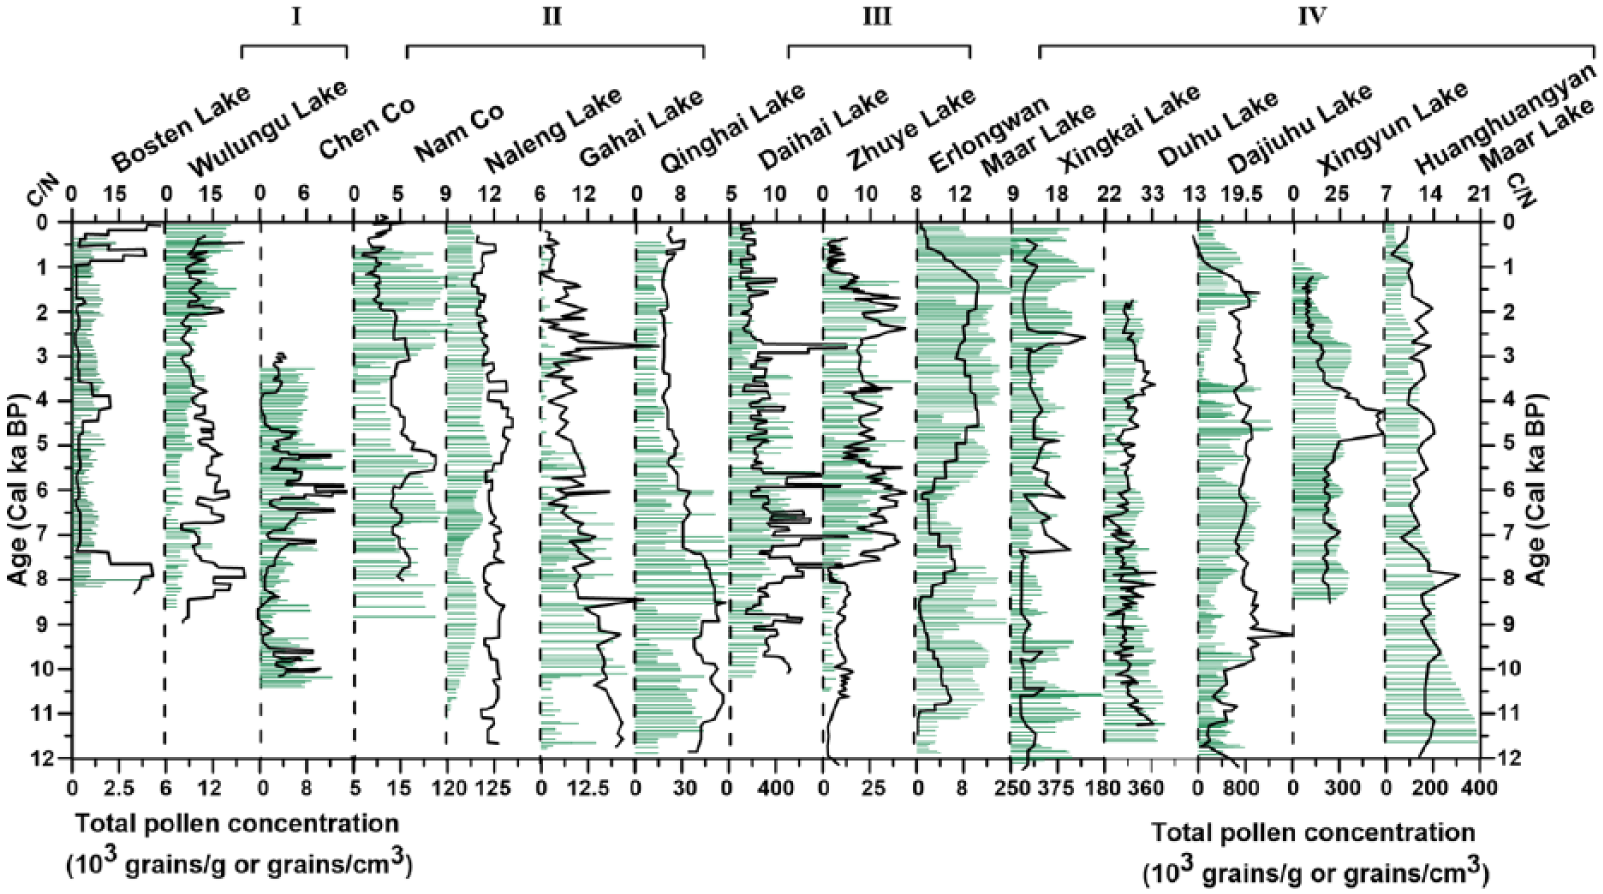
Relationship between total pollen concentration (103 grains/g or grains/cm3) and carbon nitrogen ratio (C/N). Green bars indicate pollen concentration and black curves show C/N.
Relationship between total pollen concentration (103 grains/g or grains/cm3) and organic carbon isotope (δ13C, ‰). Blue bars indicate pollen concentration and black curves show δ13C.
Information on fossil pollen records in representative pollen indicators from China.

PI: pre-industrial.
Significance of the environmental proxies
Pollen grains get washed or blown into lakes and then accumulate in sediments, proving a record of past vegetation. Different types of pollen in lake sediments reflect vegetation around the lake and climate conditions that are favorable for the vegetation (Heuer and Overpeck, 2003). In this paper, Artemisia (%), Chenopodiaceae (%), Pinus (%), Betula (%), Quercus (%), Cyperaceae (%), trees (%), herbs (%), and A/C were selected as representative pollen indicators. They were chosen to be included here not only because they contained topical pollen of the four geographical regions but also because their paleoclimate significance was relatively clear. The pollen spectra dominated by tree species such as Pinus, Betula, and Quercus indicates large-scale forests are developed, while the relatively higher percentage of herbaceous species such as Artemisia, Chenopodiaceae, and Cyperaceae means grassland vegetation cover. Pinus is a less significant environmental indicator owing to its ease of transport over long distances, and Betula grows in the transition zone from brushland to steppes (Li et al., 1985). They both require certain water conditions but are relatively tolerant of lower temperature as inferred from their altitudinal ranges. The genus Quercus is one of the most important tree genera in temperate and subtropical areas of the Northern Hemisphere, indicating a warm and humid environment (Dowsett et al., 1994). Artemisia and Chenopodiaceae are both representative taxa of altitudinal desert zones, but Artemisia generally lives in a more humid environment and Chenopodiaceae is widespread during dry periods. Moreover, in the Artemisia and Chenopodiaceae dominated regions (at least more than half of the pollen sum), A/C can indicate vegetation ecology that suggests desert vegetation when it is <0.5, desert-steppe vegetation when it is 0.5–1.0, and steppe vegetation when it is >1.0 (Jiang et al., 2007; Sun et al., 1994). The family Cyperaceae is meadow vegetation belonging to herbaceous species and mainly grows in a humid environment (Gignac et al., 2004).
Organic matter in soils and sediments, containing a large variety of organic materials including organic geochemical proxies, is widely distributed over the earth’s surface occurring in almost all terrestrial and aquatic environments (Schnitzer, 1978). The TOC content of lake sediments that originally derived from terrestrial and lake sources can indicate primary productivity around (Balascio et al., 2013; Plewa et al., 2006). The C/N ratio can imply the relative amounts of autochthonous aquatic plants versus the allochthonous terrestrial organic matter during the sedimentary period (Wagner et al., 2000). C/N less than 10 indicates that organic matter mainly derives from lacustrine algae, whereas C/N between 14 and 23 indicates terrestrial organic matter sources (Meyers, 1994, 1997; Meyers and Ishiwatari, 2008; Meyers and Vergés, 1999). The origin of organic matter can be inferred relatively from stable carbon isotopic composition of lake sediments. In terms of the difference in photosynthetic reactions, the land plants are divided into C3, C4, and Crassulacean Acid Metabolism (CAM) plants with the ranges of δ13C value between −34‰ to −23‰, −22‰ to −6‰, and −20‰ to −10‰, respectively (O’Leary, 1988; Tieszen and Boutton, 1989; Zhang et al., 2004). Likewise, the ranges of δ13C value in lake aquatic plants are various: −12‰ to −20‰ in submerged plant, −24.00‰ to −30.00‰ in emergent aquatic plant, and δ13C value can even reach −35.50‰ in floating plant (Bowen, 1991).
The lake-level fluctuation, resulting from fossil shoreline deposits, sedimentary facies, fossils, and other features indicative of past lake levels, is a highly sensitive indicator for hydrological climate (Herzschuh, 2006; Kleinherenbrink et al., 2014; Li and Morrill, 2010). This paper considered multi-proxies from different profiles for an individual lake in original publications or extracted directly from publications as one record. For instance, a high lake-level period would be assigned to an interval with fine-grained sediments, low carbonate content, high magnetic susceptibility, or abundant planktonic diatoms. Lake-level changes in China at three periods, the early (12–8 ka), the mid- (8–4 ka), and the late-Holocene (4–0 ka), were reconstructed and compared (Table 2) in this paper. The justification for temporal and spatial evolution of lake level was that each individual lake might be different from other lakes on account of different forcing factors, geographic locations, and sedimentary indicators (Chen et al., 2008).
Lake-level simulations
A series of models, the CCSM 3.0, a lake energy-balance, and a lake water-balance model, was used to simulate millennial-scale variations in lake level and examine the reasons for lake-level changes in China between the early (8.5 ka), mid- (6.0 ka), and late-Holocene (ca. 1800 AD) (Li and Morrill, 2010).
CCSM 3.0 is a state-of-the-art coupled climate model consisted by four component models of the ocean, sea ice, atmosphere, and land that are coupled without flux corrections. The horizontal resolution of the ocean and sea ice models is nominally 1°C, while that of the atmosphere and land models is 2.8°C. Furthermore, there are 40 vertical levels in the ocean model, 26 vertical levels in the atmosphere model, as well as 10 subsurface soil layers in the land model. Three simulations were completed, for 8.5 ka, 6.0 ka, and a pre-industrial (PI) conditions (Figure 6). The 8.5 ka was chose as an early Holocene timeslice because it could represent environmental conditions that were not influenced by the 8.2 ka cooling event. The 6.0 ka timeslice was widely used as a representative period of the mid-Holocene, and the PI was considered as the typical period of the late-Holocene because of relatively less human interference. Table 4 shows the boundary conditions of orbital forcing (Berger, 1978), atmospheric trace gases (Flückiger et al., 1999, 2002; Monnin et al., 2004), continental ice sheets, and vegetation (Peltier, 2004) for each simulation (Li and Morrill, 2010).
Boundary conditions used for CCSM 3 model experiments at 8.5 ka, 6 ka, and PI.

CCSM: Community Climate System Model; PI: pre-industrial.
We conducted lake evaporation calculations using a lake energy-balance model that is based on the model of Hostetler and Bartlein (1990). In this model, the depth of the lake was assumed as 1 m, since the experiments increasing lake depth to 5 and 10 m and increasing lake salinity to 10 ppt show only small changes in lake evaporation. Meanwhile, the vertical level of lake water is not mixed and the surface energy balance for the lake is controlled by water surface evaporation (Li and Morrill, 2010). The equation is as follows:
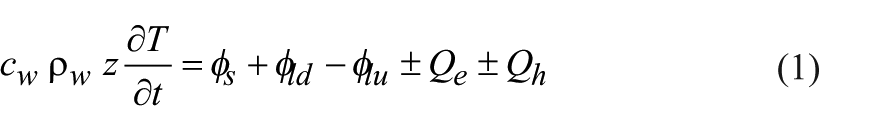
where cw, ρw, z, and T represent specific heat of water (J kg−1 K−1), water density (kg m−3), lake depth (m), and lake surface temperature (K), respectively. T is the time, φs and φld are shortwave and longwave radiation absorbed by water, φlu is longwave radiation emitted by lake, Qe represents latent heat fluxes, and Qh represents sensible heat fluxes.
This paper assumed that each grid cell of the CCSM 3.0 model is a single individual that is in hydrological equilibrium with steady-state conditions of climate, and the lake water-balance equation:

where V is discharge from the lake (m3/yr), AB and AL are watershed area (m2) and lake area (m2), R is watershed runoff (m/yr), PL is on-lake precipitation (m/yr), and EL is lake evaporation (m/yr). However, AB and AL are difficult to obtain for a hypothetical lake, so Eq. 2 is simplified as follows:
Results
Organic geochemical proxies and pollen records
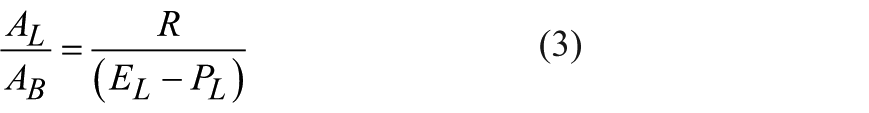
Since sediment accumulation rate, physical and geographical conditions, and paleoclimate significance of the proxies vary according to the location, numerical relationships between organic geochemical proxies and total pollen concentration have been difficult to achieve. However, we can depict their correlation based on the changing trends of the proxies. The ‘+’ indicates a similar trend between total pollen concentration and geochemical proxies; the ‘−’ indicates an opposite trend, and the ‘*’ indicates that there is no obvious correlation between them, which can be clearly observed in the Figures 2–4 (Table 2). According to the relationship between organic geochemical proxies and total pollen concentration from 22 lakes, the study region can be divided into arid and semi-arid area of northwest China (I), the Qinghai-Tibet Plateau (II), the monsoon marginal zones (III), and the monsoonal regions (IV) (Figure 5). In arid and semi-arid of northwest China, Bosten Lake, Wulungu Lake, and Balikun Lake have similar characteristics that organic geochemical proxies and pollen concentration show opposite trends. Lakes in this region are typically discharged by glacial-melt water; thus, the strong basin-wide hydrodynamic conditions usually correspond to the abundant exogenous fluxes. Inversely, the pollen is relatively vulnerable under these conditions, so that total pollen concentration shows negative correlations with organic geochemical proxies in arid and semi-arid of northwest China. The Qinghai-Tibet plateau can be divided into a northwest and a southeast part. Bangong Co, Zigetang Co, and Gahai Lake in the northwest plateau show totally different variation trends of organic geochemical proxies and total pollen concentration owing to the low biomass compared with other parts of the plateau. In this case, TOC and C/N in lake sediments cannot accurately respond to Holocene millennial-scale climate changes, and pollen records are more effective in showing vegetation variations. However, there are positive correlations between organic geochemical proxies and pollen concentration in lake sediments of Nam Co, Chen Co, and Naleng Lake from the southeast plateau. Qinghai Lake, Daihai Lake, Hulun Lake, and Zhuye Lake belong to the monsoon marginal zones, where vegetation is dominated by drought-tolerant plants (C3 plants with heavy δ13C values) (Herzschuh, 2006; Kleinherenbrink et al., 2014; Li and Morrill, 2010). Thus, high primary productivity in those regions is usually linked to the relatively high TOC, C/N values, high total pollen concentration, and low δ13C values. As a result, lacustrine TOC, C/N, and total pollen concentration indicate similar changing trends during the Holocene, and δ13C shows an opposite trend with total pollen concentration in the monsoon marginal zones. Exceptionally, Qinghai Lake with an attitude of 3200 m shows a positive correlation between δ13C and pollen concentration, which can be attributed to altitude effects of the plant δ13C (Li et al., 1999). In the monsoonal regions, pyrophilous C4 plants with light δ13C values show a high proportion in warm-humid climates, whereas during arid periods, C4 plants almost disappear and are replaced by frigostable C3 plants. Therefore, Erhai Lake, Lugu Lake, Poyang Lake, Xingyun Lake, and Huguangyan Maar Lake in those regions are characterized by similar changing trends of organic geochemical proxies and total pollen concentration. Nevertheless, there are some exceptions presenting inverse correlations between δ13C and pollen concentration. Located in the relatively high latitude, the negative relationship in Erlongwan Maar Lake and Xingkai Lake is mainly related with various forcing factors of plants δ13C in different latitude (Zhou et al., 2013). As for Dahu Lake and Dajiu Lake situated in the humid region of China, this is closely associated with high water stands and diluted water.
Spatial distribution of relationship between total pollen concentration and organic geochemical proxies: (a) TOC, (b) C/N, and (c) δ13C.
Lake-level records and simulations
Figure 6 indicates the millennial-scale variations in lake-level based on the CCSM 3.0, a lake energy-balance as well as a lake water-balance model, and the simulated results show that lake-level varies by regions and through time. In monsoonal regions and the monsoon marginal area, lake levels begin to rise from the early Holocene, then decrease around the mid-Holocene ca. 6 cal. ka BP, and in the late-Holocene, lake level reaches its lowest level (Figure 6a). This general trend in the evolution of lake level is in accordance with most lake records from the two regions. In arid and semi-arid of northwest China, the models show low lake level at 8.5 ka relative to 6.0 ka and PI, and high lake level at 6.0 ka relative to PI (Figure 6b), which is also in line with the three lake-level records in the area. Lakes in the Qinghai-Tibet Plateau reach their highest lake level during the early Holocene, and fall to their lowest level in the late-Holocene, agreeing with most of lake-level records, but Zigetang Co and Gahai Lake show different patterns with high lake-level at PI relative to 6 ka.
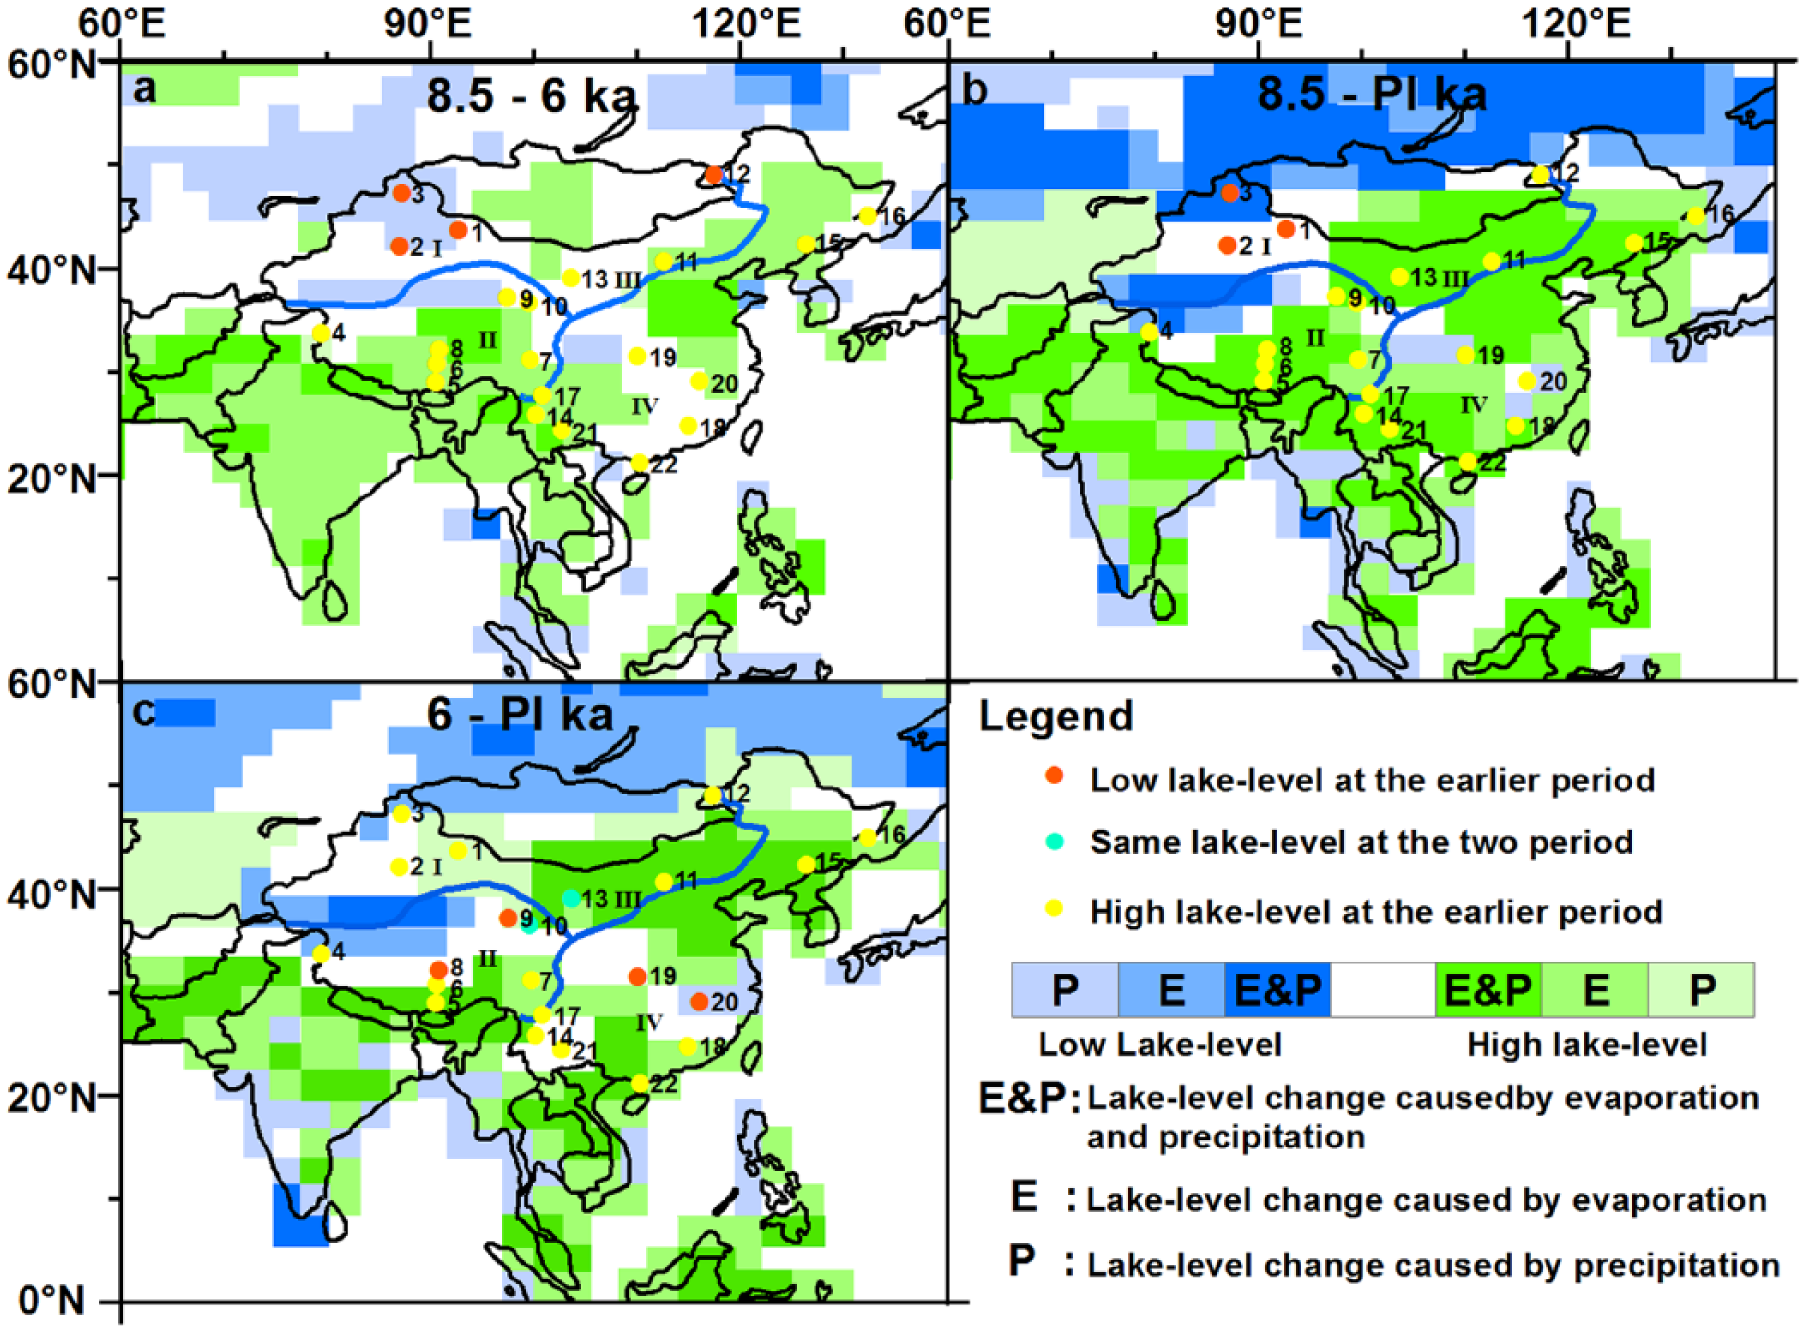
Simulated lake-level changes for (a) 8.5 ka minus 6.0 ka, (b) a 8.5 ka minus PI, and (c)6.0 ka minus PI based on the CCSM 3.0, the lake energy-balance, and the lake water-balance model.
The lake simulations also show the reasons for lake-level changes in China between the early (8.5 ka), mid- (6.0 ka), and late-Holocene (ca. 1800 AD). In the monsoonal regions, the monsoon marginal zones, as well as the southeast Qinghai-Tibet Plateau, the decrease in lake level during the Holocene is generally related to the combined effects of decreasing precipitation and increasing lake evaporation. In the northwest plateau, the main factor driving lake-level rise from 8.5 to 6 ka is the increased precipitation at 6 ka; then precipitation decrease and lake evaporation increase cause the high lake level at 6 ka relative to PI. Lake-level changes in arid and semi-arid of northwest China through the Holocene are only associated with precipitation, the increase in precipitation from early to mid-Holocene, and the decrease in precipitation from mid- to late-Holocene give rise to the high lake-level at the mid-Holocene.
Discussion
As widely used paleoenvironment indicators, organic geochemical proxies and pollen records indicate different aspects of vegetation changes according to conventional interpretation (Bowen, 1991; Krishnamurthy et al., 1986; Li et al., 2009b; Stuiver et al., 1975; Tian et al., 2008; Xiao et al., 2004). Organic geochemical and proxies generally imply the overall conditions of the paleoecosystem, whereas pollen records are used for the detailed description of paleovegetation changes (Bowen et al., 1991; Krishnamurthy et al., 1986; Li et al., 2009; Stuiver et al., 1975; Tian et al., 2008; Xiao et al., 2004). Accordingly, we chose the two indicators to reconstruct the millennial-scale variations in vegetation. Our synthesis showed that vegetation and lake hydrology of China did not show synchronous and coherent changes during the Holocene in each climate zone, but both of them showed relatively strong temporal and spatial variability in various geographical regions.
Arid and semi-arid of northwest China
Based on our analysis and synthesis of the organic geochemical indicators and pollen records of Balikun Lake, Bosten Lake, and Wulungu Lake, we reconstructed the Holocene vegetation history in arid and semi-arid of northwest China. The records suggested that during the early Holocene, sediments were characterized by low TOC, C/N, and δ13C; low total pollen concentration; and low A/C value, indicating the climate was arid. Meanwhile, pollen assemblages dominated by Chenopodiaceae showed that the lake basins were covered by dry steppe. Sediments that deposited during the middle Holocene were represented by rapid increases of organic geochemical proxies and total pollen concentration. Pollen assemblages also changed significantly in this period, and the increase in Artemisia and A/C ratios implied the environment became slightly more humid and the regional vegetation was desert-steppe (Figure 7). In the late-Holocene, organic geochemical proxies and total pollen concentration were still high but the A/C ratios descended, suggesting a decreasing effective moisture trend but the regional vegetation was still desert-steppe. Millennial-scale variations in lake-level can directly reflect the long-term changes in lake hydrological status according to the previous studies (Chen et al., 2008; Herzschuh, 2006; Kleinherenbrink et al., 2014). Therefore, the optimal lake hydrological conditions in arid and semi-arid northwest China occurred in the mid-Holocene, and lake hydrological status in the late-Holocene was better than the early Holocene (Figure 8).
Vegetation evolution in China during the Holocene. Green points indicate that optimal vegetation cover occurred in the early Holocene. Red points reflect that large-scale vegetation cover was presented during the mid-Holocene.
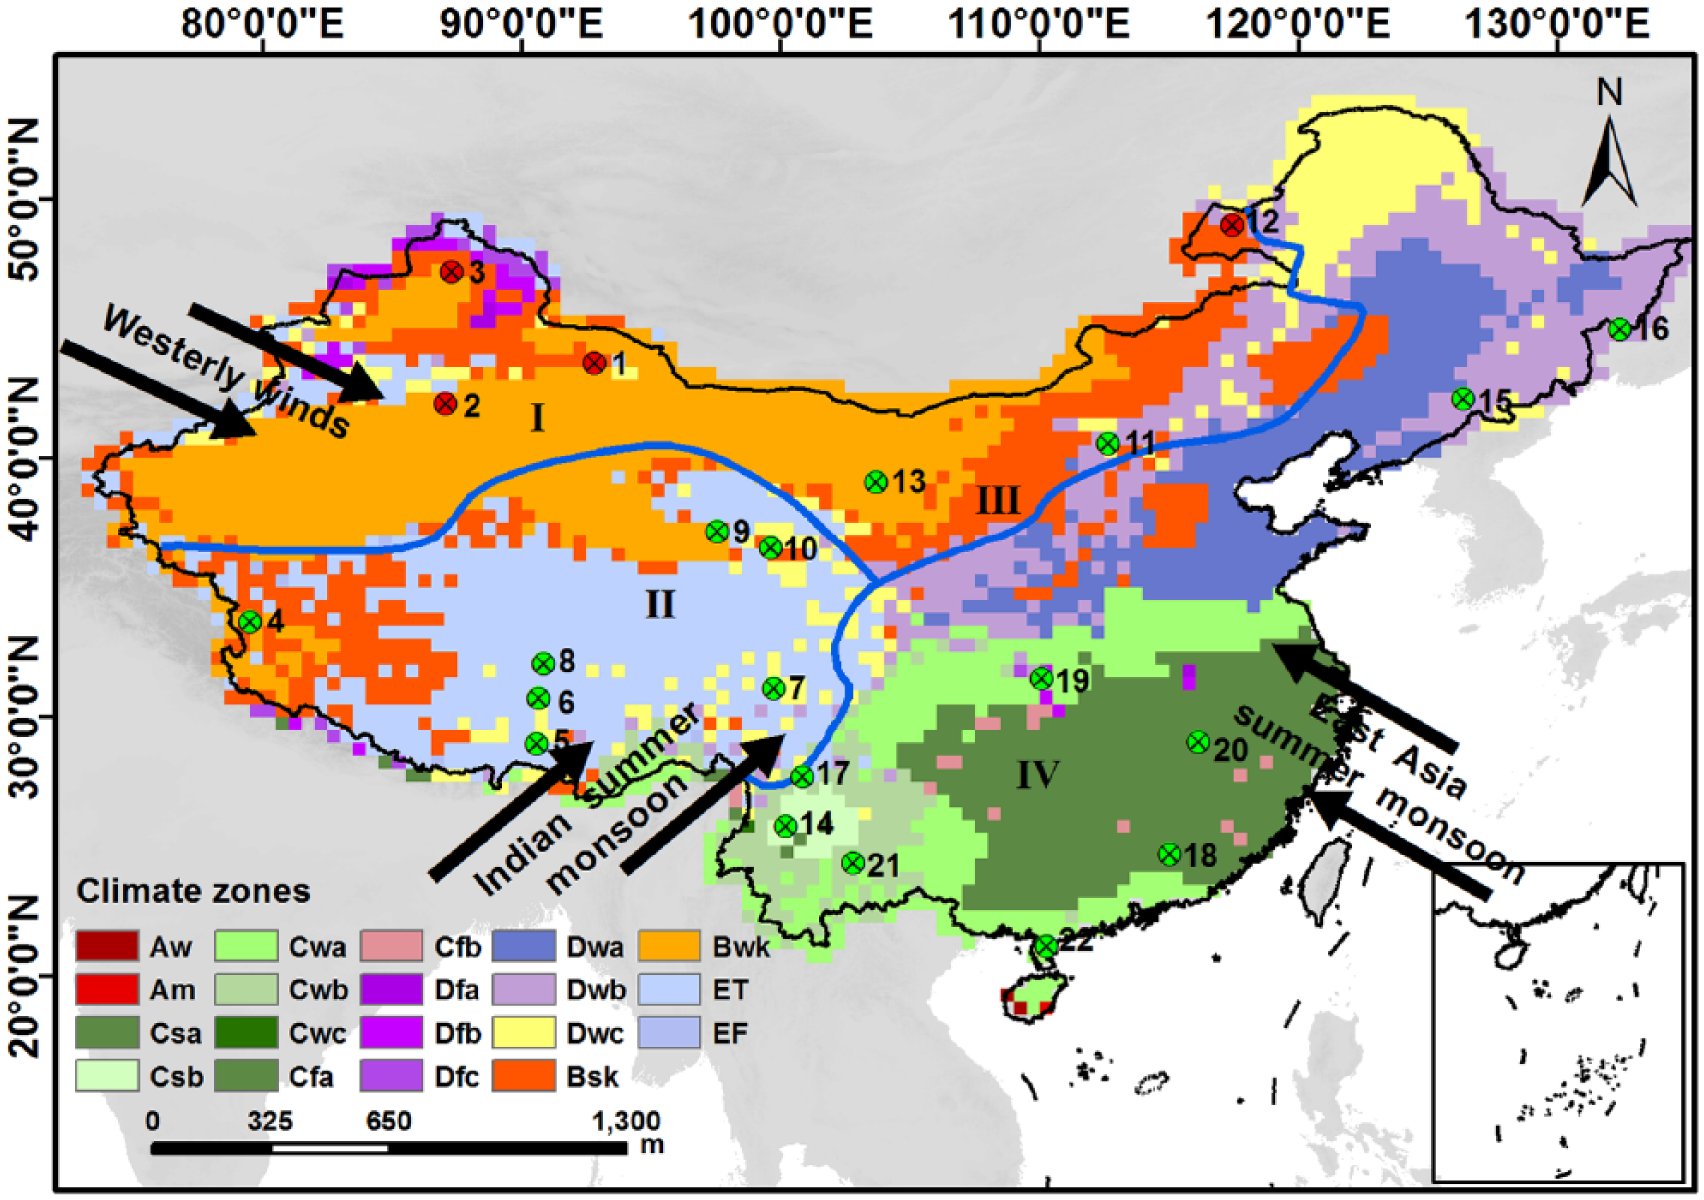
Millennial-scale variations in lake hydrological status from China during the Holocene. Green points indicate that lakes experienced optimal lake hydrological status in the early Holocene. Red points show that favorable water status was prevailed in the middle Holocene.
In arid and semi-arid of northwest China, vegetation and lake hydrological status are strongly influenced by precipitation. Poor hydrological status and low vegetation coverage during the early Holocene in this region were closely related to the weakened mid-latitude Westerlies at the winter-spring season and the reduction in westward propagation of water vapor from the Mediterranean, Black Sea, and North Atlantic (Chen et al., 2008; Jin et al., 2011; Li and Morrill, 2010; Liu and Li, 2016; Shen, 2013). At the same time, large-scale ice sheets at high latitude and meltwater discharges modulated and reduced air and sea-surface temperature also causing decrease in vapor transport of the Westerlies (Chen et al., 2008). Another explanation might be the regional difference in the uplift and descent of air masses (Chen et al., 2008; Herzschuh, 2006; Shen, 2013). Strong insolation in summer at low latitudes caused a strong uplift motion of air mass forming a low pressure cell, which led to a large-scale convergence of the Asia summer monsoon in the lower troposphere, resulting in the intensified subsidence of air masses to the Tibetan Plateau and inevitably dry climate in arid and semi-arid areas (Broccoli and Manabe, 1992; Chen et al., 2008; Herzschuh, 2006; Rodwell and Hoskins, 1996; Ye and Gao, 1979). From the mid- to late-Holocene, the increase in high-altitude air and the sea-surface temperatures caused by the reduced ice sheets might induce more vapor from the boreal winter sea to be transported to the Chinese northwest region (Chen et al., 2008; Numaguti, 1999). Furthermore, high air temperatures in the mid-Holocene would be expected to increase cyclonic activity and synoptic disturbances along the Westerlies, bringing more convective precipitation (Chen et al., 2008). Consequently, vegetation and lake hydrological status experienced synchronous changes during the Holocene in arid and semi-arid of northwest China, indicating a dry early Holocene, a warm and humid mid-Holocene, and a moderately wet and cold late-Holocene. This Holocene climate history appears to be similar to the pattern of the previous environment reconstructions (Boomer et al., 2000; Chen et al., 2008; Jin et al., 2011; Li and Morrill, 2010; Liu and Li, 2016; Shen, 2013; Zhang et al., 2016).
The Qinghai-Tibet Plateau
The Qinghai-Tibet Plateau, with an average elevation of more than 4000 m a.s.l., plays an important role in determining regional weather and climate patterns in East and South Asia (Herzschuh et al., 2006). In the southeast plateau, organic geochemical proxies and total pollen concentration had similar changing trends during the Holocene. Low TOC, C/N, δ13C, and total pollen concentration in the early Holocene implied lower production of terrestrial plants and aquatic plankton under cold conditions, and all types of pollen indicated the presence of alpine meadows in this period. As suggested by high TOC and total pollen concentration, the environment in the mid-Holocene turned warm and wet; meanwhile, the vegetation was transformed to the coniferous mixed forest (Figure 7). During the late-Holocene, lower organic geochemical proxies indicated that the temperature decrease caused the re-expansion of alpine meadows. Vegetation reconstructions in the northwest plateau suggested a dominance of desert-steppe vegetation during the early and late-Holocene, and alpine steppes with desert elements tended to dominate the mid-Holocene. On the other hand, lake-level records suggested that most lakes on the Qinghai-Tibet Plateau experienced favorable hydrological status in the early Holocene, suboptimal hydrological conditions at the mid-Holocene, and poor hydrological status during the late-Holocene (Figure 8).
In the Qinghai-Tibet Plateau, temperature is the main limiting factor for vegetation growth, while lake water status relates to precipitation and evaporation. According to sedimentary records from the plateau, temperature variations have undergone three stages: a temperature increase in the early Holocene, peak temperature in the mid-Holocene, and a temperature decrease in the late-Holocene (Shen, 2013; Zhou and Shen, 2007). Therefore, most lakes of the Plateau were characterized by flourishing vegetation in the mid-Holocene (Herzschuh et al., 2010). Paleoclimate studies of the late-Quaternary monsoon history derived from the compiled records revealed that the Indian summer monsoon and East Asia summer monsoon were both highly sensitive to millennial-scale variations in insolation (Agnihotri et al., 2002; Herzschuh, 2006; Leuschner and Sirocko, 2003). Strong summer insolation in the Northern Hemisphere during the early Holocene (Berger and Loutre, 1991) strengthened the Asian monsoon and brought considerable precipitation (Krause and Whitlock, 2013). Meanwhile, enhanced cloud cover blocked a greater fraction of insolation, reducing surface shortwave radiation and surface temperatures and giving rise to the favorable hydrological condition in the early Holocene (Li and Morrill, 2010). On the other hand, rapid glacial melting at the onset of Holocene also contributed to the abrupt increases in lake levels during the early Holocene. In the mid-Holocene, despite the higher air temperature, the increased rainfall could not compensate for the decreased glacial-melt-waters owing to glacial retreat, so lake level began to descend since the mid-Holocene (Li and Morrill, 2010; Shen, 2013). However, because Zigetang Co and Gahai Lake were situated in the northwest plateau where the east Asian summer monsoon had significantly retreated southeastward since the mid-Holocene and then the climate there was mainly dominated by mid-latitude westerly winds, the two lakes showed better hydrological status in the late-Holocene relative to the mid-Holocene (Agnihotri et al., 2002; Leuschner and Sirocko, 2003; Shen, 2013).
Monsoon marginal zones
The Holocene vegetation and hydrologic changes of the monsoon marginal zones were reconstructed based on the analysis of organic geochemical proxies and pollen records derived from Qinghai Lake, Daihai Lake, Hulun Lake, and Zhuye Lake. In the early Holocene, pollen assemblages showed that arid steppe dominated the regions in company with patches of pine forests indicating a relatively arid environment. During the mid-Holocene, the optimal environment prevailed there characterized by the notably increased TOC, C/N, and pollen concentration; heavy δ13C; as well as intensive mixed pine and broadleaved forests (Figure 7). In the late-Holocene, the forests disappeared and the vegetation density decreased. On the contrary, lake hydrological status reflected by lake-level records indicated optimal water status occurred in the early Holocene, and lake hydrological status in the mid-Holocene was better than in the late-Holocene (Figure 8).
Monsoon marginal zones are located in the interaction between the Asian summer monsoon and the westerly winds, where moisture and temperature conditions are both the vital limiting factors for plant growth, and lake-level changes in those regions are strongly affected by precipitation and evaporation. In the early Holocene, increased summer insolation strengthened the Asian monsoon and brought considerable precipitation (Agnihotri et al., 2002; Chen et al., 2008; Herzschuh, 2006; Leuschner and Sirocko, 2003; Shen, 2013). Simultaneously, enhanced cloud cover blocked reduced surface shortwave radiation and surface temperatures (Li and Morrill, 2010), resulting in the optimal hydrological status prevailing at this stage. During the mid-Holocene thermal optimum, the intensity of precipitation was still strong, so flourishing vegetation in the monsoon marginal zones was indicated. In addition, the increasing trends of lake hydrological status in Qinghai Lake and Zhuye Lake during the late-Holocene might associate with the enhancing westerly flow (Agnihotri et al., 2002; Leuschner and Sirocko, 2003; Qian et al., 2009; Shen, 2013). Poor lake hydrological conditions in Hulun Lake during the early Holocene were largely caused by remnant large ice sheets at high latitudes (Chen et al., 2008; Ruddiman, 2006) and simultaneously prevailing dry conditions in the area adjacent to the north (Wang and Ji, 1995).
Monsoonal regions
The organic geochemical indicators and pollen records from lakes spanning the Holocene revealed a detailed history of vegetation over the monsoonal regions. In the early Holocene, pine forest dominated the regions in company with patches of herbs and shrubs, suggesting a wet and cold climatic condition. During the mid-Holocene, evergreen broadleaved forest appeared to have extended over much of the lower latitude, and the higher latitude was dominated by the deciduous broadleaved forest. The late-Holocene was characterized by a decline in broadleaved and then pine forest expanding again. However, on account of increased frequency and intensity of El Nino events (Riedinger et al., 2002; Wang et al., 2007; Xiao et al., 2007) and northward movement of the Inter-Tropical Convergence Zone (Fleitmann et al., 2003; Hastenrath and Greischar, 1993; Wang et al., 2007) in the mid-Holocene, Dahu Lake and Huguangyan Maar Lake showed different vegetation evolution patterns with sparse vegetation coverage. The lake hydrological status of the monsoonal regions showed similar pattern with the monsoon marginal zones on millennial scale, indicating optimal water status in the early Holocene (Figure 8).
The monsoonal regions of eastern China are directly affected by the Asian monsoon. Vegetation conditions are largely related to precipitation and temperature (An et al., 2000), whereas lake hydrological status is mainly controlled by precipitation and evaporation. Paleoclimate studies on lake sediments indicated a strong intensification of both the Indian and the East Asian summer monsoon at the early Holocene (Agnihotri et al., 2002; Chen et al., 2008; Herzschuh, 2006; Leuschner and Sirocko, 2003; Shen, 2013), resulting in considerable precipitation and less lake surface evaporation (lake evaporation). Therefore, favorable hydrological status occurred at the early Holocene in the monsoonal regions. During the mid-Holocene, with the increase in temperature, the intensity of precipitation was still strong as a result of the relatively weak East Asian summer monsoon in lower latitude and a significant enhancement of East winter Asian monsoon in the higher latitude; thus, optimal vegetation cover was occurred at this stage (Li et al., 2017). However, some proxy data from lake sediments in previous studies showed different patterns in lake hydrological status and vegetation changes with our reconstructions during the Holocene. In their review, An et al. (2000) pointed out that the Holocene optimum of the East Asian monsoon was different among various monsoonal regions. Herzschuh (2006) proposed that optimal climate conditions were asynchronous between the Indian summer monsoon and South-East Asian monsoon regions. However, recent observational analysis and modeling studies do not appear to support those hypotheses because of the coarse-resolution (Chen et al., 2008; Feng et al., 2006; Li and Morrill, 2010).
Recent observational analysis suggested monsoon rainfall increased dramatically in southern China, but drought conditions prevailed in northern China over the past several decades (Li and Xu, 2016; Li et al., 2012). Indeed, extreme weather events such as floods, droughts, precipitation, and large storms are likely to become more frequent and more intense (Boukabara et al., 2007; Hansen et al., 2014; Kreyling et al., 2008). Meanwhile, ecological damage is another serious environmental problem (Gimpelhinteregger, 2008). The evolution of Holocene vegetation and lake hydrological status across China suggests that the mid-Holocene thermal optimal is related to the low-latitude summer insolation changes, which is different from current global warming. Therefore, our research regarding the millennial-scale vegetation and hydrological status changes has important scientific significance.
Conclusion
This paper provides a comprehensive review of temporal and spatial evolution of the Holocene vegetation and lake hydrological status from China based on the numerical climate classification, lake-level simulations, pollen records, organic geochemical proxies, as well as paleoenvironmental indicators from various Köppen climate zones and different geographical regions of China. The results showed that vegetation and lake hydrology of China did not show synchronous and coherent changes during the Holocene in each climate zone, while both of them showed relatively strong temporal and spatial variability in various geographical regions. Overall large-scale vegetation cover in China was observed during the mid-Holocene, whereas the Holocene hydrological optimum was asynchronous in China, for example, the mid-Holocene in northwestern China, and the early Holocene in the Qinghai-Tibet Plateau, the monsoon marginal zones, and the monsoonal regions. The out-of-phase pattern of Holocene vegetation and lake hydrological status were closely related to different forcing factors in various regions. Lake hydrological status in arid and semi-arid of northeast China was strongly influenced by precipitation, whereas in other regions of China, there was a combined influence of evaporation and precipitation. Likewise, the limiting factor of vegetation growth was various, for example, moisture in northwestern China, temperature in the Qinghai-Tibet Plateau, as well as moisture and temperature in the monsoon marginal zones and monsoonal regions.
Footnotes
Funding
This work was supported by the National Natural Science Foundation of China (Grant No. 41571178 and 41371009) and the Fundamental Research Funds for the Central Universities (Grant No. lzujbky-2015-143).