
Abstract
The Pecos River provides an important source of water for New Mexico and Texas, US, and Mexico. Severe and prolonged drought combined with increasing temperatures during the early 21st century boosted attention on water resources and allocation management in the American West. We provide a tree-ring-based streamflow reconstruction for the Pecos River for the period 1310–2013 CE for the overarching purpose of placing the current Pecos River streamflow declines in a multi-century context. Over the past ca. 700 years, dry events (n = 93) that lasted at least 2 years were more common than wet events (n = 76), wherein flow was below/above the instrumental mean (61.6 m3 s−1). Although more prolonged droughts occurred during the 15th and 18th centuries, the gage record (1930–2013 CE) captures the full range and variability of flow extremes within the context of the past 700 years. The 11-year drought of 1772–1782 was the highest ranked based on magnitude + intensity below the instrumental mean, slightly edging out the 1415–1425 and 1950–1957 events. The driest events that have occurred from the 14th through the 20th centuries are challenged by flow conditions since the turn of the 21st century. The 2000–2006 and 2011–2013 dry periods ranked 6th and 13th, respectively, though the intensity (−40 m3 s−1 yr−1) of the 2011–2013 event exceeded all higher ranked droughts. The lowest single water-year flow in the reconstruction was shared by years 1904 and 2002, during which the flow of the Pecos River was estimated at 8.1 m3 s−1. Other extreme low-flow years were 1685 (9.5 m3 s−1) and 1579 (9.8 m3 s−1), but are eclipsed by 1904 and 2002 when considering the lower bounds of bootstrapped confidence limits of the reconstruction. Increased flow variability combined with projected increased temperatures and decreased precipitation will likely present new challenges to water resource managers, especially given impending anthropogenic climate change.
Introduction
The Pecos River and associated tributaries and reservoirs provide critical water resources for the semi-arid and arid landscapes of the Trans-Pecos Region in eastern New Mexico and western Texas. Yet, the future outlook for water resources in the Pecos River Basin (PRB) is dire. Historically, the Pecos River was an important water source to settlers for crop irrigation and maintaining livestock. Today, flow regulations, increased population, and agricultural irrigation have substantially reduced the streamflow in some areas. One such area is in the middle reaches of the PRB, where groundwater developments near the towns of Roswell and Carlsbad have exacerbated low-flow conditions along with climate change and non-native phreatophytes, such as the highly successful invader saltcedar (Tamarix spp.). Saltcedar places further stress on water quality and quantity (Blackburn et al., 1982; Hart et al., 2005; Hays, 2003; Smith et al., 1998; Walker and Smith, 1997) and covers the banks of the Pecos for the majority of its 1500-km route from the headwaters in the Sangre de Cristo mountain range near Pecos, New Mexico to its confluence with the Rio Grande River near Del Rio, Texas. As the largest tributary for the Rio Grande River, Pecos River streamflow is important for uses downstream. However, information regarding the historical flow variability of the Pecos River is largely unknown.
Like many areas of the American West, severe and prolonged drought combined with increased temperatures during the early 21st century amplified attention on water resources and allocation management. During the period 2011–2013, drought conditions and severe evaporative losses caused a suspension of irrigation delivery in the lower PRB (Gregory et al., 2013; Hart et al., 2005). Drought proliferation over the past 15 years has led to some of the lowest annual flows seen in the basin since record keeping began in the 1920s (Figure 1a). In the middle PRB near Artesia, New Mexico, 25th percentile low flows were experienced in nine of the 15 years from 2000 to 2014 (<3.8 m3 s−1; 1937–2014). With the exception of the year 2010, the upper PRB near Anton Chico, New Mexico, experienced below-mean discharge during the period 2006–2014, with 2002, 2011, and 2013 registering the lowest discharge in the past 86 years (6.6, 10.4, and 10.4 m3 s−1, respectively; 1930–2014).
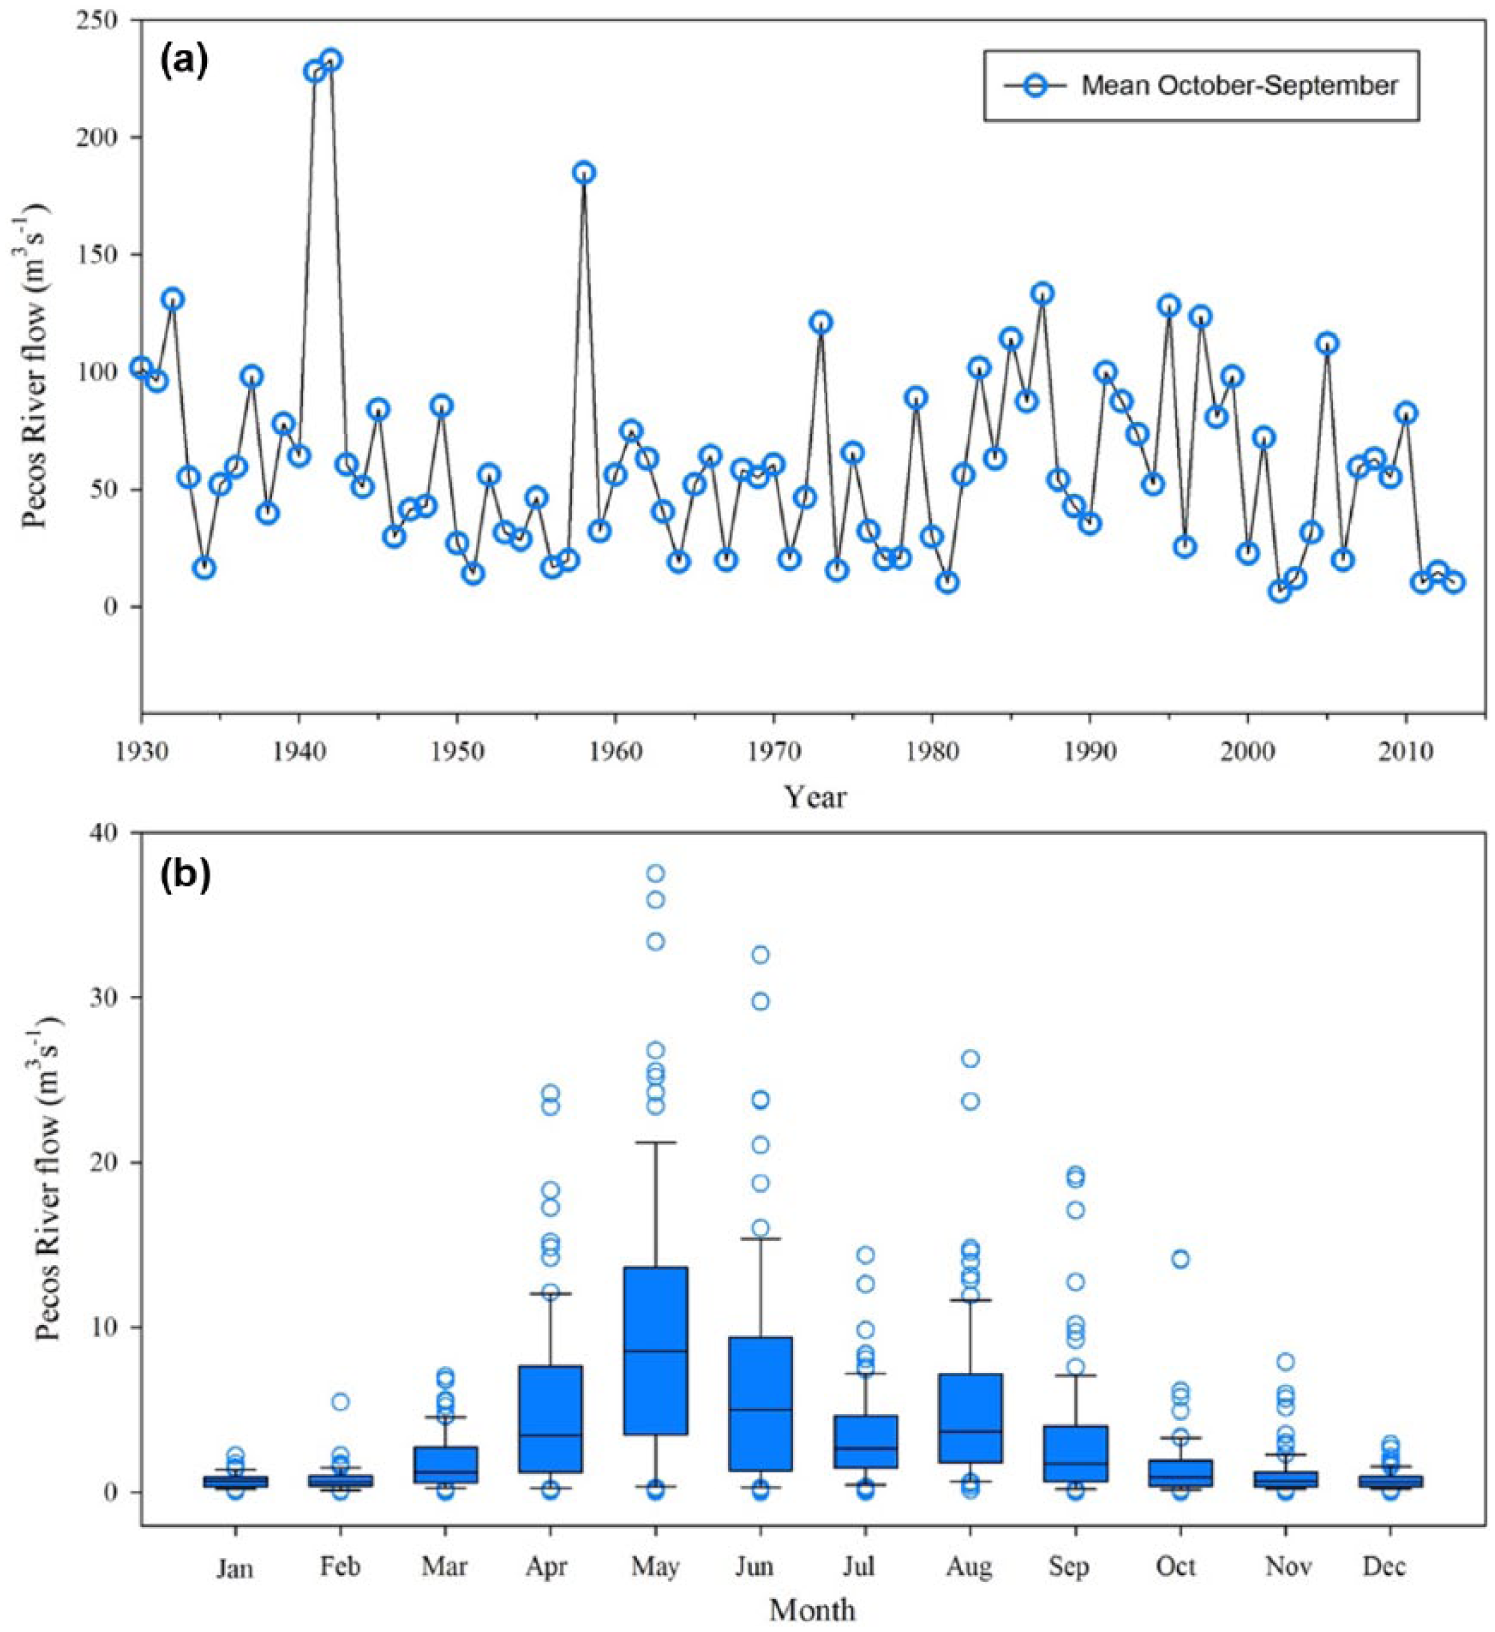
Pecos River (at Anton Chico, New Mexico) gage statistics showing (a) mean water year (October–September) (black) flow (m3 s−1) during the period 1930–2013 and (b) January–December monthly hydrograph for Anton Chico (1930–2013) shown as boxplots indicating mean, interquartile range, and outliers.
River discharge during 20th and 21st century drought and pluvial events provide flow extremes for municipal regulatory planning and allocation budgets. However, instrumental stream gage records are often short and lack characterization of the natural flow variability extending beyond the observational period. Tree rings provide a long-term perspective of flow variability at centennial to millennial time scales, especially in the moisture-starved American West (Margolis et al., 2011; Meko et al., 2007; Meko and Graybill, 1995; Stockton and Jacoby, 1976; Wise, 2010; Woodhouse et al., 2006). Tree rings can be used to reconstruct streamflow because both tree growth and river discharge respond to regional precipitation patterns. A steady decline in discharge over the past decade along with increased population, agricultural irrigation demands, and groundwater well developments make the Pecos River more susceptible to impending climate change and predicted future warming in the West (IPCC, 2014). In this paper, we provide the first streamflow reconstruction for the Pecos River using a network of existing, updated, and new tree-ring chronologies. Our objective is to place the short-term instrumental record of the Pecos River into historical context of the natural flow regime and assess the severity of droughts during the 20th and 21st centuries with regard to the past ca. 700 years.
Study area
As an important tributary for the Rio Grande River, the Pecos River drains 114,000 km2 of eastern New Mexico and western Texas (Figure 2). From its high-elevation headwaters in the Sangre de Cristo Mountains of northern New Mexico, the Pecos River flows 1500 km across grasslands, irrigated farmlands, deserts, and deep canyons before reaching the Amistad International Reservoir near Del Rio, Texas. The Pecos is a primary contributor to the Amistad International Reservoir, which is one of the largest reservoirs in the West supplying water to millions of people.
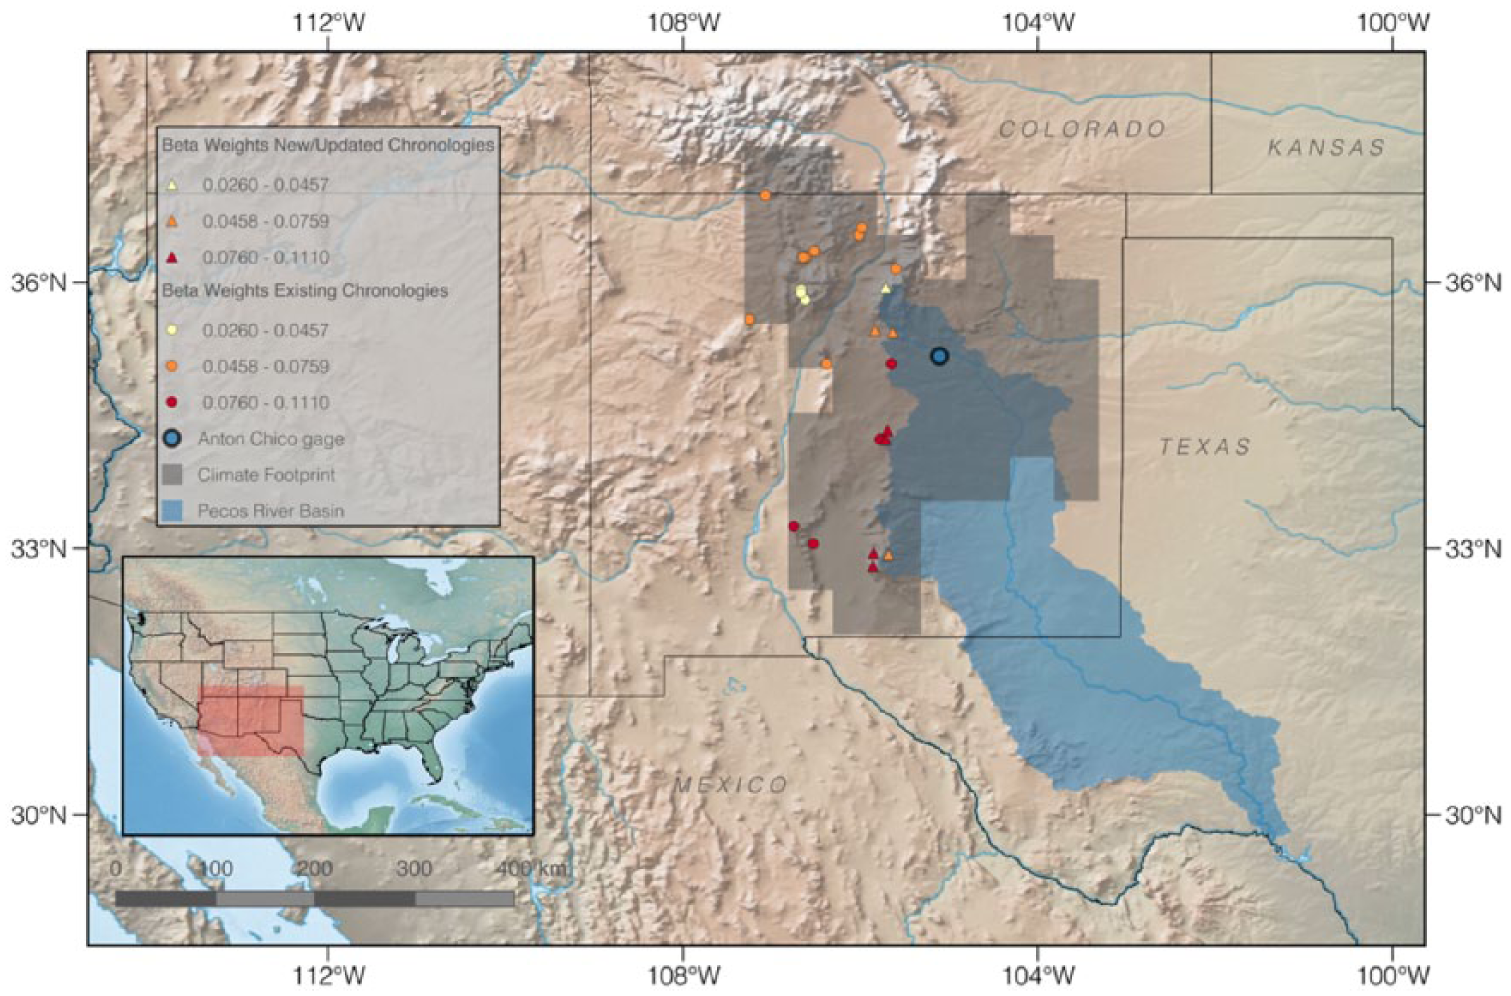
Map showing location of Anton Chico gage relative to the beta weights for each existing (circles) and new/updated (triangles) tree-ring predictor chronology used to reconstruct Pecos River streamflow 1310–2013 CE. Existing chronologies were acquired from the International Tree-Ring Data Bank. Site information for the new and updated chronologies can be found in Table 1.
Runoff in the Pecos headwaters is primarily from snowmelt, where annual peak flows occur from April to June. Discharge in the middle and lower basins becomes more limited and runoff is primarily from irrigation return sources. Aridity in the lower reaches of the basin increases, and seasonality of flow becomes more influenced by convective thunderstorms in late summer via the North American Monsoon (Figure 1b).
Despite being one of the largest (km2) basins in the state, the arid environment defined by much of southeastern New Mexico results in a mean water-year outflow contribution from 1985–2013 CE (73,819 AF) that falls behind the San Francisco (162,288 AF) and Gila (140,302 AF) Rivers, which all originate in the state. The two major through-flowing streams, Rio Grande and San Juan River, had mean annual outflow of 432,142 AF and 1,343,062 AF, respectively (Affinati and Myers, 2015).
Data and methods
Instrumental streamflow data
Instrumental Pecos River streamflow data (1930–2013) were collected for the Anton Chico, Guadalupe County, New Mexico gage for water year (October–September) from the United States Geological Survey (USGS) (Figure 2; 35.17867°N, 105.1088°W; USGS gage No. 08379500). We chose the Anton Chico gage because it offers one of the longest records of streamflow for the Pecos River and is located in the upper reaches of the watershed, upstream from major reservoirs and flow diversions (i.e. Santa Rose Lake, Lake Sumner, Bitter Lake, Brantley Lake, Lake Avalon, Red Bluff Reservoir, Amistad International Reservoir). We chose to reconstruct water-year flows so that results could be used by water planning authorities for management purposes. The gage is at 1564 m a.s.l. and the contributing drainage area is 2720 km2.
Tree-ring network
Tree-ring data for the reconstruction came from (1) existing collections from New Mexico on the International Tree-Ring Data Bank (ITRDB; https://www.ncdc.noaa.gov), (2) updated ITRDB chronologies, and (3) collections from new locations within and adjacent to the PRB. While some chronologies might be located outside of the PRB, chronologies located several hundred kilometers away from gage recording station can be significantly correlated with a streamflow because of regional climate patterns (Cook et al., 1999; Woodhouse and Lukas, 2006). Thus, to determine the best candidate pool of predictor chronologies, collections were screened based on their location relative to the moisture-sensitive footprint of the instrumental streamflow data (Figure 2; described in ‘Reconstruction Model’ section below).
A total of 48 ITRDB chronologies with the common period 1828–1975 from common American Southwest tree species (Pinus edulis Engelm., Pinus ponderosa Douglas ex C. Lawson, and Pseudotsuga menziesii Mirb. Franco) were compiled for the region. Predictor chronologies were first screened based on their location relative to the moisture-sensitive footprint of the instrumental streamflow data. To achieve the moisture-sensitive footprint region, we conducted a spatial field correlation analysis between the instrumental streamflow data and the gridded CRU TS3.24 0.5° precipitation field during the period 1901–2013 (cf. Harley et al., 2017). Grid points with significant correlations at p < 0.01 were plotted, and produced a region we term the moisture-sensitive footprint of the instrumental data. Tree-ring chronologies were pooled as modeling candidates if they were located within this region. Because many of the existing chronologies within the region were collected in the 1960s and 1970s, seven were selected for updating (2013 CE) based on strong positive correlations with Pecos River streamflow data (Table 1). Updating chronologies consisted of relocation the existing sites and collecting new tree-ring samples from 15–20 trees. In addition, three new collections were gathered, one from the middle PRB (Cougar Mountain – P. ponderosa) and two from the locations near the Pecos River headwaters (Trampas Medio and Amole Canyon – P. ponderosa) (Table 1). At each of the new sites and for the updated sites, two cores were extracted from 15–20 trees growing on dry, south- or southwest-facing slopes following standard dendrochronology field methods (Stokes and Smiley, 1968). These 10 updated and new chronologies are intended to provide the forward reconstruction nest (see ‘Reconstruction Model’ section below) during the period 1976–2013.
Site information for updated and new tree-ring chronologies.
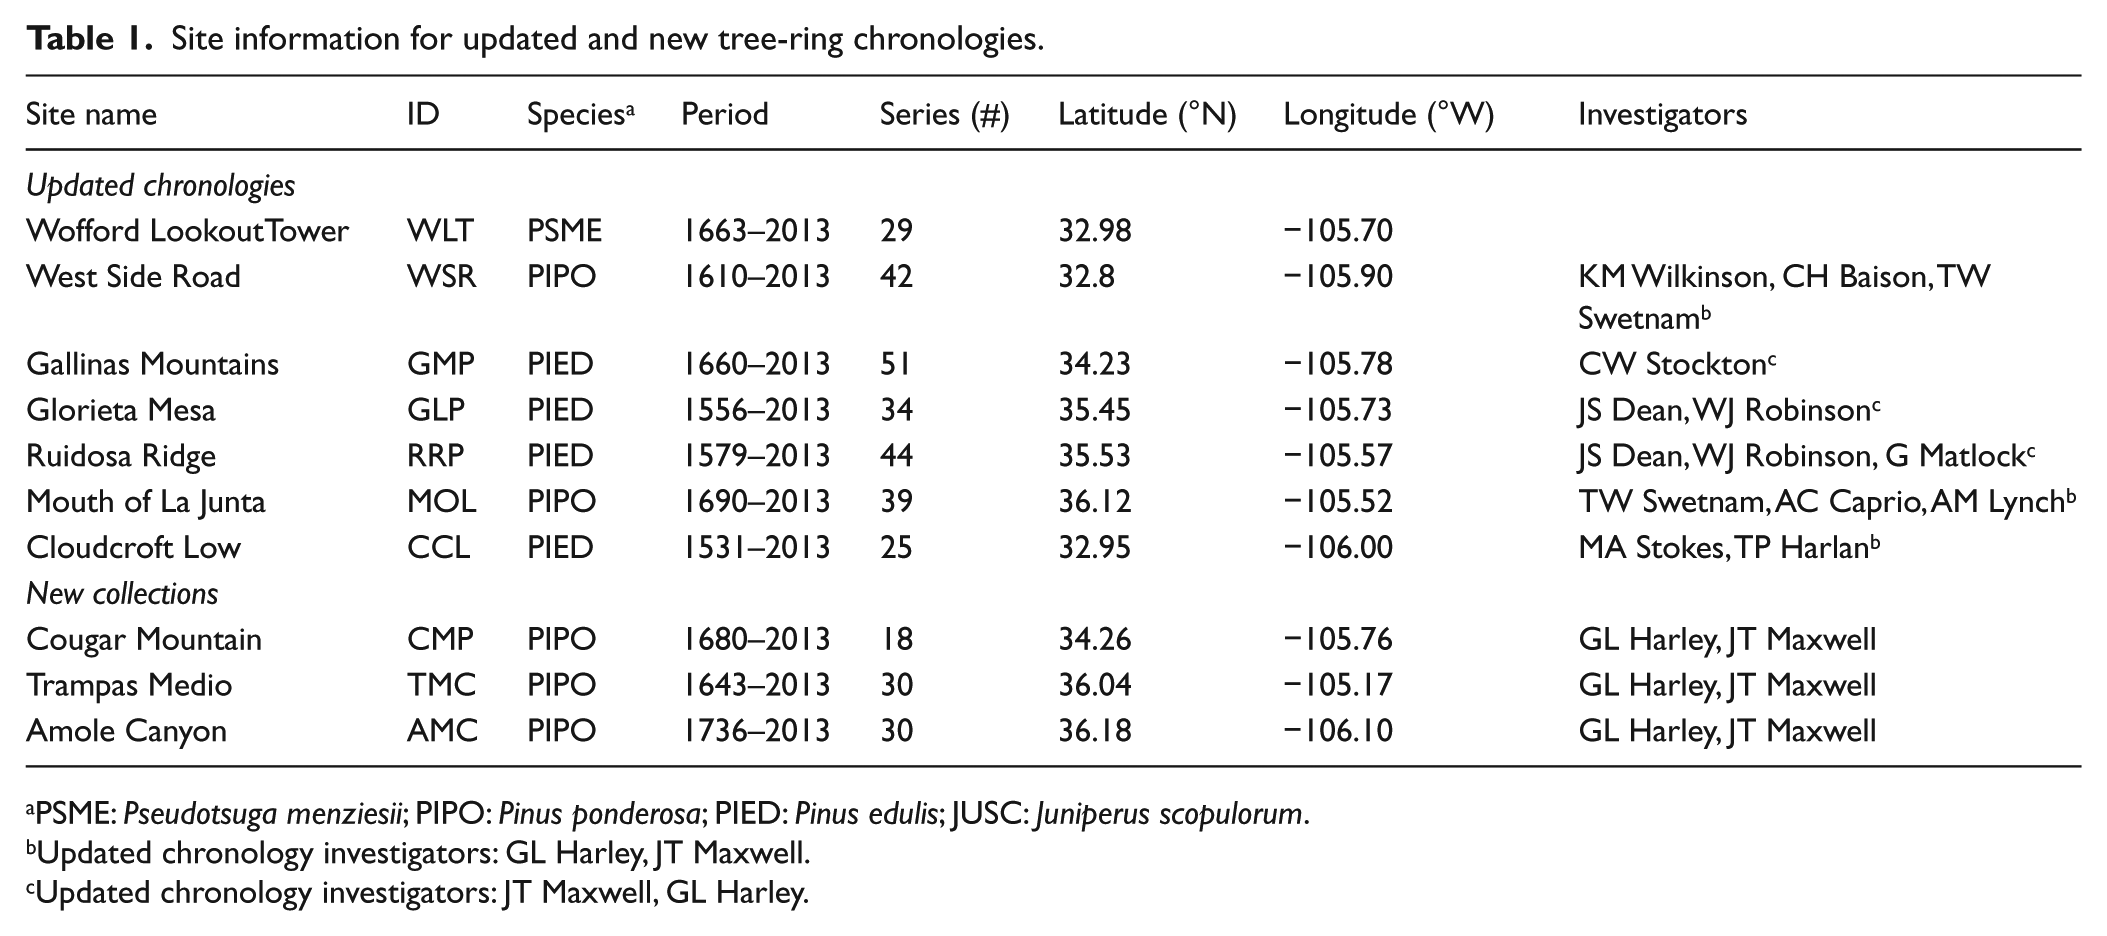
PSME: Pseudotsuga menziesii; PIPO: Pinus ponderosa; PIED: Pinus edulis; JUSC: Juniperus scopulorum.
Updated chronology investigators: GL Harley, JT Maxwell.
Updated chronology investigators: JT Maxwell, GL Harley.
Tree cores were prepared and crossdated using methods standard to the field of dendrochronology (Stokes and Smiley, 1968). The program COFECHA was used as a crossdating check in developing the updated and new chronologies (Holmes, 1983). We then used the ARSTAN program to standardize each tree-ring series with a smoothing spline with a 50% frequency response cutoff equal to two-thirds the length of each series. This level of detrending preserves low-frequency variance in each series suitable for the analysis of multidecadal trends in reconstructed streamflow. We chose to stabilize the variance of each detrended index series (e.g. Briffa, 1995) to facilitate comparisons of magnitude and severity of droughts through time and to decrease artificial inflation of variance because of decreased sample size back in time. Low-order autocorrelation was removed from each series using an auto-regressive model.
Reconstruction model
We chose a nested principal components regression (PCR) model, which accounts for the decrease in number of predictor chronologies through time (Cook et al., 1999, 2004, 2007; Meko, 1997), to reconstruct mean October–September Pecos River streamflow. Tree-ring predictors and streamflow data were prewhitened to ensure independence before modeling. Second, chronologies in the candidate pool were retained for PCR modeling if they contained significant correlations (p < 0.10) with mean October–September streamflow during the common period (1930–1975), which was the period of overlap between the predictor chronologies and instrumental streamflow data. Chronologies in years t and t + 1 were included in the analysis because of known preconditioning effects that previous year water availability has on current year tree growth in the region (Fritts, 1976). A principal component analysis (PCA) was performed on the time series matrix of current (t) and lagged (t + 1) tree-ring indices retained for modeling, reducing the dimensionality of the data. Following the Kaiser–Guttman rule, the first n eigenvectors with eigenvalues > 1 were retained for the multiple regression. The final subset of PCs in the regression model was determined by using the minimum Akaike information criterion (AIC), which includes a penalty term for increasing the number of predictors in the model (Akaike, 1974).
The instrumental period (1930–1975) was split into two equal periods for calibration (1930–1953) and verification (1954–1975) of the nested PCR models. Calibration models were verified using two rigorous tests of fit, the reduction of error (RE) statistic and coefficient of efficiency (CE) (Cook et al., 1999; Fritts, 1976). Given that RE ranges from −∞ to +1, a positive RE denotes that the calibration model is more skillful than the mean of the instrumental data during the calibration period. The CE has the same range and calculation, yet it relies on the verification period mean for a baseline of predictive skill, and is thus more difficult to pass (value > 0). We produced the final reconstruction by calibrating on the full common/instrumental period (1930–1975).
The first model was calibrated for the common period of all chronologies (1799–1975). Successive models were calculated backwards in time in intervals based on chronology length with fewer chronologies as they dropped out. Forward nests were calculated in at least 5-year intervals starting after 1975 CE to include more recent tree-ring collections on the ITRDB, and the updated and new collections from this study. After each nest was calculated, flow estimates along with each set of calibration and verification statistics were spliced together for the entire reconstruction length.
Model uncertainty
We assessed model uncertainty by using maximum entropy bootstrapping (Vinod and Lopez-de-Lacalle, 2009) (MEBoot), applied to the tree-ring predictors and streamflow data, to produce 300 replicates of the reconstruction. MEBoot allows for the estimation of uncertainty for each year in the reconstruction by producing an empirical probability distribution for each year (Cook et al., 2013). Another advantage of the MEBoot process is the calculation of semiparametric uncertainty estimates for the calibration and verification statistics (see Cook et al., 2013 for details).
Reconstruction analyses
Given the importance of assessing multiyear dry and wet events for water management within the PRB, we used runs analysis (Gray et al., 2011) to assess departures from instrumental mean in the reconstruction. Multiyear (at least 2 consecutive years) departures from mean were used to calculate duration, magnitude (cumulative departure), and intensity (magnitude divided by duration) for events that were above or below the mean. Magnitude and intensity values were then summed to determine the overall ranked score for each event.
In addition to runs analysis, we conducted tests to investigate the (1) long-term variability of the Pecos reconstruction and (2) historical context of the recent declines in Pecos River streamflow. We used the Rodionov (2004) algorithm to examine whether potential significant (p = 0.01, 0.05) regime shifts were present in the record. We also calculated 11-year standardized flow anomalies for the reconstruction (cf. Harley et al., 2017) and probability density functions by century (cf. Pederson et al., 2013, 2015) for temporal comparisons of streamflow variability.
Results/discussion
Pecos River reconstruction
The Pecos River reconstruction is not only representative of the entire basin but it also represents regional-scale hydroclimate conditions across a large portion of the American Southwest (Figure S1, available online). Over the period 1901–2013, the reconstruction correlates significantly (p < 0.05) with October–September self-calibrating Palmer Drought Severity Index (scPDSI; Wells et al., 2004) across the American Southwest, with the strongest correlations (r ≥ 0.60) occurring over almost the entire State of New Mexico and portions of eastern Arizona. The strong relationship between water-year scPDSI and the reconstruction provides independent evidence that our record represents hydroclimate conditions over a large area of the Southwest.
A total of 27 predictors were used to build the Pecos River streamflow model during the common/instrumental period (1927–1975), which explained 75% of the variance in instrumental streamflow at the Anton Chico gage (Figure 3). The performance of the Pecos River streamflow model was on par with other tree-ring-based reconstructions in the western US, including the Colorado River (72–81%; Woodhouse et al., 2006), Logan River (58%; Allen et al., 2013), Snake River (63%; Wise, 2010), Weber River (55%; Bekker et al., 2014), Bear River (68%; DeRose et al., 2015), Sante Fe River (62%; Margolis et al., 2011), and Rio Grande River (70%; Woodhouse et al., 2012).
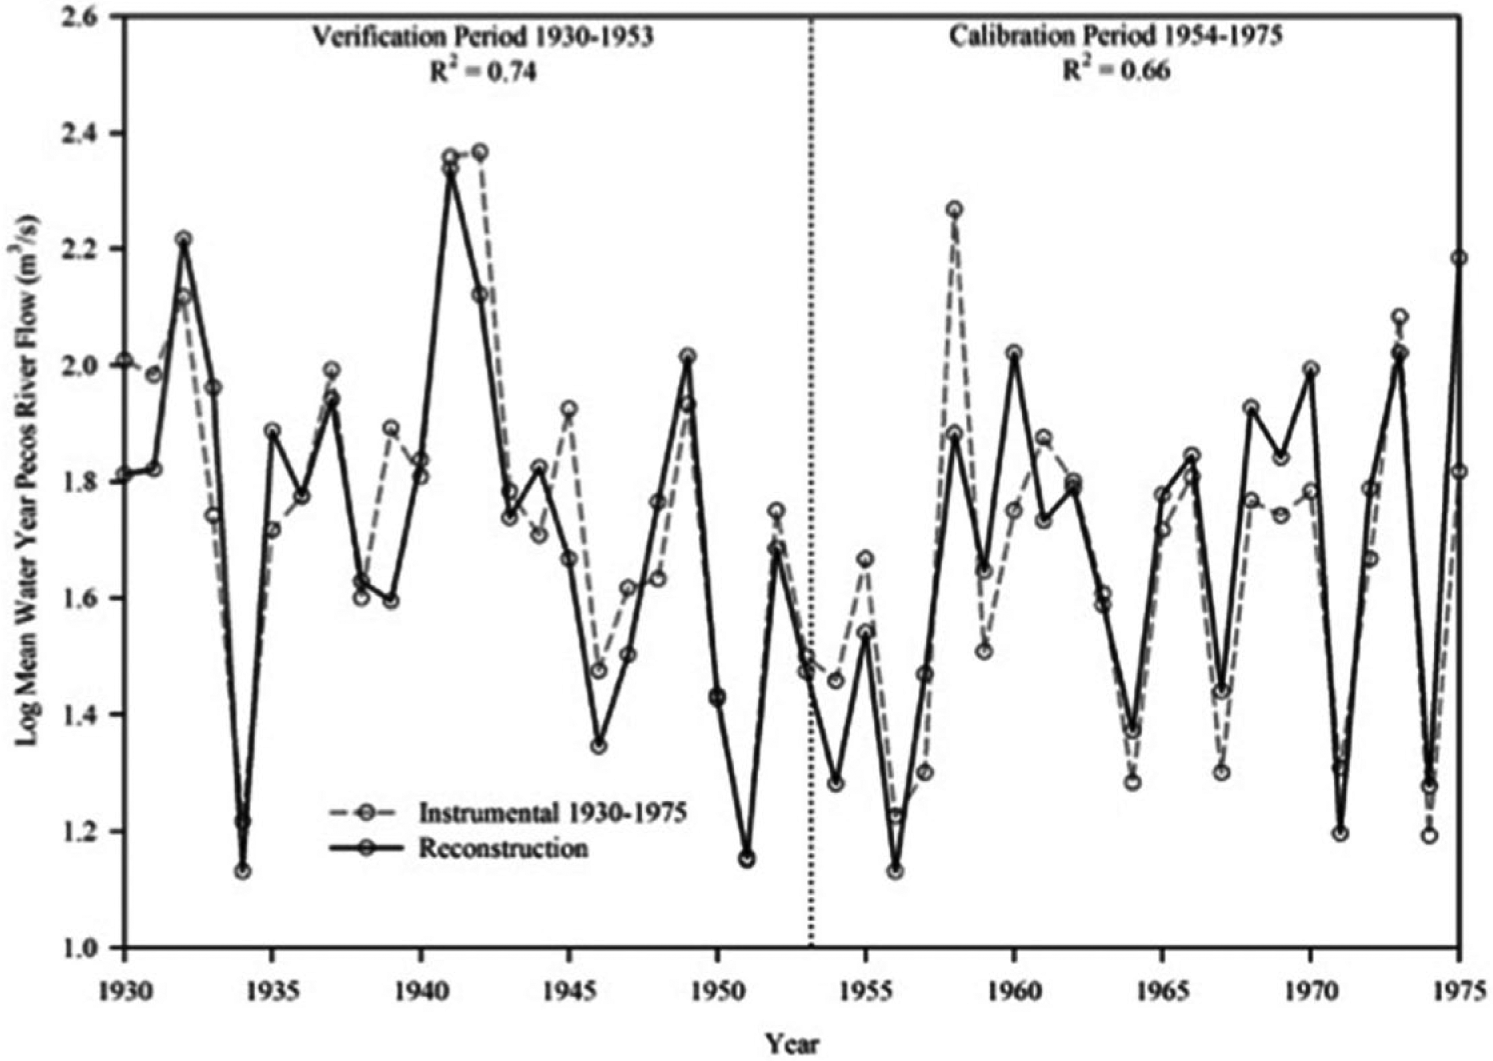
Final reconstruction model for the 1799–1975 nest (solid line) and instrumental data (dashed line) shown for the period 1930–1975 CE. Dotted vertical line denotes cross calibration (1930–1953) and verification (1954–1975) periods.
The Pecos River reconstruction comprised 28 nests (6 forward and 22 backward), and statistics indicate the reconstruction remains valid during the period 620–2013 CE (Figure 4a and b; Table S1, available online). Calibration and verification statistics for the reconstruction remained significant (p < 0.01) and positive for the entire reconstruction period (620–2013 CE) (Figure 4b). However, we decided to only analyze the reconstruction during the period 1310–2013 CE because of low chronology replication (n < 5) and low verification period CE numbers (although still positive) that exist prior to the year 1310 (Table S1, available online). Predictor replication (chronologies t and t + 1 lagged) remained strong in both the forward and backward nests and ranged from 11 for the 2006–2013 nest to 5 for the 1310–1489 nest.
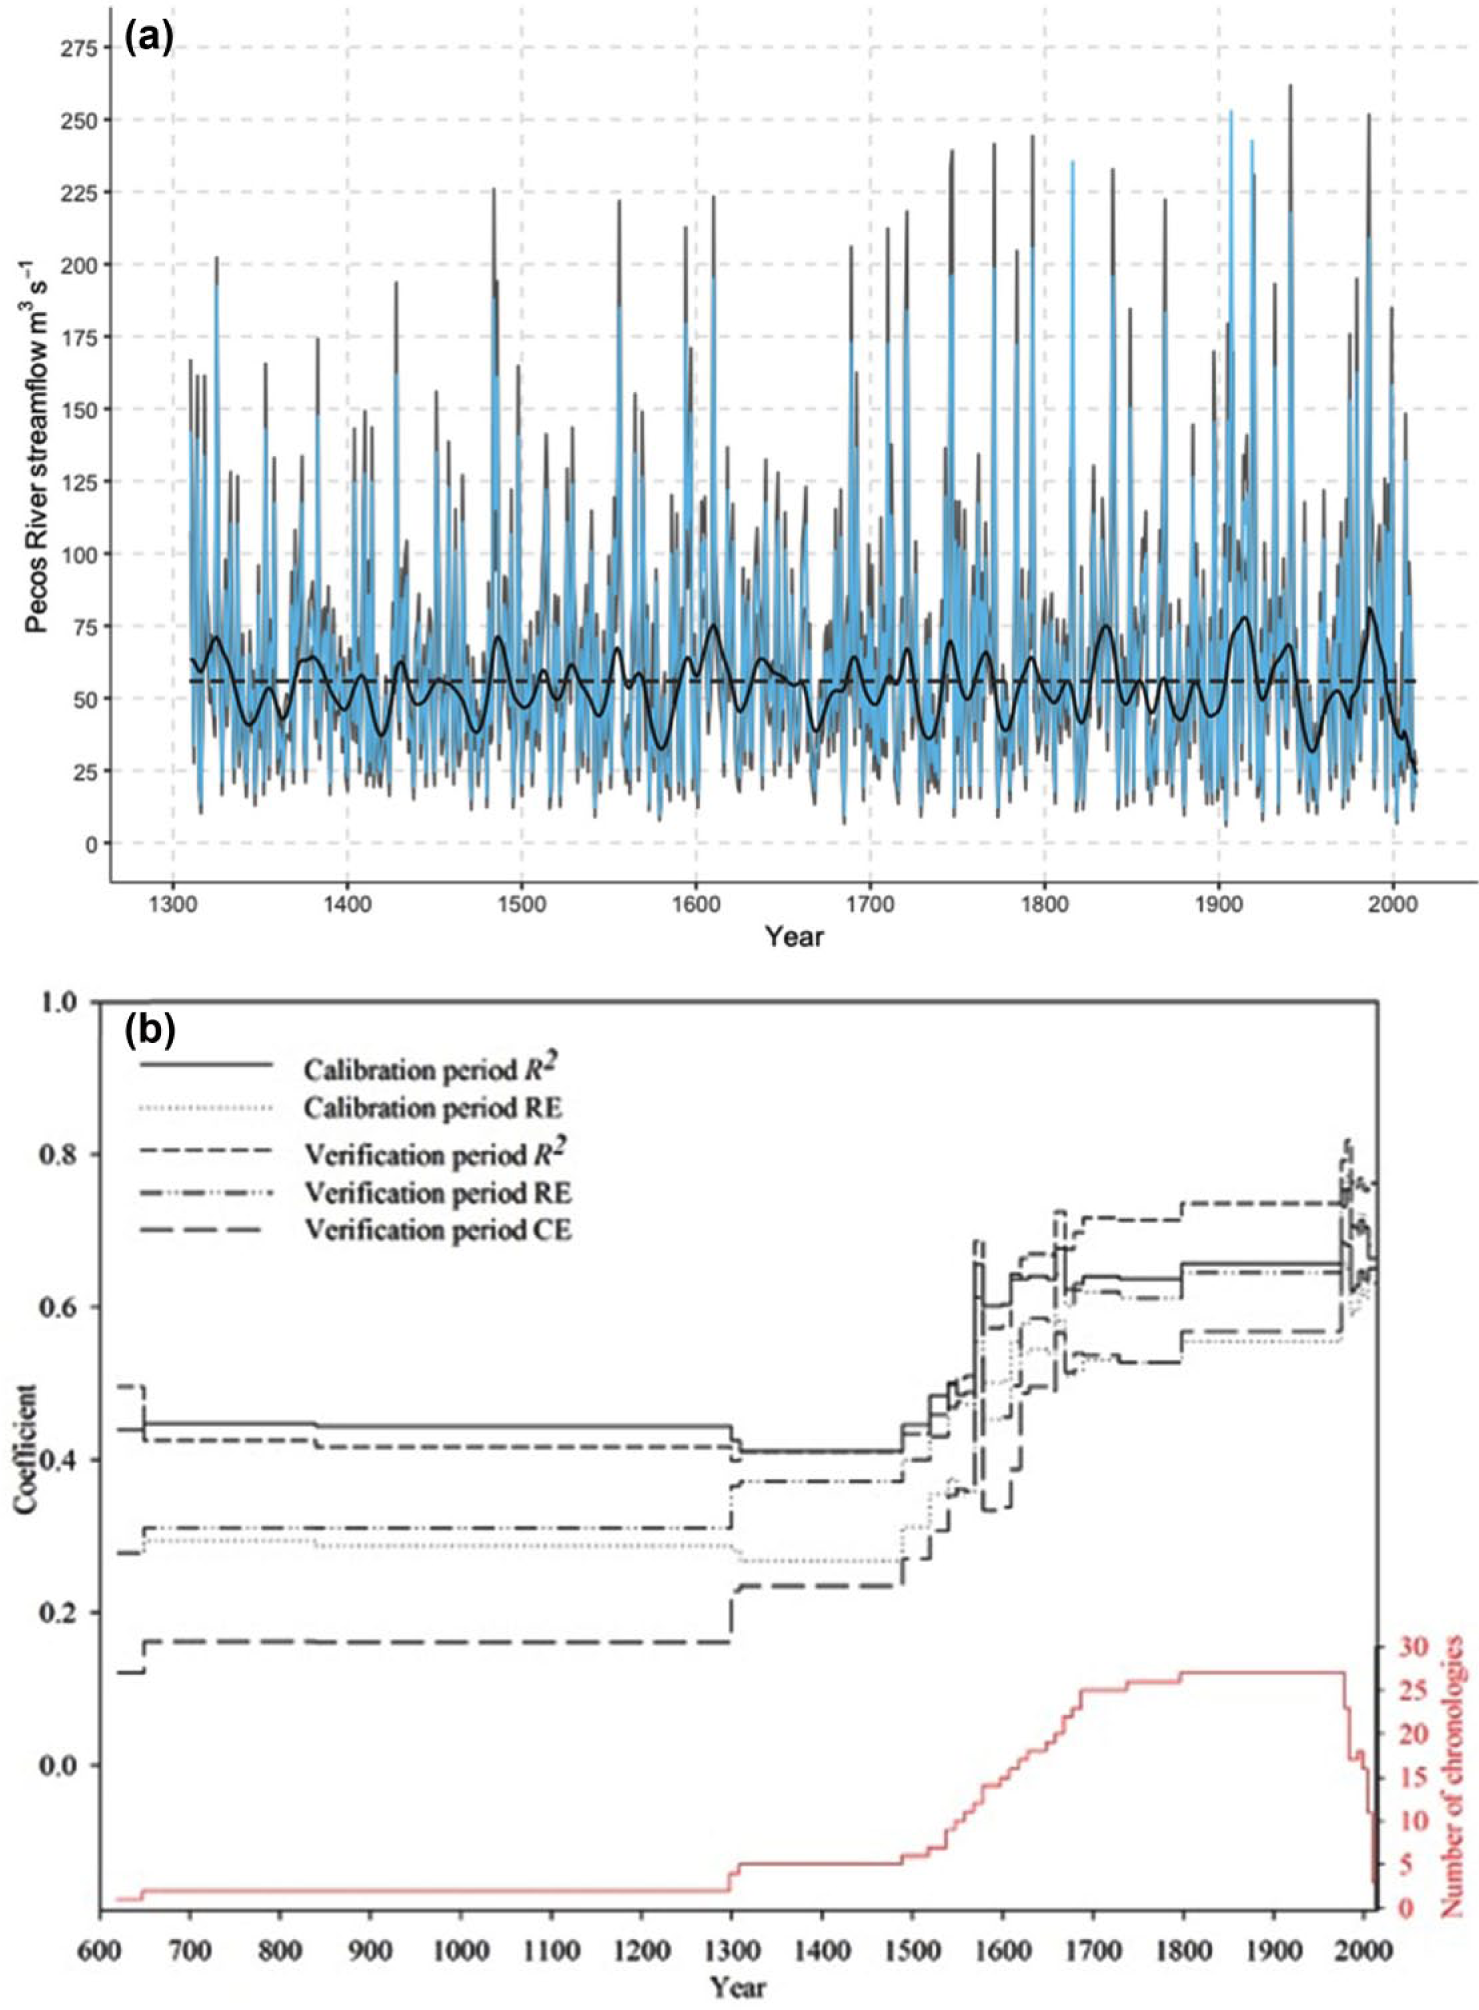
(a) Reconstructed water-year Pecos River streamflow (m3 s−1) during the period 1310–2013 CE (blue line) plotted with a 20-year low-pass filtered spline (solid black), 90% MEBoot uncertainties (gray), and the long-term mean (dashed gray; 56 m3 s−1). (b) Calibration and verification statistics showing R2 and reduction of error (RE) for the calibration period, and R2, RE, and coefficient of efficiency (CE) for the verification period for each forward (1976–2013) and backward (1929–1310) nested PCR models during the reconstruction period (1310–2013). The number of chronologies for each nest is also plotted.
Species contribution and mapping of beta weights
The tree-ring network (n = 27) used to reconstruct Pecos River streamflow comprised three different species: P. edulis (n = 9), P. ponderosa (n = 11), and P. menziesii (n = 7) (Table S2, available online). As a whole, the most important species to the reconstruction model was P. edulis, which had an average relative explained variance (AREV) of 41.4 compared with 36.4 for P. ponderosa and 22.2 for P. menziesii. A map of the beta weights (cf. Maxwell et al., 2011) revealed a latitudinal/moisture pattern with regard to how individual chronologies contributed to the reconstruction model, and this mirrors the general south-north moisture gradient in New Mexico (Figure 2). Chronologies from the Sacramento Mountains area and Gallinas Mountains were by far the most important contributors. Only four beta weights were >0.10, and these were represented by all three species and were from the Sacramento (P. ponderosa – ‘West Side Road’) and Gallinas Mountain (P. edulis – ‘Gallinas Mtns’, P. ponderosa – ‘Cougar Mountain’, P. menziesii – ‘Gallinas Mtns’) regions. These results reiterate that the site selection is important for tree-ring based reconstructions (Fritts, 1976). For example, P. menziesii inhabit higher elevations and on north- and east-facing slopes in New Mexico, and trees situated in this topography generally receive more precipitation compared with individuals in lower elevations. The P. menziesii chronologies included in the Pecos River reconstruction were from higher elevations compared with P. edulis and P. ponderosa. As a group, the P. menziesii chronologies had the lowest AREV likely because the species is not as moisture limited compared with P. edulis and P. ponderosa.
PRB pluvials
Over the past ca. 700 years, wet events (n = 76) that lasted at least 2 years were less common than dry periods (n = 93), wherein flow was above/below the instrumental mean (61.6 m3 s−1; Table S3, available online). Moreover, the maximum duration for wet periods (5 years) was shorter than dry periods (13 years). Extreme (95th percentile) wet years, however, were more in balance with extreme dry years throughout the record (Figure S2, available online). Extreme wet years occurred more in the 1300s, 1700s, and the 1900s, which includes the instrumental period. More 2+ year wet events occurred during the 18th century than any other in the record, with the most pronounced being the 2-year event from 1815 to 1816 when the Pecos River was estimated to have a cumulative flow above the mean at 227 m3 s−1 (Table S4, available online). The 20th century was the wettest in the PRB over the past ca. 700 years, only broken by the widespread 1950s drought. No extreme wet years occurred during the period 2000–2013 CE.
The recent 1980s wet period (1985–1988 CE) ranked third among all wet events, during which the Pecos cumulative flow was 330 m3 s−1. The 1980s wet event, however, was eclipsed in magnitude and intensity by the 1900s pluvial. The 1900s pluvial was extraordinary within the context of the entire Pecos reconstruction, with the 1905–1908 (cumulative magnitude 407 m3 s−1) and 1919–1921 (cumulative magnitude 327 m3 s−1) events ranking as the first and second wettest (Table S4, available online). The same extreme pluvial was found on the Sante Fe River (Margolis et al., 2011), but in the Rio Grande (Woodhouse et al., 2012), the 1900s pluvial was exceeded in duration and magnitude by the 17th century pluvial. The 17th century and early 1900s pluvials were also evident across the Intermountain West, including the Upper Colorado River Basin (UCRB; e.g. Gray et al., 2011; Woodhouse et al., 2006), Wasatch Front (Bekker et al., 2014), Spring Valley (Strachan et al., 2012), and Snake River (Wise, 2010). The 17th-century pluvial stands out in the PRB, Wasatch Front, and Spring Valley records compared with the 1900s pluvial, except for the Snake River.
PRB droughts
Extreme (5th percentile) individual dry years were more frequent than extreme wet years in the 16th, 17th, 19th, and 21st centuries (Figure S2, available online). Runs analysis identified the 11-year drought of 1772–1782 as the highest ranked dry event based on final score (−313; magnitude + intensity), slightly edging out scores for the 1415–1425 (score −312) and 1950–1957 (score −310) events (Table S5, available online). Yet, the driest events that have occurred from the 14th through the 20th centuries are challenged by flow conditions since the turn of the 21st century. The 2000–2006 and 2011–2013 dry periods were characterized by a cumulative Pecos flow of −221 m3 s−1 and −121 m3 s−1, respectively. Although the 2011–2013 event was ranked 13th based on overall score (magnitude + intensity), the intensity (−40 m3 s−1 yr−1) exceeded all higher ranked droughts.
The lowest single water-year flow in the reconstruction was shared by 1904 and 2002, during which the flow of the Pecos River was estimated at 8.1 m3 s−1. The year 2002 was also the lowest recorded flow by the Anton Chico gage at 6.6 m3 s−1 during the instrumental period. Other extreme low-flow years that rival 1904 and 2002 were 1685 (9.5 m3 s−1) and 1579 (9.8 m3 s−1), but examining the lower bound of the margin of error produced by MEBoot show that 1904 and 2002 were lower than any year in the reconstruction (Figure 3b). Although the Pecos River flow during the year 1904 was estimated at one of its lowest in the past 700 years, the year 1905 marks the beginning of 1900s pluvial, one of the most epic pluvials in the reconstruction. Although, one noteworthy caveat in the comparison of drought and pluvial magnitude extending back in time is the decrease in model strength between the 20th century and the 14th century.
The box-and-whisker plots revealed three primary conclusions with water management implications within the PRB (Figure S3, available online). First, since the beginning of the 14th century, the Pecos River has experienced the greatest flow variability during the 20th century. Second, the extreme flow variability (pluvial-to-drought conditions) from the early to middle 20th century was challenged by conditions following the 16th century Megadrought. Third, 90% of annual flows since 2000 CE have been below the long-term reconstructed mean of 56 m3 s−1, albeit this box was calculated with 14 years of data and not 50 years. Yet, the instrumental data show a similar result (Figure S3, available online). Results from regime shift detection analysis supported the box-and-whisker plots whereby significant changes in the mean and variance of Pecos River flow occurred over the past 115 years (Figure 5). Other than the recent significant shifts in flow regime, the only other extreme changes in mean flow occurred from extreme drought at the end of the 16th century to the pluvial that marked the start of the 17th century (p < 0.05). Yet, the severity of recent regime shifts is unprecedented in the past 700 years, most notably the extreme low flows since the turn of the 20th century as illustrated by 11-year standardized flow anomalies of the Pecos River reconstruction (Figures 5 and 6a).
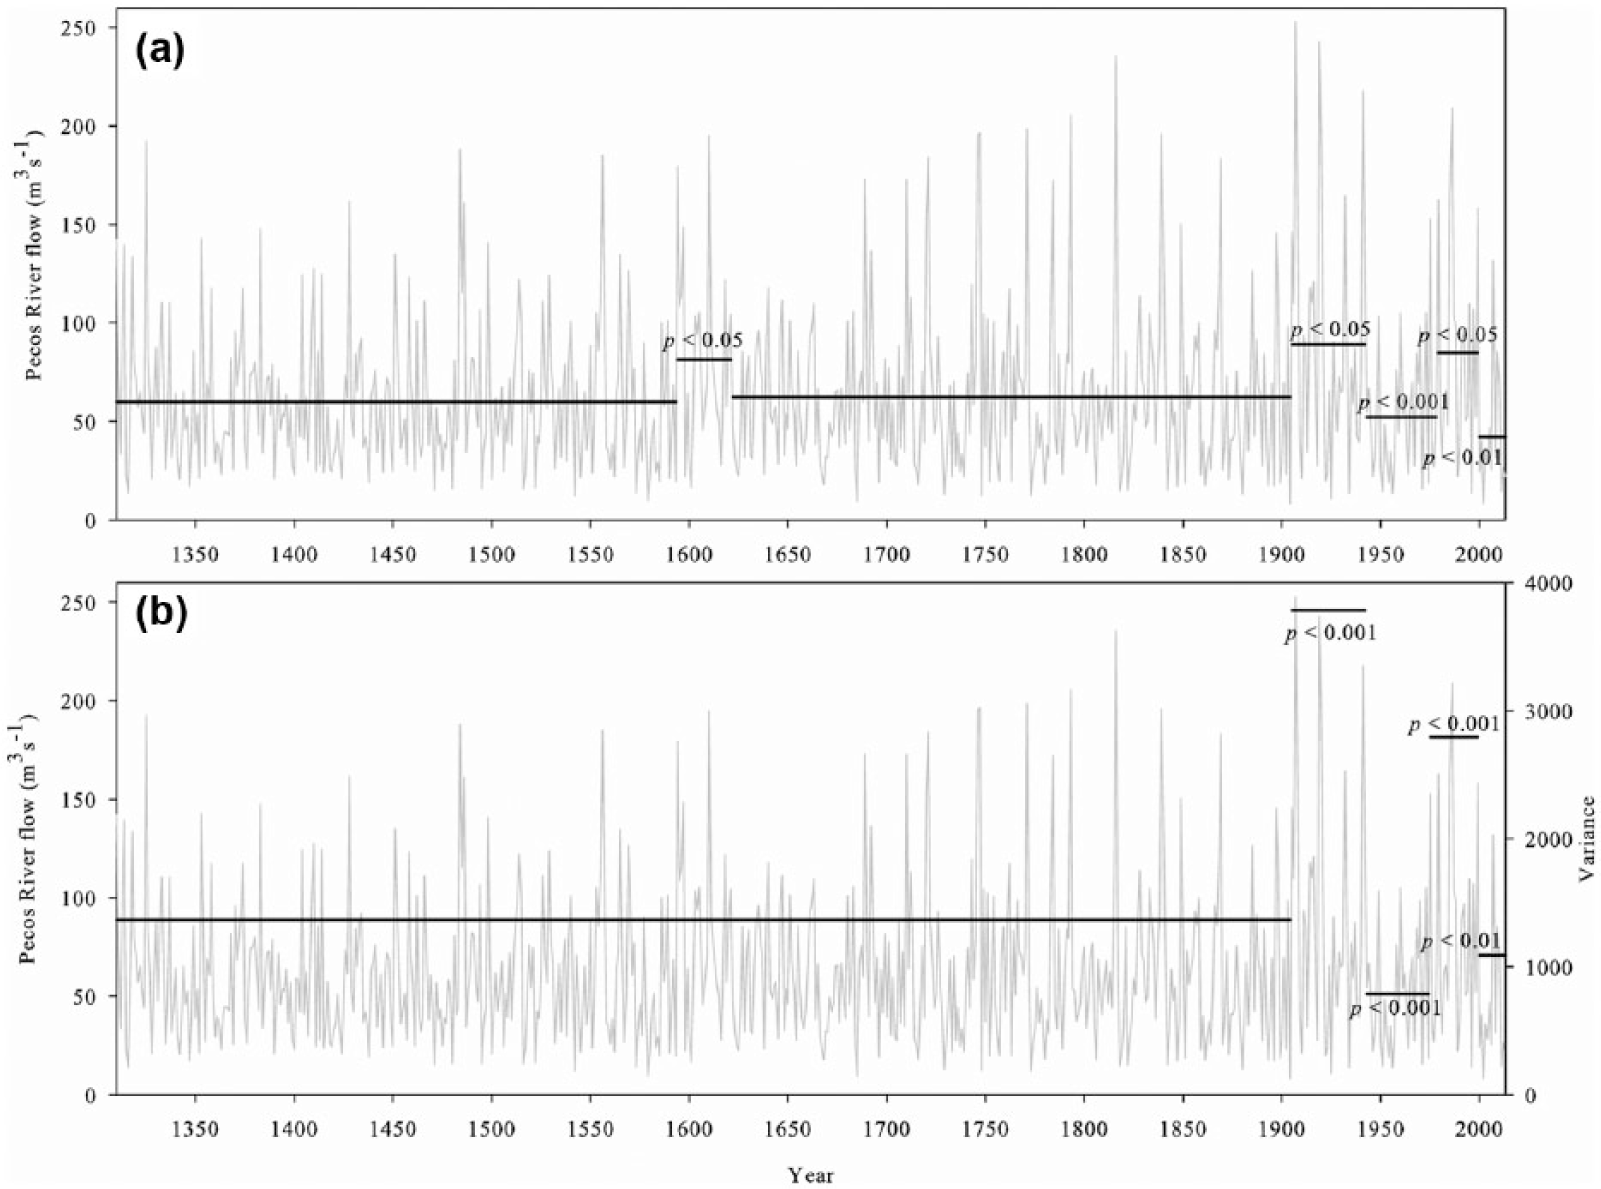
Regime shift detections (horizontal black lines) in mean (a) and variance (b) of reconstructed water-year Pecos River streamflow (light gray) using the Rodionov (2004) method. Significant (p < 0.05, 0.01, 0.001) regime shifts are labeled.
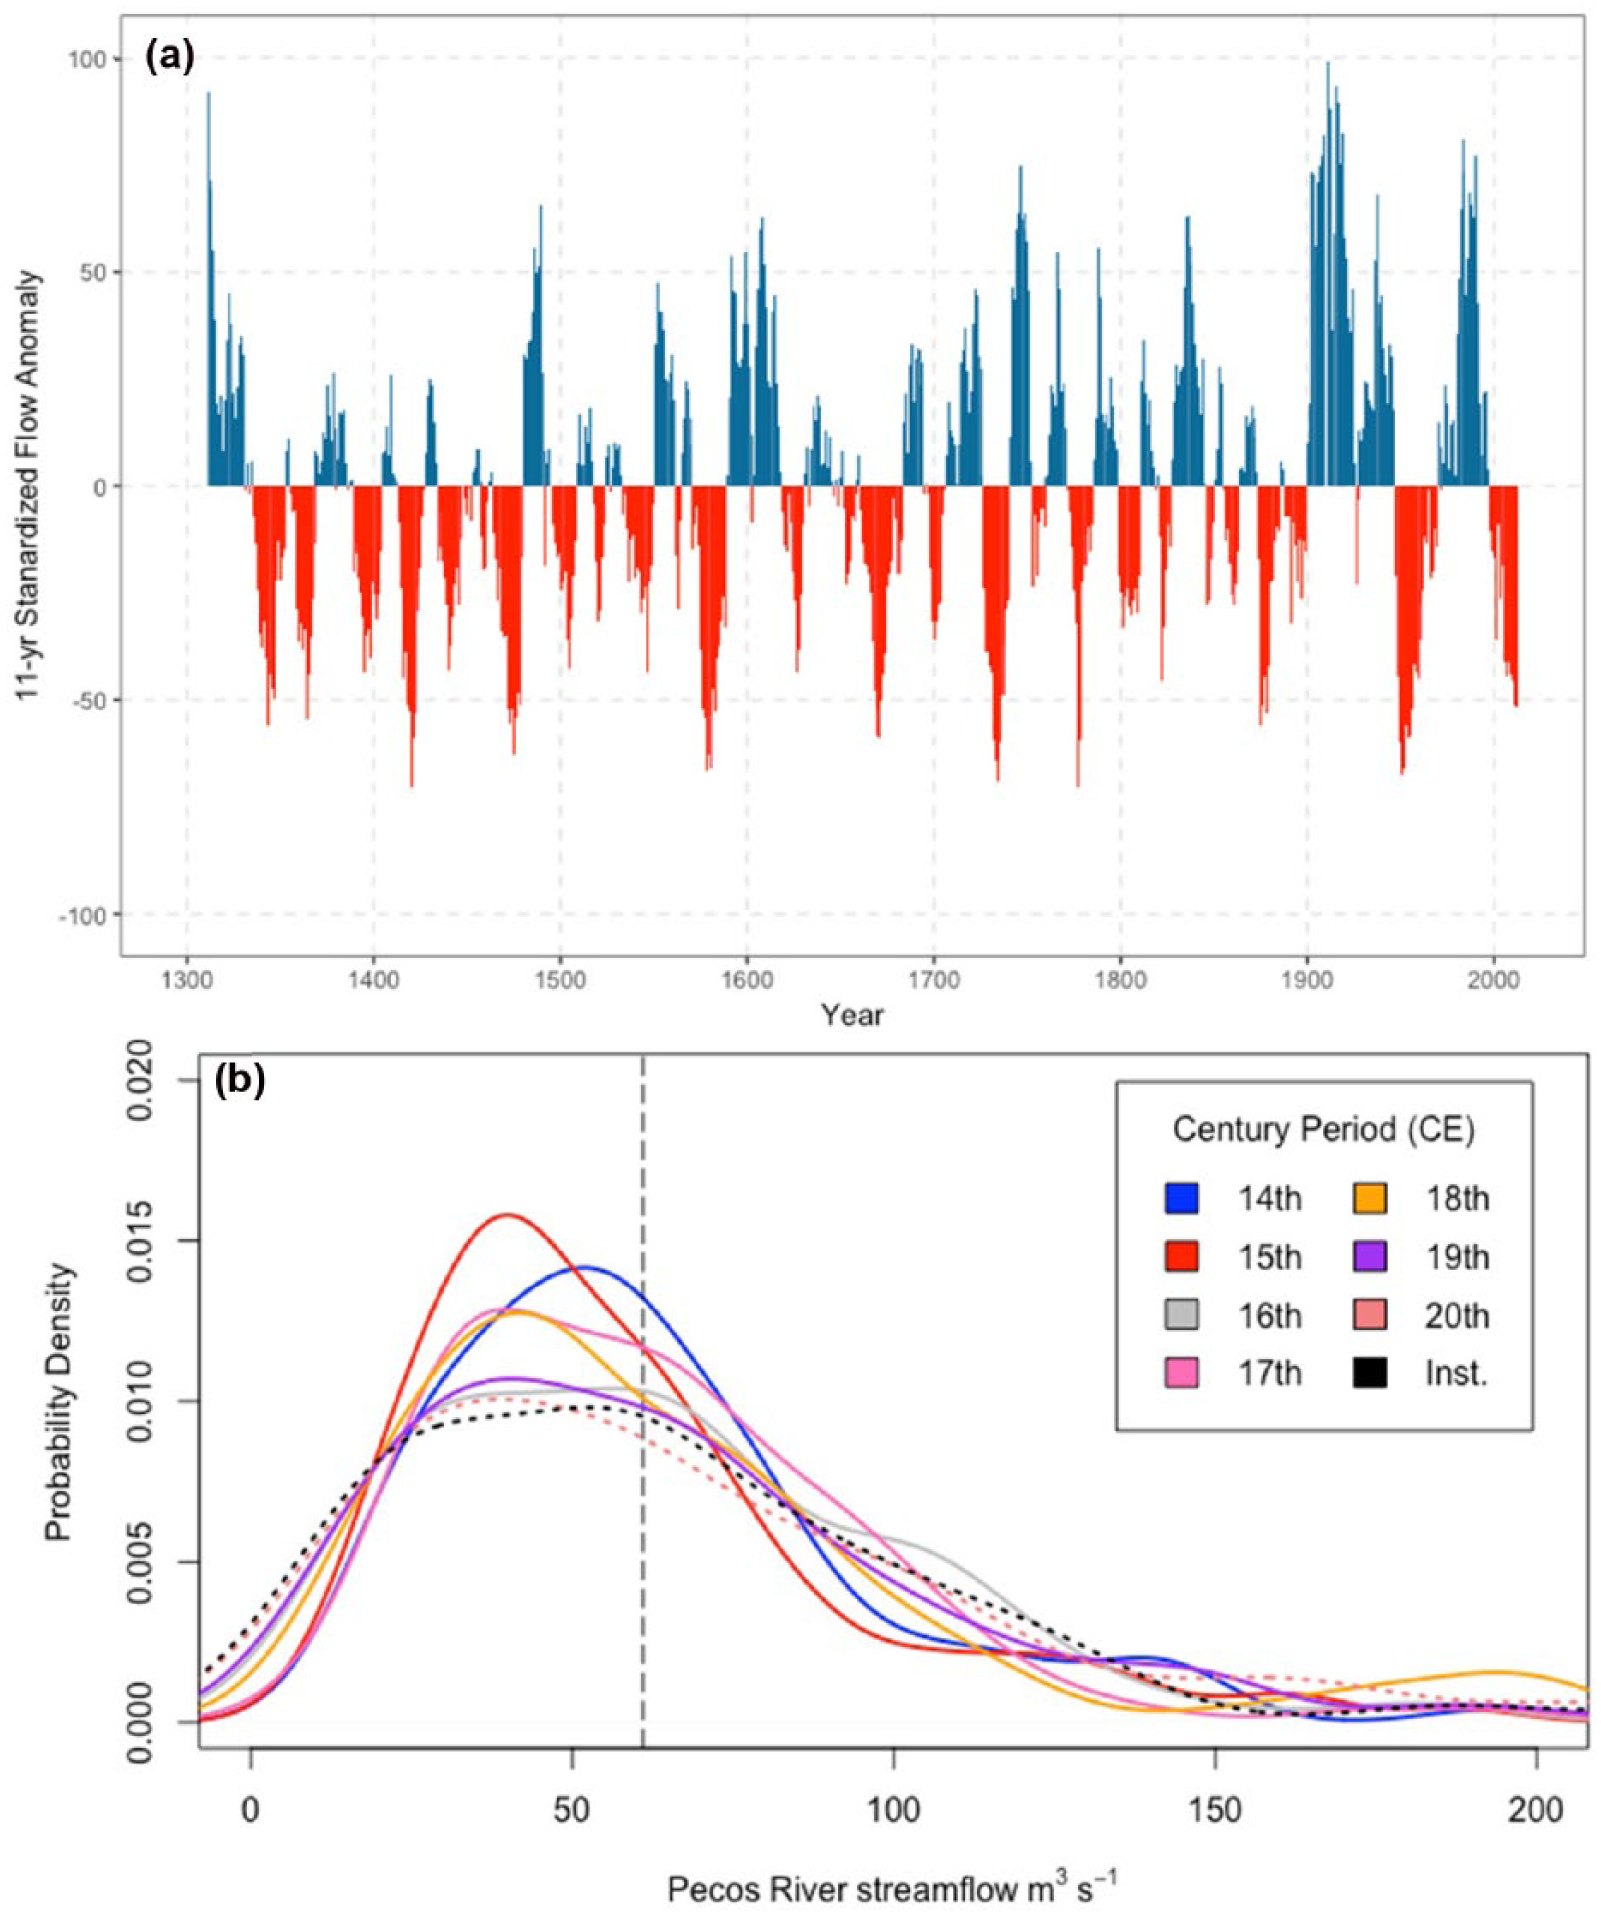
(a) Standardized flow anomalies (11-year) showing drought (red) and pluvial (blue) periods relative to the long-term mean (1310–2013) of reconstructed water-year Pecos River streamflow. (b) Probability density functions of the Pecos River reconstruction 1310–2013 calculated per century (14th–20th). Inst. = instrumental PDF using Anton Chico gage data 1930–2013. For comparisons, 20th and instrumental PDFs are shown with dashed lines. Vertical dashed grey line = instrumental mean (61.6 m3 s–1).
Standardized anomalies for the Pecos River reconstruction demonstrate that extreme dry and wet years and extended drought and pluvial periods were common over the past 700 years (Figure 6a). With regard to drought duration, conditions during the 15th and 18th centuries appear to be outside of the range of variability captured by the gage record, a common conclusion reached in tree-ring-based reconstructions of streamflow (e.g. Harley et al., 2017; Maxwell et al., 2011; Wise, 2010; Table S5, available online). With regard to the magnitude (departure from mean) of droughts and pluvials, however, the gage record captures the full range and variability of flow extremes within the context of the past 700 years (Figure 6b and Figure S3, available online). The extreme variability of flow conditions during the 20th century (both reconstructed values and instrumental data) resulted in a probability density distribution with less kurtosis, especially compared with the drought-prone conditions experienced during the 15th century (Figure 6b).
Two major rivers in New Mexico were previously reconstructed using tree rings including the Rio Grande River (Woodhouse et al., 2012) and Sante Fe River (Margolis et al., 2011). Pluvials during the late 15th century, early 17th century, and the early 20th century are in agreement between the Rio Grande, Sante Fe, and Pecos Rivers. Drought conditions during the late 16th century, 1950s, and 2000s are also similar between the records (Figure 7). The 1730s, however, were marked by drought and low-flow conditions on the Sante Fe and Pecos Rivers, but this drought appears subdued in the Rio Grande record. Major droughts and pluvials in the Pecos River reconstruction also agree with a 431-year tree-ring based reconstruction of 1 April snow-water equivalent (SWE) from western Colorado by Woodhouse (2003). The Woodhouse (2003) SWE reconstruction and the Pecos record are independent and do not contain overlapping tree-ring chronologies. Droughts reflected in the Colorado snowpack reconstruction are also seen in the Pecos River reconstruction, including the 1620s, 1660/1670s, 1680s, 1710s, 1730s, 1770/1780s, 1810s, 1840s, 1870s, and 1950s, all of which appear as top 25 drought events by score ranking (Table S5, available online). Although the western Colorado snowpack reconstruction was conducted for snow gages west of the continental divide, and hence would not directly influence Pecos flow, the agreement between the two records is likely because of the location of the Anton Chico gage within the upper reaches of the PRB and high influence of snowmelt on water-year flows.
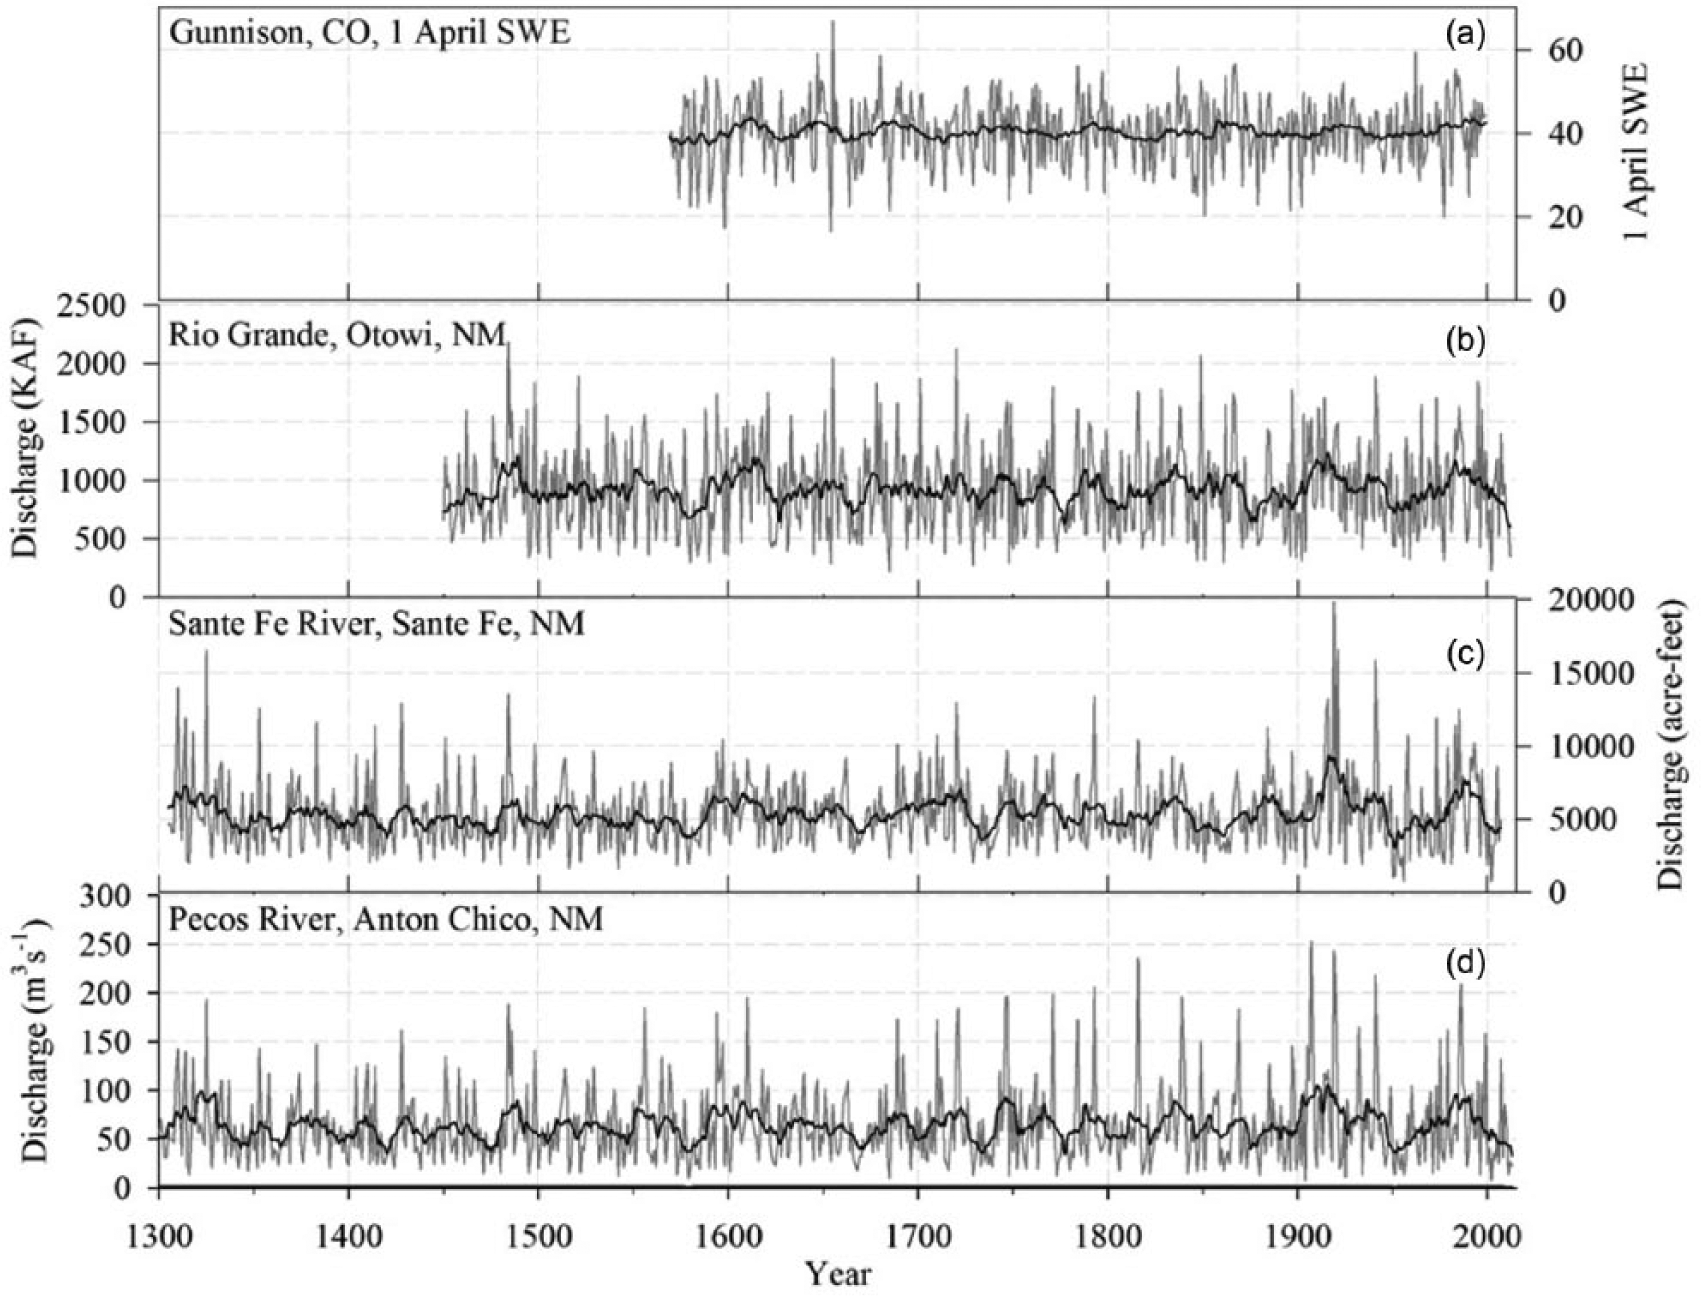
Hydroclimate proxy record comparison showing reconstructed (a) snowpack near Gunnison, Colorado (1 April snow-water equivalent, SWE; Woodhouse, 2003); (b) Rio Grande streamflow near Otowi, New Mexico (NM), (c) Sante Fe River flow near Sante Fe, NM (Margolis et al., 2011); and (d) Pecos River streamflow near Anton Chico, NM. Data for Rio Grande streamflow acquired from the TreeFlow website (http://www.treeflow.info).
Current conditions in historical context
Water supply in the PRB has long been a topic of heated debate and infighting between the States of New Mexico and Texas. The Pecos River Compact (U.S. Congress, 1949), established in 1948 between New Mexico and Texas, had three major legislative provisions: (1) establishing the ‘1947 condition’ by which New Mexico shall not deplete through human activities the amount of water received by Texas below the amount received in 1947, (2) an understanding that both states would support legislation for all water-related construction projects, and (3) the Pecos River Commission was formed to oversee the administration of the compact (Pecos River Compact Commission, 1948). The year 1947 was included in the identified 1945–1948 dry event when the Pecos had a cumulative magnitude of 87 m3 s−1 below the instrumental mean. Within the context of the past 704 years, however, this event ranked as the 37th driest based on overall score, and the intensity (–22 m3 s−1) ranked in the bottom portion of all 2+ year dry periods.
Droughts in the 1950s and 1970s have since led Texas to dispute the amount of water received and even file suit against New Mexico for failing to deliver the amount of water equivalent to the 1947 condition. A key provision of the compact, however, releases New Mexico from low flows stemming from weather or climate. Yet, warm/cool season precipitation and temperature variability is not the only cause of Pecos River depletion. Invasion from the phreatophyte saltcedar and well installations in populated areas (e.g. cities of Roswell and Carlsbad, New Mexico) are also potential contributors to depletion of the Pecos in the middle and lower reaches of the basin (Thomas, 1963). The continued disputes over Pecos River usage and supply are not likely to cease, especially given (1) past droughts and dry events have far exceeded the conditions during the year 1947 and 1945–1948 dry event, (2) the low-flow regime has crippled the basin since the year 2000 CE, and (3) projected warming and drying in the American Southwest over the next 50–100 years (IPCC, 2014).
The Margolis et al. (2011) Sante Fe River reconstruction spans the period 1305–2007 CE, and despite minor differences, a visual comparison of the Sante Fe and Pecos River reconstructions shows a high level of similarity with regard to associated drought and pluvial events. This is not surprising, as many of the predictors (n = 6) used by Margolis et al. (2011) also pulled into the Pecos model, so the two records are not independent. Although the Pecos River and Sante Fe River reconstructions are similar, the Sante Fe record extends to the year 2007, half way through the 2000–2014 drought (Udall and Overpeck, 2017). The Pecos River record, however, extends to 2013 and offers a view of how the ongoing drought relates to past water resource variability in this region.
Increased temperatures and decreased precipitation, especially low summer monsoon precipitation (e.g. Griffin et al., 2013; Woodhouse et al., 2013), since the turn of the 21st century have likely caused one of the most severe low-flow regimes in the past 700 years on the Pecos River. The 3-year-long 2011–2013 dry event ranks as the second most intense (m3 s−1 yr−1) of all 2+ year dry events below the instrumental mean at −40 m3 s−1, and is only eclipsed by the shorter duration 1684–1685 at 44 m3 s−1. As recently noted in Colorado (e.g. Udall and Overpeck, 2017; Woodhouse et al., 2012), climate conditions since the year 2000 have not only been dry but also marked by increased temperatures as well. Over the period 1906–2012, Woodhouse et al. (2012) showed that higher temperatures from March to July often have a significant negative impact on annual Colorado streamflow. Udall and Overpeck (2017) showed that annual Colorado River flow between the years 2000 and 2014 was 19% below the long-term mean (1906–1999), ranking as the worst drought of the instrumental period. Contemporary with the current unprecedented drought is above-average temperatures (0.9°C above the 1906–1999 average) that exacerbated already dire flow conditions on the Colorado River, and this increased temperature effect likely stems to the Pecos River as well.
Conclusion
The Pecos River reconstruction provides a paleo-perspective of water resource availability across the eastern portion of New Mexico for the past ca. 700 years. Our record suggests that the gage record adequately captures the full range and variability of drought and pluvial conditions in the basin, at least over the reconstructed period. The 2000–2013 drought caused the most severe low-flow regime on the Pecos River since 1310 CE, with short-term extreme dry years (2002) that mirror conditions experienced during the peak of the 16th century Megadrought (1579–1580). An important consideration for the Anton Chico reconstruction is the location of gage within the PRB and what that means for representation of flow conditions in relation to past droughts in lower reaches of the basin. With the steady wet-to-dry gradient experienced by the Pecos as it flows from its headwaters south to Lake Amistad, our reconstructed flow values likely represent best-case scenarios with regard to the entire basin. Stakeholders for the efficient appropriation of Pecos River water include the Governments of New Mexico and Texas, the Carlsbad Irrigation District, environmental groups like the Pecos Valley Artesian Conservancy District, and residents and farmers in the basin. Given the increasing importance of water supply in this dry region under the influence of climate change, water disputes are likely to continue into the future among stakeholders. Providing a historical context of streamflow variability indicates that the PRB has experienced extreme changes in water availability over the last 50 years. The extreme flow variability during the 20th century and recent declines during the 21st century demonstrate that water resource managers had to learn to appropriately allocate water resources under difficult conditions, and are likely poised to handle the challenges of the future. Yet, increased variability combined with projected increased temperatures and decreased precipitation brought on by human-induced climate change will most likely create scenarios of heightened water scarcity in the near future that have no analog, at least over the past ca. 700 years.
Footnotes
Acknowledgements
We thank Dr Trevis Matheus, James Dickens, Lamar Gillespie, Eric McGregor, Kayla Pendergrass, Nathan Maxwell, George Harley, and Lola Harley for assistance in the field and laboratory. We also thank the many contributors to TreeFlow (![]() ) and the International Tree-Ring Data Bank. Early drafts of this manuscript were improved by two anonymous reviewers and we appreciate their time and efforts.
) and the International Tree-Ring Data Bank. Early drafts of this manuscript were improved by two anonymous reviewers and we appreciate their time and efforts.
Funding
The author(s) received no financial support for the research, authorship, and/or publication of this article.
References
Supplementary Material
Please find the following supplemental material available below.
For Open Access articles published under a Creative Commons License, all supplemental material carries the same license as the article it is associated with.
For non-Open Access articles published, all supplemental material carries a non-exclusive license, and permission requests for re-use of supplemental material or any part of supplemental material shall be sent directly to the copyright owner as specified in the copyright notice associated with the article.