
Abstract
The course of the ‘Little Ice Age’ (LIA) in Scandinavia is characterized by large glacier advances that started at about AD 1300 and culminated at about AD 1750. The end of the LIA is marked as an unprecedented and ongoing glacier retreat that accelerated from the early 20th century. The course of the LIA is here presented based on fluctuations of Austerdalsisen, the largest valley outlet glacier draining the Austre Svartisen (Østisen) ice cap, Nordland, northern Norway. During the LIA glacierization, Austerdalsisen separated into two branches, and relative to the present glacier terminus, a western valley glacier advanced more than 4 km, whereas a SE valley glacier advanced about 3 km. At present, meltwater from Austerdalsisen drains towards SE. If the glacier obtains a critical magnitude, however, most of the meltwater is drained westwards across a higher overflow gap. Based on radiocarbon-dated lake sediments, distal proglacial glaciolacustrine/glaciofluvial sediments and historical observations, the course and chronology of the deglaciation following the LIA glacier maximum at Austerdalsisen are established. Because of high sedimentation rates due to low local bedrock resistance to glacier erosion beneath Austerdalsisen, however, cores from distal glacier-fed lakes covering the entire LIA/Holocene are hard to retrieve. Hence, an inverse approach to reconstruct the entire course of the LIA glacierization at Austerdalsisen is performed by suggesting little input of glacier-meltwater-induced sediments to the SE distal glacier-fed lake Litl Røvatnet, whenever Austerdalsisen rerouted meltwater westwards. If the terminus of Austerdalsisen was near the critical magnitude threshold, regular glacier lake outburst floods (GLOFs) towards SE occurred.
Keywords
Introduction
In the European Alps, the ‘Little Ice Age’ (LIA) glacierization is regionally defined to have occurred ca. AD 1300–1950 when extended glaciers were larger than before or since (e.g. Holzhauser, 1997; Matthews and Briffa, 2005; Solomina et al., 2016). Svartisen (ca. 367 km2) at the western coast of Nordland, northern Norway (Figure 1), is the largest ice-covered area in northern Scandinavia and consists, at present, of the two ice caps Vestre Svartisen (Vestisen; ca. 219 km2) and Austre Svartisen (Østisen; ca. 148 km2; Andreassen et al., 2012). The termination of the LIA glacierization in the Svartisen region, northern Norway, is marked by an unprecedented and still ongoing glacier retreat that commenced during the late 19th century. Several studies from the region conclude that the LIA glacier advance was the largest (e.g. Jansen et al., 2016; Karlén, 1979; Winkler, 2003; Worsley and Alexander, 1975, 1976), or among the largest (e.g. Bakke et al., 2010; Griffey and Worsley, 1978) during the entire Holocene. This implies that even if a large amount of information is available regarding the timing and extent of the regional LIA glacier maximum (Bakke et al., 2010; Innes, 1984; Karlén, 1979; Winkler, 2003), and the subsequent deglaciation (De Seue, 1876; Granlund and Lundqvist, 1936; Jansen et al., 2016; Liestøl, 1956; Rabot, 1935; Rekstad, 1892, 1893, 1912; Theakstone, 1965, 1988, 1989, 1990, 2010; Theakstone and Knudsen, 1981, 1986), most older ice-marginal features were erased by the LIA glacier advance(s) (conceptual discussion given in Kirkbride and Winkler (2012)). Hence, continuous reconstructions of past Holocene glacier fluctuations within the region are based on analyses of sediments from suitable distal glacier-fed lakes at Høgtuvbreen, 22 km to the SW and at Austre Okstindbreen about 60 km to the SE; Figure 1b; Bakke et al., 2010; Jansen et al., 2016). Except for two moraines overridden by the LIA glacier maximum at Engabreen, a NW valley outlet glacier from Vestre Svartisen (Worsley and Alexander, 1975, 1976), little is known about pre-LIA glacier maximum fluctuations at Austre- and Vestre Svartisen.

Overview maps (a) and (b) showing the geographical context of the study area. In Figure 1c, the study area with key localities is shown. The black line shows the extent of Austerdalsisen during the suggested LIA glacier maximum, and the dashed line shows the approximate maximum position during glacier lake outburst floods (GLOFs) from the ice-dammed lake Austerdalsvatnet towards SE (from Liestøl, 1956). Note the position of Litl Røvatnet at an altitude of ca. 46 m at the mouth of Svartisdalen. The dashed line along the northern part of Røvassmoen in Figure 1c indicates a meltwater channel suggested to connect the river Blakkåga at the mouth of Blakkådalen with Litl Røvatnet during major flood events.
With an area of ca. 55.41 km2, Austerdalsisen (formerly written ‘Østerdalsisen’) is the main valley outlet glacier draining the southern sector of Austre Svartisen and the largest glacier unit based on the drainage area in mainland Norway (Andreassen et al., 2012). Based on field observations at the end of July/early August 1873, the glaciologist/meteorologist Christen De Seue (1876: 250, translated and modified from Norwegian) noticed a marked difference between the meltwater stream from Austerdalsisen and the glacier meltwater stream Blakkåga from the neighbouring Blakkådalen. Despite draining a much larger glacier area, the meltwater from Austerdalsisen was transparent compared with the greyish-coloured and turbid meltwater from Blakkådalen (draining among the other valley outlet glaciers Fingerbreen and Lappbreen from Austre Svartisen). Only in the innermost part of Svartisvatnet next to the calving Austerdalsisen, De Seue (1876) observed the distinctive signature of glacier meltwater, and until a radical change took place the summer of 1941, Svartisvatnet was described as a good lake for fishing (Holmsen, 1949). De Seue (1876) explained the observations by a long residence time for the glacier meltwater in the 4-km-long Svartisvatnet. Even though Austerdalsisen is much smaller at present, the entire Svartisvatnet had a greyish and turbid appearance in July/August 2016. Hence, the observations of De Seue (1876) and Holmsen (1949) are likely to have another explanation.
During the LIA glacierization, Austerdalsisen progressed along Burfjellet as a piedmont-type glacier with two distinct glacier tongues in the southeastern and western sector of the outlet glacier, respectively (Figure 1). When the western glacier tongue obtained a critical magnitude, water flow to the east was limited and most of the sediment-laden meltwater from Austerdalsisen was routed along the northern margin via the ice-dammed lake Austerdalsvatnet towards a local water divide/overflow gap (OG) at an altitude of ca. 273 m before entering the distal glacier-fed lake Glomdalsvatnet (altitude 126 m) to the west (e.g. Holmsen, 1949; Liestøl, 1956). Hence, only a limited amount of meltwater from Austerdalsisen drained across a local water divide at an altitude of 212 mm Svartisåga. As a result, the input of glacier-meltwater-derived sediments to the distal glacier-fed lakes Svartisvatnet (altitude ca. 74 m) and Litl (little) Røvatnet (altitude ca. 46 m) along Svartisåga was low relative to the discharge westward. Hence, the observations of De Seue (1876) and Holmsen (1949) support the idea of a westward drainage of most of the meltwater from Austerdalsisen whenever the glacier obtained a critical magnitude.
Based on lichenometric dating using growth rates of the Rhizocarpon subgenus and historical observations, the course and chronology of the deglaciation following the LIA glacier maximum is fairly well known (De Seue, 1876; Granlund and Lundqvist, 1936; Jansen et al., 2016; Liestøl, 1956; Rabot, 1935; Rekstad, 1892, 1893, 1912; Theakstone, 1965, 1988, 1989, 1990, 2010; Theakstone and Knudsen, 1981, 1986). In general, however, very little is known about the history of Austerdalsisen prior to the LIA glacier maximum.
Mainly because of low resistance to glacier erosion by the local bedrock dominated by marble and schist (see section ‘Study area’), cores from distal glacier-fed lakes in the Svartisen area covering the entire period since the early Holocene are difficult to retrieve (e.g. Seivåg, 2013).
However, to evade this problem, an inverse approach to reconstruct the LIA glacier advance of Austerdalsisen is done by using the two modes of meltwater drainage as a proxy reflecting the glacier front position. During mode 1, the terminus of the western branch is located somewhere in the middle between OG 273 m and the modern (original) threshold of Austerdalsvatnet towards SE at 212 m a.s.l. (see Liestøl (1956): Plate 1 and Figures 1–3a), and most of the meltwater is routed towards OG 273 and Glomdalsvatnet to the west. During mode 2, the terminus of the western branch of Austerdalsisen is at or smaller than the critical magnitude for westward routing of meltwater towards OG 273 m, and all glacier meltwater is draining towards SE at present. When the front of the western branch of Austerdalsisen was fluctuating at the mode 1/mode 2 transition (see Figure 1c), a number of historically documented GLOFs towards SE from the ice-dammed lake Austerdalsvatnet were recorded from AD 1941 to 1958 (except for AD 1943; Figure 4a and Table 1; Holmsen, 1949; Jackson and Ragulina, 2014; Liestøl, 1956; NRK, 1952; Theakstone, 1965 and references therein). The series of GLOFs ended when a flood-relief tunnel which provided a permanent outlet for Austerdalsvatnet at an altitude of 208 m was completed in 1959, some 65 m below the previous westward outlet of the ice-dammed lake at an altitude of 273 m. Table 1 shows years with recorded GLOFs and respective volumes of discharge. Although the volume of water discharged during the GLOFs between AD 1955 and 1958 was not measured, it is suggested that these GLOFs were at least as severe as the former because of the general retreat of the glacier front (Theakstone, 1965: with references).

Topographic map (Gradteigsmåling J.15 NØ 4, scale 1:50,000) by O Paulsen from 1897. Kartverket (Norges geografiske opmaaling). Altitudes on the map deviate from modern observations. Red star shows location of investigated outcrop section shown in Figure 5 just outside the suggested LIA glacier maximum of Austerdalsisen.
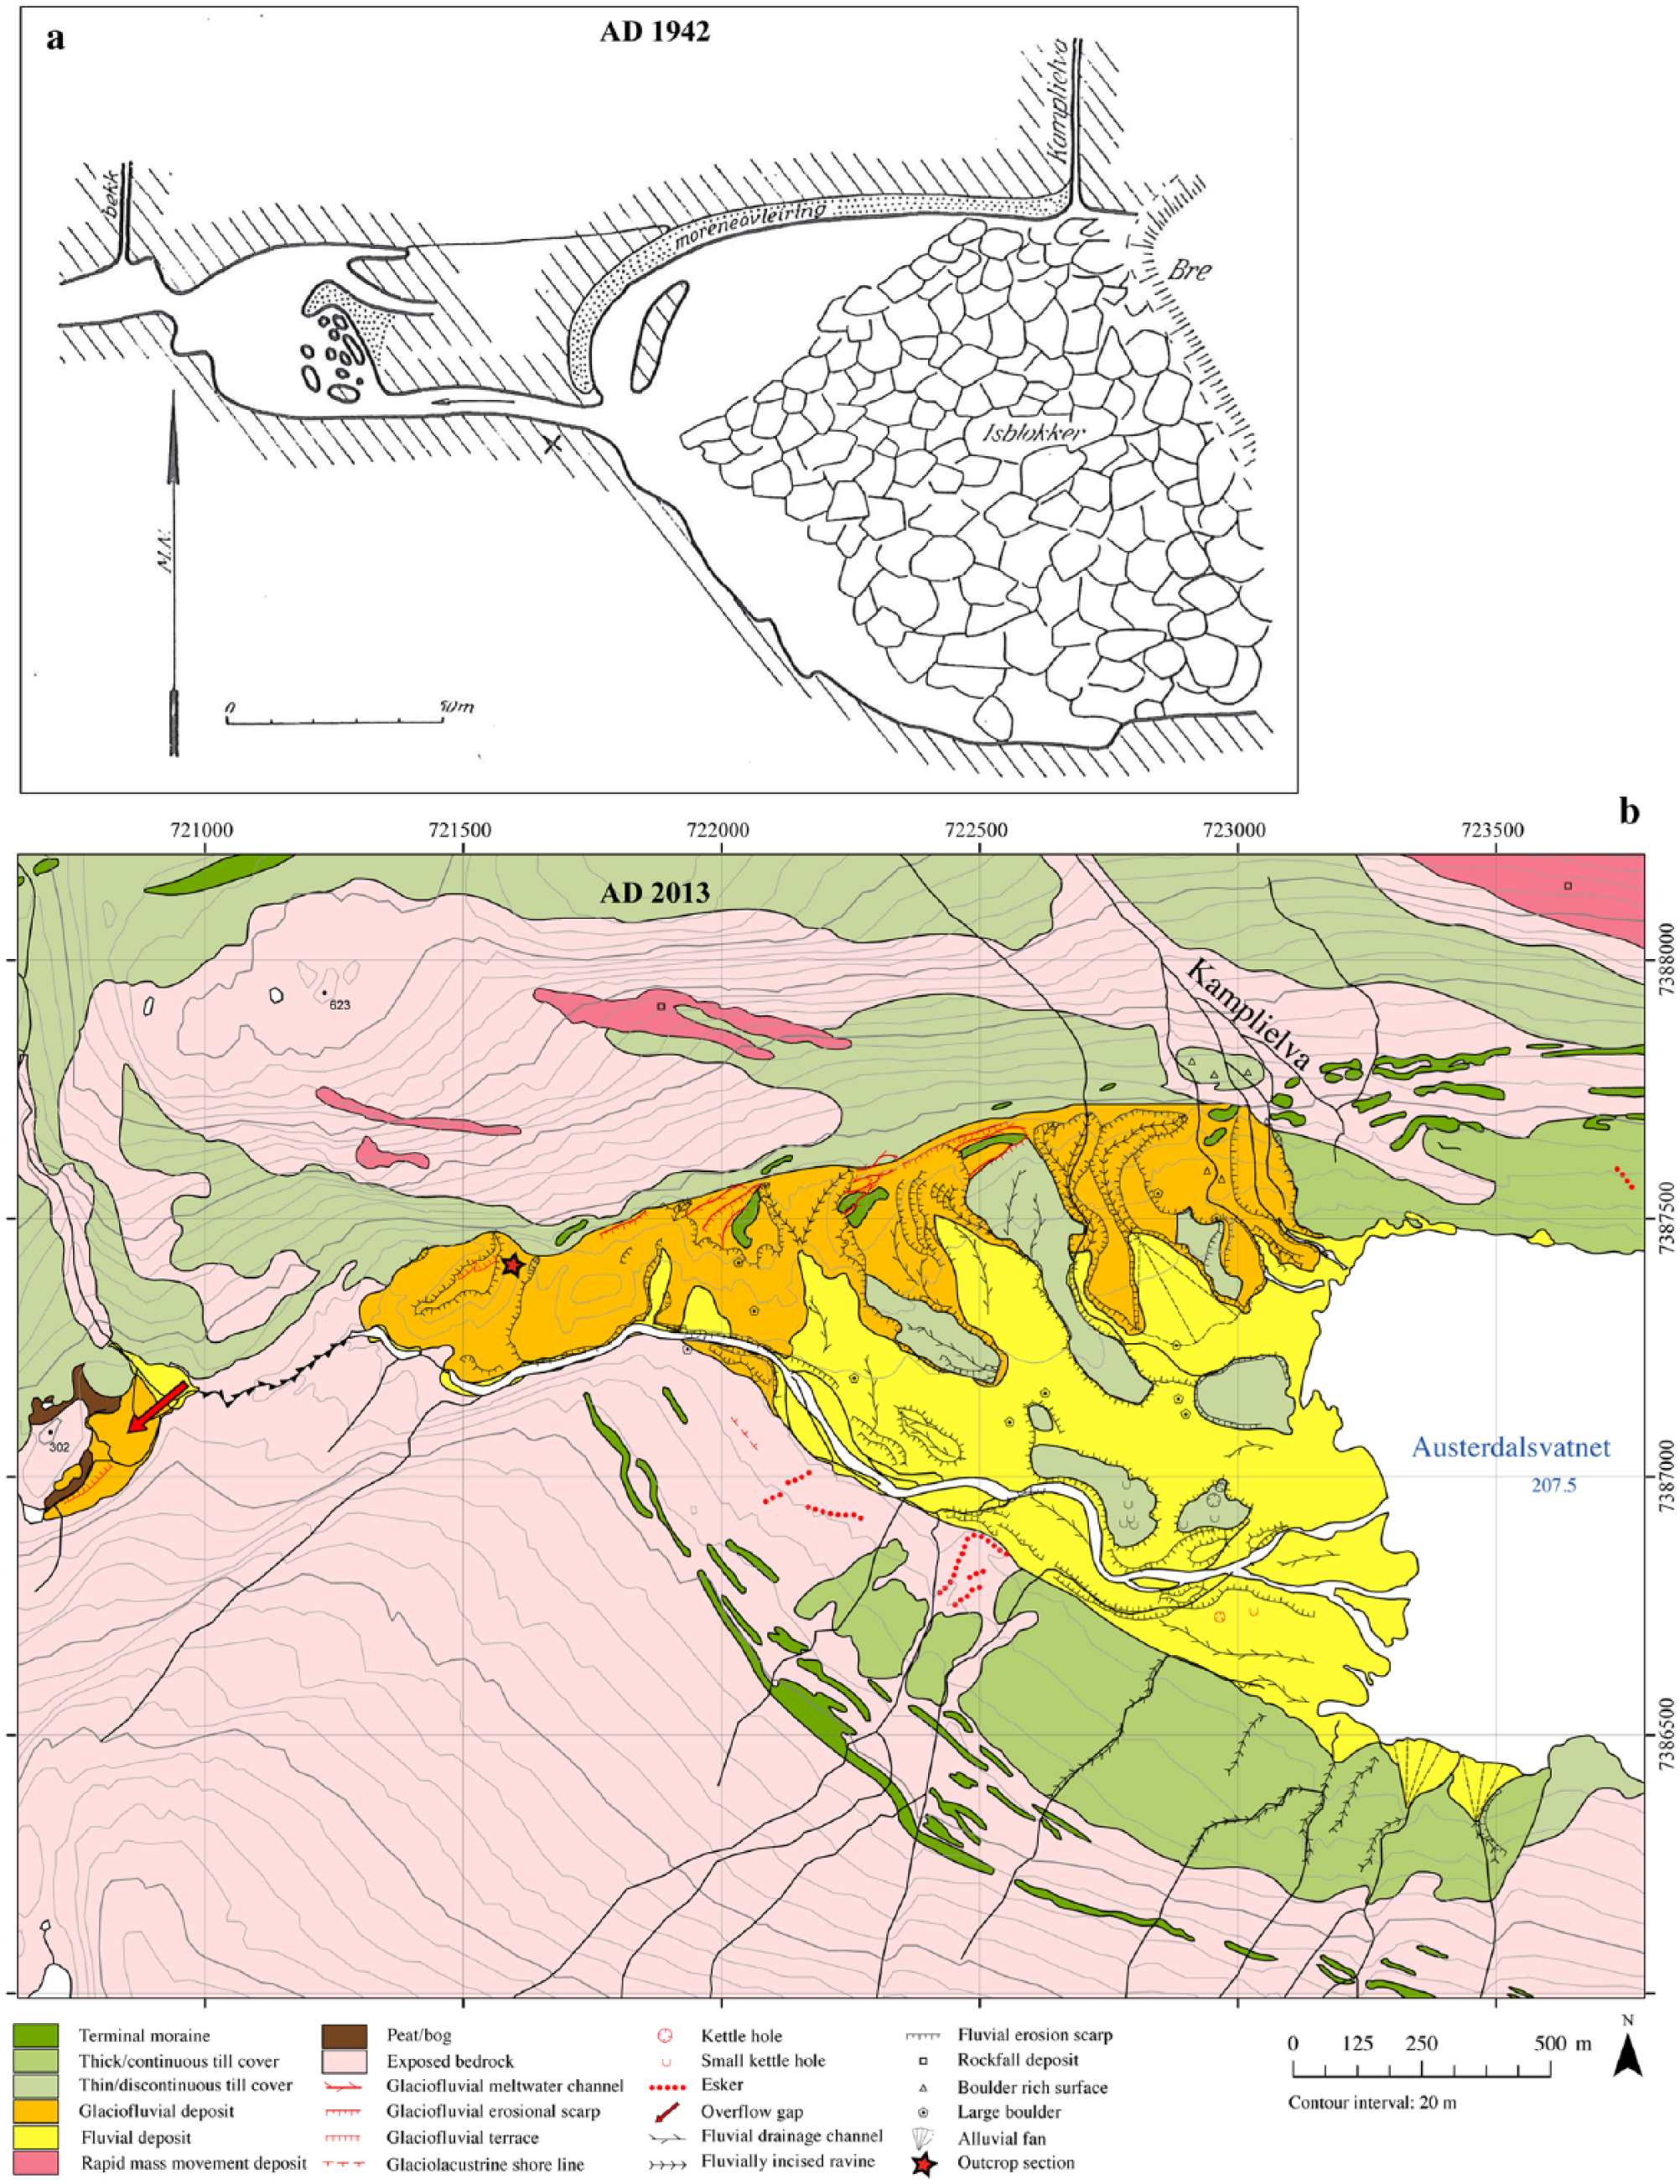
(a) Sketch map of the glacier-dammed lake between Austerdalsisen and the OG draining meltwater through the valley system to the west of the study area (Holmsen, 1949). (b) Quaternary geological map showing present landscape elements related to glacier advances and meltwater drainage. The scale between
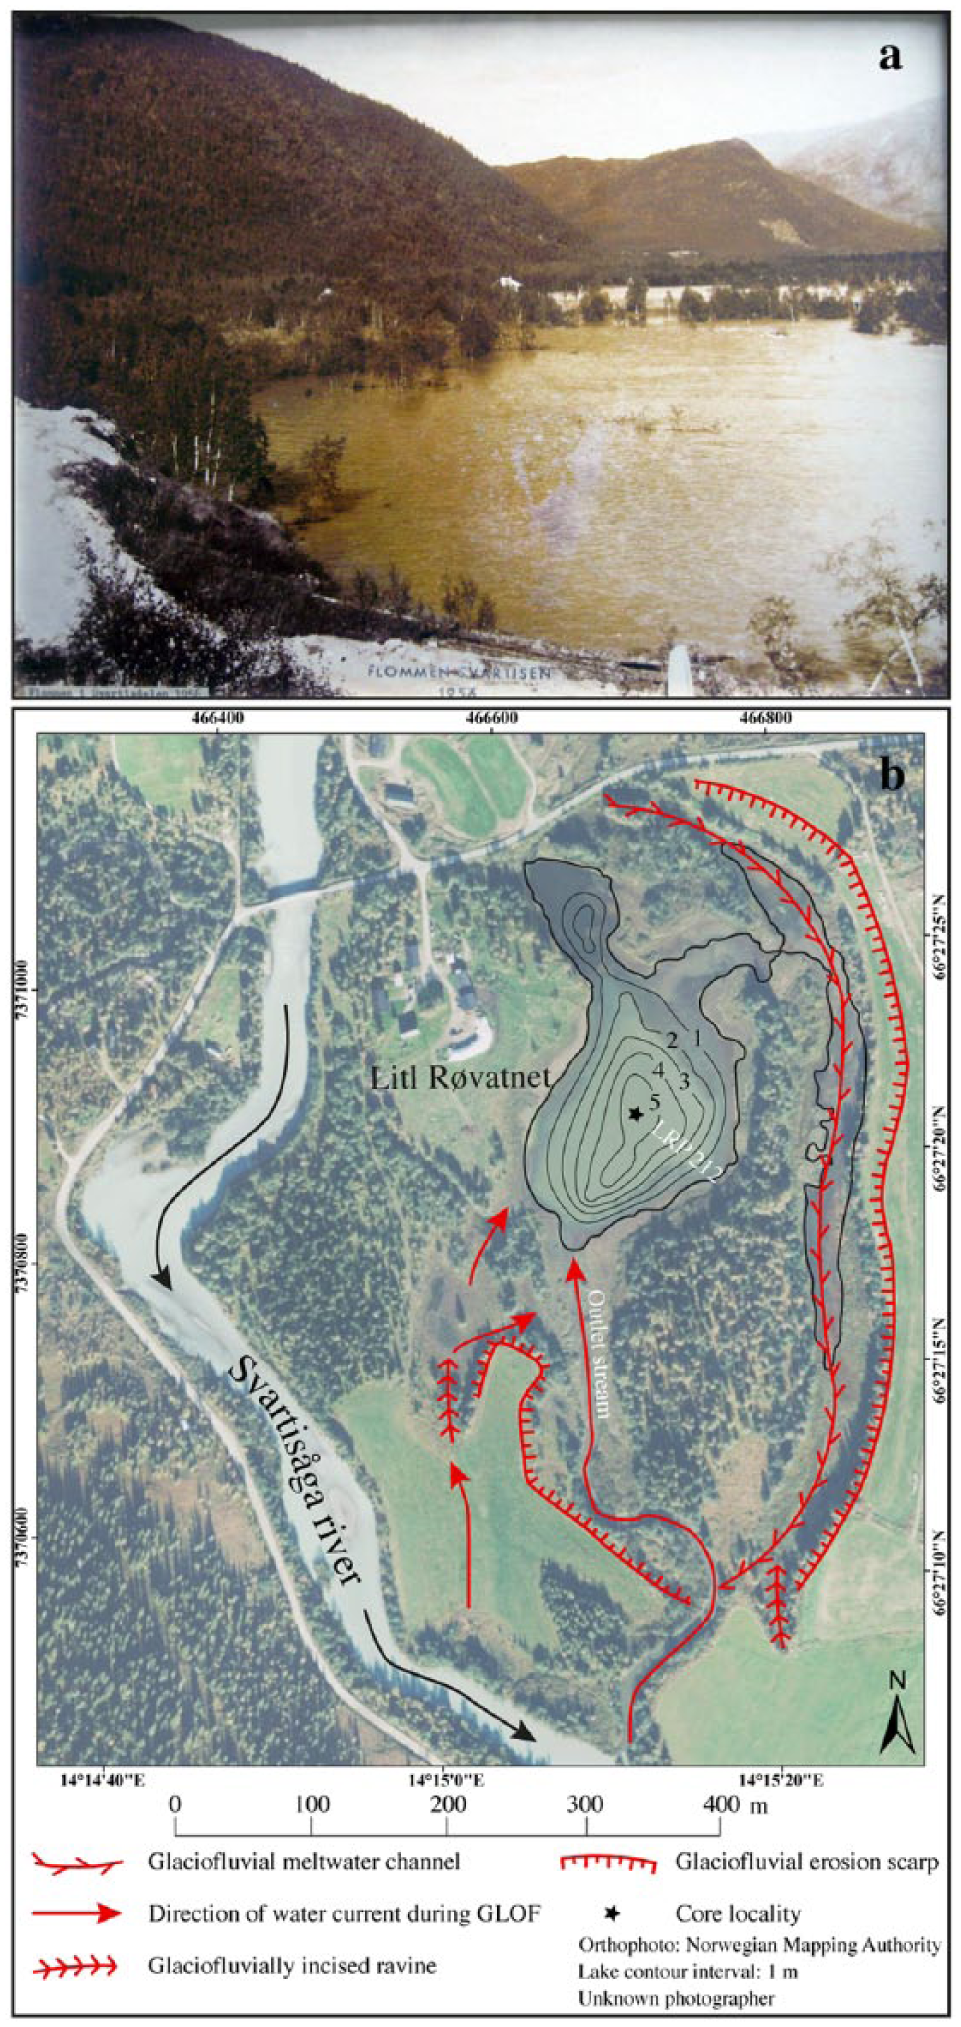
(a) Photograph showing a flooded Røvassmoen during the summer of AD 1956. The photograph was taken towards the east from the area between the bridge crossing the Svartisåga river and the farmhouses shown in Figure 4b. The northernmost basin of Litl Røvatnet is partly depicted in the photograph. (b) Orthophoto showing the location of Litl Røvatnet (altitude 46 m) relative to landscape elements associated with floods. Red arrows show flow direction of flood water based on northwards-sloping ravines and incised channels on the terrace surface to the south of the lake. The locality of core LRP 212 is plotted alongside depth contours in Litl Røvatnet. To the right of Litl Røvatnet, a suggested older meltwater channel is indicated.
Volumes of discharge estimated during GLOFs from the ice-dammed lake Austerdalsvatnet (after Holmsen, 1949; Liestøl, 1956).
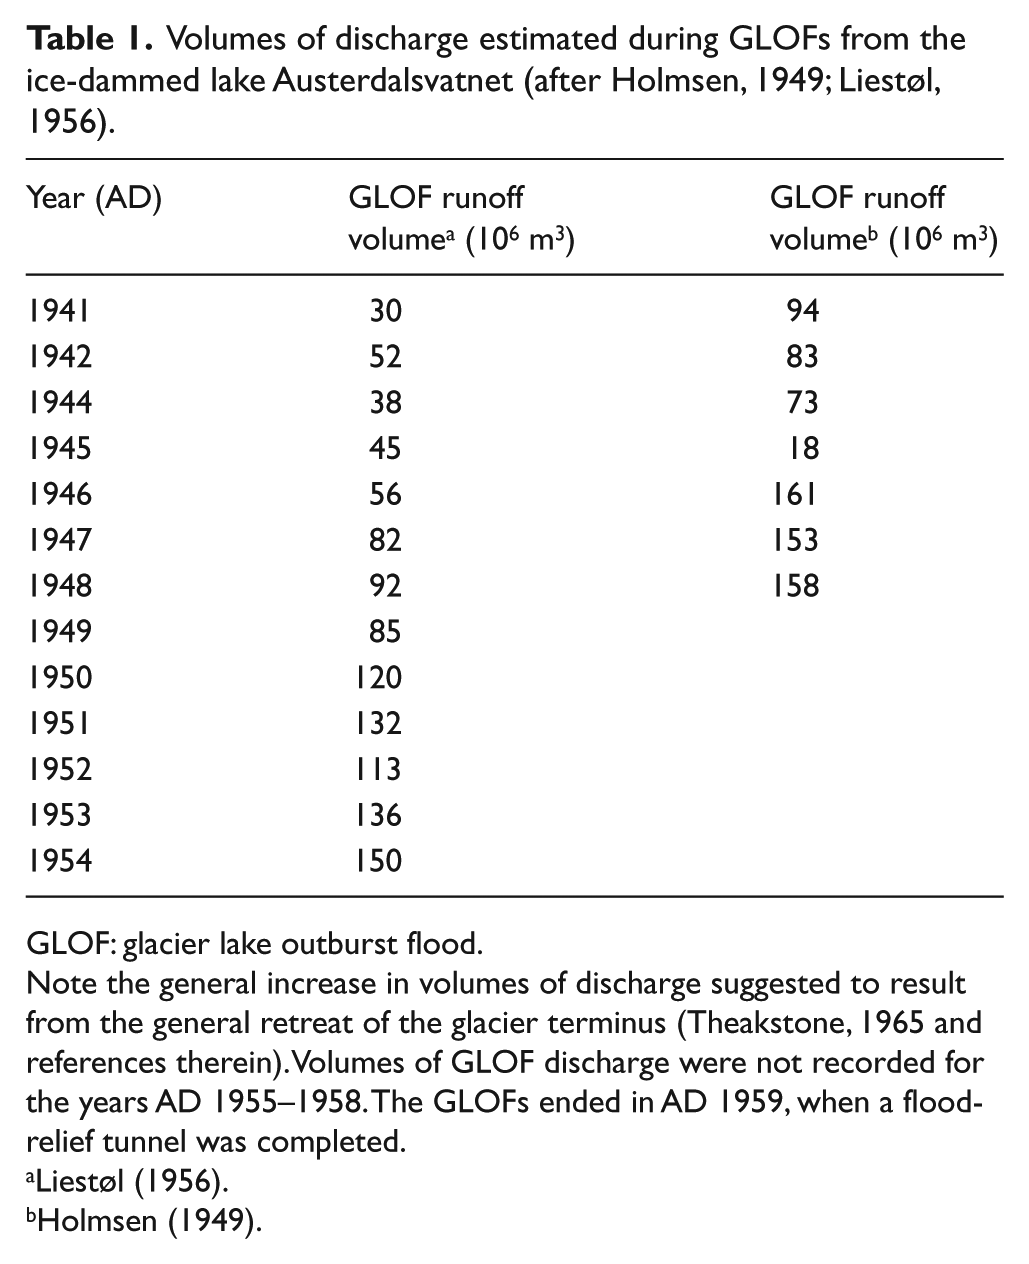
GLOF: glacier lake outburst flood.
Note the general increase in volumes of discharge suggested to result from the general retreat of the glacier terminus (Theakstone, 1965 and references therein). Volumes of GLOF discharge were not recorded for the years AD 1955–1958. The GLOFs ended in AD 1959, when a flood-relief tunnel was completed.
The main objective of this paper is to investigate and date the occurrence of the two modes of meltwater drainage from Austerdalsisen during the LIA glacierization. Finally, the reconstructed course of Austerdalsisen during the LIA glacierization was compared with well-dated LIA glacier reconstructions from Norway and the Alps, respectively.
Study area
With an area of ca. 55.41 km2, Austerdalsisen is the main valley outlet glacier draining the southern sector of Austre Svartisen and the largest glacier unit based on drainage area in mainland Norway (Andreassen et al., 2012). The outlet glacier is situated just south of the Arctic Circle at the western coast of Nordland, northern Norway (Figure 1). The area is generally mountainous with deeply incised glacially eroded valleys which, at present, are dominated by large meltwater streams from the Svartisen ice cap. Garnet schist and bands of quartzite and calcite marble that were deformed during the Caledonian orogeny dominate the bedrock geology of the investigated area (Søvegjarto et al., 1988).
The proximity to the Norwegian Atlantic Current and the interaction between arctic- and subtropical air masses converging at the arctic polar front dominate the present climate in the Svartisen area. Hence, depending on the latitudinal position of the arctic polar front, the local climate is characterized by two different states. One state is dominated by cold and dry arctic air masses, whereas the other state is dominated by moist and relatively warm subtropical air masses from south to southwest.
The weather station in Mo i Rana (st. no. 79480, 41 m a.s.l.), situated at about 20 km south of Austre Svartisen, recorded a mean annual temperature of 2.8°C and a mean annual precipitation of 1431 mm during the last normal period from AD 1961 to 1990 (Norwegian Meteorological Institute, 2016). The monthly mean temperature varies between −6.6°C in January and 13.2°C in July, while the monthly mean precipitation varies between 184 mm in October and 63 mm in May. Because of orographic precipitation, however, there are large regional variations, and a mean annual precipitation of about 4000 mm has been estimated for central parts of Vestre Svartisen (Schuler et al., 2008).
Methods
In this study, meltwater drainage along the western branch (mode 1) was studied and dated based on two cores retrieved from the former distal glacier-fed lake Glomdalsvatnet, and by investigating an exposed outcrop section, previously described by Theakstone (1976), in a lateral-to-proglacial ice-marginal glaciofluvial-/to glaciolacustrine delta suggested to have been deposited when Austerdalsvatnet was (more or less) occupied by Austerdalsisen (Figures 2 and 3a). Variations in the meltwater drainage towards SE (mode 2) were analysed and dated based on two cores retrieved from the distal glacier-fed lake Litl Røvatnet.
Quaternary geological mapping and stratigraphical investigations
Quaternary geological mapping was performed focusing on glacial- and glaciofluvial landforms, and with special emphasis on detailed field mapping in the area surrounding Litl Røvatnet and the deglaciated LIA glacier maximum foreland of the western branch of Austerdalsisen (Figures 1–3). Orthophotos (Series B2506MK and 13475) from the Norwegian mapping authority were used to delineate the field observations accurately using ESRI ArcMap 10.3. The generally barren mountainous areas were mapped using orthophotos.
The stratigraphy of a large (25–35 m high) lateral-to-proglacial glaciofluvial-/ to glaciolacustrine delta has been investigated in detail with special emphasis on grain-size distribution and sedimentological structures (Figure 5). The delta is suggested to have developed in front of the western branch of Austerdalsisen when the glacier front was situated just east of OG 273 towards Glomdalsvatnet (Figures 2 and 3b)
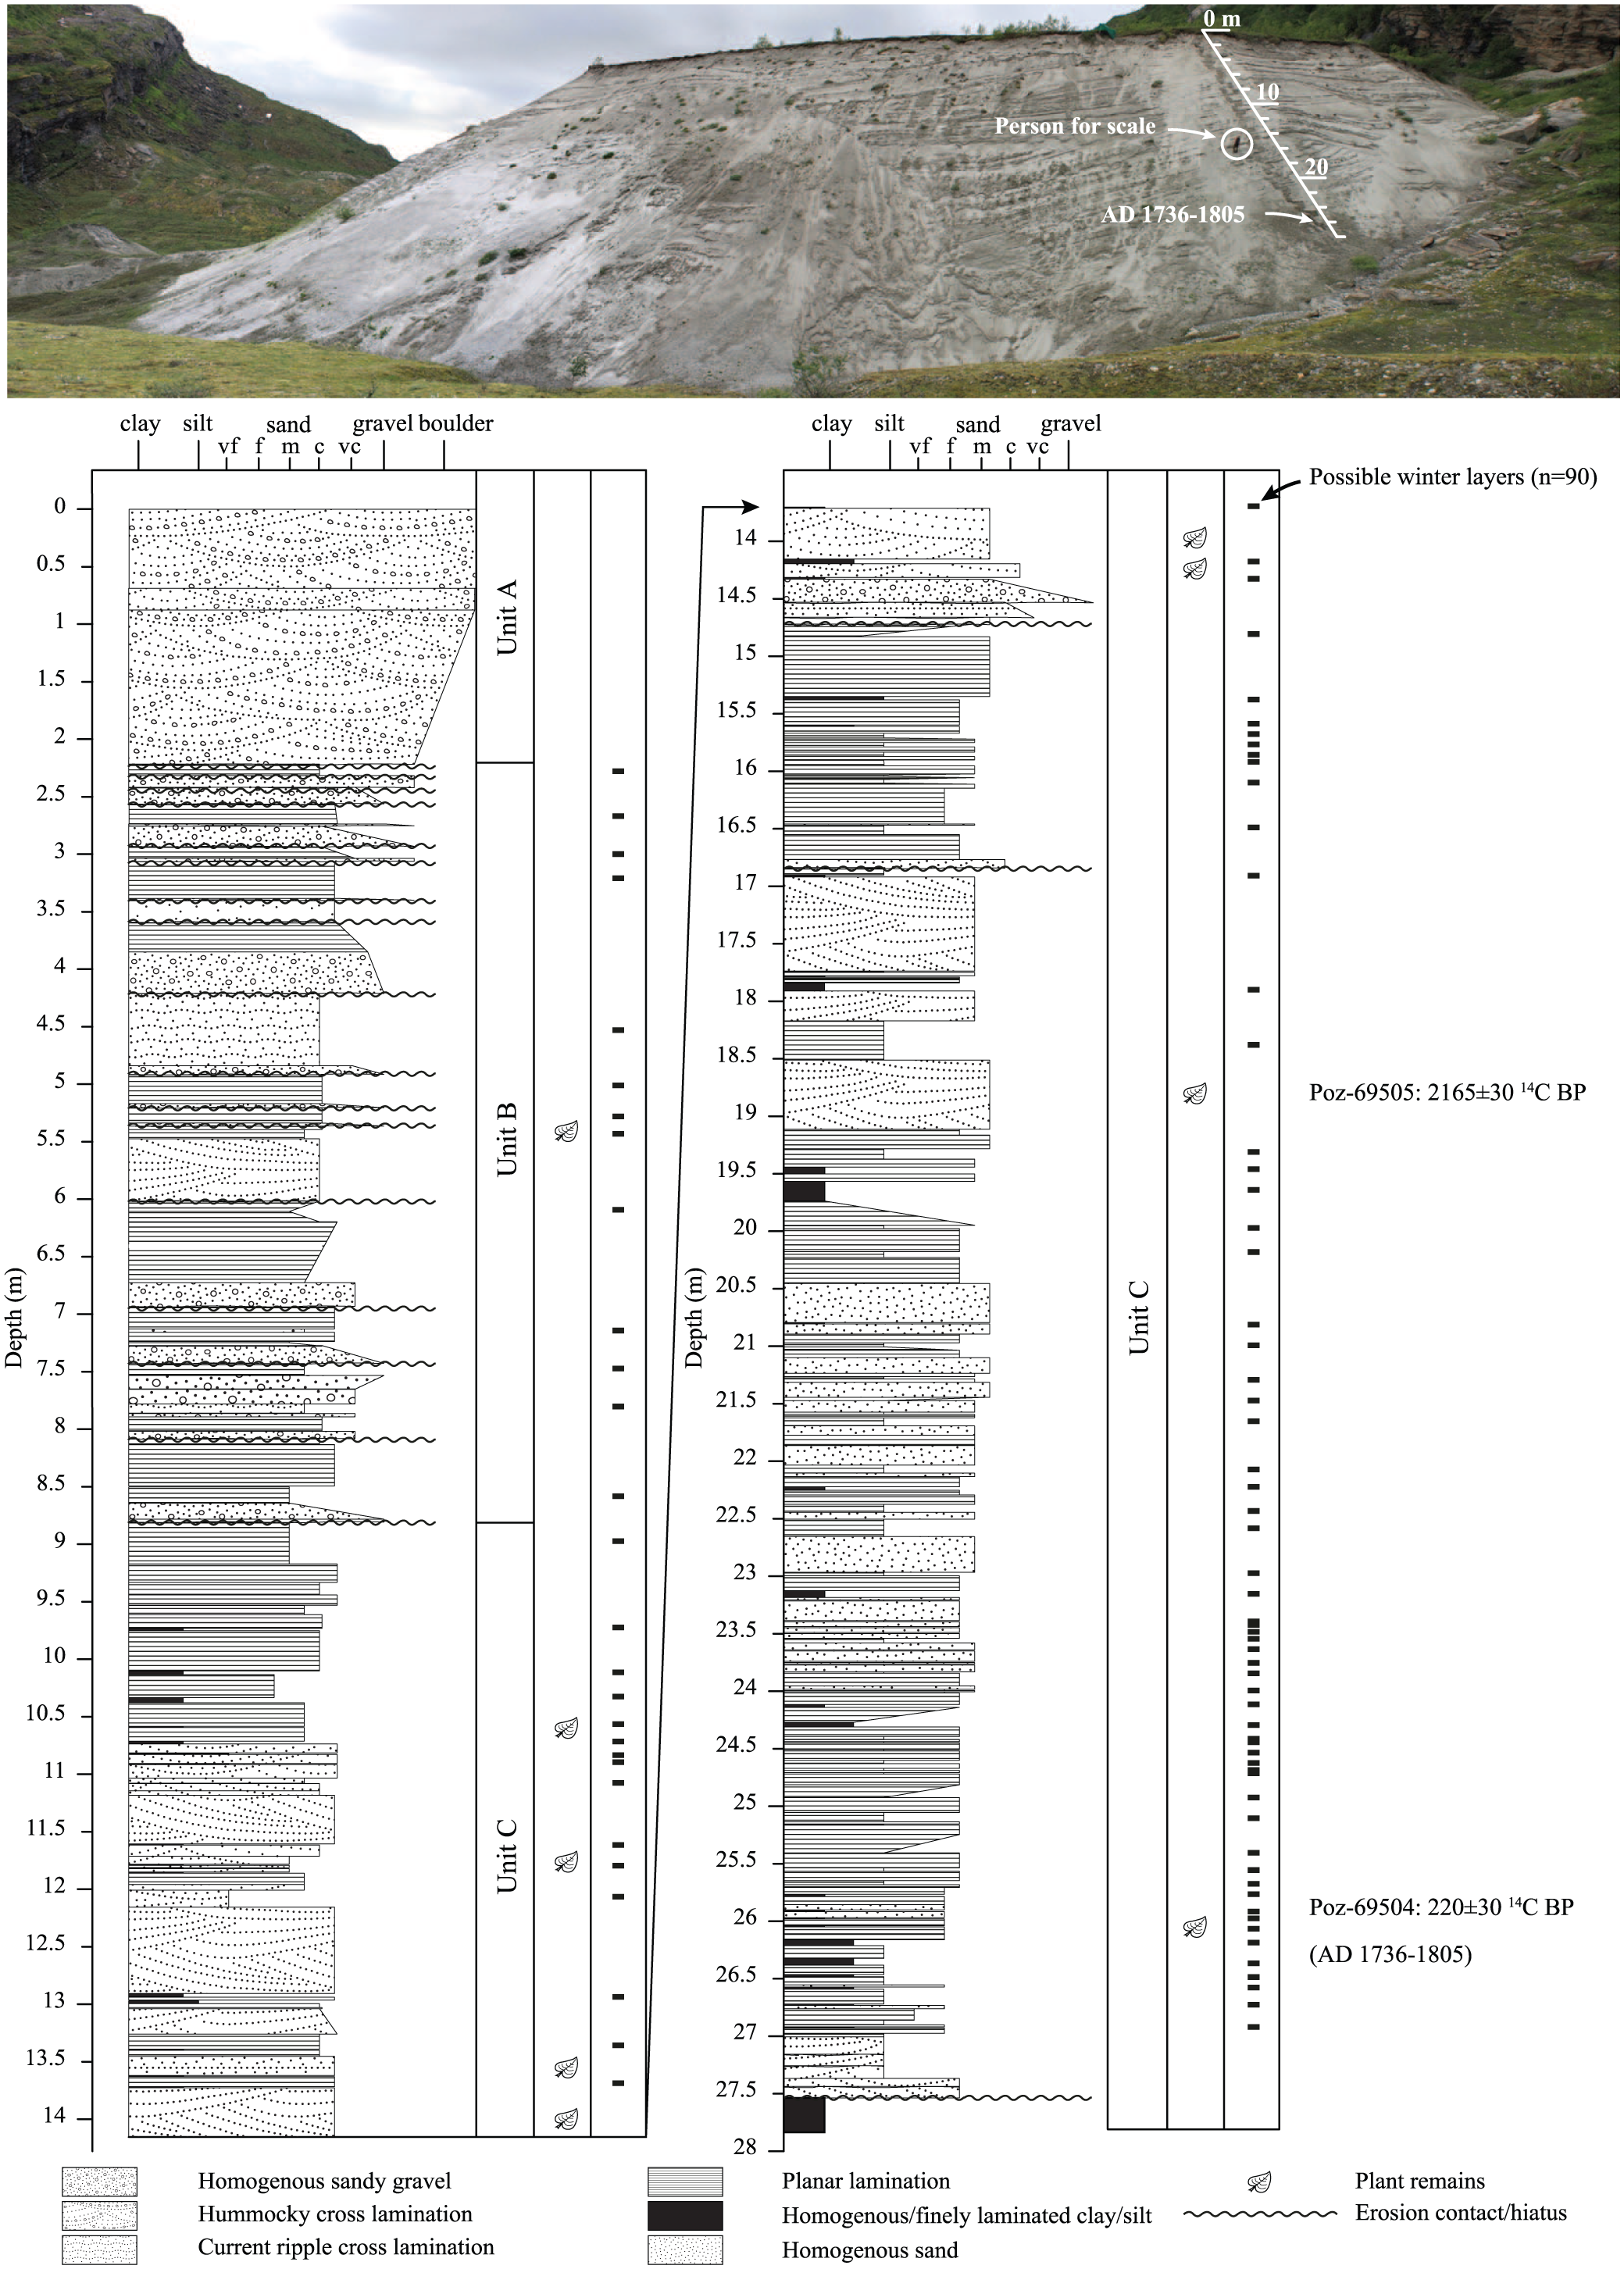
The upper panel shows the investigated outcrop section near the overflow gap towards Glomdalsvatnet (Figure 1). The lower panel shows the observed stratigraphy in the investigated outcrop section. Depths refer to a vertical scale. Note the AMS 14C-date of leaf fragments yielding an age of 220 ± 30 (AD 1736–1805) at a depth of about 26 m in the deposit (see Table 3), strongly linking the delta to the LIA glacier maximum and the following deglaciation at Austerdalsisen.
Lake sediment cores – Collection and analysis
The bathymetry of Litl Røvatnet (Figure 4b) was mapped using an echo sounder and GPS in order to locate suitable coring localities (Dahl et al., 2003). The 522-cm-long sediment core LRP 212 was retrieved using a raft-mounted, modified piston corer which can take up to 6-m-long cores with a diameter of 110 mm (Nesje, 1992). The core was divided into four sections in the field and transported vertically to reduce potential disturbance of the sediments because of internal flowing. The core was stored in a cold room (4°C) to minimize changes in the sediment structure owing to dehydration.
LRP 212 was analysed for magnetic susceptibility (MS), loss on ignition (LOI), dry bulk density (DBD) and x-ray fluorescence (XRF), including Ti, Si, K, Ca and Fe. MS was measured on the sediment surface between 0 and 290 cm depth at 0.2 cm intervals (n = 1450) using a Bartington MS2E sensor, whereas LOI and DBD were analysed between 0 and 196 cm at 0.5 cm steps (n = 392) following the procedure given in Heiri et al. (2001). DBD was obtained based on volume-specific samples (1 cm3) which were extracted and dried at 105°C for 12 h and weighed. To obtain LOI, the same samples were slowly heated to 550°C and combusted at this temperature for 1 h before cooling to room temperature in a desiccator and weighed.
XRF measurements were conducted between 0 and 242 cm at 0.02 cm steps (n = 12,100) using an ITRAX core scanner fitted with a Cr-tube. A 15-point running mean smoothing was applied to the dataset, and all parameters in the dataset were normalized and rescaled using a linear interpolation in AnalySeries 2.0.4.2 (Paillard et al., 1996). A correlation matrix showing the correlation between physical and geochemical parameters, including the PCA axes 1 and 2 against depth in LRP 212, is shown in Table 2.
Correlation matrix showing the correlation coefficient (ρ) between physical and geochemical parameters, as well as the PCA axes 1 and 2 against depth in LRP 212.

DBD: dry bulk density; LOI: loss on ignition; PCA: principal components analysis.
Age–depth relationship
The age–depth model from core LRP 212 in Litl Røvatnet (Figure 6) is based on 5 (8) samples of AMS 14C-dated terrestrial plant remains (Table 3), as well as three local time markers based on the core stratigraphy (see Discussion). The age–depth relationship was then modelled in the open source software R using the ‘Clam’ script (Blaauw, 2010). The depth-dependent ages are based on the IntCal13 age calibration curve and modelled using a smoothed spline, with a smoothing (λ) of 0.3 (Reimer et al., 2013). The model runs 1000 iterations, and the resulting point estimates are the weighted averages of all age–depth model-derived ages (Blaauw, 2010). Layers that are interpreted to represent episodic events, such as floods, are removed from the age–depth model using the automatic ‘slump’ function available in Clam.

Selected sediment parameters from LRP 212 are shown along with a photograph representing the visual core stratigraphy (left) and the AMS radiocarbon-based age model (right). The light green bands are suggested GLOF sediments, while the light grey bands are identified flood layers with no relation to GLOFs.
AMS radiocarbon dates from Litl Røvatnet, Glomdalsvatnet, the Austerdalsvatnet ice-marginal outcrop section and Litlvatnet (Figure 1).

All calibrated ages are presented with 1- or 2 sigma, the calibrated year AD/BC age ranges with relative area under probability distribution (2σ) in brackets, and the most likely calibrated year AD/BC age ranges. The AMS radiocarbon dates are calibrated based on Calib 7.10 (Reimer et al., 2013; Stuiver et al., 2016). Radiocarbon dates used for age–depth modelling and in the Discussion section are highlighted in italics. Date from Litlvatnet is recalibrated from Seivåg (2013). Stratigraphic inverted dates are only shown as radiocarbon dates.
Results
Mapping and outcrop stratigraphy
Deposits and landforms associated with glacier activity dominate the geomorphology of the valleys in the study area, although colluvial deposits cover some slopes. In general, the mountainous parts are dominated by exposed bedrock or have a discontinuous till cover. Along the gentle sloping northern side of the mountain Burfjellet and on both valley sides between Svartisvatnet and up to the present terminus of Austerdalsisen, some very distinct sets of marginal moraines can be traced nearly continuously (Figure 1c; Theakstone, 1989, 1990, 2010; Winkler, 2003). Many moraine ridges have, in addition, been mapped between the OG to the west and Austerdalsvatnet (Figure 3b). The vegetation cover is still significantly sparser in the area proximal to the outer marginal moraines.
Between Austerdalsvatnet and the OG to the west at an altitude of 273 m, large accumulations of glaciofluvial- and fluvially reworked sediments have been mapped (Figure 3b). About 25–35 m high terraces along the northern valley side are ranging in altitude between 275 and 277 m, and are incised with suggested abandoned subaerial glacial meltwater channels, indicating flow direction towards west. The terraces are suggested to represent the remains of a lateral-to-proglacial ice-marginal glaciofluvial delta that was deposited in the ice-dammed lake Austerdalsvatnet between the western margin of Austerdalsisen and the western OG. Three distinct ridges, consisting of mostly sand and gravel with some scattered large boulders, are suggested to be marginal moraines on the terrace surface. A fluvial erosion scarp dissecting the terrace clearly indicates that the moraines are deposited on top of the delta deposits below. Hence, the glacier advanced across the top of the terrace without destroying it (Figures 1c, 2 and 3b).
The lower part of this area is draped with a thin cover of hummocky till and punctuated with suggested kettle holes in the fluvially reworked deposits. Numerous ridges consisting of well-sorted sandy gravel along the low-lying parts of both valley sides, and orientated towards the valley bottom, are suggested to be engorged eskers (Mannerfelt, 1945), reflecting a shift in subglacial meltwater drainage from west towards SE (Figures 1c, 2 and 3b).
The northern valley side of Austerdalen, situated between the western OG and Glomdalsvatnet, is characterized by steep valley sides with a thin cover of rock-fall deposits and small patches of discontinuous till, whereas the valley floor is dominated by exposed bedrock, except for small areas covered by glaciofluvial deposits. A distinct marginal moraine is mapped at an altitude of 510 m in a small tributary valley along the northern side of Austerdalen. The orientation and dip direction of the moraine indicate that it was deposited up-valley by a larger valley glacier occupying Austerdalen.
A boulder-rich marginal moraine has also been mapped just off the northern shore of Glomdalsvatnet. Ground penetrating radar (GPR) profiles using a 25-MHz antennae in Glomdalsvatnet (n = 14) mostly yielded no results because of limitations regarding penetration depth in water. Some profiles, however, reveal a subaqueous ridge, with numerous point reflectors running along the entire length of the northeastern part of the lake between the northern and southeastern lakeshore. This ridge is suggested to be a terminal moraine, which is consistent with the observed moraine off the northern shore of the lake. In addition, the GPR profiles indicate delta propagation roughly 250–300 m into Glomdalsvatnet from the present inlet stream from Austerdalen. Gently sloping subaqueous sand banks surrounding most of Glomdalsvatnet indicate that the lake contains a large volume of sediments.
A 5.6-m-long sediment core was retrieved from the suggested backwater zone in the north-western sector of Glomdalsvatnet. The sediments mostly consisted of well-sorted fine-to-medium sand, but were disturbed throughout most of the core. An undisturbed sequence of laminated fine-to-medium sand near the bottom of the core at a depth of 460 cm is dated to 240 ± 30 14C yr BP (AD 1632–1681; Table 3), thus indicating a very rapid LIA sedimentation rate in Glomdalsvatnet. Further downstream in Glomdalen, a radiocarbon date of 225 ± 30 14C yr BP (AD 1736–1805) near the base of a 452-cm-long sediment core from Litlvatnet at an altitude of 44 m (Figure 1) indicates a similar sedimentation rate (Seivåg, 2013; Table 3).
The valley SE of Austerdalsisen, Svartisdalen, is characterized by steep valley sides which is narrowing eastwards. Both valley sides are dominated by discontinuous till with some scattered rock-fall deposits on the northern slope. Four distinct marginal moraines are mapped in Svartisdalen, whereof the two westernmost moraines are associated with the LIA glacier maximum and subsequent halts or advances during the following deglaciation (Theakstone, 2010; Winkler, 2003: with references). The two easternmost moraines are situated near the outlet of Svartisvatnet and just west of where the tributary stream from Brundalen enters Svartisåga, respectively (Figure 1c). It is suggested that these moraines probably correspond to the marginal moraine(s) beyond the LIA glacier maximum in Glomdalsvatnet/Austerdalen. The age of these two moraines is not known, but they were probably formed prior to the Neoglacial based on lichenometric dating (Winkler, 2003) and Holocene glacier reconstructions from distal glacier-fed lakes beyond the LIA glacier maximum in the region (Bakke et al., 2010; Jansen et al., 2016; Winkler, 2003).
Røvassmoen is a wide, low-relief and partly relict sandur plain situated at the intersection between the valleys Røvassdalen, Blakkådalen and Svartisdalen (Figure 1). Well-preserved terraces of suggested glaciofluvial origin are present up to an altitude of about 110–105 m at the mouth of Blakkådalen, whereas smaller and more indistinct glaciofluvial terraces are present up to about the same elevation at the mouth of upper Røvassdalen and along Svartisdalen. Røvassmoen gently dips towards S–SW from a fan, with an apex at an altitude of ca. 55 m at the mouth of Blakkådalen until it ends at an altitude of ca. 50 m (about 6 m above the local mean river level during summer time in Røvassåga) at a narrow passage near Bjørnneset (Figure 1c), indicating that this valley is the main contributor of glaciofluvial sediments to Røvassmoen. Several large depressions, either water filled or overgrown with peat, and numerous channels are present on the surface of Røvassmoen. It is suggested that the depressions are kettle holes, indicating the presence of stagnant glacier ice during the formation or the last modification of the sandur plain, and the channels are suggested to be relict meltwater streams.
Litl Røvatnet (46 m a.s.l.) at the mouth of Svartisdalen consists of two almost separated parts. The main western part consists of very small, nearly circular and shallow northern basin, and a larger, deeper and circular southern basin, whereas the eastern part consists of an elongated, shallow and narrow depression weakly curving around the main western basin (Figure 4b). The area between eastern and western Litl Røvatnet is dominated by a 4–6-m-high and distinct ridge slightly curving around the main western basin. A wider ridge, but not so distinct, is found west of Litl Røvatnet. From the fan apex at the mouth of Blakkådalen, a shallow channel with a small stream in the westernmost part can be followed along the mountain slope at northern Røvassmoen towards the western part of Litl Røvatnet.
Taking into account the present water depth and observations from core LRP 212 in Litl Røvatnet (see Figure 6), the western basin of Litl Røvatnet is overdeepened by about 13 m relative to the general elevation of the sandur plain surrounding the lake. Based on these observations, the ridges are suggested to be (washed) remnants of marginal moraines deposited at the terminus of a glacier just beyond the mouth of Svartisdalen, the main western basin is suggested to be a kettle hole formed by stagnant ice, and the eastern basin is most likely a relict meltwater channel shaped by meltwater from Svartisdalen flowing east of the stagnant ice in the western basin and cut into the raised sandur plain further eastwards (Figure 4b).
Northwards dipping ravines and small channels are mapped from Svartisåga towards the southern shore of the main western basin in Litl Røvatnet (Figure 4b). During GLOFs from Austerdalsvatnet, the meltwater first entered the ca. 4-km-long Svartisvatnet which (probably) moderated the first meltwater pulse towards SE when the ice dam broke. Then the meltwater followed Svartisåga through the narrow Svartisdalen before entering the wide Røvassmoen. At Røvassmoen, the meltwater was piled-up because of the narrow outlet at Bjørnneset ca. 6 km further downstream of Litl Røvatnet (Figure 1c). The northwards dipping gullies from Svartisåga towards the southern shore of western Litl Røvatnet is therefore suggested to reflect the pile-up of meltwater on Røvassmoen during GLOFs at Bjørnneset. Hence, Litl Røvatnet was a backwash for meltwater during GLOFs from Austerdalsvatnet, and thus, acted as an efficient sediment trap.
This is confirmed by the photograph in Figure 4a, showing that Litl Røvatnet and the sandur plain east of the lake were flooded subsequent to the GLOF the summer of AD 1956. The tranquil water surface indicates that the rapid meltwater flow from Svartisdalen during the GLOF more or less followed the present course of Svartisåga to the west of Litl Røvatnet (Figure 4b) and not entered the lake directly. Instead, the floodwater entered the lake from the south as the water level on Røvassmoen rose because of the pile-up at Bjørnneset. The northward dipping ravines and suggested small meltwater channels from Svartisåga towards Litl Røvatnet are elevated relative to the present outlet channel from the lake, and thus, indicate a minimum rise in water level of at least 3 m above normal water level at Røvassmoen during at least the most extensive GLOFs.
Outcrop section near OG towards Glomdalsvatnet
Along the northern valley side between Austerdalsvatnet and OG 273 towards Glomdalsvatnet (Figures 1c, 2, 3a, b and 5), several 25–35-m-high-exposed sections in a terrace suggested to be part of a lateral-to-proglacial glaciofluvial delta reveal layered sediments of clayey silt to bouldery gravel. The sedimentology of the sections has previously been described in detail by Theakstone (1976). To avoid disturbance by Austerdalsisen, the investigated section in this study is situated beyond the suggested LIA glacier maximum (see Figures 2 and 3b).
Unit C in Figure 5 represents the sediments from 27.84 to 8.78 m depth below the top of the section. The unit is characterized by discrete thin layers of planar-laminated clayey silt to fine sand that separate generally thicker layers of homogeneous to planar-laminated medium to very coarse sand. The thicker and more coarse-grained layers are generally homogeneous without visible structures or weakly laminated, except for eight layers with trough cross laminations in the middle- to upper part of the unit, and two layers near the base of the section. Three erosional contacts are identified in unit C: one near the base and two in the middle part of the unit, respectively. An overall upwards coarsening in grain size is observed throughout unit C.
Unit B represents the sediments between 8.78 and 2.23 m depth below the surface and consists of layers alternating between coarse sand and very coarse sand to gravel. Discrete layers with current ripple cross lamination and hummocky cross lamination are observed in the middle and the lower half of the unit, respectively. The base of most of the individual layers in unit B cuts the primary structures in the underlying layer, and these are marked as erosional contacts (Figure 5).
Unit A consists of the sediments between the top of the section and down to a depth of 2.23 m, and is characterized by a subhorizontal layer with hummocky cross-bedded sand and gravel to boulders. The uppermost layer in unit A consists of gravelly humus with some stones and cobbles (Figure 5).
Terrestrial plant remains have been found at several levels in the section (Figure 5). Plant remains found at two levels in the middle and lower part of the section, respectively, have been AMS radiocarbon dated (see Figure 5 and Table 3). The lowermost date on leaf fragments yielded an age of 220 ± 30 14C BP (AD 1736–1805), while the uppermost date on twig fragments was inverted and yielded an age of 2165 ± 30 14C BP.
A common feature at the surface in all outcrop sections in the valley is the presence of a subhorizontal gravelly layer, representing unit A with hummocky cross stratification and trough cross bedding. Beneath unit A, the layers of units B and C generally have a planar dipping. These layers generally dip towards a southerly direction in the eastern part of the area and towards a more westerly direction in the western part. Hence, the dip directions clearly show that the sediments were deposited from east towards west along the northern valley side. A total of 90 discrete thin layers of planar-laminated clayey silt to fine sand that separate generally thicker layers of homogeneous to planar-laminated medium to very coarse sand are found in units C and B combined.
The topographic map in Figure 2, which is based on field studies in 1897, shows a small proglacial lake between the glacier front of Austerdalsisen and the overspill gap towards Glomdalsvatnet (Figure 2; Johannesen and Paulsen, 1901). The observations of Rekstad (1892, 1893) do not include this lake, suggesting that the glacier margin of Austerdalsisen was retreating during this time period.
Lithology in Litl Røvatnet (LRP 212)
LRP 212 was retrieved from a rather horizontal sediment surface at a water depth of ca. 5 m in the central main western basin (Figure 4b), which normally implies the largest thickness of soft sediments, as well as a reduced probability of disturbed sediments because of subaqueous slumping (Dahl et al., 2003).
The sediments in LRP 212 is grouped into units A-E based on physical sediment parameters, including LOI and DBD, as well as geochemical sediment properties, including the XRF count rates of Ti, Si, K, Ca, Fe and the Fe/Ti ratio (Figure 6). A correlation analysis between the parameters reveals that the LOI and Fe/Ti correlate moderately to strongly positive (ρ = 0.69), with the count rates of Ti, Si, K and Ca and the DBD having a strong positive correlation (ρ = 0.69–0.99), whereas the LOI and Fe count rates correlate weakly to strongly negative (ρ = −0.27 to −0.72), with the count rates of Ti, Si, K and Ca, and the DBD having a strong negative correlation (Table 2). The variability in these parameters is mainly suggested to reflect the minerogenic and organic content in the sediments as high values of LOI and Fe are generally indicative of an organic-rich sediment, while count rates of Ti, Si, K and Ca and the DBD are indicative of a sediment with higher minerogenic content.
Unit E consists of sorted coarse sandy gravel with seven distinct layers of well-sorted coarse sand, containing plant macrofossils at depths of 520.5–518, 494.5–491, 420–416, 405–403, 354–348, 334.5–331 and 328.5–318 cm, respectively. Except for AMS radiocarbon dates from the two lowermost macrofossil layers presented in Table 3, more detailed analyses of the sediments in unit E are not included in this paper.
The transition from unit E to unit D (268.5–185.5 cm) is marked by a distinct decrease in grain size, as unit D consists of finely laminated silt to fine sand with ca. 1.5-cm thick layers (n = 9) of coarse sand in the middle- to lower part of the unit. A 1-cm thick layer consisting of macrofossils is present near the base of the unit.
Unit C (185.5–19.2 cm) consists of an organic-rich sediment with alternating white, light greenish grey and greyish black layers. LOI values are generally higher than in the units above and below, although several distinct drops accompanied with increased DBD values are present throughout the unit. These drops in LOI correspond with visually observed layers consisting of well-sorted medium to coarse sand (Figure 6). These layers are more frequent in the middle part of the unit (n = 14) than in the upper and lower parts of the unit with n = 6 and 3, respectively. Three prominent layers with increased DBD and low LOI are present in the middle part of unit C. These layers correspond with visually observed layers of silty sediments.
Count rates of Si, K and Ca are generally low, although with some high-frequent superimposed fluctuations. The amplitude of these fluctuations generally intensifies in the lower half of the unit, accompanied with elevated, yet significantly fluctuating values of the Fe count rate and, thus, also the Fe/Ti ratio. The Ti count rate fluctuates with higher amplitude than those of Si, K and Ca in this unit. This is probably the result of a lower signal-to-noise ratio because of the generally low Ti count rates and does not necessarily reflect actual fluctuations in the geochemistry. A distinct peak in the count rate of Ti, Si and K is present in the lower half of the unit. This peak corresponds with a visually observed layer consisting of a minerogenic silty material. However, this peak is not present in the records of DBD or Ca. The base of the unit is marked by a gradual transition to a more minerogenic sediment type, with two distinct superimposed peaks in DBD values, as well as in the count rates of Ti, Si, K and Ca and corresponding troughs in LOI, Fe and Fe/Ti.
A sharp upwards increase in minerogenic indicators marks the transition from unit C to unit B (19.2–3.0 cm), which consists of a silty, grey sediment with numerous imbedded twigs. LOI values generally fluctuate around 3.5% with two distinct peaks in the lower half of the unit. Corresponding troughs in DBD accompany the peaks in LOI. Minerogenic indicators are generally high throughout the unit, with DBD values generally decreasing upwards with superimposed small fluctuations. Count rates of Ti, Si, Ca and Ca increase upwards with significant fluctuations in the lower half and decrease upwards in the upper half of the unit. The observed fluctuations in count rates of Ti, Si, K and Ca near the base of the unit correspond with the visually observed position of twigs protruding the sediment surface.
Unit A (3.0–0 cm) consists of a greenish grey to brown fine-grained sediment. The LOI increases from the base of the unit to around 7% at the top of the core, accompanied by a significant drop in the minerogenic indicators.
AMS radiocarbon dates with most likely calibrated age AD/BC from terrestrial plant macrofossils from LRP 212 are shown in Table 3 and the age–depth model in Figure 6.
Discussion
Outcrop section at OG towards Glomdalsvatnet
Between the western margin of Austerdalsisen and the OG towards Glomdalsvatnet, terraces consisting of various layers of laminated sediments of clayey silt to bouldery gravel are suggested to be remnants of a glaciofluvial delta (Figures 1c, 3b and 5). Based on the configuration of the remaining terraces, the till on the valley floor just west of Austerdalsvatnet (Figure 3b), the generally planar dip of layers in units B and C of the investigated section(s) towards south in the eastern part of the area and towards west in the western part, and the map in Figure 2 (Johannesen and Paulsen, 1901), a lateral meltwater stream along the northern margin of Austerdalsisen is suggested to have been the main source for the delta sediments. Hence, as the build-up of most of the delta is suggested to have been between Austerdalsisen and the northern valley side towards the OG, it should be termed an ice-contact marginal-to-proglacial delta. This is in agreement with the old observations by De Seue (1876) and Holmsen (1949) regarding little glacier meltwater input from Austerdalsisen towards Svartisvatnet (Figure 1c).
The AMS radiocarbon date on leaf fragments at a depth of 26.17–26.12 m below the top, that is, near the base of the investigated section yielded a most likely calibrated age of AD 1736–1805, whereas the inverted AMS radiocarbon date of twig remnants at a depth of 19.11–18.51 m is suggested to be the result of redeposition (Table 3). The investigated section is situated beyond the suggested LIA glacier maximum of Austerdalsisen, but at least two and probably three terminal moraines show that the glacier advanced across part of the delta during the LIA glacierization without destroying it (Figure 3b). Hence, the calibrated age of AD 1736–1805 gives a maximum age for the LIA glacier maximum at Austerdalsisen, which corresponds well with the age estimate of AD 1749 based on lichenometric measurements for this event (Winkler, 2003). This implies that if Austerdalsisen started to retreat, the sediment input to the delta would be restricted and instead primarily continue from suspension in the new-born ice-dammed lake between the ice margin and the former ice-contact slope. No such lake between Austerdalsisen and the ice-contact marginal-to-proglacial delta was observed in AD 1890–1891 (Rekstad, 1892, 1893) but such a lake (see Figure 2) was observed during topographic field mapping in AD 1897 (Johannesen and Paulsen, 1901). Hence, the ice-contact marginal-to-proglacial delta was probably formed between AD 1736–1805 and AD 1891–1897, that is, during a time span of 161–86 years. The young age near the base of the delta and the lack of mapped marginal moraines immediately outside the LIA glacier maximum lend support to the hypothesis that the LIA glacier maximum was the most extensive advance of Austerdalsisen during at least the Neoglacial (Winkler, 2003).
A total number of 90 discrete pairs of planar-laminated clayey silt to fine sand and a generally thicker layer of homogeneous to planar-laminated medium to very coarse sand are found in units C and B combined. These pairs may be facies representing the annually cyclic nature of glacial meltwater discharge. However, both the cross-bedded gravel in unit A suggested to represent the topset of a delta, and the many erosional contacts in unit B represent gaps in the stratigraphy. Hence, even if the total number of 90 potential pairs of annual layers is within the likely time span for build-up of the ice-contact marginal-to-proglacial delta of 161–86 years, it is suggested to be a minimum number.
Layers with trough cross laminations near the base and between 19.11 and 11.5 m below the top of the terrace may have been formed as subglacial- and/or englacial meltwater channels led meltwater currents into the proglacial lake at this depth. As the investigated section is situated beyond the LIA glacier maximum of Austerdalsisen, the general upwards coarsening in the stratigraphy may be related to the proximity of the glacier terminus. This is also supported by the increase in the number of erosional contacts upwards in units A and B, suggested to reflect an increase in competence of the meltwater flow passing the site and/or slumping.
Interpretation of lake sediments
As reflected by the variability in LOI and DBD values, count rates of Ti, Si, K, Ca and Fe and the Fe/Ti ratio, the depositional environment in Litl Røvatnet went through some dramatic shifts over a relatively short period of time (Figure 6, Table 3).
In unit E, the sorted coarse sandy gravel is suggested to be of glaciofluvial origin. The link between the overdeepened (ca. 13 m relative to the surrounding sandur plain) and nearly circular main western basin in Litl Røvatnet is hard to fully understand. Litl Røvatnet is suggested to be a kettle hole because of buried ice from the last deglaciation (Blake, 2000; Blake and Olsen, 1999), which prevented the basin from being filled up with sediments. If so, unit E may be part of the surrounding sandur sediments. However, the seven distinct layers of well-sorted coarse sand containing plant macrofossils in unit E contradict this interpretation. AMS radiocarbon dates from LRP 212 on leaf fragments dated to 2230 ± 30 BP (BC 320–204) at 512–511 cm depth and 3015 ± 35 BP at 486–485 cm depth, which is inverted, are shown in Table 3. From the fan at the mouth of Blakkådalen, a shallow channel with a small stream, at present, in the westernmost part can be followed all the way along the mountain slope at northern Røvassmoen towards the western part of Litl Røvatnet. Hence, the distinct layers with well-sorted coarse sand containing plant macrofossils are suggested to represent the last phase of glacier meltwater floods from Blakkådalen which deposited coarse sandy gravel in the main basin of western Litl Røvatnet. Similar layers with abundant plant macrofossils representing the last phase of floods have been described from Russvatnet in eastern Jotunheimen (Støren et al., 2008). No such flood events are recorded above unit E in LRP 212. As unit E represents the base of the core, the base of unit E is not dated in this study. The age model, however, suggests that the shift in depositional environment represented by the transition between units E and D occurred sometime around AD 1011–1195.
The physical and geochemical properties, as well as the visual appearance of units D and B, are very similar (Figure 6). These units are therefore suggested to result from deposition within a similar depositional environment. Thus, based on historical observations (Holmsen, 1949; Liestøl, 1956; Theakstone, 1965 and references therein), the depositional environment in units B and D is closely related to GLOFs from the ice-dammed lake Austerdalsvatnet.
Unit D is bracketed between AD 1011–1195 and AD 1222–1391 (see Figure 6, Table 3), whereas unit B is bracketed between AD 1941 and AD 1958 based on the historical observations summarized by Theakstone (1965).
The transition between units D and C is interpreted as a shift from an environment dominated by glaciolacustrine deposition to a depositional environment more influenced by organic production within the lake. Reflecting relatively high LOI values between 5 and 15%, and related low values for DBD, the visual appearance of unit C is dominantly brownish in colour (Figure 6). Counts of Ti, K, Si and Ca are much lower than in units D and B, whereas counts of Fe are distinctly higher. Both MS and the Fe/Ti ratio are generally higher and fluctuates more in unit C than in the units below and above. However, unit C is punctuated with numerous sandy minerogenic layers in addition to three pronounced silty layers in the middle to lower part of the unit. It is suggested that the numerous sandy layers reflect fluvial activity and slope-related processes in the catchment of Litl Røvatnet, whereas the three silty layers reflect GLOFs between AD 1290–1464 and AD 1494–1601 (alternatively AD 1615–1669; see Figure 6 and Table 3). The transition from unit C to unit B is rather distinct from an environment dominated by organic production within the lake towards an environment dominated by glaciolacustrine deposition and is used as a time marker for AD 1941 based on historical observations (e.g. Holmsen, 1949; Liestøl, 1956; Theakstone, 1965). Hence, unit C is bracketed between the modelled age of AD 1222–1391 and the historical age of AD 1941 (see Figure 6, Table 3).
The transition from unit B to unit A is gradual, with the brownish-coloured topmost unit suggesting to reflect the current depositional environment in Litl Røvatnet dominated by organic production within the lake. The transition between units B and A is used as a time marker for AD 1958 based on historical observations (see Figure 6; Theakstone, 1965). Unit A represents a sedimentary environment in Litl Røvatnet without regular GLOFs from Austerdalsvatnet as the terminus of Austerdalsisen is situated well inside the critical magnitude threshold. First, artificially as a result of the (GLOF-) flood-relief tunnel at an altitude of 208 m which was completed in AD 1959, later because of the general retreat of Austerdalsisen which would have opened up the original threshold between Austerdalsvatnet and Svartisvatnet at an altitude of 212 m a few years later (e.g. Theakstone, 1965, 2010).
The occurrence of GLOFs is highly dependent on the front position of Austerdalsisen, and thus, offers an insight into the fluctuations of Austerdalsisen prior to and through the LIA glacierization (Figure 7). During periods when the glacier front resided near the OG in the western part of the study area, only a small fraction of the meltwater drained through Svartisåga towards Røvassmoen, and organic production within Litl Røvatnet dominated the depositional environment. During periods when Austerdalsisen fluctuated around a critical magnitude threshold, as illustrated in Figures 1c and 3a, more or less annual GLOFs occurred in Svartisdalen, and the environment in Litl Røvatnet was dominated by glaciolacustrine deposition.
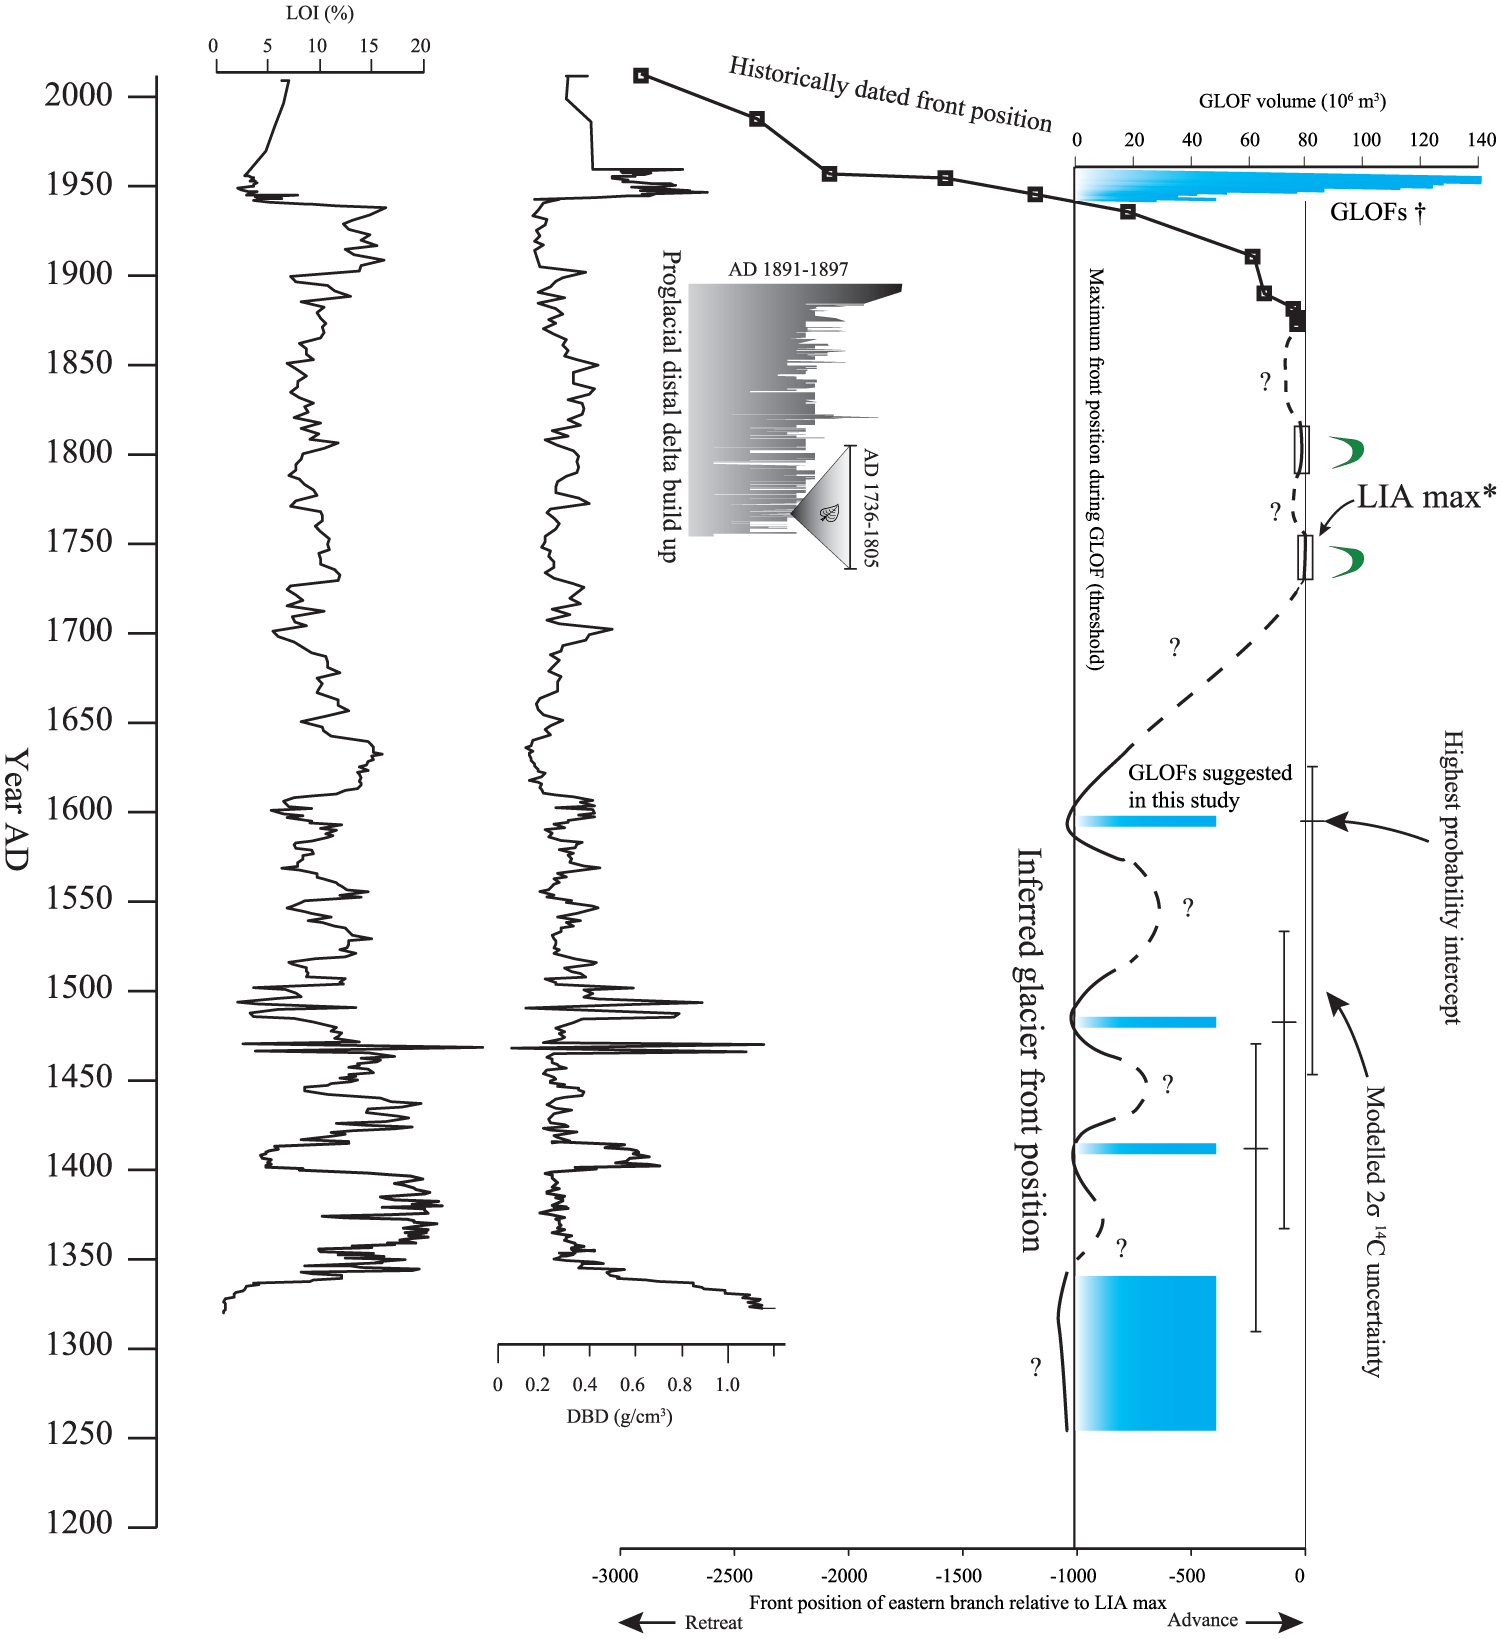
Reconstructed course of the LIA glacierization at Austerdalsisen based on LOI and DBD from the AMS 14C-dated core from Litl Røvatnet, historical GLOFs and suggested GLOFs based on sediment proxies from Litl Røvatnet, lichenometric dates from Winkler (2003), the bottom date of AD 1736–1805 of the lateral-to-proglacial glaciofluvial delta deposit and the historically observed first origin of the ice-dammed lake Austerdalsvatnet between AD 1891 and 1897 (Johannesen and Paulsen, 1901; Rekstad, 1892, 1893).
Owing to the close monitoring of the front position of Austerdalsisen since AD 1873 (Figure 7; De Seue, 1876; Granlund and Lundqvist, 1936; Liestøl, 1956; Rabot, 1935; Rekstad, 1893; Theakstone, 2010; Theakstone and Knudsen, 1981, 1986), it is known that the front of the southeastern branch of Austerdalsisen was situated at about 1.2 km from the western end of Svartisvatnet during the series of GLOFs between AD 1941 and 1958. It is, thus, suggested that this front position represents a threshold which allows for the occurrence of GLOFs. Given this suggestion, it is likely that Austerdalsisen was close to the critical magnitude threshold between AD 1161–1262 and AD 1294–1401. Then Austerdalsisen advanced beyond this position just afterwards and retreated to this threshold again in AD 1941. Meanwhile, indications of GLOFs in the lake imply that the glacier front fluctuated around this threshold on three occasions between AD 1290–1464 and AD 1494–1601 (alternatively AD 1615–1669). Likewise, except for events leading to deposition of sandy layers, the organic-rich sediments in Litl Røvatnet indicate prolonged periods during the LIA glacierization when the glacier terminus of the western branch of Austerdalsisen was beyond the critical magnitude threshold in Austerdalsvatnet that allows for GLOFs (Figure 7).
Comparison with other glaciers
Owing to limitations of AMS radiocarbon dating, comparisons between different glaciers on a decadal scale beyond historical records are difficult (Winkler and Matthews, 2010). This is illustrated by the uncertainty intervals for calibrated radiocarbon dates in Figure 8a. Still, the fluctuations observed prior to the LIA glacier maximum correspond well to observed fluctuations of a maritime cirque glacier at Langstrandtindan in Lofoten (Figure 8d) about 200 km north of Austerdalsisen (Nielsen et al., 2016).
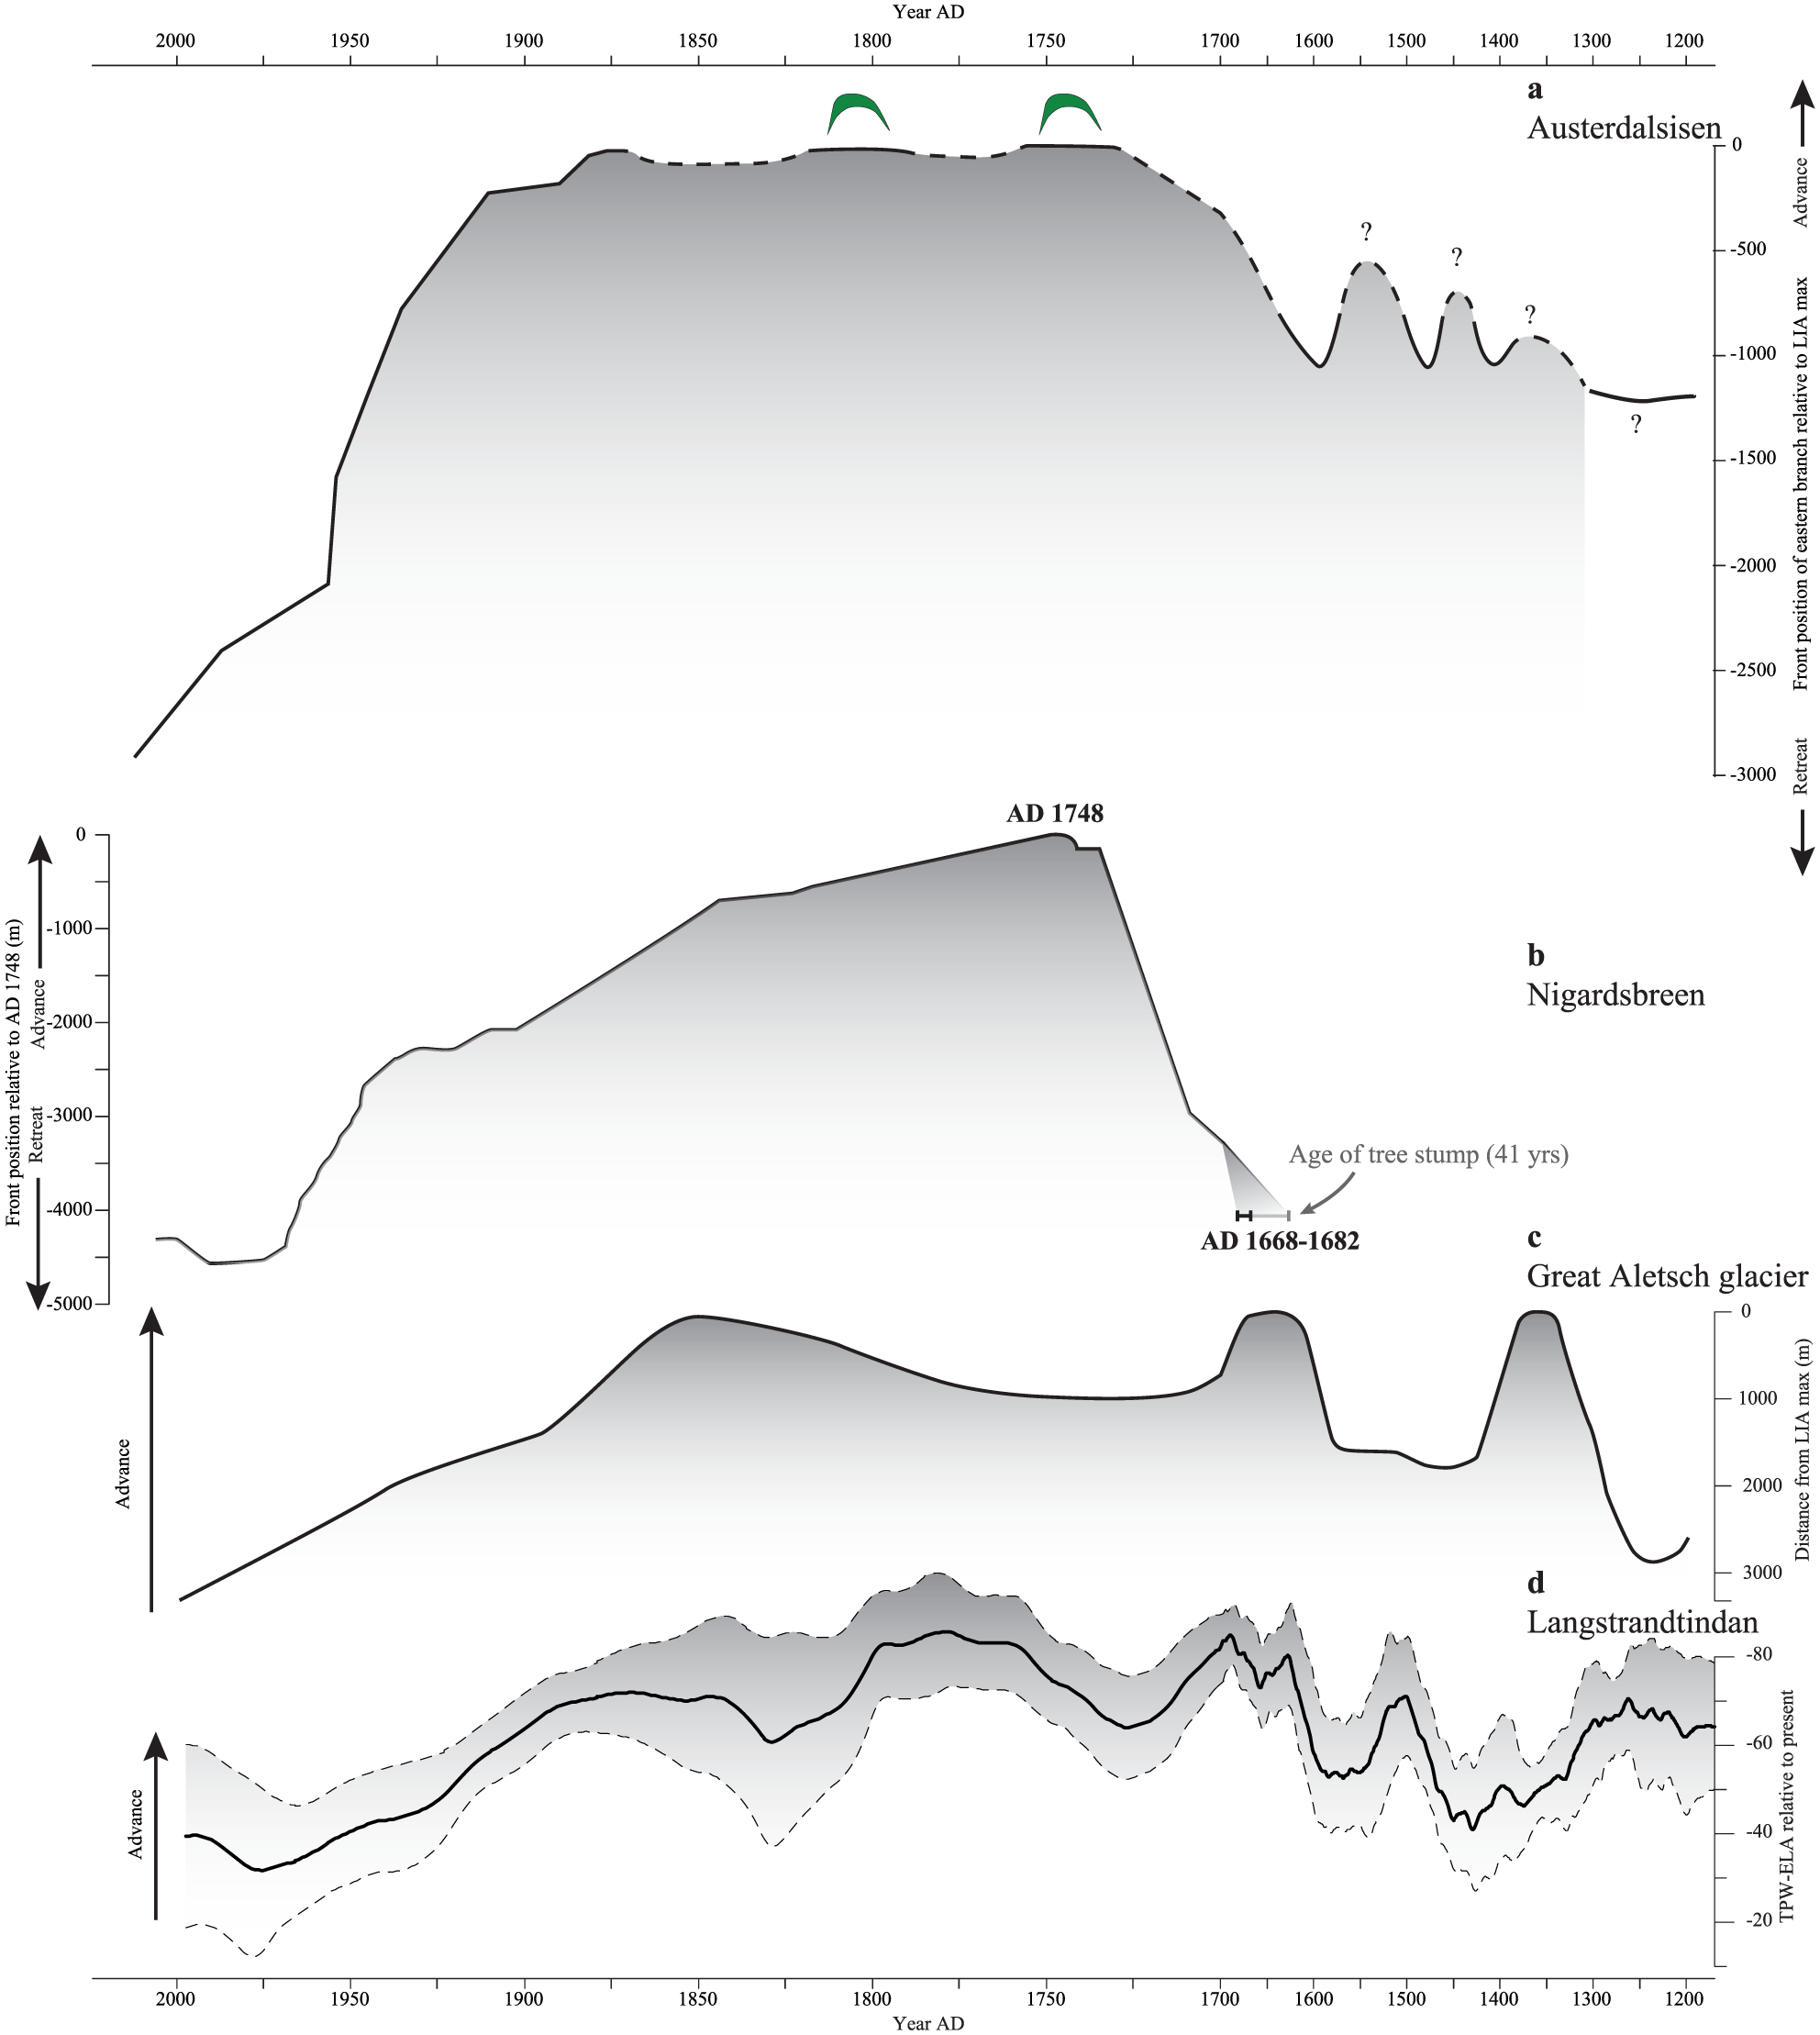
(a) Time–distance diagram based on historical records (De Seue, 1876; Granlund and Lundqvist, 1936; Holmsen, 1949; Liestøl, 1956; Rabot, 1935; Rekstad, 1892, 1893; Theakstone, 1965, 1988, 1989, 1990, 2010; Theakstone and Knudsen, 1981, 1986) and *moraines dated by lichenometry (Winkler, 2003). †Historically recorded GLOFs from AD 1941 to 1954) are shown (Holmsen, 1949). (b) Changes in the front position of Nigardsbreen, western Norway, from Nesje et al. (2008). (c) Reconstructed front position of the Great Aletsch glacier in the Swiss Alps (Holzhauser et al., 2005). (d) Reconstructed ELA from a cirque glacier in Langstrandtindan, Lofoten, northern Norway (Nielsen et al., 2016).
The timing of the LIA glacierization in the European Alps ca. AD 1300–1950, when glaciers were larger than before or since (Holzhauser, 1997; Matthews and Briffa, 2005), fit quite well with the reconstructed LIA fluctuations at Austerdalsisen. The suggested GLOFs prior to the LIA glacier maximum at Austerdalsisen also correspond quite well with the observed general glacier retreat in the Swiss Alps AD 1500–1700, as exemplified by the Great Aletsch glacier (Figure 8c; Holzhauser et al., 2005). However, the LIA glacier maximum at Austerdalsisen about AD 1750 (1749) based on lichenometric measurements (Winkler, 2003) and age–depth modelling from Litl Røvatnet is much older than the suggested LIA maximum at Great Aletsch glacier ca. AD 1860 (Holzhauser, 1997; Holzhauser et al., 2005).
The onset and culmination of the historically documented LIA glacier maximum of Nigardsbreen, western Norway, in AD 1748 (Andersen and Sollid, 1971; Bickerton and Matthews, 1992; Foss, 1750; Nesje et al., 2008; Østrem et al., 1976) correspond well with the reconstructed glacier record of Austerdalsisen (Figure 8a and b). However, while Nigardsbreen, in general, retreated steadily after about AD 1748, Austerdalsisen remained very close (ca. 100–200 m) to the LIA glacier maximum position until AD 1891–1897. As similar observations are available from numerous glaciers within the Svartisen region (De Seue, 1876; Granlund and Lundqvist, 1936; Jansen et al., 2016; Liestøl, 1956; Rabot, 1935; Rekstad, 1892, 1893, 1912; Theakstone, 1965, 1988, 1989, 1990, 2010; Theakstone and Knudsen, 1981, 1986), it is suggested that Austerdalsisen remained large as a consequence of external climate forcing resulting in high winter precipitation in the Svartisen region during this period (Jansen et al., 2016; Theakstone, 2010), rather than processes related to the internal dynamic stability of the glacier.
Conclusions
Austerdalsisen is suggested to have obtained the Neoglacial maximum during the LIA glacierization ca. AD 1749 (Winkler, 2003), and older geomorphological evidence reflecting smaller glacier advances were most likely erased along both the southeastern and western branch. With a catchment of ca. 55.41 km2, Austerdalsisen is the largest glacier unit in (mainland) Norway and together with little resistance to erosion by the local bedrock, the high sediment production from the glacier makes it difficult to retrieve cores from distal glacier-fed lakes covering even the LIA glacierization. The present glacier meltwater drainage is towards SE, whereas most meltwater drained westwards whenever Austerdalsisen was beyond a critical magnitude threshold. When Austerdalsisen was at the critical magnitude threshold, regular GLOFs from the ice-dammed lake Austerdalsvatnet occurred towards SE
However, based on geomorphological mapping, stratigraphical investigations and analyses of distal glacier-fed lacustrine sediments from Litl Røvatnet, an inverted approach to reconstruct the course of the LIA glacierization at Austerdalsisen based on the AMS 14C-dated core has been performed (Figure 7), and the following main conclusions of local and regional importance are suggested:
Observed historical GLOFs from Austerdalsvatnet AD 1941–1958 towards SE are identified in the lithology of unit B in core LRP 212 from Litl Røvatnet (Figure 6). Similar sedimentary signatures suggested that GLOFs are also identified in unit D of LRP 212 (Figure 6) and dated between AD 1161–1262 (somewhat too young) and AD 1294–1401 prior to the LIA glacier maximum of Austerdalsisen. In addition, sedimentary evidence from three layers within unit C in LRP 212 (Figure 6) between AD 1290–1464 and AD 1494–1601 (alternatively AD 1615–1669) is suggested to indicate GLOFs. All sedimentary sequences with the signature of GLOFs in Litl Røvatnet are suggested to represent periods when the terminus of the western branch of Austerdalsisen was at the critical magnitude threshold in the ice-dammed lake Austerdalsvatnet (Figure 1c; Holmsen, 1949; Liestøl, 1956), which corresponds to an ice-front position of the southeastern branch ca. 1.2 km upstream of Svartisvatnet.
Whenever the western branch of Austerdalsisen was beyond the critical magnitude threshold in Austerdalsvatnet, most of the meltwater was routed westwards. This corresponds to unit C in core LRP 212 from Litl Røvatnet dated between AD 1294-1401 and AD 1941. Unit C is dominated by a depositional environment more influenced by organic production within the lake, as reflected by the relatively high and low values for LOI and DBD, respectively (Figure 6). In addition to three layers most likely representing GLOFs (see above), however, unit C is punctuated by numerous sandy minerogenic layers which is suggested to reflect in-wash from the catchment of Litl Røvatnet.
With the original threshold between Austerdalsvatnet and Svartisvatnet at an altitude of 212 mm, Litl Røvatnet represents a sedimentary environment with high organic production without influence by GLOFs. However, this situation was artificially established already in AD 1959 when a (GLOF-) flood-relief tunnel at an altitude of 208 m from Austerdalsvatnet towards Svartisvatnet was completed (Theakstone, 1965, 2010). Hence, the present extent of Austerdalsisen is most likely smaller than has been since at least AD 1161–1262.
A ca. 28-m high section in an ice-contact marginal-to-proglacial glaciofluvial delta beyond the suggested LIA glacier maximum of Austerdalsisen has been investigated in detail. The delta was primarily deposited by a meltwater stream along the northern margin of the western branch of Austerdalsisen and the OG towards west during the LIA glacierization. Based on an AMS 14C-date near the bottom of the deposit (Table 3) and historical observations of when Austerdalsisen started to retreat, the delta is dated between AD 1736–1805 and AD 1891–1897, that is, during a time span of 161–186 years. This is supported by a minimum number of 90 discrete pairs in the investigated section of planar-laminated clayey silt to fine sand and a generally thicker layer of homogeneous to planar-laminated medium to very coarse sand suggested to be facies representing the annually cyclic nature of glacial meltwater discharge (Figure 5). The age of formation for the delta supports that the LIA glacier maximum of Austerdalsisen was the most extensive advance during at least the Neoglacial (e.g. Winkler, 2003).
The LIA glacierization at Austerdalsisen can be dated between AD 1294–1401 and AD 1941. The LIA glacier maximum of Austerdalsisen took place between AD 1736 and 1805, but most likely about AD 1749 as suggested by Winkler (2003) based on lichenometry. However, Austerdalsisen remained close to the maximum position until AD 1891–1897.
The time span for the LIA glacierization at Austerdalsisen is comparable to Great Aletch Glacier in the European Alps between ca. AD 1300 and 1950 (Holzhauser, 1997; Matthews and Briffa, 2005; Figure 8) and to variations of cirque glaciers at Langstrandtindan in Lofoten (Nielsen et al., 2016). The LIA glacier maximum at Austerdalsisen about AD 1750 (1749) fits with the historical maximum at Nigardsbreen in AD 1748 (Foss, 1750), but is much older than the suggested LIA glacier maximum at Great Aletsch glacier ca. AD 1860 (Holzhauser, 1997).
Footnotes
Acknowledgements
HLJ is thankful to Bjørn S Eikeland for help during field mapping and coring of Glomdalsvatnet and Litl Røvatnet. This would not have been possible without your great skills within wildlife survival and great sacrifice during coring. The authors wish to thank the reviewers Wilfred Theakstone, Stefan Winkler and a third anonymous reviewer for their comments that helped improve the manuscript.
Funding
This research was funded by grants from the Norwegian Research Council and the Meltzer Funds.