



Abstract
Charcoal particles are evidence of past fire events and macro-charcoal particles have been shown to represent local fire events. There are several methods for the preparation and quantification of macro-charcoal particles, none of which have been universally accepted as standard. Very few studies compare methodological differences and no studies to date compare quantification by mass with quantification by volume using image analysis. Using three cores taken from a peatland located in SE Norway, we compare these two established methods using a generalized linear mixed model (GLMM) and a split-plot ANOVA test. We show that charcoal volume (image analysis method) was a better predictor of charcoal mass than charcoal particle number and the same size classes of charcoal as size class distributions were not spatially and temporally correlated. Although there is still a need for a common and unifying method, our results show that quantification of charcoal particles by image analysis including size (e.g. height in mm) and area (mm2)/volume (mm3) measurements provides more significant results in cross-site or multiple-site studies than quantifications based on particle number. This has implications for the interpretation of charcoal data from regional studies that are used to model drivers of wildfire activity and environmental change in boreal–temperate landscapes during the Holocene.
Keywords
Introduction
Recurring wildfire is a key-disturbance agent that has been a major driver of forest evolution and development worldwide (Bowman et al., 2009). Every fire event produces and distributes pyrogenic organic matter, of which charcoal is a main component when woody biomass burns. As charcoal remains in soils and sediments for centuries (Scott, 2010), its record represents a significant carbon pool (Ohlson et al., 2009) and a legacy of spatial and temporal patterns in wildfire activity which plays an important role in the global terrestrial carbon cycle (Bradshaw and Sykes, 2014). However, it is far from simple to quantify and interpret the charcoal record, and a multitude of methods and interpretations have been used in order to estimate past patterns in fire activity. Actually, there are over 120 separate approaches used for identifying and quantifying charred remains in the Global Charcoal Database (http://www.paleofire.org/), including particle counts, point counts, area measurements, chemical assays and estimates of influx, concentration, dry mass and reflectance (Power et al., 2010).
The approaches used for recording charcoal in soil and sediments fall into three distinct groups: (a) manual data collection with subjective decisions made on the identification of dark objects as charcoal, for example, point counts (Clark, 1988) and dry mass determination (Ohlson et al., 2009); (b) data derived from more automated systems of analysis that may permit some human intervention (e.g. image analysis) (Mooney and Black, 2003; Mooney and Radford, 2001; Mooney and Tinner, 2011); and (c) a broad range of chemical assays, which have been shown to render different and assay-specific results (Hammes et al., 2008; Quenea et al., 2006). In addition, there is also a great diversity of methods used for analysis, standardization and presentation of charcoal data and this is an active research area with a widespread use of the CHAR (charcoal accumulation rate) approach for data standardization (Finsinger et al., 2014; Hawthorne and Mitchell, 2016; Leys et al., 2013). CHAR is based on the principle that peaks in charcoal fragments represent local fire events (Higuera et al., 2008; Olsson et al., 2010) but the data also contain ‘noise’ (random variability) and that separating samples in a detrended CHAR time series into two distinct populations – signal (S) comprising samples above a set threshold and noise (N) the remaining samples at or below the threshold – will identify the peak series (Higuera et al., 2011; Kelly et al., 2011). In contrast, data collection methodological issues have received relatively less attention, although Schlachter and Horn (2010) found that abundance of charred particles in lacustrine sediment samples were significantly reduced with increasing strengths of hydrogen peroxide (widely used as a pre-treatment for image analysis of charcoal samples). Schlachter and Horn (2010) also used horizontally adjacent and replicated samples in their study to call attention to the issues of sample volume and spatial variation. Multiple core studies and within core study comparisons are rarely done in palaeoecological research, which generally has been based on the analysis of a ‘single core sample’ (Higuera et al., 2005; Ohlson et al., 2006). There is thus a general lack of knowledge about how much charcoal records may vary in terms of particle number and size across fine spatial scales in a given biological archive such as, for example, a peat-basin. There have also been investigations of how the choice of study units impacts on the estimates of charcoal abundance. Charcoal particle to number–area–volume relationships have been of particular concern in these investigations (Ali et al., 2009; Crawford and Belcher, 2016; Leys et al., 2013; Weng, 2005). A main conclusion from these investigations is that area and volume estimates are more accurate and robust to depict the amount of charcoal than particle number, which can be significantly influenced by both taphonomic and laboratory pre-analysis processes. However, to the best of our knowledge, no studies have examined how charcoal particle number, area and volume relate to charcoal mass in a given charcoal record. The mass unit is particularly important and interesting in this context as it is notoriously time-consuming and costly to estimate charcoal mass in soil or sediment samples (Crawford and Belcher, 2016; Hammes et al., 2008; Ohlson et al., 2009; Schmidt and Noack, 2000). Statistically significant relationships between data for charcoal mass and charcoal data derived from semi-automated and objective approaches (e.g. image analysis) will thus open up opportunities for time-efficient and precise quantifications of charcoal in a given sample, which in turn has the potential to be a powerful tool to improve our knowledge about the size of the charcoal pool in terrestrial soils as well as in aquatic and marine sediments.
In this paper, we compare a robust manual method of charcoal particle number and mass estimation with a semi-automated image analysis system that records particle number, shape and size, which in turn have been used to calculate particle area and volume. To do this, we use duplicate sub-samples from three peat cores. First, we assess how well the manual and the image analysis methods accord in estimations of charcoal particle number in different size classes and then assess which variables from the image analysis can best explain charcoal mass in a given sample of peat. Moreover, as the three peat cores were collected from the same basin in close proximity to each other, we have also been able to explore horizontal variations in charcoal particle number and size at a fine spatial scale covering different distances from the border of the peat deposit.
Material and methods
Study site
Our study site, which is a peatland, is located in Brånakollane Nature Reserve (59°20’ N; 10°06’ E) about 15 km north of the town of Larvik in SE Norway in the Oslo rift geological area (Figure 1). Brånakollane is characterized by a natural beech (Fagus sylvatica) forest covering about 20 ha. Norway spruce (Picea abies) forests surround the forest reserve, and the border between the beech and spruce forest is very sharp and distinct. The forest floor vegetation is generally sparse, particularly under the beech canopy, and consists mainly of Oxalis acetosella, Anemone nemorosa, Deschampsia flexuosa, Festuca altissima, Poa nemoralis and Dryopteris ferns.
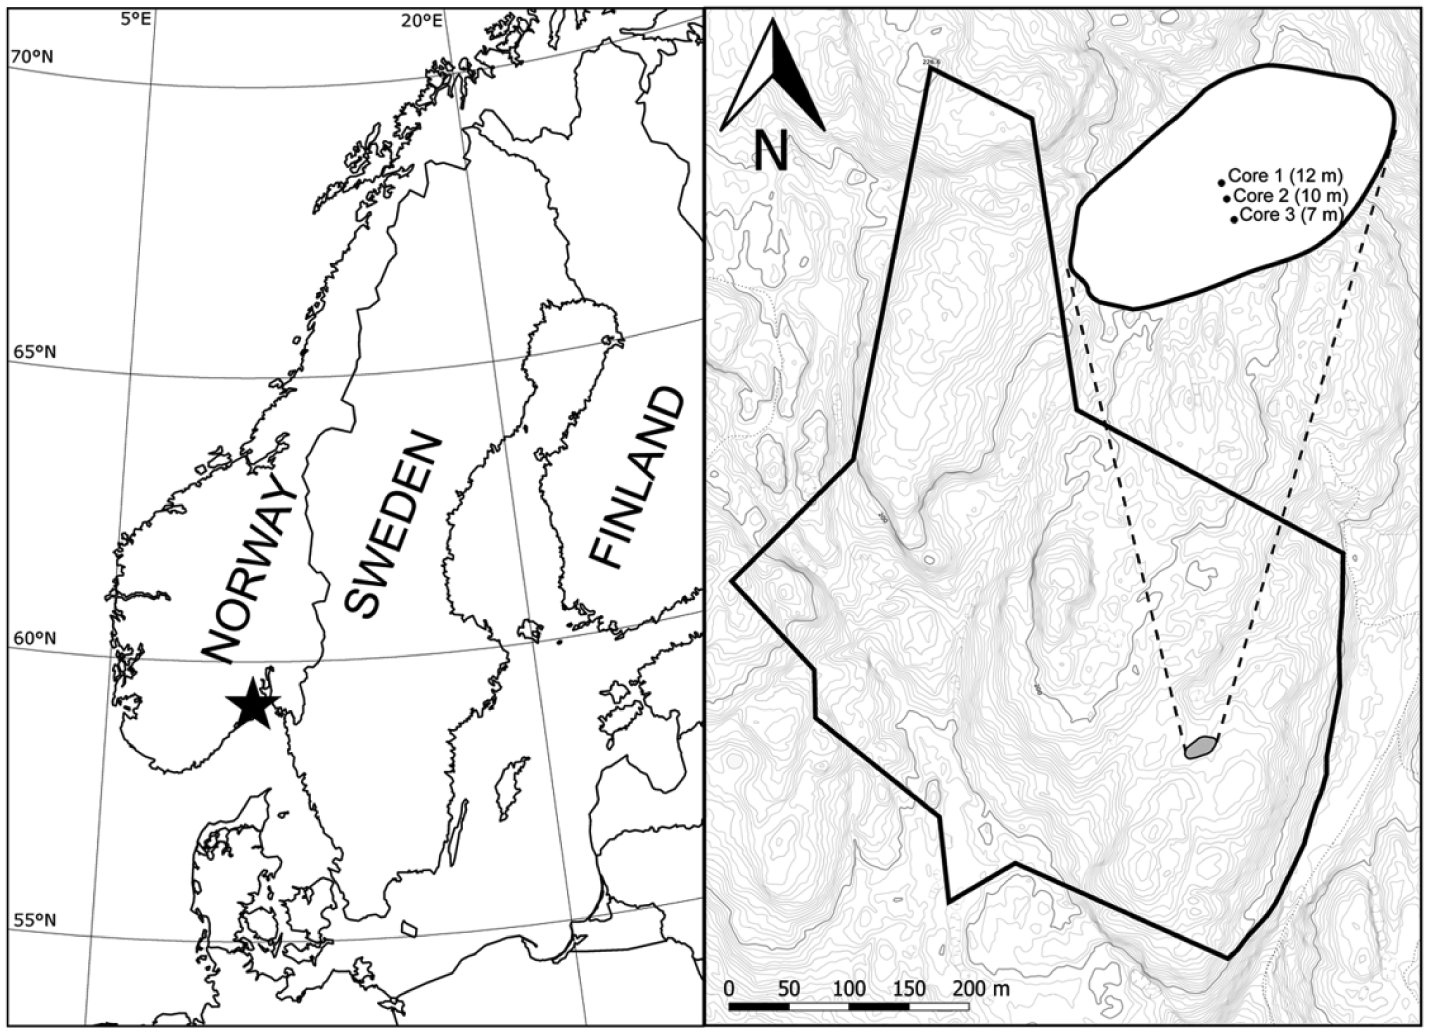
National location of the study site in SE Norway (left). Brånakollane Nature Reserve (right) with the peatland marked in grey. The coring positions within the peatland and their distances from the border are shown in the insert. Topographic contour line distance = 1 m.
The peatland under study is a small hollow and is located in the SE part of the nature reserve. The border between the peatland and surrounding beech forest is sharp due to steep slopes, which makes the peatland basin well defined. The peatland is rather wet and its hydrology is driven by an inflow of seeping water from the surrounding slopes, although there is no distinct in- and outflow of water through channels. Only a few, small beech saplings grew on the site and the surface vegetation was sparse due to abundant occurrence of beech leaf litter. Forest species have dominated the Brånakollane region since 12,000 cal. yr BP (Figure 5 in Bjune et al., 2013). The largest change in the local forest vegetation occurred around 1350 cal. yr BP where there was a shift from a diverse landscape with broad-leaved trees to a less diverse landscape with Fagus sylvatica and Picea abies (Bjune et al., 2013). Detailed information about site conditions and vegetation history are available in Ohlson et al. (2017), Asplund et al. (2015) and Bjune et al. (2013).
Peat sampling
Three peat cores were collected using a Russian peat corer (50 cm core length and diameter 5 cm) in June 2014. All cores included the entire peat column from the peatland surface down to the underlying mineral soil. The coring positions were selected to cover a gradient from the central and deepest part of the peatland towards its border. The distance between the central position and the border was approximately 12 m and the total distance among the three positions was 5 m (Figure 1, insert top-right).
Charcoal bands were identified in the field immediately after the cores had been extracted and only these bands were sampled in the field by cutting 1-cm thick peat slices with a sharp knife (see Ohlson et al., 2006). There were 12, 21 and 12 slices from cores 1, 2 and 3, respectively (distances from peatland margin are 12 m, 10 m and 7 m, respectively). Each slice was cut in two equal-sized parts (~5 cm3) and then stored in a labelled zip-lock plastic bag. The samples were stored frozen before analysis. By using this approach, we have most likely overlooked peat sections with small amounts of charcoal that was not visible by the naked eye in the field.
Charcoal analyses
One part of each sample slice was analysed at the Norwegian University of Life Sciences for content of macroscopic charcoal by hand picking (see Figure 2a–c) as described by Ohlson et al. (2009). By using a stereo microscope with a measure scale, the particles were categorized in five size classes (1 = 0.2–0.49; 2 = 0.5–0.99; 3 = 1.0–1.49; 4 = 1.5–2.0; and 5 = >2.0 mm) and the number of particles were determined for each size class. After the number of particles were determined, they were dried at 70°C and their total mass was determined (g cm–3). This approach is from now on referred to as the mass quantification method.
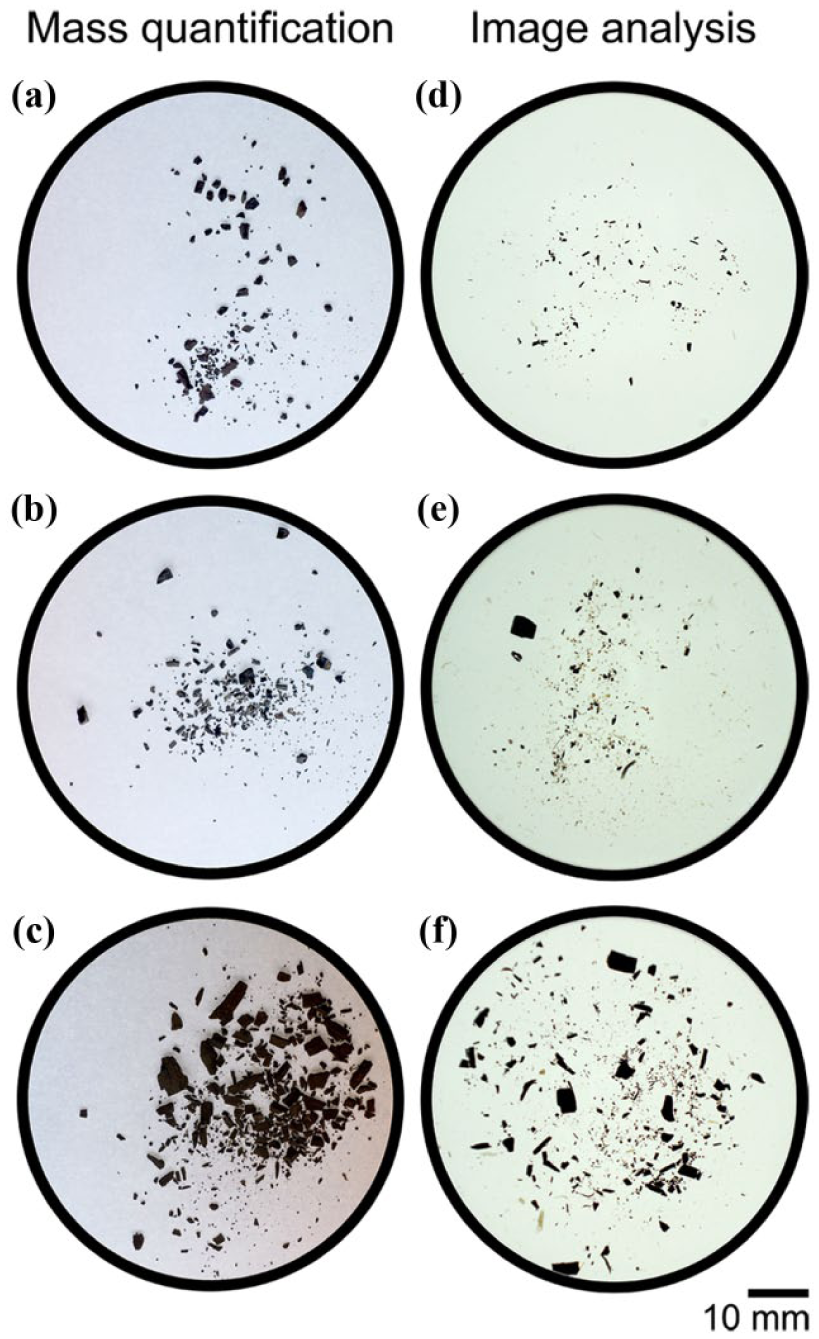
Charcoal appearance in three peat samples as determined by (a, b and c) the mass quantification method and (d, e and f) the image analysis method.
The second part of each slice was analysed at the University of Liverpool. Each sample was left overnight in 20 ml Calgon (7 g of sodium carbonate (NaCO3) and 33 g of sodium hexametaphospate (Na(PO3)6) dissolved in 1 L of double distilled water), then gently washed through a 250 µm sieve. The retained sediment was washed into petri dishes and 5 ml pure sodium hypochlorite was added. The samples were then left to bleach overnight and rewashed using a 125 µm sieve to capture broken fragments. An extra 1 ml sodium hypochlorite was added to samples that were rich in organic material to ensure a similar colour reduction for all samples (sodium hypochlorite works by using free chlorine molecules which reduce in effect over time). Measurements of charcoal particle counts were recorded using ImageJ (Abràmoff et al., 2004; Schneider et al., 2012). Figure 2 shows examples of the images used in ImageJ and for comparison, images of the charcoal used in the mass quantification method. The images were despeckled, adjusted to auto brightness/contrast and then converted to 32 bit greyscale images. A threshold of 75 greyscale units was used for core 1 and a threshold of 50 greyscale units for cores 2 and 3 apart from four samples for which a greyscale threshold of 184 was used as the charcoal fragments were very small and faint. Charcoal particles >20 µm2 were recorded. Three samples were characterized by large amounts of small charcoal fragments and dark mineral material, which made it necessary to divide these into smaller portions to exclude non-charcoal material with precision. Charcoal particle aspect ratio (AR) was recorded as minor axis/major axis of the fitted ellipse and also as the ratio of width / height for a fitted rectangle, which in turn were used to calculate particle area (mm2 cm–3). This was converted to particle volume (mm3 cm–3) based on Weng’s equation (Weng, 2005), with the assumption that the type of burnt vegetation was similar throughout the core, so C = 1:

where V1 = total volume; Ci = coefficient for particle #i; Ai = area of particle #i.
The Holocene vegetation history for Brånakollane is consistently dominated by forest (see site description) so the assumption that C = 1 is valid. From now on, this approach will be referred to as the image analysis method. The explanatory variables from the image analysis method that we use in the statistical analyses for each sample are particle number for each size class, total number of particles, particle volume for each size class and total particle volume. Particle volume is auto-correlated with particle AR and area (spatially scaled as mm2) as the volume is calculated directly from these variables, which imply that it is not meaningful to include AR and area variables in the statistical analyses.
Statistical analyses
Charcoal particle distributions were strongly right-skewed and we performed a generalized mixed model (GLMM) using the function glmer.nb in the R-package lme4 (Bates et al., 2015), assuming a negative binomial distribution, to test the effect of method (mass quantification vs image analysis), peat core position and particle size class on number of charcoal particles. Sample ID was used as random factor. To test the effect of method and peat core position on the proportional distribution of charcoal particles, we used a split-plot ANOVA. Here, normality assumptions were met by log transformation. We used a split-plot ANOVA to test for the effect of method and core sample on the proportion of particles in size class five. As the raw data were strongly right-skewed and did not meet normality assumptions, we have used the non-parametric Spearman rank correlation to estimate the relationship between charcoal mass data and the image analysis variables.
Results
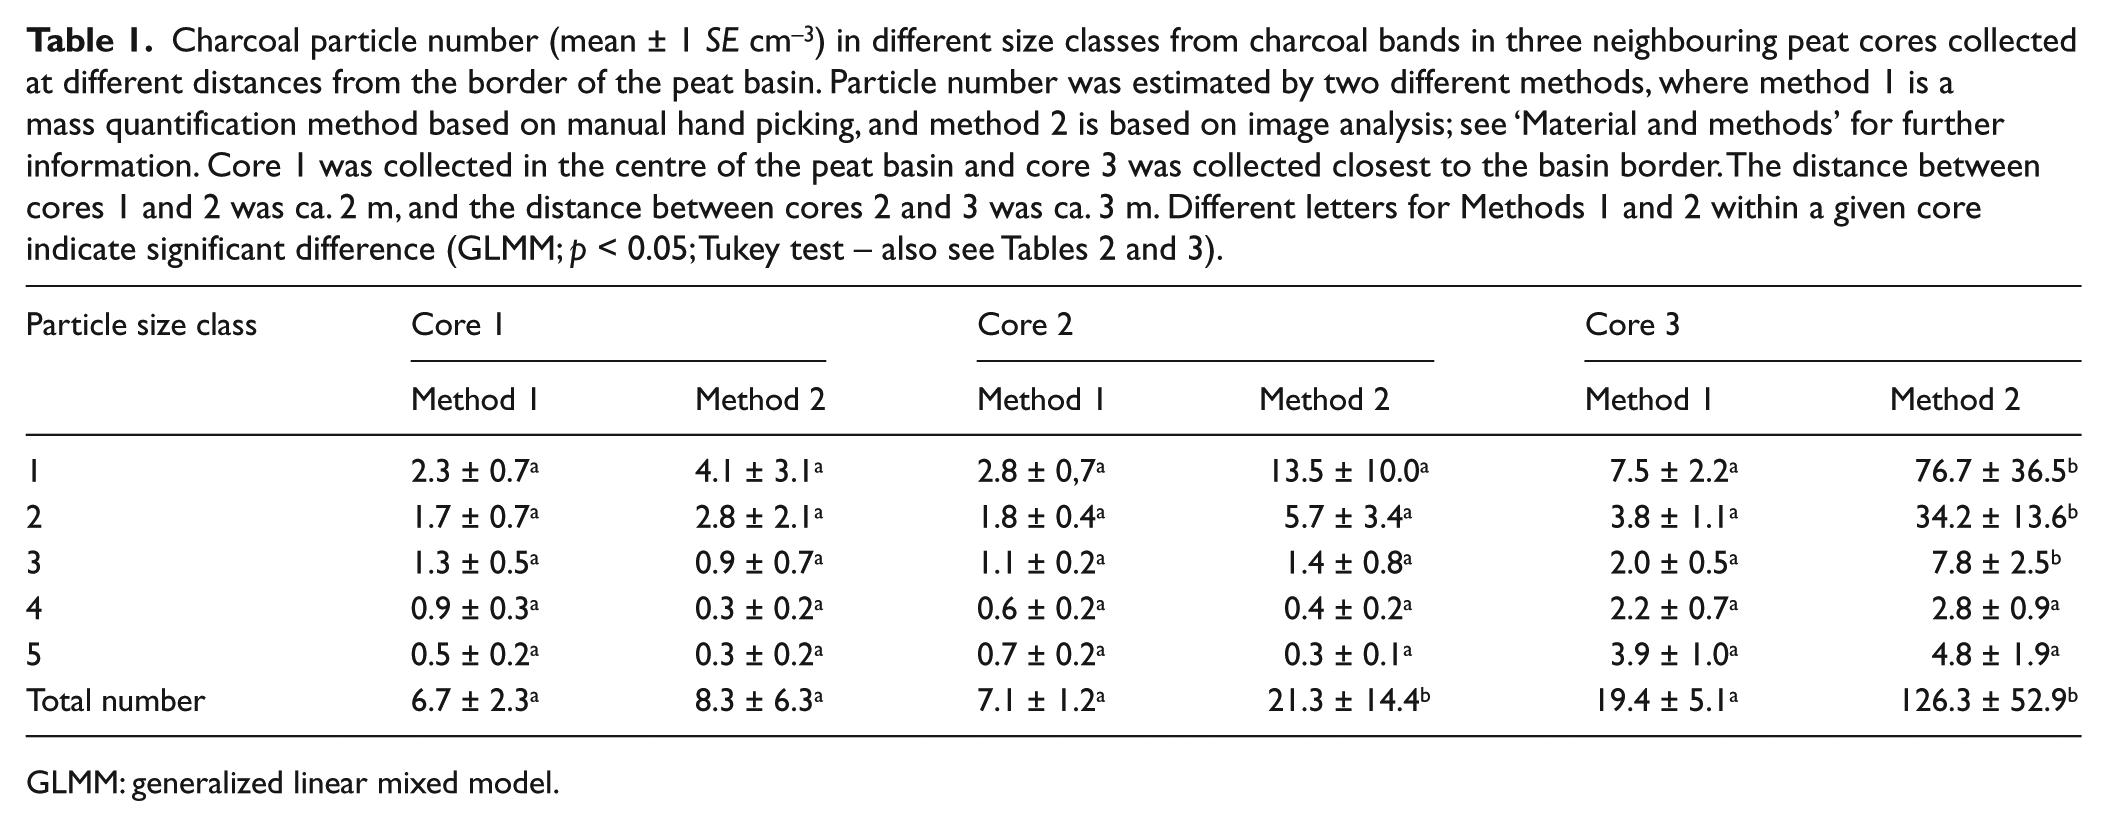
Comparison of the two methods on a core-by-core basis shows a general visual agreement of charcoal stratigraphies and there is generally more charcoal recorded in the lower section of all three cores (Figure 2). Although it cannot be concluded with statistical certainty due to the large standard error as reported in Table 1 and despite the visual agreement of the charcoal stratigraphies, the image analysis typically identified a larger number of small-sized particles, (size classes one to three) with the exception of core 1 size class 3. The differences between the methods for the number of particles in the two largest class sizes were less pronounced (Table 1). Only core 3 yielded statistically significant differences between the methods for the number of small-sized particles. Interestingly, core 3 was collected closest to the peat basin border and had a larger charcoal record than the two other cores that were collected more towards the centre of the peatland. Even though the distances from core 3 to the other cores were only a couple of metres, core 3 contained significantly more charcoal particles than the other cores, and this was the case for particles in all size classes (Figure 3 and Table 1).
Charcoal particle number (mean ± 1 SE cm–3) in different size classes from charcoal bands in three neighbouring peat cores collected at different distances from the border of the peat basin. Particle number was estimated by two different methods, where method 1 is a mass quantification method based on manual hand picking, and method 2 is based on image analysis; see ‘Material and methods’ for further information. Core 1 was collected in the centre of the peat basin and core 3 was collected closest to the basin border. The distance between cores 1 and 2 was ca. 2 m, and the distance between cores 2 and 3 was ca. 3 m. Different letters for Methods 1 and 2 within a given core indicate significant difference (GLMM; p < 0.05; Tukey test – also see Tables 2 and 3).
GLMM: generalized linear mixed model.
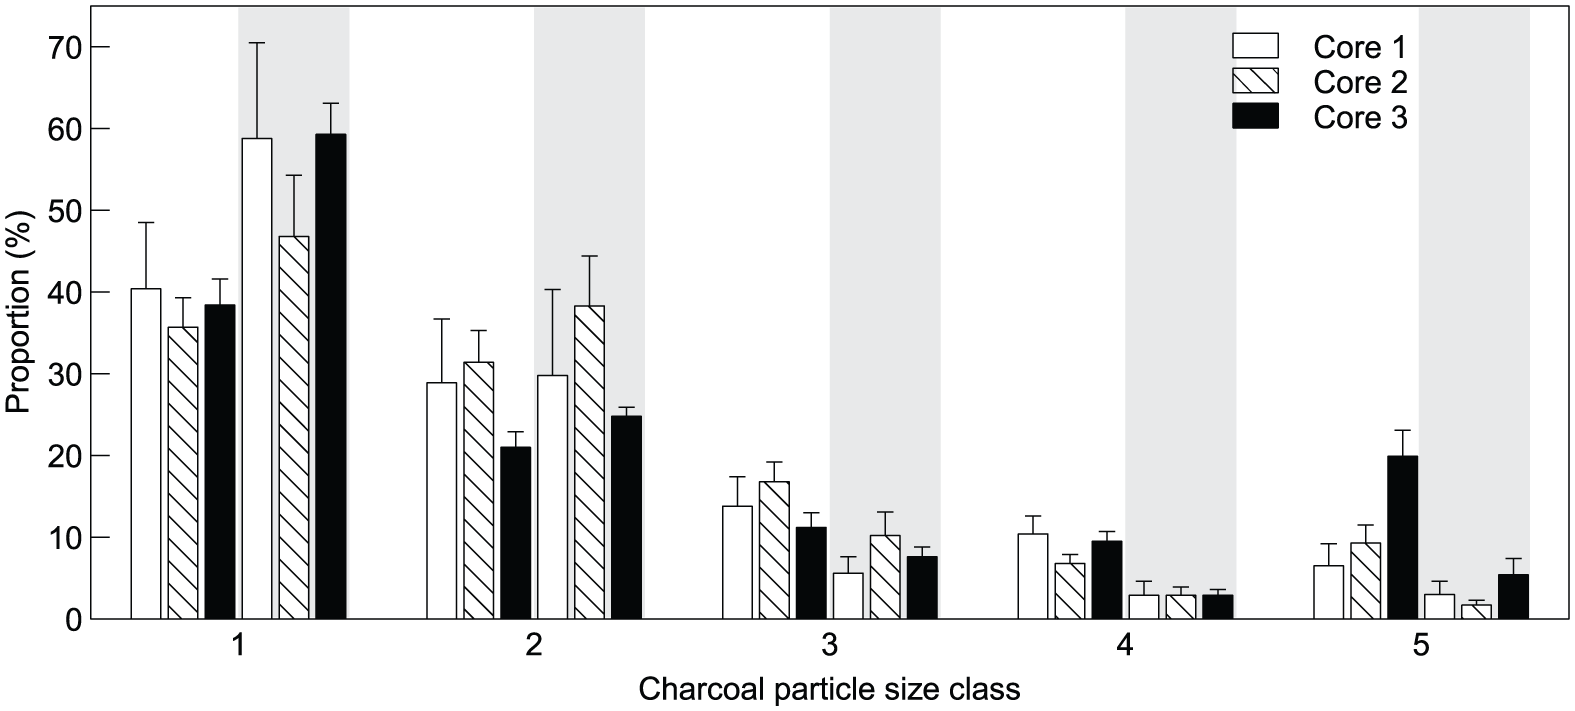
Proportion of charcoal particles in different size classes from three neighbouring peat cores as estimated by two different methods. Light-grey-shaded proportions were estimated by automated image analysis and the unshaded proportions were estimated by manual hand picking; see ‘Material and methods’ for further information.
An important feature of the difference in the charcoal record among the cores is that the proportion of the largest particles increased significantly with decreasing distance to the peat basin margin (Figure 4 and Table 2), for example, the average proportion of particles in size class five increased from 6% in core 1 to 20% in core 3 as estimated by the mass quantification method. The corresponding increase as determined by the image analysis was from 2% to 5% (Figure 4).
Split-plot ANOVA testing for the effect of method and core number on the proportion of charcoal particles (log-transformed) in size class 5.

Bold values indicate significant effects at p < 0.05.

Charcoal records in three neighbouring peat cores collected at different distances from the margin of a small peat basin. Horizontal bars show the number (count), mass (g) and volume of charcoal particles (cm3) as estimated by two different methods, where number 1 and mass were estimated by a mass quantification method based on manual hand picking, and number 2 and volume (light grey shaded) were estimated by automated image analysis; see ‘Material and methods’ for further information. Core 1 was collected in the centre of the peat basin and core 3 was collected closest to the basin border. The distance between cores 1 and 2 was ca. 2 m, and the distance between cores 2 and 3 was ca. 3 m. Note logarithmic scale.
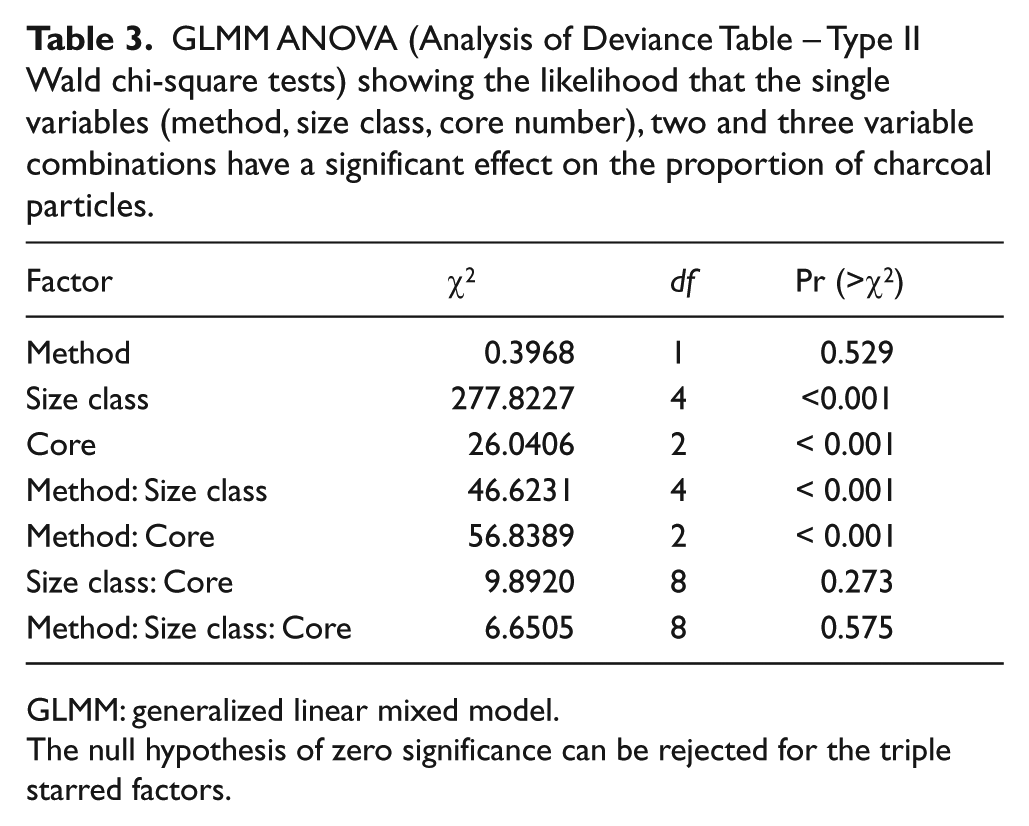
A further difference between the two methods is that the image analysis rendered larger variations in the estimates of charcoal particle number as compared to the mass quantification. The magnitude of this variation differed among the particle size classes (Table 1), which in turn resulted in correlations that were particle size class specific when the two methods were compared as regard charcoal particle number estimation (Table 3). For example, the Spearman correlation coefficients ranged from 0.526 (p = 0.007; n = 47) to 0.616 (p < 0.0001; n = 47) among the particle size classes, with size class five having the highest value (Table 4).
GLMM ANOVA (Analysis of Deviance Table – Type II Wald chi-square tests) showing the likelihood that the single variables (method, size class, core number), two and three variable combinations have a significant effect on the proportion of charcoal particles.
GLMM: generalized linear mixed model.
The null hypothesis of zero significance can be rejected for the triple starred factors.
Spearman rank order correlation coefficients between nine charcoal variables as estimated by an image analysis method and charcoal mass as estimated by manual hand picking.
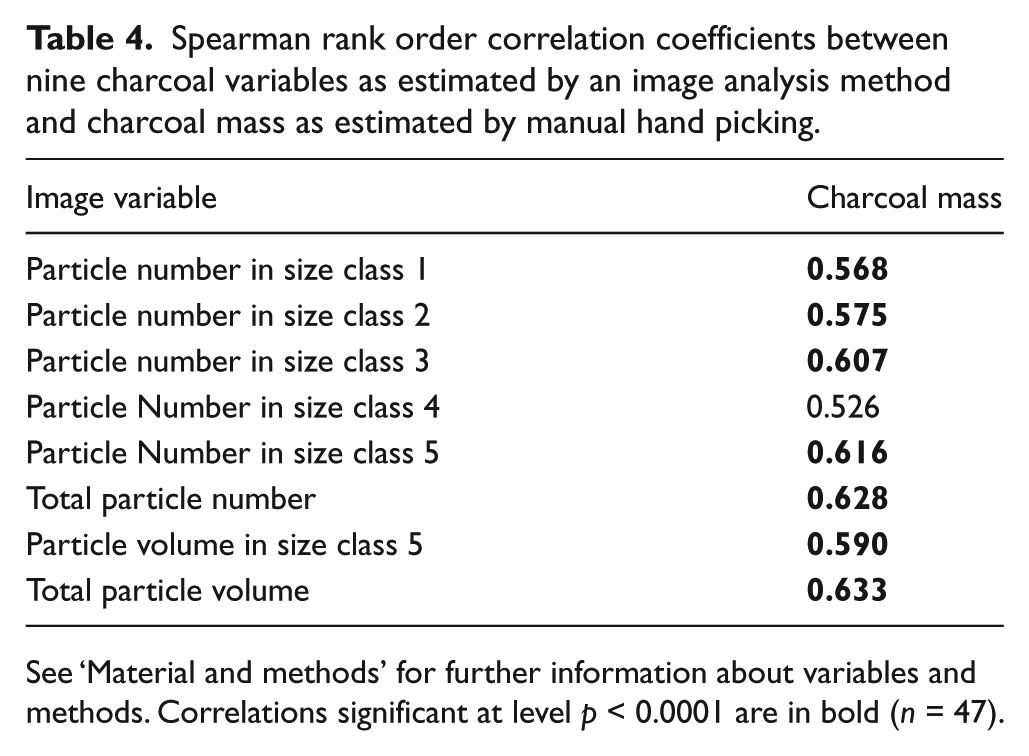
See ‘Material and methods’ for further information about variables and methods. Correlations significant at level p < 0.0001 are in bold (n = 47).
Furthermore, there are other recording differences between the two methods as the mass quantification method found charcoal fragments in two samples at the depths of 80 and 90 cm in core 1, where none were recorded using the image analysis method. In the same way, the image analysis identified charcoal particles that were not found by the mass quantification, that is, at a depth of 32 cm in core 1 (Figure 3).
Image analysis as predictor of charcoal mass
Average total charcoal particle volumes ranged from 5 to 105 mm3 cm–3 among the cores, with the highest values for core 3 (Figure 5a). The volume of the two smallest size classes was almost negligible as the volume of the largest size class five made up 90% of the total volume. Average total charcoal area showed the same pattern as for volume and ranged from 3.1 to 41.0 mm2 cm–3 (Figure 5b).

Total (a) volume and (b) area of charcoal particles in five size classes from three neighbouring peat cores as estimated by automated image analysis. Size class 1 (mm) = 0.20–0.49; 2 = 0.50–0.99; 3 = 1.00–1.49; 4 = 1.50–1.99; and 5 = >2.00. Note logarithmic scale on the vertical axes.
The image analysis variable that correlated the best, and could thus explain most of the variation in charcoal mass as quantified by the mass quantification method, was the total charcoal particle volume (rs = 0.633; p < 0.0001). However, total particle number correlated almost as well as total volume. We found slightly weaker correlations for particle number in size class 3 and 5, which were still strong and highly significant (Table 4). We also found generally significant correlations between the methods for the number of particles in each size class (data not shown).
Discussion
Method discrepancies
As the mass quantification method is based on manual hand picking, it was expected that the image analysis would identify a larger amount of small particles, simply because these are hard to detect and sort out from the peat matrix by hand picking. This implies that the difference between our two methods will be most accentuated for charcoal records that are dominated by small particles. Image analysis, using the free programme ImageJ (imagej.nih.gov/ij), can be used to identify and count charcoal fragments that are down to a few microns in size, although >0.002 mm2 (>44.7 µmm length) is a useful threshold to use to eliminate erroneous groups of pixels. Previous work has suggested that image analysis estimates of fragment number may be lower than those visually determined because particle edges have a lower optical density than the centre, resulting in small particles not being observed and larger particles appearing smaller (Hawthorne and Mitchell, 2016; Horn and Sanford, 1992; Macdonald et al., 1991). In this study, this effect has been reduced by increasing the threshold value. This is possible if several techniques are used such as elimination of non-charcoal material using a low magnification binocular microscope and then careful choice of the threshold value used in the ImageJ programme combined with non-inclusion of particles <0.002 mm2 (<44.7 µmm length). The sample volume in this study, although large, is within the contemporary recommended volume size (Higuera et al., 2010). For peak detection (not explored in this study), the desirable volume size is that which results in average non-peak samples of >10 pieces and peak values of at least 20 pieces (see Higuera et al., 2010).
A small number of samples that contained a large number of small charcoal particles among many dark minerogenic fragments needed to be subsampled. The image analysis is obviously limited by the capabilities of the camera, the resolution of the computer monitor and the time available to eliminate minerogenic material through careful processing. What does the presence of this minerogenic material imply from a palaeoecological perspective? How could changes in sediment flux, induced by fire or other disturbances affect the results obtained in this study, in particular, for the image analysis method? Environmental disturbances, such as storms and human activity, can increase the quantity of mineral matter transported into sediment. Eliminating the addition of a significant amount of non-charcoal dark, opaque material to the quantity of charcoal fragments in the analysis needs consideration. In this study, both methods employed processing elements that required evaluation of individual particles on a sample by sample basis. The mass quantification hand picks charcoal particles. The image analysis method initially uses sieving to eliminate most of the larger pieces of minerogenic material and then a light microscope and a pipette to further eliminate non-charcoal material. Although this increases the image analysis method processing time initially, it does provide more accurate results and reduces processing time at the image stage. Both methods can be used to obtain valuable insights of other organic material in the sediment.
In contrast to the detailed results given by the image analysis, hand picking is likely to underestimate the importance of fire disturbance given that the charcoal record is dominated by a large number of small particles. In a palaeoecological perspective, it is thus clear to us that the image analysis is superior to hand picking as it has the potential to provide higher resolution and thereby more precise descriptions of fire importance and fire history. However, charcoal particle number is not necessarily a robust indicator of fire size or severity, for example there are differences between crown and surface fire (Leys et al., 2013).
Interestingly, the image analysis revealed charcoal particles at one depth in core 1 (i.e. 32 cm) while no charcoal was detected by the mass quantification method at the same depth (Figure 4). In contrast, the mass quantification method found charcoal that was not detected by the image analysis at two depths in core 1 (i.e. 80 and 90 cm). In these cases, there were always only very minor amounts of charcoal in the samples, and it is plausible that the lack of consistency can be explained by an uneven particle distribution between the two peat slice halves that were analysed at the different laboratories in Norway and England. Another possible explanation is that black plant remains, for example, rhizome epidermis of horsetail plants (Equisetum sp.), were erroneously identified as charcoal by the mass quantification method.
Our study further suggests that sample preparation methodology is an important determinant of fragment number and should be taken into account when making regional fire summaries comprising multiple sites and investigators. For example, as incompletely pyrolysed charcoal particles degrade faster than completely pyrolysed particles (Knicker, 2011; Rumpel and Kögel-Knabner, 2011), it is likely that the discrepancy between the results from our two methods will be largest for incompletely pyrolysed particles because these are less resistant against our use of bleaching in the sample preparation process, which is known to eliminate charred particles and only leave fully pyrolysed and carbonized material. Thus, the degree of similarity between different methods to quantify charcoal is not only dependent on intrinsic methodological differences but also on the charcoal properties itself. In this context, it is not only the degree of pyrolysis that matters but also charcoal stock origin is of importance – for example, resinous pine charcoal is more resistant against degradation than charcoal from more soft wooded spruce. That charcoal particle number estimates differ between methods is further corroborated by Ali et al. (2009). Taken together, this underpins the difficulties in selecting reliable and comparable methods for charcoal quantification.
On the contrary, our two methods are more comparable as regards estimates of charcoal pool size. The reason for this is that they did not differ significantly in the estimates of the largest and easily detectable particles (see Table 1), which by far make up the majority of the charcoal mass and volume.
Correlations between image analysis and mass quantification
Particle number, as estimated by the two methods, was in general strongly correlated, and this was the case for all particle size classes except for particles in size class four, which was the size class that comprised fewest particles (Table 1). Total particle number and total particle volume were those variables that correlated strongest with charcoal mass (Table 4). This was an anticipated result as Weng (2005), Ali et al. (2009), Leys et al. (2013) and Crawford and Belcher (2016) have shown that charcoal particle volume estimates are more accurate and robust to depict the amount of charcoal than particle number. However, due to the strongly skewed distribution of charcoal particle data in our study, it is not possible to precisely estimate the explanatory power of variables that were estimated by the image analysis. Total particle mass correlates significantly with total particle volume at rs = 0.633 (n = 47) showing that the two methods are comparable for these variables although using volume can produce misleading interpretations of fire regimes due to the variation generated (Leys et al., 2013). Total particle mass correlated significantly with total particle number (image analysis method) at rs = 0.628 which cannot be explained easily. Total particle number (mass method) correlates significantly with total particle number (image analysis method) at rs = 0.572; however, this is not consistent across the size classes; classes one and five correlate significantly, but size classes two, three and four do not. There is still a need for more comparative studies of methods to find statistically significant variables that can be used to compile multiple site datasets.
Methodological implications of differences among peat cores
Variability in particle size and morphology of particles depends on the ratio between Potential Charcoal Source Area (PCSA) and fire size, and the absolute size and location of fire within the PCSA (Conedera et al., 2009). Discriminating PCSA using particle size distribution can be a useful tool in identifying regional and local fire events (Iglesias et al., 2015). Although all class sizes of particles are present in both regional and local fires, meso- and macro-charcoal (>180 µm) tends to represent more local fire events and micro-charcoal (<180 µm) tends to represent regional fire events (Higuera et al., 2007, 2010). Here, local fires as represented by charcoal particles >250 µm (major axis length) were subdivided into five class sizes. This study has shown that methodological differences can create biases in class size quantifications and hence this can have implications on the interpretation of fire regimes if not all size classes are adequately represented. Fires further away and less intense could potentially be picked up by some methods and not others. Charcoal fragment deposition patterns are unique to each fire event; however, results herewith highlight differences in spatial deposition that would benefit from further study. The proportion of size classes between the cores is relatively similar given the large SE values; however, the amount of charcoal generally increases from core 1 to core 3 for both methods. This could imply that the amount of charcoal fragments found in sediments is a better indication of site proximity to palaeofire events than size class distribution.
The gradual increase in charcoal particle size when moving closer to the peat basin border (from core 1 to core 3) has important implications in palaeoecological and methodological perspectives. This is because large charcoal particles (>0.5 mm) are typically locally deposited (evidence from contemporary fires may mean this value needs to be adjusted to a higher threshold) and thus indicative of in situ local fires (Clark, 1988; Gavin, 2003; Ohlson and Tryterud, 2000). Given this, truly local fire histories will be more detectable and most clearly revealed in samples collected close to the peat basin border. In contrast, the probability in detecting local fires decreases in samples collected further away from the basin border because of the dominance of small charcoal particles which are known to disperse over long distances and could thus be indicative of non-local fires (Clark et al., 1998). Previous studies by, for example, Pitkanen et al. (2001) and Ohlson et al. (2006) corroborate the occurrence of such peat-basin-specific patterns in the charcoal record as they also document decreasing amounts of charcoal from the border towards the centre of different types of peat basins in terms of both charcoal band layers and charcoal particle numbers. Thus, sound conclusions about charcoal record sizes and fire histories cannot be drawn from single peat cores, as every peat sample location will render unique and context-dependent results.
Perhaps future similar studies will lead to the formulation of a weighting scale that can be applied to charcoal fragment quantities to allow for differences in charcoal quantity dependent on the distance of the core site relative to the peat basin edge.
Differences in charcoal quantities between size classes for the different methods as shown here highlight the importance of selecting datasets using similar methods for isolation of charcoal fragments and for recording charcoal concentrations when comparing charcoal fragment records.
Conclusion
We draw five main conclusions from our study:
The mass quantification method and the image analysis method rendered markedly, and in some cases significantly, different results for small-sized particles (<1 mm in diameter), but not for larger particles.
The difference between the methods increased with increasing amounts of charcoal in the records.
Total charcoal particle volume, as estimated by the image analysis, was the best predictor of charcoal mass.
Size matters; the largest size class of the charcoal particles made up 90% of the total charcoal volume and mass.
The charcoal records differed significantly among closely neighbouring peat cores in one and the same peat basin.
Both the mass quantification method and the image analysis method have identified a similar range of samples where charcoal fragments, and hence incidence of local fires, occur. Across the three cores, there is an increase in charcoal towards the deeper parts, and the two cores that were collected closest to the peat basin margin (i.e. cores 2 and 3) show earlier peaks in charcoal and did also contain significantly more charcoal than the core that was collected in the centre of the peatland (i.e. core 1). There are differences between the methods; charcoal volume data (image analysis method) compared with mass data (mass method) for the different size classes showed greater statistical significance than comparing size classes irrespective of method. Our study has also shown that different particle size classes do not necessarily compare across methods. A further result is that multiple cores collected close to each other in one peatland differ significantly in their charcoal records. No charcoal quantification methods render the same results, and although there is still a need for a common and unifying method to enable reliable comparisons of results from future studies, quantification of charcoal fragments using a size measurement rather than a count provides more significant results in cross-site or multiple-core studies.
Footnotes
Acknowledgements
The authors are thankful to Ole Wiggo Røstad for his assistance with Figure 4. KM Halsall would like to thank Fabienne Marret-Davies for suggestions and encouragement and Mike O’Connor for technical support. Ellingsen and Ohlson are thankful for excellent housing at Brunvall Gård during fieldwork. Permit to conduct research in Brånakollane Nature Reserve was given by the County Governor of Vestfold (2013/3878). The authors thank Kjell Lie, on behalf of the forest owner, for kind help with access to the forest area.
Funding
This study was supported by the Research Council of Norway (Project 225018: From spruce to beech forests – fundamental ecosystem transformation driven by climate change).