
Abstract
Cliff-top dunes are a locally important geomorphic features of sedimentary coasts. They are traditionally interpreted as being sourced by (or with) sand derived from the beach below the cliff. This paper presents the results of a stratigraphic and geochronological study of Carlo Sand Blow, a coastal blowout that has developed on top of a high sandy cliff in the Cooloola Sand Mass, south-east Queensland. We use a combination of sedimentological, pedological and geophysical techniques along with optically stimulated luminescence dating to determine the depositional history and evolution of the blowout. We demonstrate that the blowout is dominantly nourished by sand eroded from its floor rather than the adjacent beach. The original dune surface dates to the first half of the last glacial period (c. 40–70 ka) and this dune was deflated in the late-Holocene. Dune activity is directly associated with cliff undercutting because of coastal retreat in the late-Holocene, but coastal erosion on its own is not capable of maintaining aeolian activity. Blowout activity occurred between 2.6 and 2.3 ka and again at 0.3 ka with aeolian sand burying palaeosols. Both soil surfaces contained charcoal and tree stumps in growth position and our study suggests that fire is the immediate trigger for blowout reactivation. It is likely that these fires were anthropogenic in origin, because the site is somewhat protected from natural fire and the ages coincide with intensification of human use of coastal sites in the area.
Introduction
Coastal dune fields are common features along coastlines and can be found at almost all latitudes, as long as there is an adequate supply of sediment available and onshore winds are persistent and capable of aeolian transport (Hesp, 2011; Pye, 1983b). These dune fields are important geomorphological features that provide a buffer from storm surge, coastal flooding and sea-level rise (Carter, 1991; Pye and Tsoar, 2009; Short, 1999). Work on coastal dune fields has improved our understanding of aeolian transport in vegetated areas (e.g. de M Luna et al., 2011; Walker et al., 2014, 2017), modern advancement rates of transgressive dunes (e.g. Pye, 1983a) and the distribution and morphological variety of dune fields (e.g. Pye, 1983b; Short, 1999). Despite these works, there is still an incomplete understanding of how coastal dunes initiate and evolve through time. Coastal dune fields are subject to sea-level variation, alterations of climate regimes and variable sediment supplies, all of which may affect dune activation and stabilisation. Morpho-stratigraphic and geochronological studies of dunes and dune fields are required to improve the understanding of these factors and how they control dune field behaviour at different spatial and temporal scales.
Blowouts are defined as depressions formed via deflation and wind erosion on a pre-existing deposit of sand (Hesp, 2002; Hesp and Hyde, 1996). They consist of a deflation basin, a depositional lobe where the deflated material is deposited and erosional side walls on the flanks of the dune (Hesp and Hyde, 1996). Blowouts are common features in coastal and desert dune fields and can form in a number of ways. The primary process of their formation is through the decline in vegetation cover or destruction of vegetation that allows sediment to be transported by aeolian processes (Carter, 1990; Carter et al., 1990; Cooper, 1958; Jennings, 1957). The reduction in vegetation cover can occur in several ways, including wave erosion along the seaward margin of a dune, high wind speeds damaging vegetation or producing high deposition rates, changes in climate including increased storminess or aridity, vegetation dieback and disruption of dune cover by human activity (Hesp, 2002; Hesp and Hyde, 1996). Blowouts can provide useful insight into the depositional history and evolution of dune fields as they expose older, underlying dune deposits. They also respond rapidly to climate, anthropogenic influences, geomorphic changes and sea-level fluctuations and can shift rapidly between active and stable states (Abhar et al., 2015; Barchyn and Hugenholtz, 2013). To date, however, studies of coastal blowouts and their relationship to coastal dynamics and climate/sea-level change are under-represented in the literature (e.g. Abhar et al., 2015; Jewell et al., 2017; Sawakuchi et al., 2008; Walker et al., 2014).
Here, we present the results of a morpho-stratigraphical and geochronological investigation of a large coastal blowout, the Carlo Sand Blow. The activation of this blowout is unusual because the blowout derives not from the beach but from the high sandy cliff that the blowout is situated on. Here, we investigate both the cause of the initial dune activation and the evolution of the blowout. The goal of this study is to provide a further understanding of late-Holocene dune development within the CSM and to investigate the driving mechanism of dune initiation and reactivation.
Regional context and study site
The coastline of south-east Queensland, Australia, incorporates several of the world’s largest sand islands and substantial coastal dune fields. One such dune field is the Cooloola Sand Mass (CSM; Figure 1). The dune field is ~60 km long, ranges in width from 1 to 12 km and has a total area of ~240 km2 (Thompson, 1992; Thompson and Moore, 1984). Large, stabilised parabolic dunes aligned SE to NW make up the majority of the dune field with dune crests reaching elevations of up to 240 m.a.s.l. The western (inland) section of the dune field consists of older, eroded dunes with low relief, which displays little original dune morphology (Thompson, 1981). To the north, high sea cliffs along Rainbow Beach are present, reaching elevations of up to 140 m and are presently being eroded by scarp retreat and mass movement.
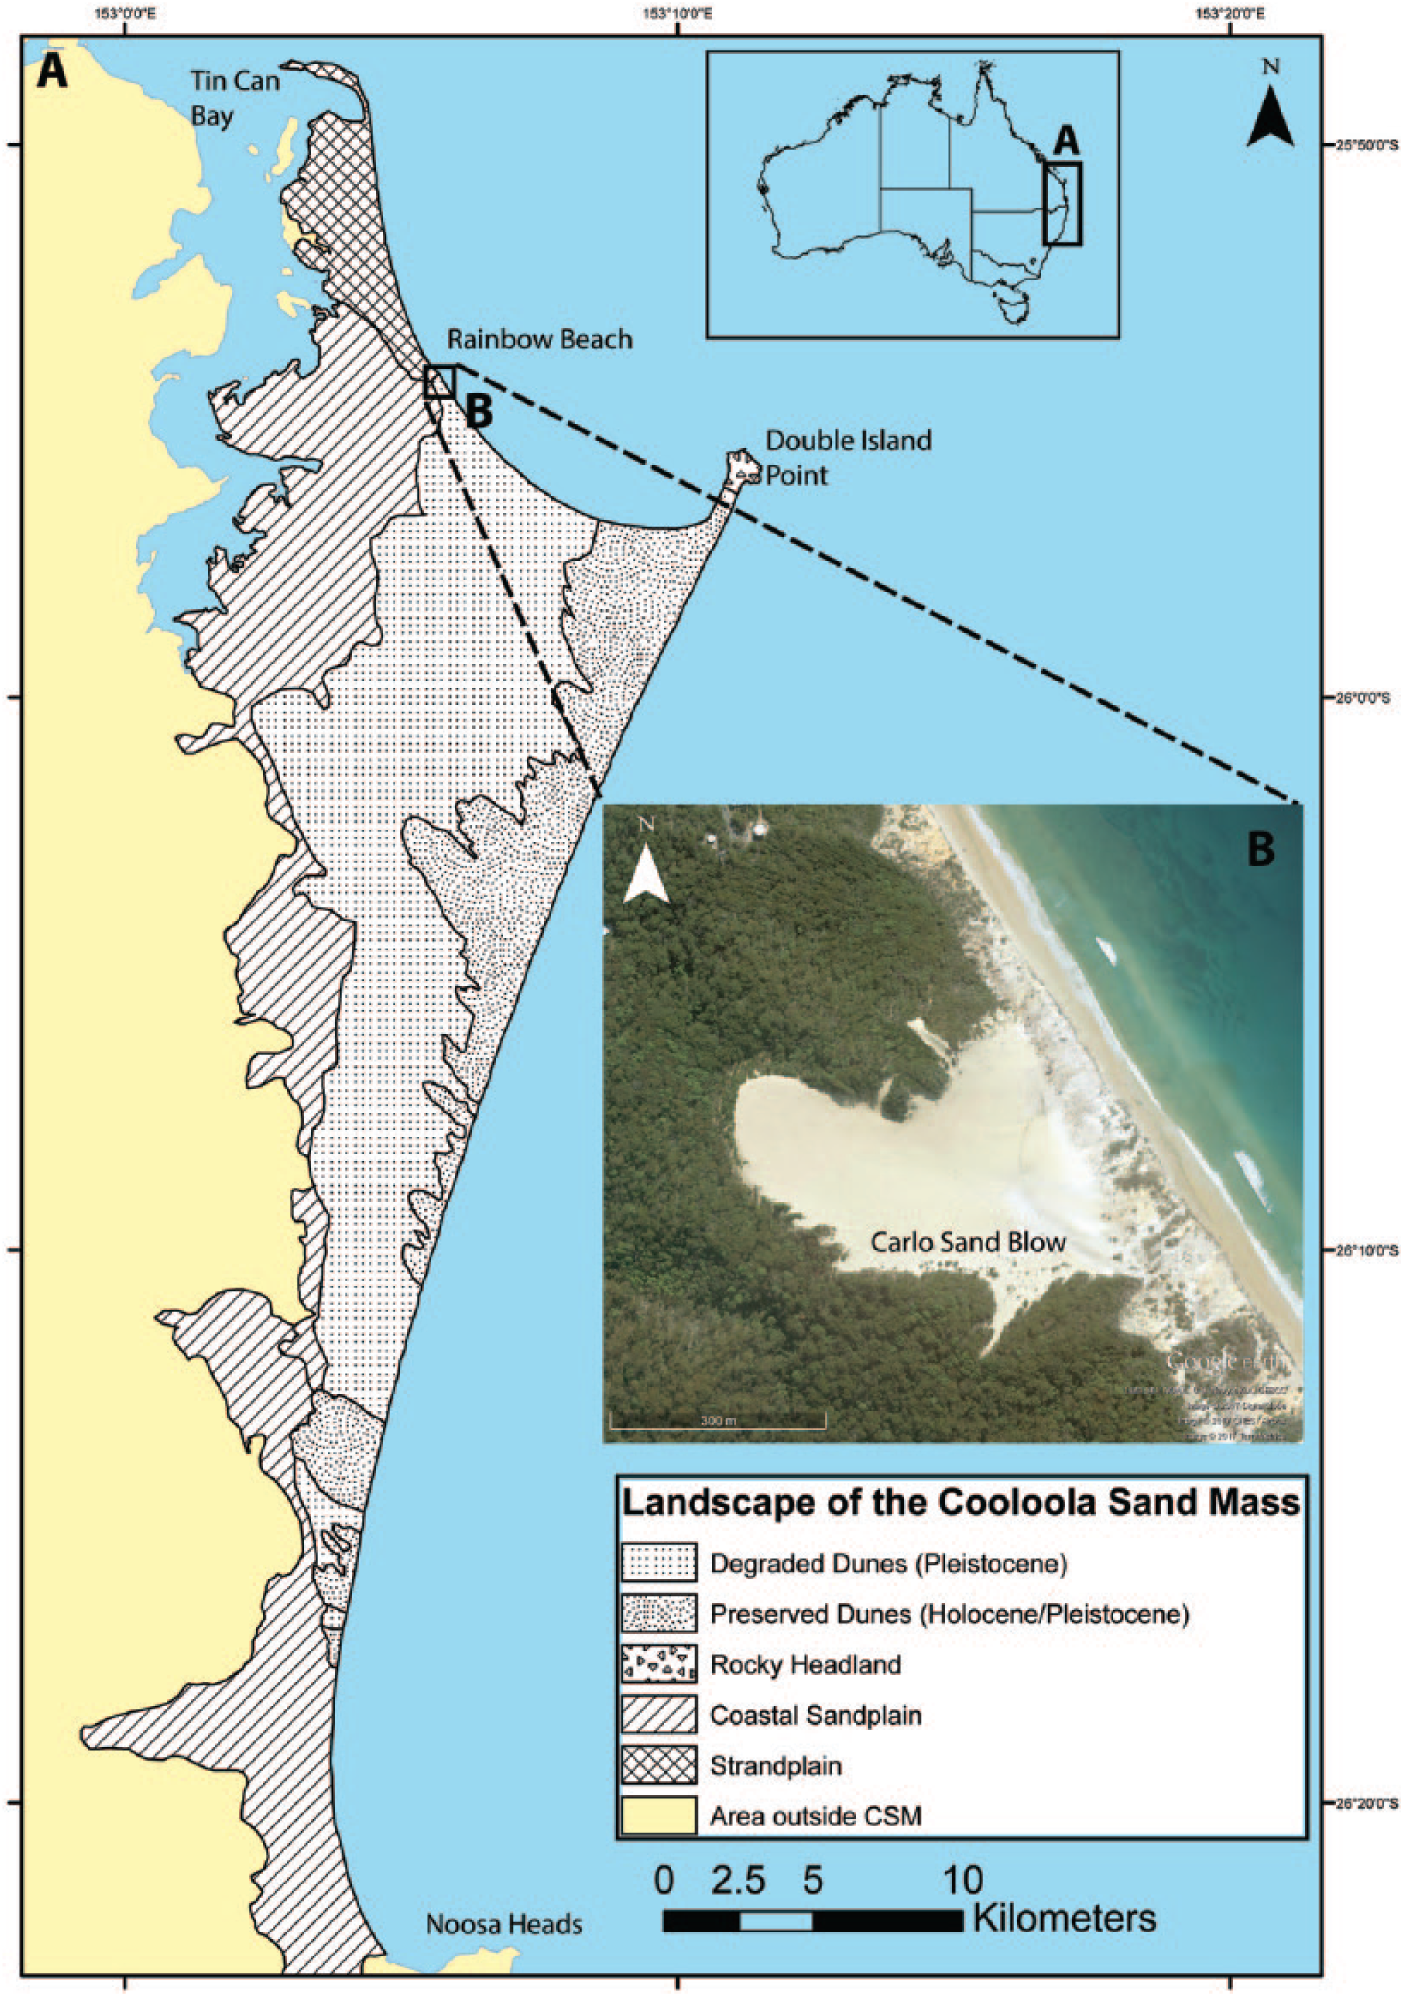
Panel A: map of the Cooloola Sand Mass showing the major morphological features. Panel B: satellite image of the Carlo Sand Blow and the cliffs of Rainbow Beach.
Early work using thermoluminescence dating revealed that the oldest dune units at Cooloola dated to ~700 ka (Tejan-Kella et al., 1990). More recently, Walker et al. (2018) published a revised, single-grain optically stimulated luminescence (OSL) chronology from the CSM that confirmed the great age of the CSM and highlighted the episodic nature of dune development that has occurred through the Pleistocene and Holocene. In their study, the Holocene units dated from 3 to 4 ka, ~6 ka and 8–10 ka (Walker et al. 2018). The next oldest dune systems are estimated to be 146 ± 5 ka. The older dune systems dated in Walker et al. (2018) fall well outside the scope of this paper and are not discussed further.
The Carlo Sand Blow is situated at the north-eastern limit of the CSM (25.914°S, 153.100°E, Figure 1). It is one of only three active blowouts in the CSM and has developed along a section of the high sea cliffs along Rainbow Beach. According to Queensland Parks and Wildlife Service, the blowout was first described by Captain James Cook when he sailed along the east coast of Australia during the 1769 Voyage of Discovery, so we interpret the feature to be of some antiquity. The crest of the blowout has advanced ~580 m inland from the modern cliff edge. The blowout deflation basin is 400 m wide at the cliff face and covers a total area of 143,700 m2. At the mouth of the blowout along the cliff face, the base of the blowout is 70 m.a.s.l. and reaches a maximum elevation at the crest of the active depositional lobe of 110 m.a.s.l. The long axis of the blowout is orientated to the NW in line with the prevailing south-easterly winds. Beyond the margins of the blowout, the dunes are heavily vegetated. In the area immediately surrounding the blowout, the landscape is dominated by sclerophyll woodland with the Pink Bloodwood (Corymbia intermedia), Black Butt (Corymbia tessellaris) and Scribbly Gum (Eucalyptus signata) composing the main canopy trees.
Climate
The climate of the CSM is humid sub-tropical (Peel et al., 2007). Summers are hot and moist, whereas winters are mild and drier (BOM, 2017). At the Double Island Point Lighthouse weather station (11 km away), the mean annual rainfall is 1367 mm with the highest rainfall occurring during austral summer months. During summer, the average maximum temperatures reach 28°C while the average maximum winter temperatures reach 22°C (BOM, 2017). The prevailing wind direction is south-easterly with a stronger southerly (and weak westerly) component during winter months (Coaldrake, 1961). Morning (9 am) wind conditions are typically weaker and more southerly, but winds intensify and trend south-easterly by the afternoon (3 pm). We note that there is a closer weather station at Rainbow Beach but because of its location behind thick vegetation, it is representative of the Cooloola area.
Geology and provenance
The CSM is composed of windblown siliceous sands that typically contain < 2% heavy minerals, notably zircon, rutile, ilmenite and monazite (Thompson, 1983, 1992). There is a small rocky headland at Double Island Point (Figure 1) that comprises late-Cretaceous andesites (Ball, 1924), as well as low hills composed of calcareous aeolianite (Ball, 1924). Exploratory drilling conducted along the Cooloola coast by Ball (1924) shows that windblown sediments extend to depths of 23–55 m below high tide mark and overlay intercalated layers of sandstone and clays. These sediments overlie Jurassic basement rocks that consist of fine-grained sandstones and shales (Ball, 1924).
Methodology
Fieldwork at Carlo Sand Blow was conducted in June 2015. The main depositional units of the blowout were mapped based on the stratigraphy, lithology and surface expression. Samples were collected for OSL dating, radiocarbon dating and soil and sedimentological descriptions. In addition, geophysical surveys were conducted using ground-penetrating radar (GPR) to investigate the internal structures in the blowout.
Field descriptions and sampling
In order to assess the stratigraphy and sedimentology of the sediments exposed along the Carlo Sand Blow, pits were hand dug along an axial transect of the blowout (Figure 2), from units representing different phases of dune activity as reflected by soil stratigraphy. Each unit crops out at the surface and is laid out horizontally because of the inclined surface of the deflation basin. Soil pits were dug into the lower and upper contacts of each horizon when possible. A total of seven pits were dug to a depth of 1.5 m each. At each pit, sediment characteristics including grain size, sorting, Munsell colour, mineralogy and any sedimentary structures were recorded and soil horizons were described. All soils were consistent with a Podzol classification (IUSS Working Group, 2015) as previously described (Thompson, 1981).
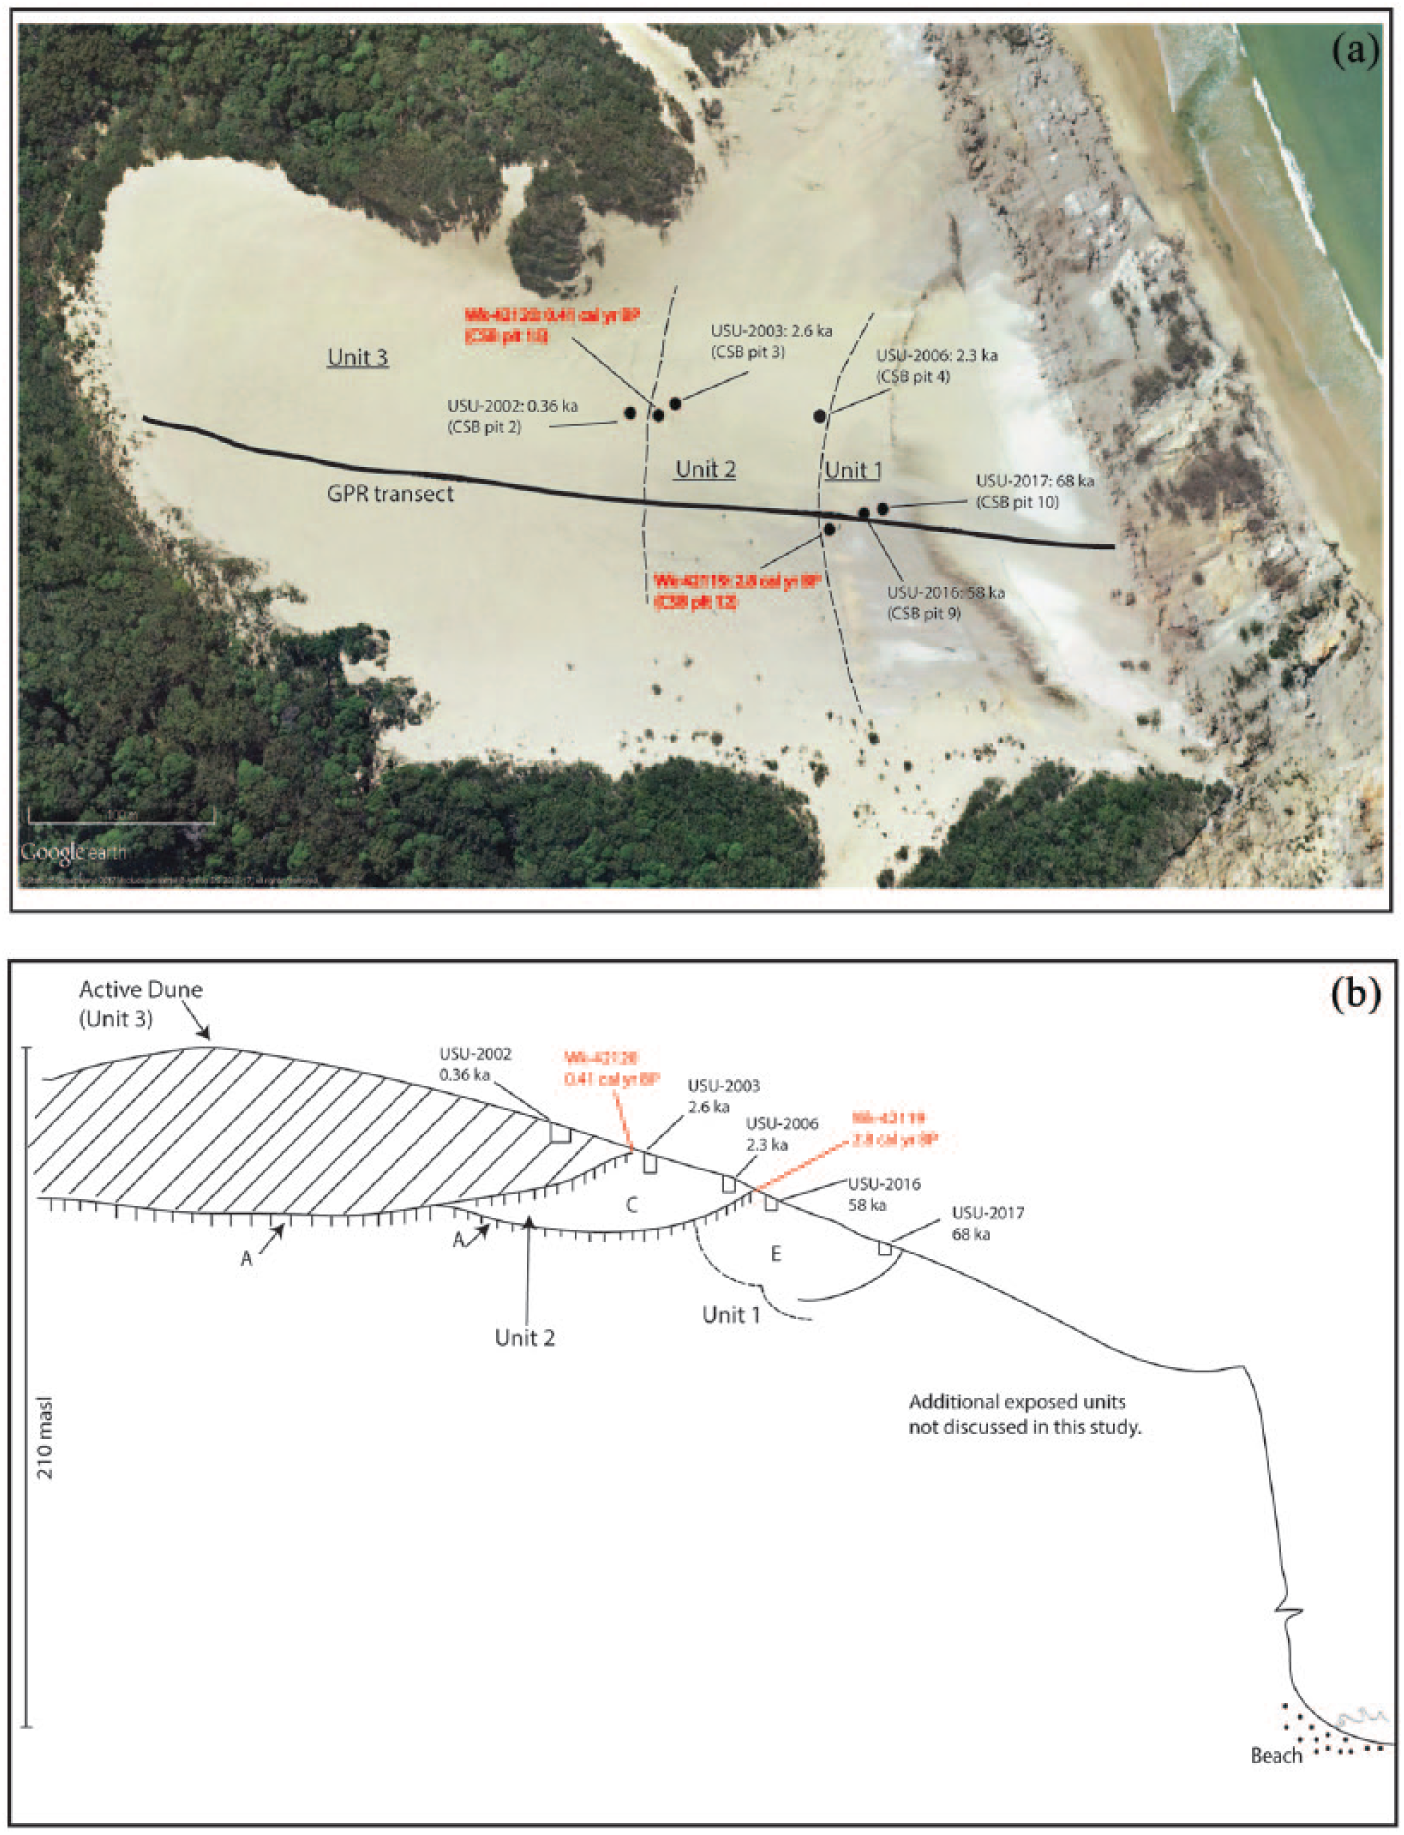
(a) Satellite imagery showing sample locations and ages (ages in black are OSL and ages in red are 14 C ages) along the Carlo Sand Blow. Black line denotes the axial GPR transect that corresponds to Figure 4. Dashed line shows approximate boundary between Units 1 and 3. (b) Idealised cross section of the Carlo Sand Blow showing the major units investigated in this study and chronology. Ages in red are 14 C ages. A denotes an A soil horizon. E denotes an E soil horizon. C denotes a C soil horizon. Horizontal axis not to scale.
OSL samples were collected from the soil pits dug into the deflated surface of the Carlo Sand Blow. Samples were recovered at a depth of more than 1 m from the surface to minimise cosmogenic ray dose rate issues. Care was taken to make sure that samples were recovered from materials that were more than 30 cm from a soil horizon boundary or from any significant sedimentary change. Samples were collected by pounding 20 cm long steel pipes into a freshly exposed surface. Representative bulk samples for dose-rate calculation were collected from a 30 cm radius surrounding the sample tube. The tube was removed, capped and sealed to prevent light exposure. Dose rate and moisture content were determined from sediments around the OSL sample.
Ground-penetrating radar
Ground-penetrating radar (GPR) surveys were conducted using a MALA Geosciences GX system using a 160 MHz antenna which gives a maximum penetration of 20–25 m. Lines were acquired parallel and perpendicular to the blowout axis. GPR surveys were hand dragged. Radar data was acquired using a 170 mm wheel for triggering and an on board DGPS receiver for geolocational information. All data were processed using GPR Slice v7 where velocity corrections, bandpass filtering, migration, DC drift, topographic modelling and gains were applied (see Gontz, submitted for details; Cassidy, 2009). The main axial line is presented in this paper (Figure 2).
Luminescence dating
OSL samples were processed and analysed at the Utah State University Luminescence Laboratory using the single-aliquot regenerative (SAR) dose analysis of quartz sand (Murray and Wintle, 2000, 2003; Wintle and Murray, 2006). Samples were opened under dim amber light (~590 nm) and sieved to 150–250 µm or 180–250 µm. An amount of 10% HCl and NaClO were used to remove carbonates and organic material, respectively. Sodium polytungstate at a specific gravity of 2.72 g/cm3 was used to separate heavy minerals from quartz sand. Finally, 40% hydrofluoric and concentrated hydrochloric acid washes were utilised to remove feldspars, etch the quartz grains and prevent formation of fluorite precipitates (Wintle, 1997). The purity of the samples was checked using infrared (IR) stimulation for all aliquots.
Representative subsamples for dose-rate determination were analysed using ICP-MS and ICP-AES techniques to determine the concentrations of K, Rb, Th and U in the sediment. In situ moisture content was measured for all the samples. For those with < 5% measured water content, an assumed value of 5 ± 2% was used to represent the average moisture history. Dose rates are calculated based on sediment chemistry, cosmic contribution and water content (Aitken, 1998; Aitken and Xie, 1990) using conversion factors from Guérin et al. (2011). The contribution of cosmic radiation to the dose rate was calculated using sample depth, elevation and latitude/longitude (see Supplementary Table 1, available online) following the calculations of Prescott and Hutton (1994).
Optical measurements
Optical measurements were performed on small-aliquot (1 mm diameter, ~10 grains per disc) samples using Risø TL/OSL Model DA-20 readers with blue-green light emitting diodes (LED; 470 ± 30 nm) as the stimulation source. The luminescence signal was measured through 7.5 mm ultraviolet (UV) filters (U-340) over 40 s (250 channels) at 125°C with LED diodes at 70–90% power (~45 mW/cm2) and calculated by subtracting the average of the last 5 s (background signal) from the first 0.7 s (four channels) of the signal–decay curve. The luminescence signals show rapid decay dominated by the fast component of the signal (Murray and Wintle, 2003). For those samples with < 1 Gy equivalent dose (DE), dose–response curves were fitted linearly between the zero dose and repeated regenerative doses. Where samples extended beyond the linear section of the regenerative curve, aliquots were fitted with either a saturating-exponential or a saturating-exponential plus linear fit based on the fit to the dose–response curve for each sample to calculate individual aliquot DE values (Murray and Wintle, 2000).
A preheat-plateau dose-recovery (PP-DR) test was performed on USU-2002 to determine the most suitable preheat temperatures and to test for dose recovery (following Murray and Wintle (2003; see Supplementary Figure 1, available online). For the PP-DR tests, six small (1 mm) aliquots were used at each temperature step and preheat temperatures were increased in 20°C increments from 200°C to 260°C, and held for 10 s. First, each non-heated and non-irradiated aliquot was optically bleached at room temperature by blue-green LED diodes at 90% power for 100 s twice, each followed by a 1000-s pause to let the thermally transferred charges decay (Li and Li, 2006). The aliquots were irradiated with beta doses similar to the burial dose: 2.9 Gy on USU-2002. The recovered doses were measured using the SAR-dose protocol with 160°C preheat following test doses (held for 10 s), and optical measurements were performed at 125°C for 40 s. Results from the PP-DR test suggest a 200°C preheat is best for the OSL samples in this study.
DE values were calculated using the Central Age Model (CAM) of (Galbraith and Roberts, 2012) at least 18 accepted aliquots of quartz sand. Aliquots were rejected if they had evidence of feldspar contamination, a recycling ratio beyond 20% of unity (<0.8 or > 1.2), recuperation > 1 Gy or natural DE greater than the highest regenerative dose given. Errors on DE and age estimates are reported at two-sigma standard error and include errors related to instrument calibration, and dose rate and equivalent dose calculations and the errors were calculated in quadrature using the methods of Aitken and Alldred (1972) and Guérin et al. (2011).
Radiocarbon (14 C) dating
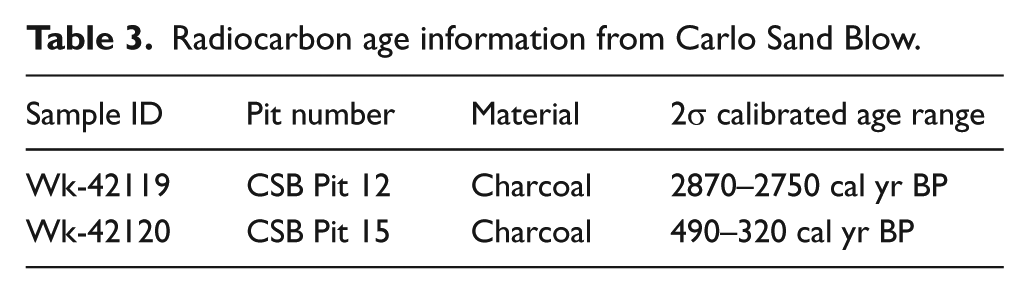
Two samples were collected for accelerated mass spectrometry (AMS) radiocarbon dating from charcoal-rich layers found within buried palaeosol horizons in two of the soil pits. Samples were dated at the University of Waikato Radiocarbon Dating Laboratory. Samples were pretreated using an acid–base–acid (ABA). Radiocarbon ages were calibrated at two sigma error using the SHcal13 calibration curve (Hogg et al., 2013) and are reported in years before present (1950; cal yr BP; Table 3). It should be noted that OSL ages are reported as years before 2015, so there is a 65-year offset between C14 and luminescence ages.
Sand drift potential
Sand drift potential (DP) is the potential for sand to be transported by wind over a 1 m wide area per unit of time and is expressed in vector units (VU; Fryberger and Dean, 1979). The DP for the region was calculated using wind field data provided by the Bureau of Meteorology spanning 56 years (1957–2013) collected from the Sandy Cape Lighthouse weather station (S24.7301 E153.2092) located ~120 km to the north on Fraser Island. Although this weather station is some distance from Carlo Sand Blow, it is considered to be representative of the coastline for the Cooloola region. Wind data was processed with WRPLOT software (https://www.weblakes.com/products/Wrplot/index.html). To calculate DP, resultant DP (RDP), resultant drift direction (RDD) and the RDP/DP ratio we used a DP excel macro developed by the authors (see Miot da Silva and Hesp, 2010) using the Fryberger and Dean (1979) method. Raw wind speed and direction data (in m.s−1) collected 2–3 times daily over the 56-year period was separated into 16 equal direction categories (22.5°) and the wind speed was split into 9 velocity categories in m s−1 (0–3; 3–5.6; 5.6–7; 7–8.7; 8.7–11.3; 11.3–14.3; 14.3–17.4; 17.4–20.6 and > 20.6 m s−1) to conform with Pearce and Walker (2005). The lowest velocity categories (0–3 and 3–5.6 m s−1) were not used in the calculation of DP. As calculations were done in m s−1, the VU values were determined using Bullard (1997).
Results
Lithology and soil stratigraphy
In total, at least six depositional units (comprising nine soil horizons) have been exposed by deflation along the entire Carlo Sand Blow. As we were interested in the development of the blowout itself, we focus on the upper three allostratigraphic units which incorporate three palaeosols (Table 1; Figure 2). Detailed soil and stratigraphic descriptions from pits dug on the outcrop are provided in Supplementary Data (see Supplementary Section 1, available online). Summary soil, lithostratigraphic and geophysical results are presented below. Photographs of each soil pit are shown in Figure 3.
Summary descriptions and sediment characteristics obtained from the stratigraphical investigation.
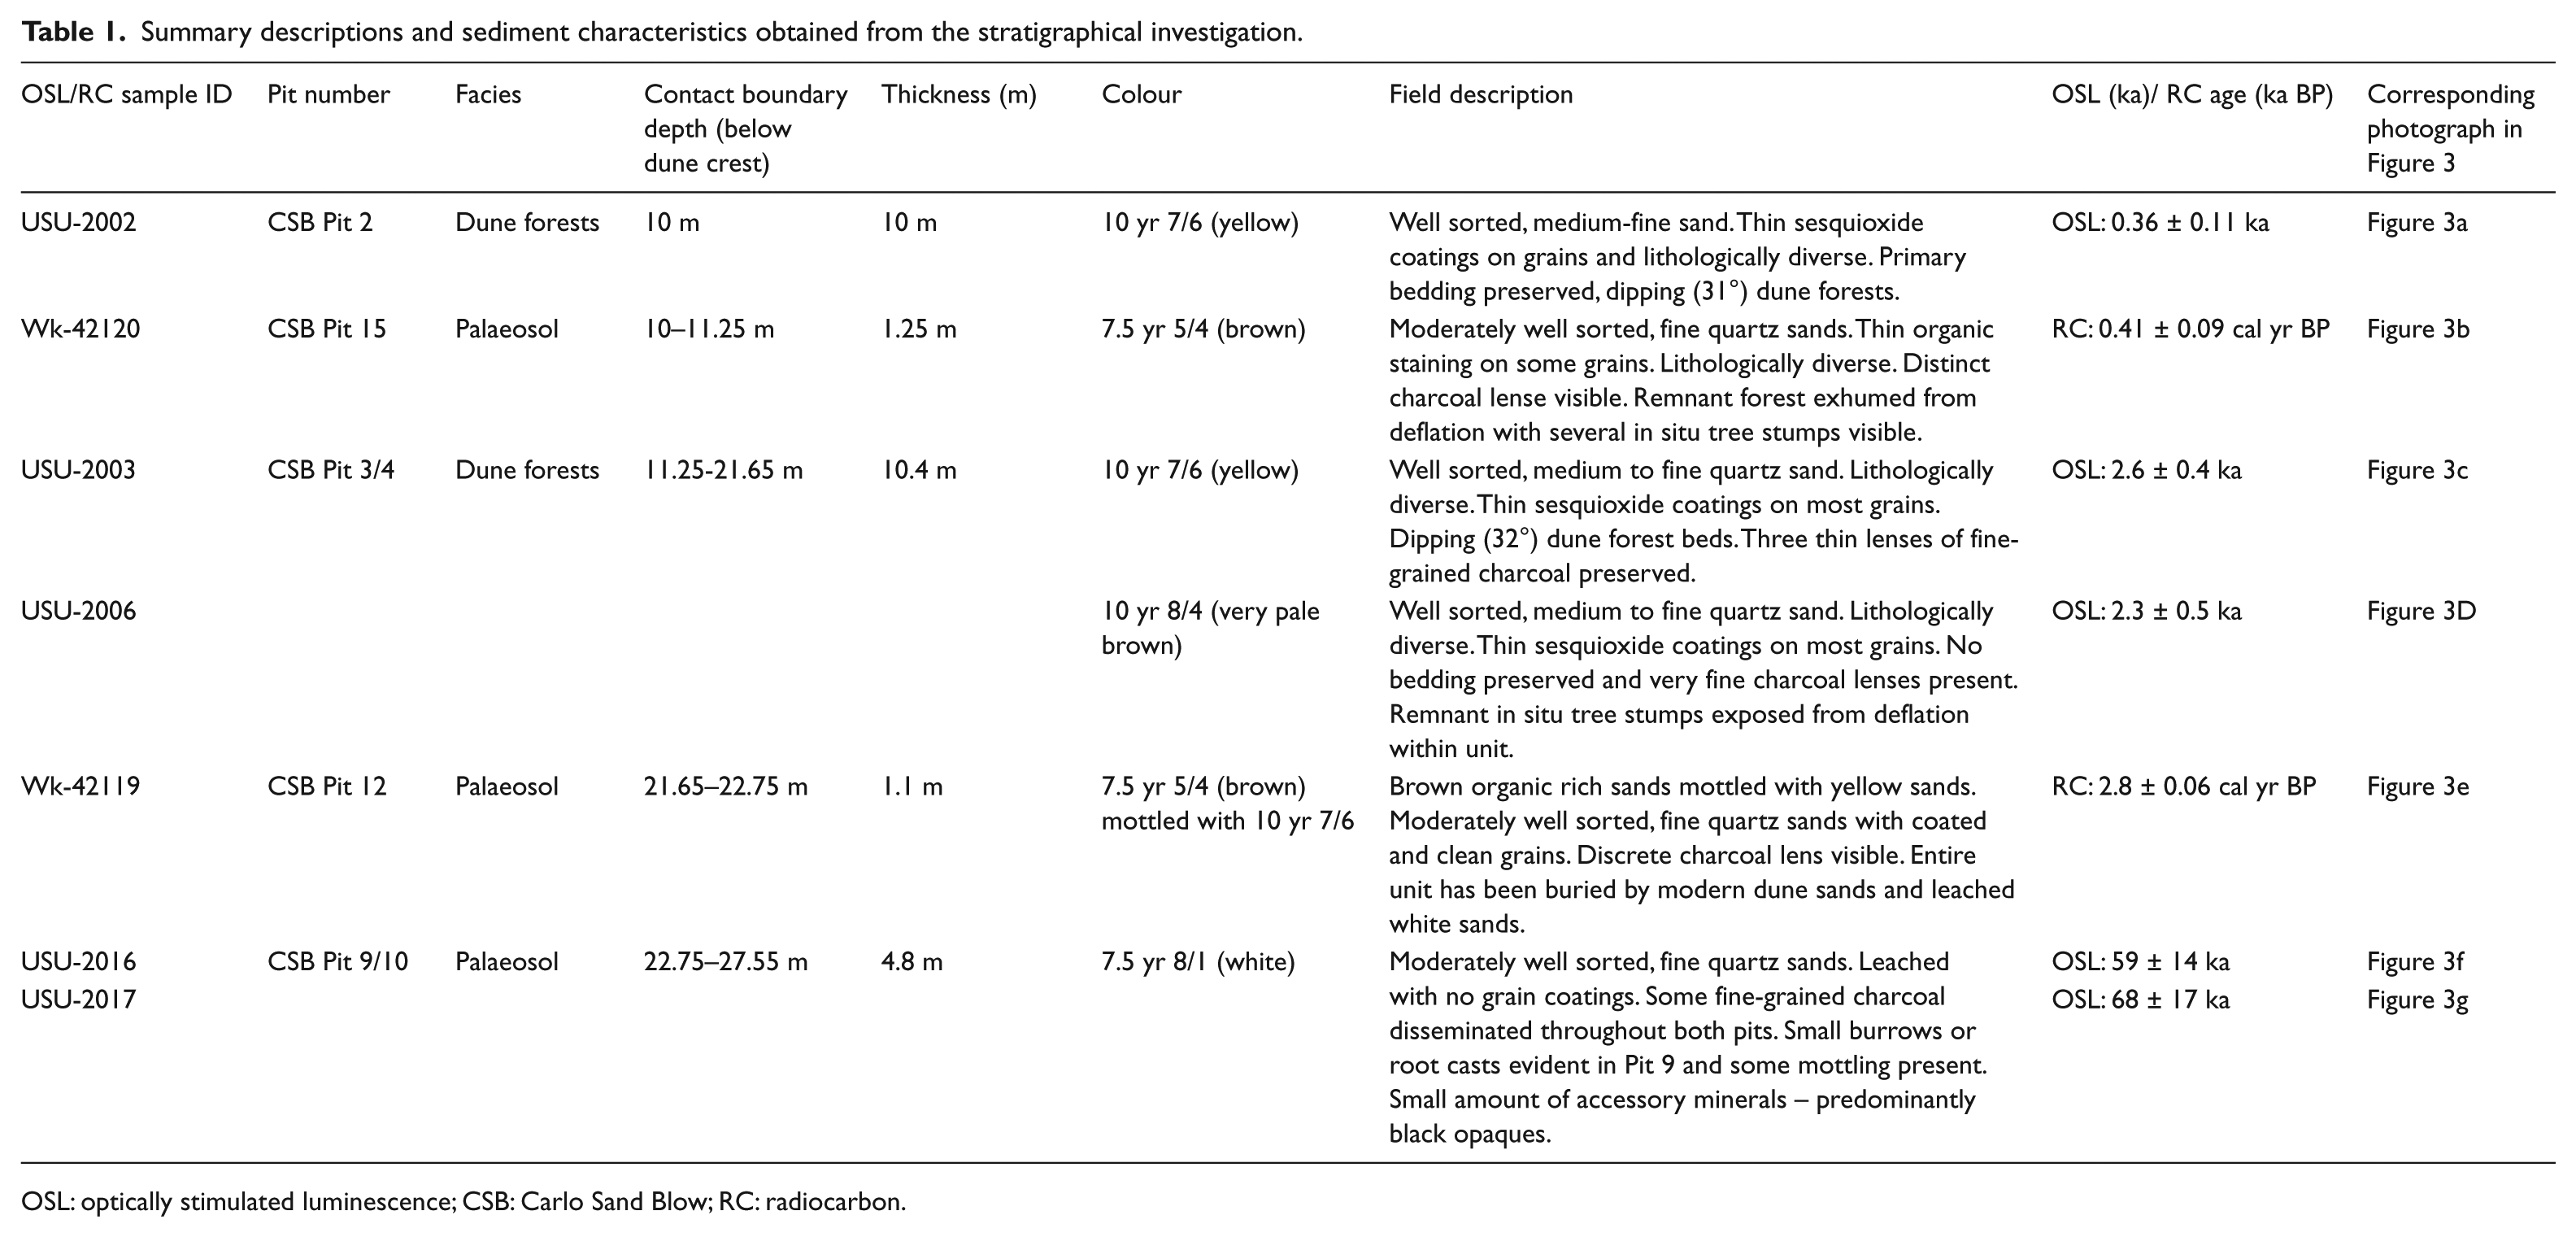
OSL: optically stimulated luminescence; CSB: Carlo Sand Blow; RC: radiocarbon.
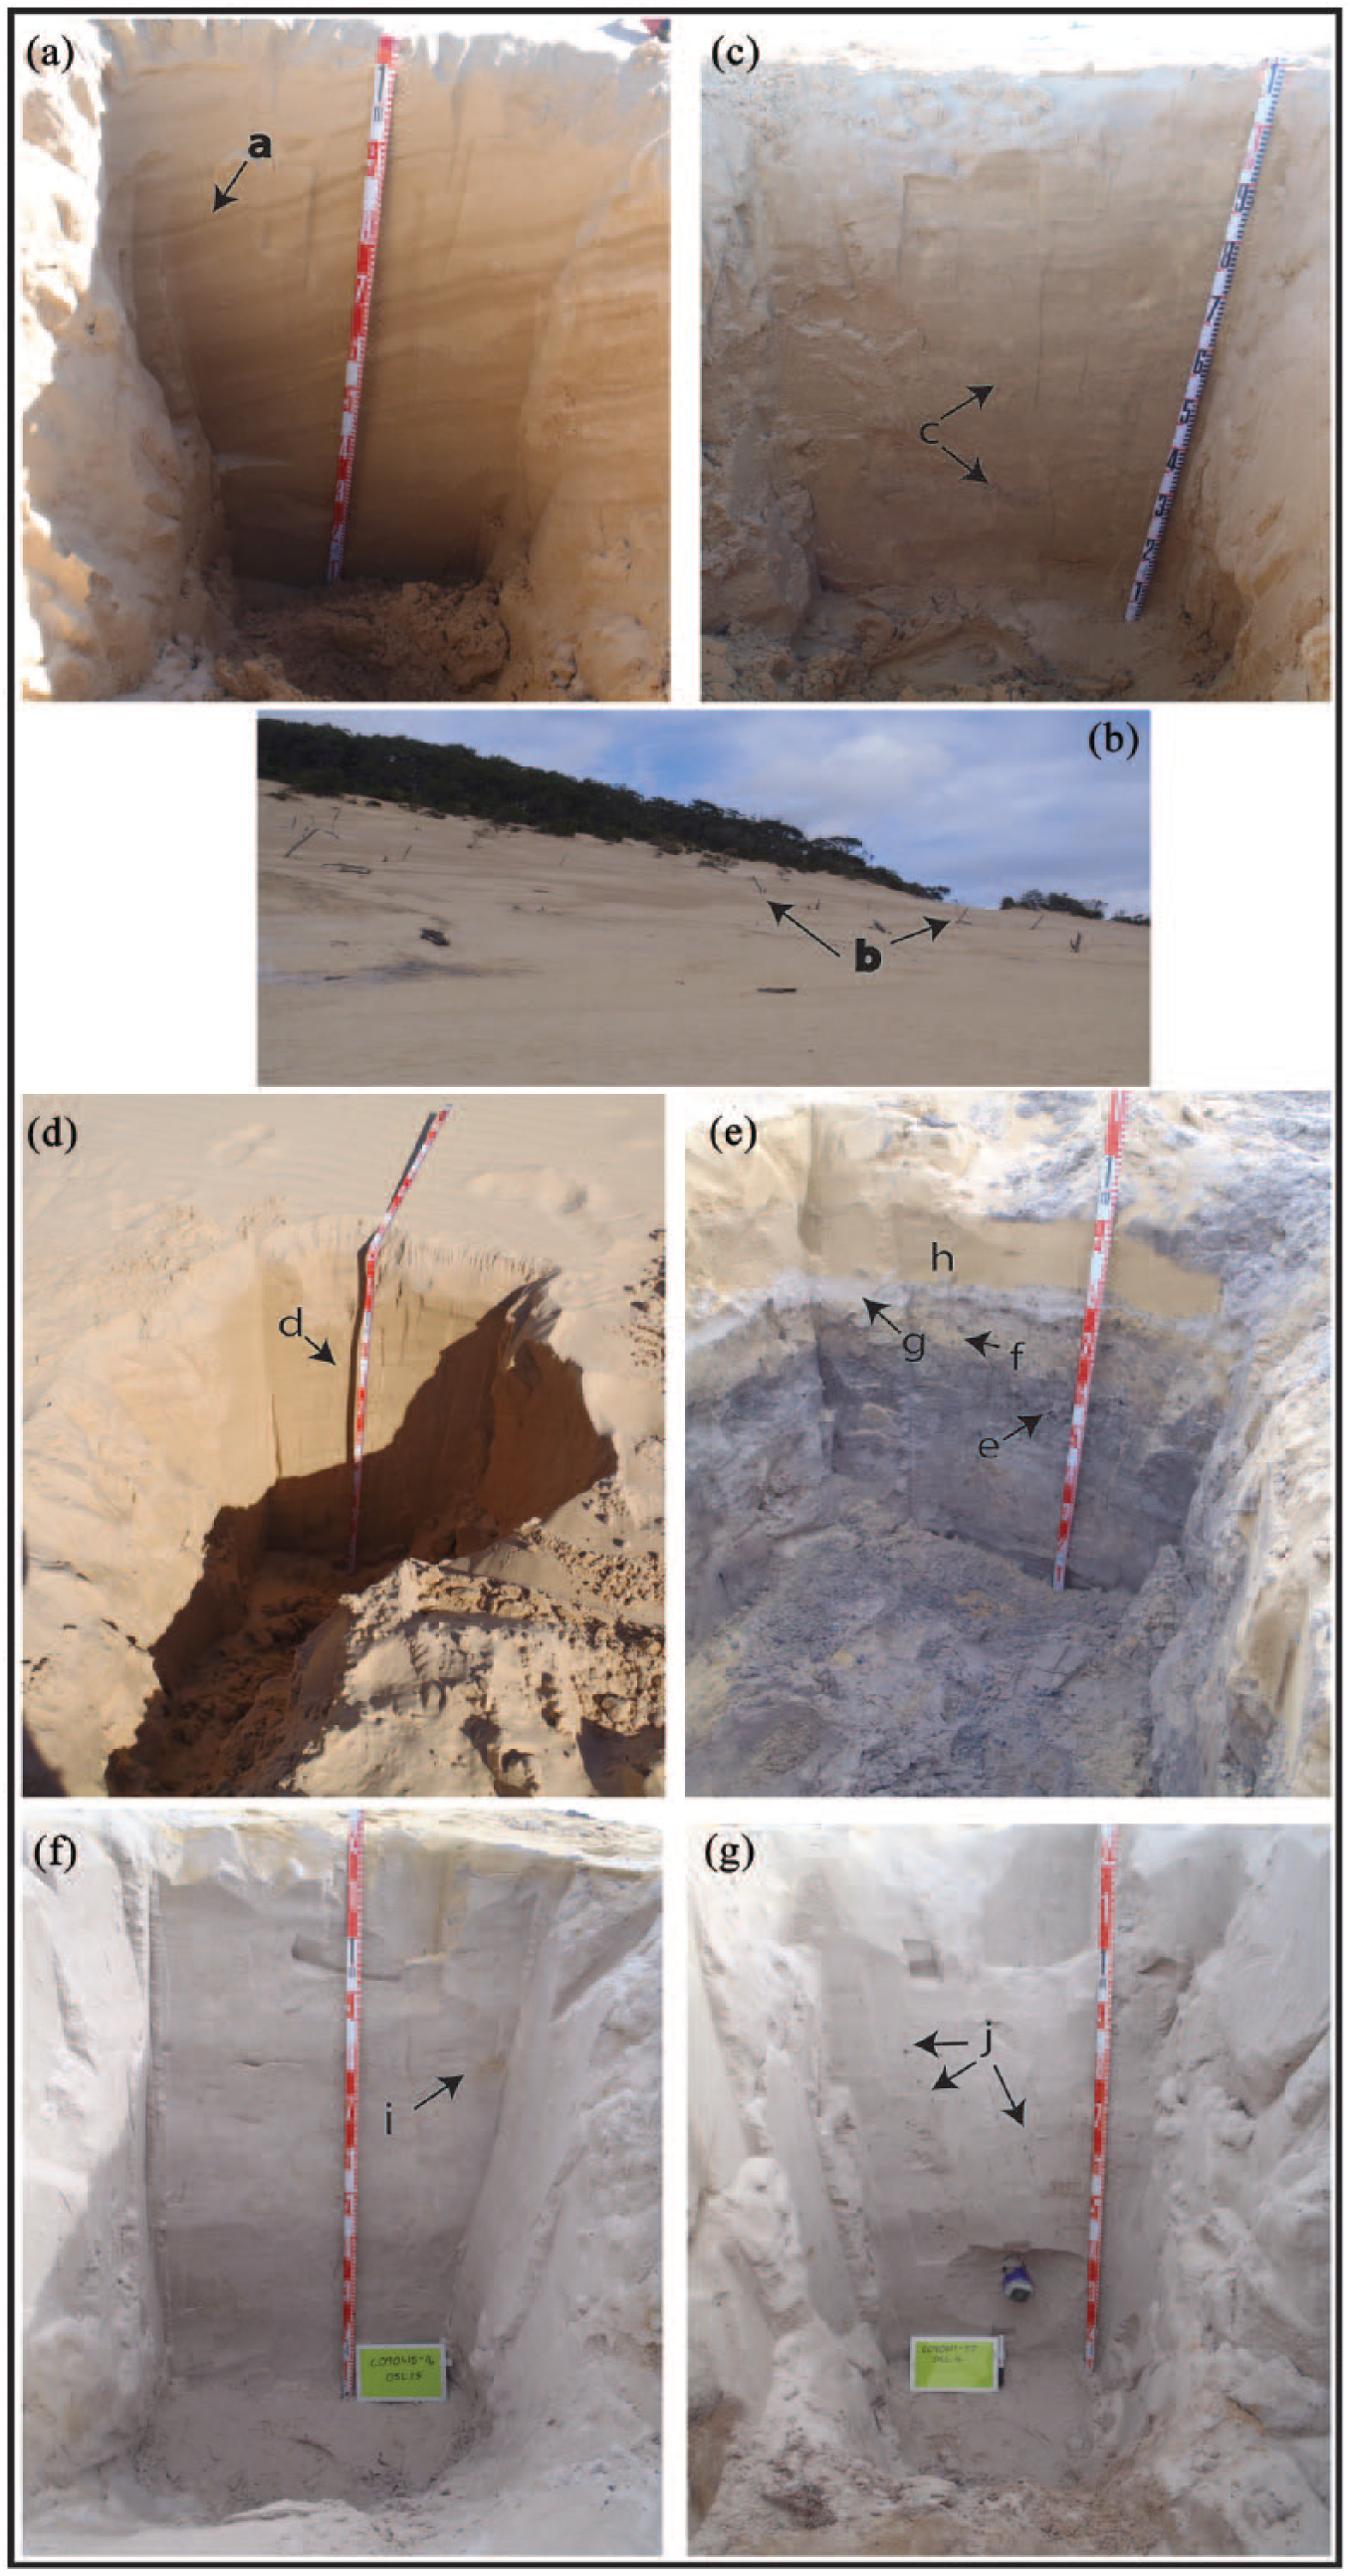
Field photographs of the soil pits dug along the Carlo Sand Blow discussed in text and in Table 1. (a) CSB Pit 2: modern depositional lobe with cross bedding preserved
GPR
The geophysical stratigraphy was interpreted from an axial line extending from the cliff-top in a north-westerly direction to the crest of the advancing blowout. A total of seven geophysically distinct units were observed (Figure 4). Three main geophysical characteristics were observed. Radar Facies 1 (GU1) shows internal reflections that are strongly parallel to subparallel that are truncated by the upper surface or begin as surface parallel and transition to strongly dipping to the north-west. Geophysical units that exhibit Radar Facies 1 are interpreted as preserved and unmodified former dune. This interpretation was validated in the field with high-angle cross bedding seen in Pits two and four.

Geophysical stratigraphy of the Carlo Sand Blow, axial GPR line CSB06. Upper panel shows raw GPR imagery. Lower panel was interpreted for geophysical units, internal character and bounding surfaces. Geophysical Units (GU-x) are shown. Line is 540 m long with GPR penetration to 25 m. After Gontz et al., submitted.
Radar Facies 2 (GU2) shows internal reflections that are wavy to chaotic and often with small and strong hyperbolic reflection. The internal reflections generally do not show a relationship with the upper or lower bounding surface. Occasionally, there is a cross-cutting relationship where bounding surfaces truncate internal reflections. Geophysical units that exhibit Radar Facies 2 are interpreted as modified dune where post-depositional processes of soil illuviation and bioturbation have reworked and modified the original dune stratigraphy as represented by Radar Facies 1. This was observed in Pits 9 and 10 in the field. Separating the geophysical units are regionally and locally extensive bounding surfaces. The surfaces are generally observed as high-intensity reflections with multiple radar couplets representing the upper portion of the bounding surface. The bounding surfaces have various orientations from nearly horizontal to dipping to the west or north-west.
OSL and radiocarbon results
Equivalent dose distributions for each sample are shown in Supplementary Figure 2, available online, and the overdispersion, sample burial dose (DR), and calculated age are presented in Table 2. Radiocarbon results are presented in Table 3. DE distributions were normally distributed, which is expected for well-bleached aeolian sediments, but there was some scatter in DE values which is indicated by overdispersion values > 20% (Table 2).
Small-aliquot optically stimulated luminescence (OSL) age information.
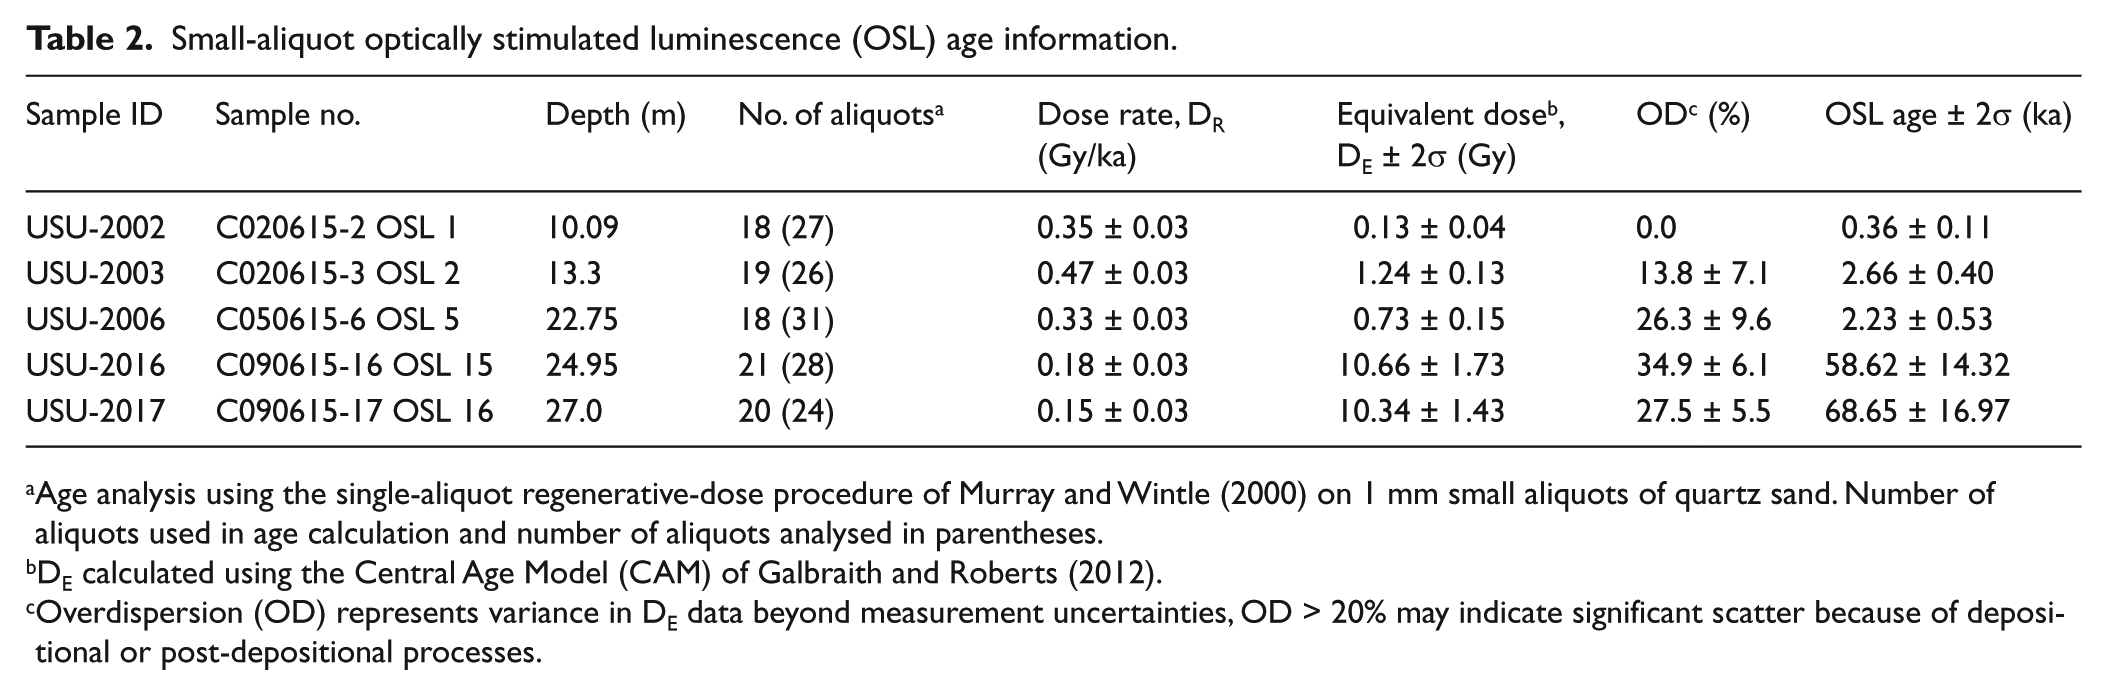
Age analysis using the single-aliquot regenerative-dose procedure of Murray and Wintle (2000) on 1 mm small aliquots of quartz sand. Number of aliquots used in age calculation and number of aliquots analysed in parentheses.
DE calculated using the Central Age Model (CAM) of Galbraith and Roberts (2012).
Overdispersion (OD) represents variance in DE data beyond measurement uncertainties, OD > 20% may indicate significant scatter because of depositional or post-depositional processes.
Radiocarbon age information from Carlo Sand Blow.
Drift potential analysis
The impact threshold for dry sand with a grain size of 250 μm (modal grain size of the Cooloola region is 180–250 μm (Thompson, 1992) was calculated to be ~7 m s−1. This value is used in the weighting factor for the calculation of DP, RDP and RDD. Analysis of the wind field data shows predominantly SE winds with a smaller N-NE and S component (Figure 5a). Westerly winds are minor. DP over the entire 56-year period is high (RDP 61 VU) (Figure 5b), making the region a high-energy environment according to Bullard (1997). Net sediment transport based off our calculations of RDD (310° azimuth) is to the NW (Figure 5b).
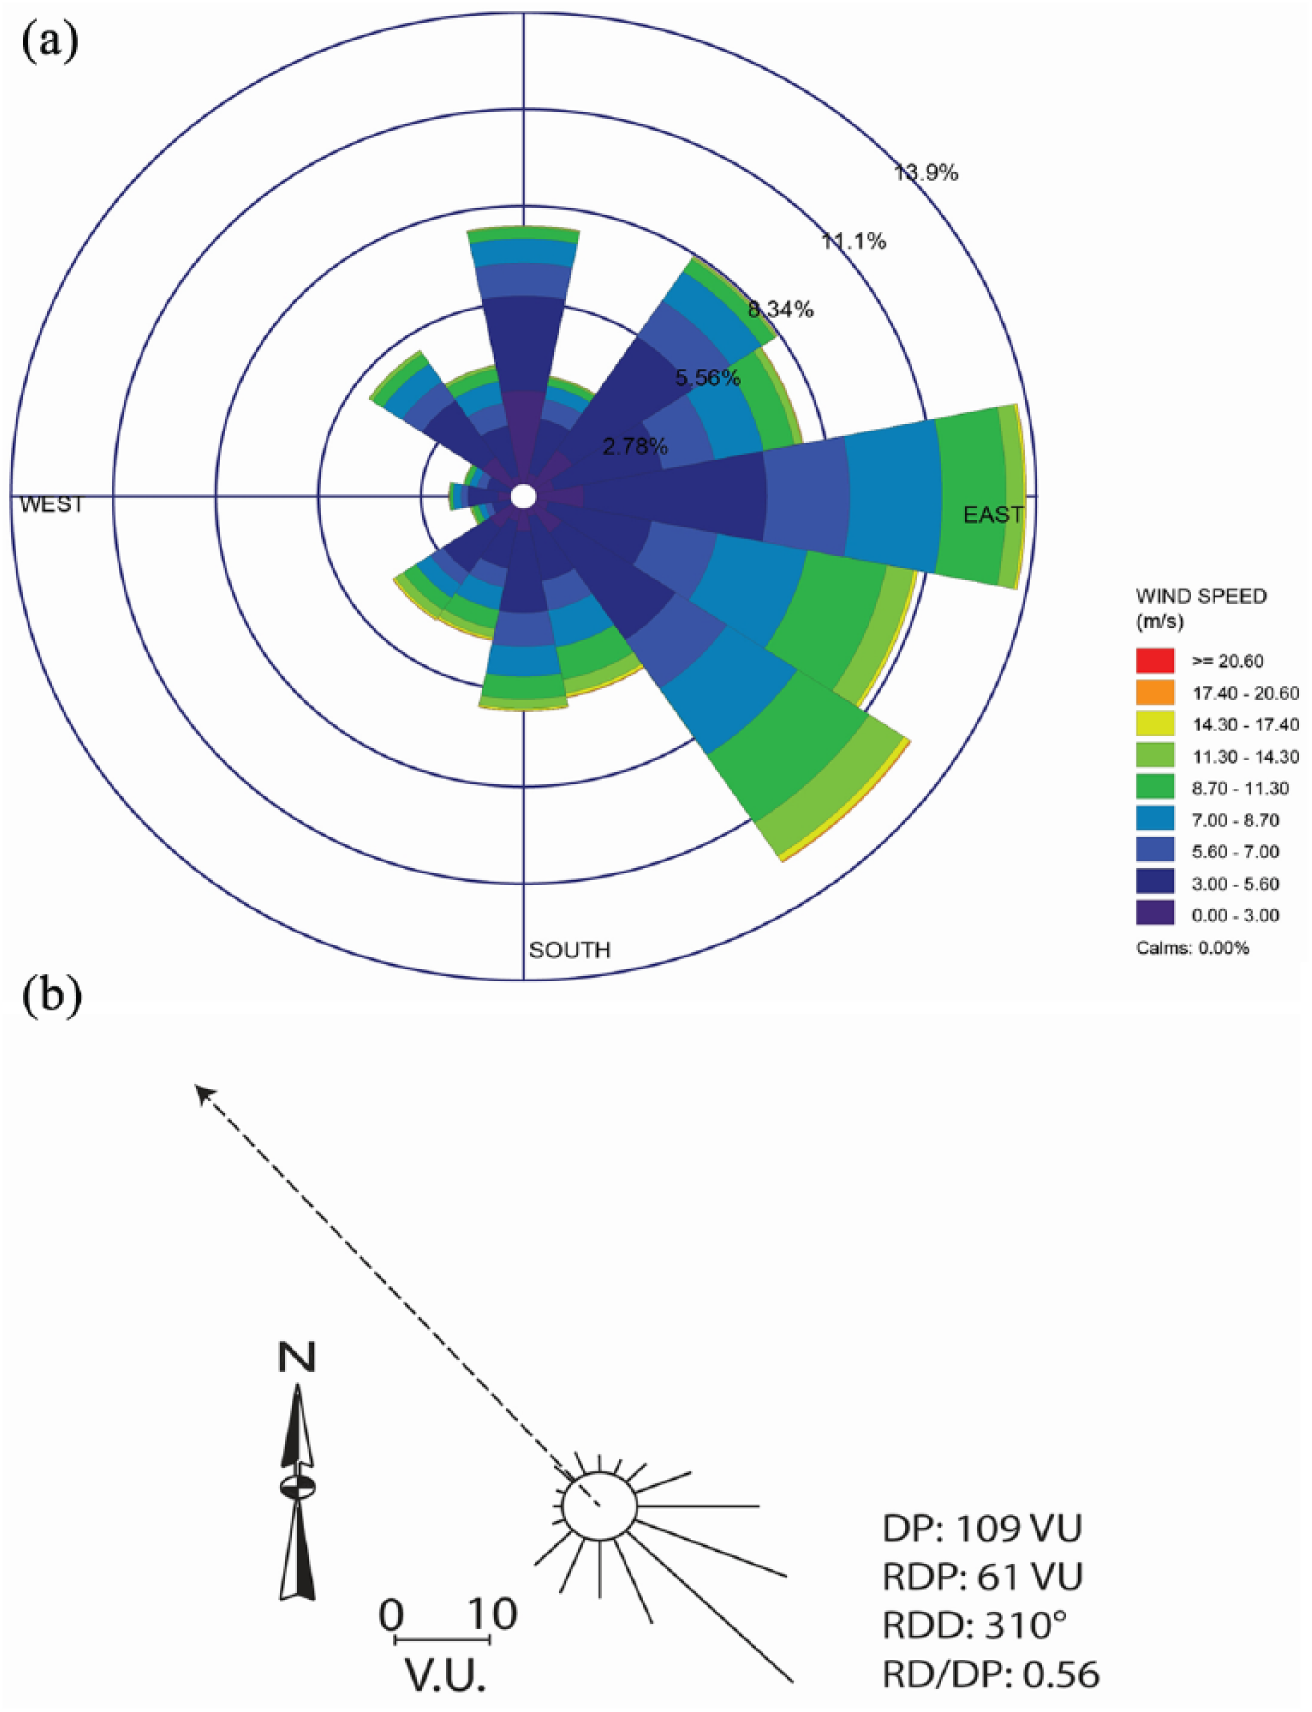
(a) Wind field data for the time period 1957–2013 from Sandy Cape Lighthouse Weather Station. Wind rose showing velocity and direction over the 56-year period. (b) Sand rose showing DP, RDP and RDD (dotted arrow) for the Cooloola region.
Discussion
Relationship between soil horizons and dune stratigraphy
Figure 6 displays the integrated stratigraphy for the Carlo Sand Blow. Based on the grain size, sorting, roundness and cross bedding, we interpret Units 1–3 to be aeolian dune sands with some soil development. These phases of dune emplacement as observed in outcrop (shown as Units 1–3 in the allostratigraphy) match the three geophysical units in GPR (GU 4–6) and are separated from each other by two discontinuities (S-4 and S-5). The two discontinuities show as high-intensity reflectors in the GPR record and we interpret these to be thin buried paleosols with an organic rich A horizon. GPR studies on coastal dune deposits have shown that high amplitude reflectors such as these typically correlate to either paleosols that have formed on the dune slipface or to concentrations of heavy minerals that have accumulated along the slip face (Buynevich et al. 2007a, 2007b). As the heavy mineral concentration of the dune sands of Cooloola has been shown to be < 2% (Thompson, 1983), these strong reflectors correlate to buried organic horizons. This was confirmed in the field as no heavy mineral concentrations were observed on the dune surface or within the soil pits.
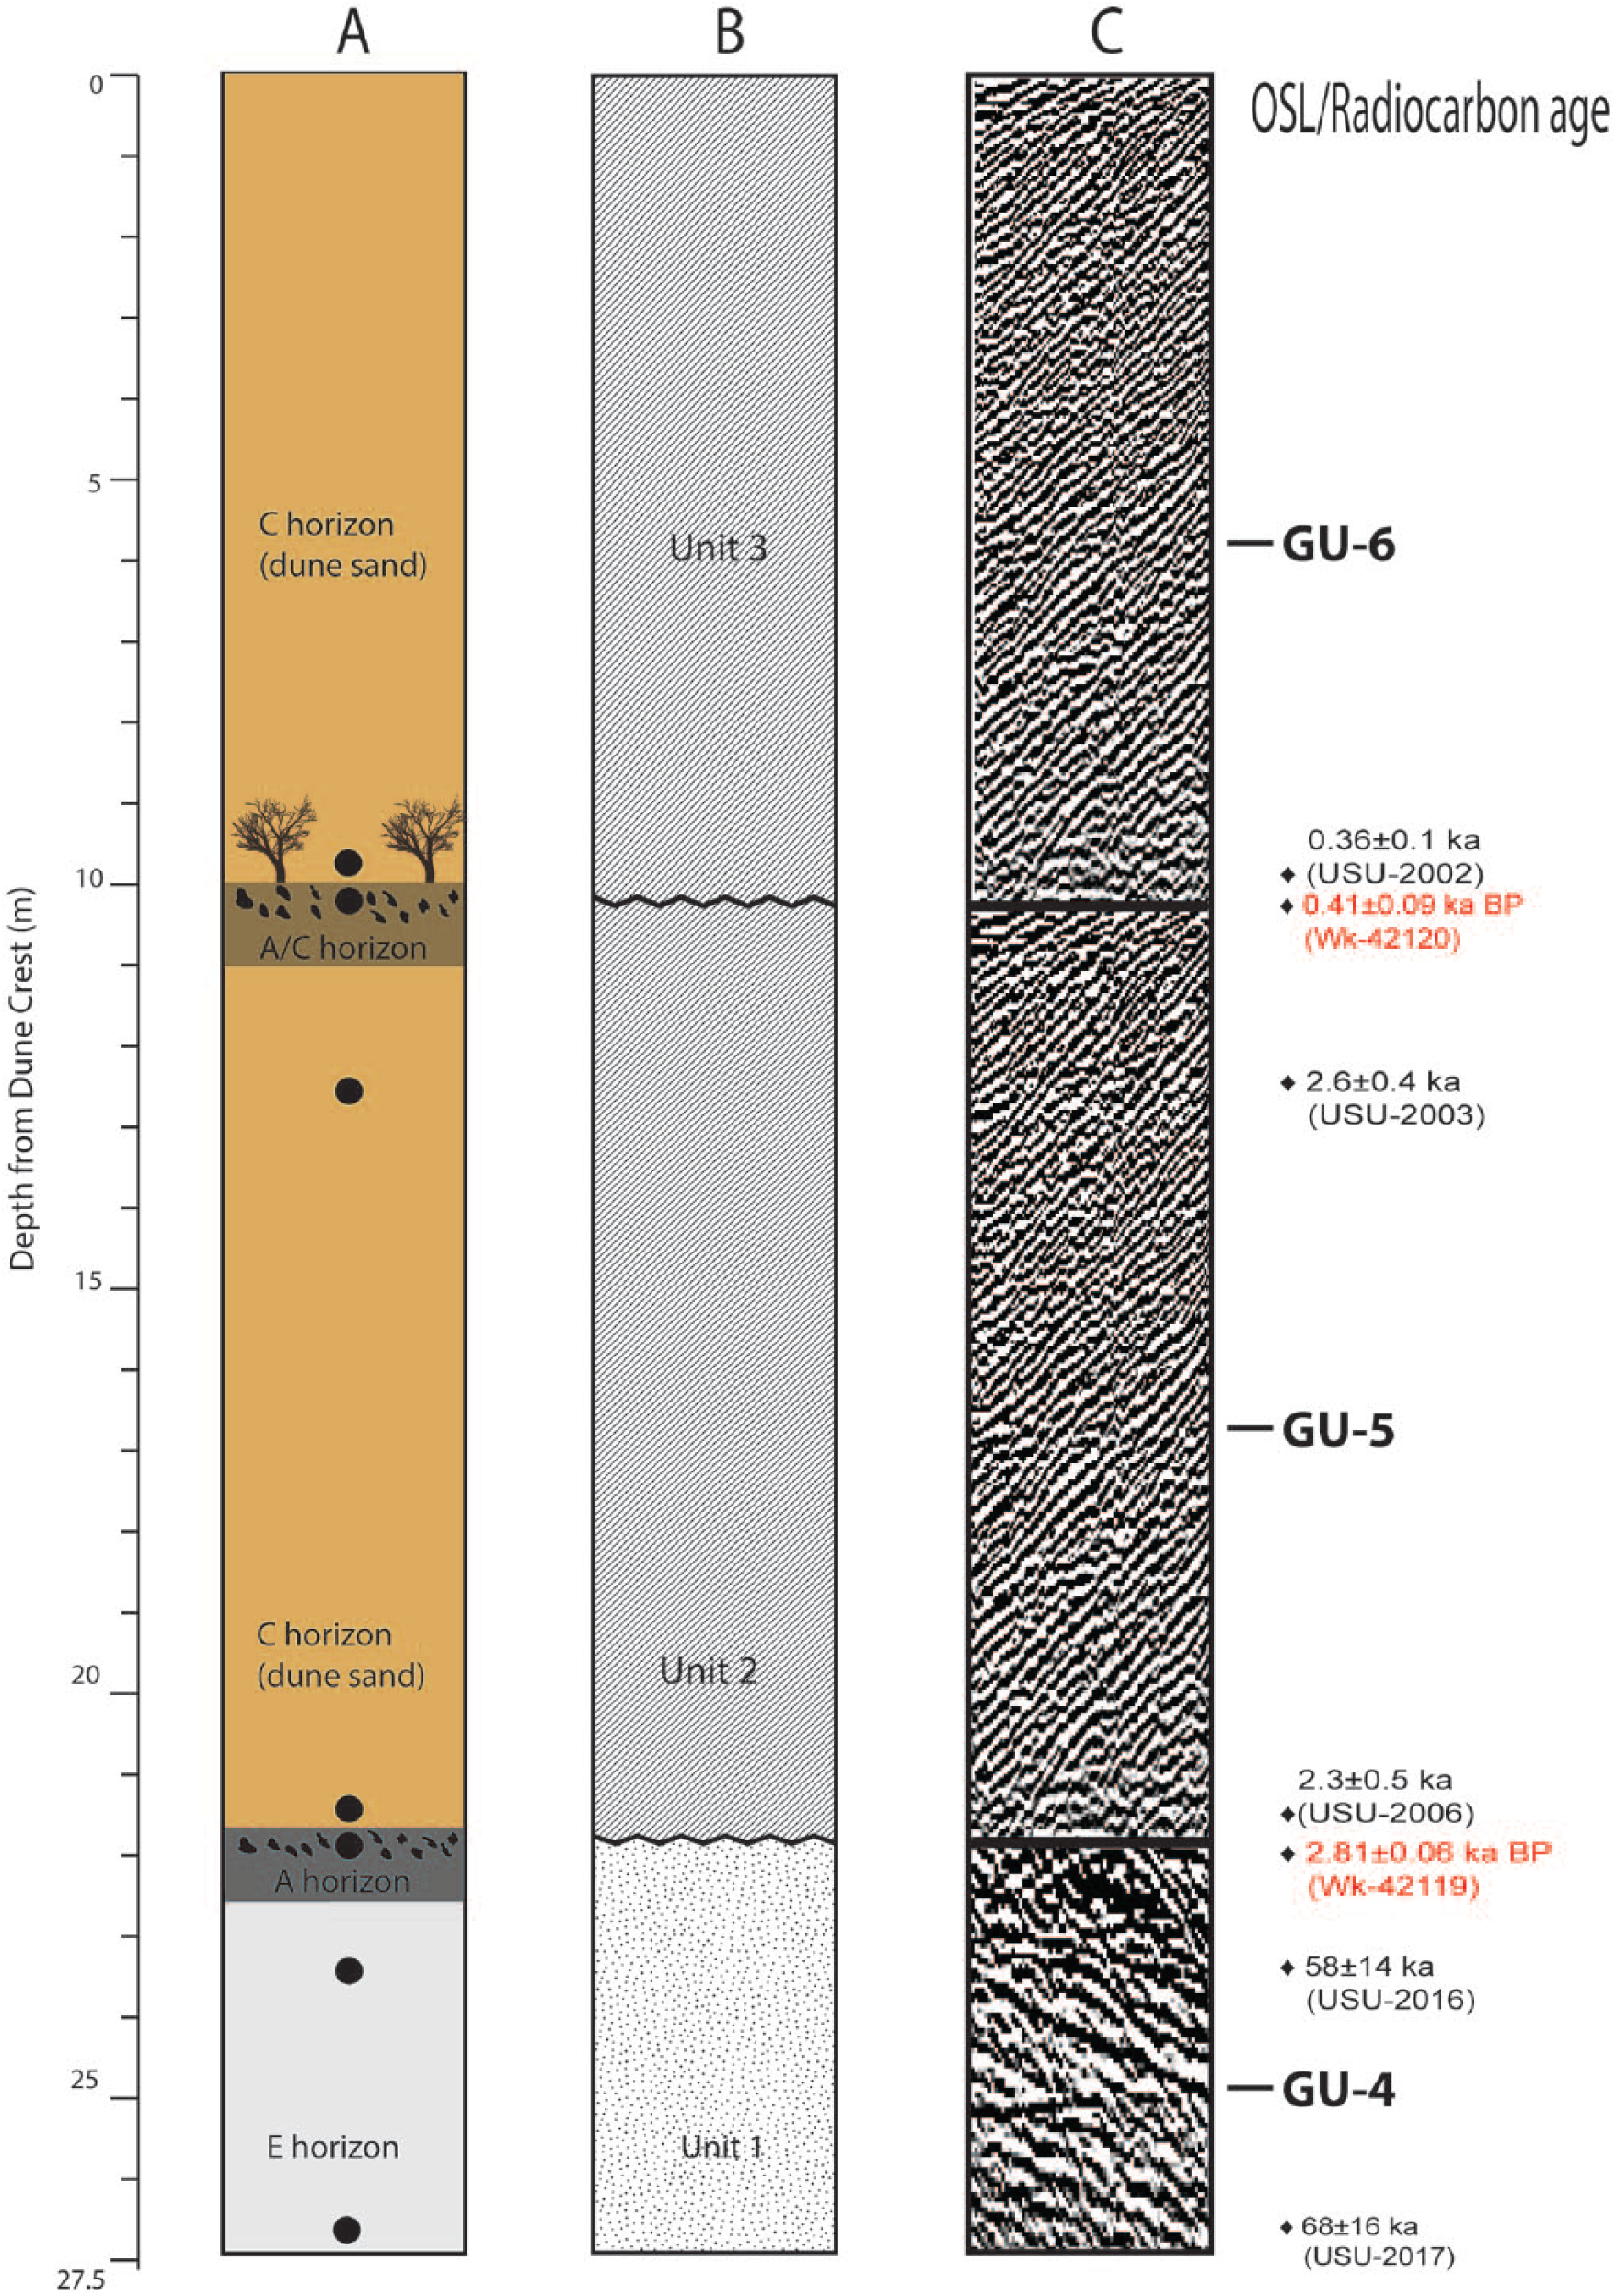
Summary diagram of the Carlo Sand Blow stratigraphy and OSL/C14 ages (red). Column A displays the soil stratigraphy. Column B displays the allostratigraphy. Column C shows the geophysical stratigraphy.
This lithostratigraphy ties to the soil sequence as follows. The youngest dune unit (Unit 3) has no soil development because the dune sands are still active and therefore the whole dune unit can be characterised as a C horizon, that is, unmodified parent material. This unit represents the modern phase of blowout activity. Each of the two buried dune units (Units 1 and 2) have soil development in their upper surfaces. In the case of Unit 1, there is a fully developed, charcoal-rich A horizon (S-4) at the top of the unit, which lies directly over an E horizon (bleached white sand, strongly eluviated). The E horizon relates to the stabilisation of a Pleistocene dune emplaced during the last glacial (see discussion below) and is the product of long-term (multi-millennial) weathering of a stable dune surface.
Unit 2 comprised a dune sand with an incipient A horizon. The dune soil comprised fresh material transported inland from the coastward parts of the blowout alternating with layers with organic development (A horizon) and charcoal and hence is categorised as A/C on the soil section. This soil unit clearly relates to the exhumed trees as the in situ remnants of a buried forest dated to 410 cal yr BP (see Figure 3b) emerging from the palaeosol surface. Looking at the GPR record (Figure 4), Unit 2 (GU-5) comprises a small wedge of dune sand that underlies the most recent phase of blowout activity. We interpret this wedge to be the preserved toe of the depositional lobe related to a phase of blowout activity that has not been completely reworked by the recent phase of activity.
Chronology
Care must be taken with the OSL results from soils (Jeong et al., 2007). Podzolic soils such as those at Cooloola develop by downward translocation of minerals. This translocation gradually depletes the top soil (A horizon) and E horizon of minerals including radioactive elements, whereas the subsoil (B horizon) accumulates these radioactive isotopes through time. The consequence is that measured environmental dose rates are not representative of the average dose rate during the time since deposition. Samples USU 2017 and USU 2016 were taken from a leached E horizon, which can give age overestimates because of the higher long-term dose rate than the modern measured rate. Therefore, the age range of 58–68 ka for Unit 1 needs to be regarded as a maximum age only.
We note that there is an overlap in the median OSL ages from Unit 3 (USU-2003; 2.6 ka and USU-2006; 2.3 ka; see Table 3); however, this is not a reversal as they are statistically indistingushable at 2σ. Three samples (USU-2006; USU-2016; USU-2017) had overdispersion values > 20%, which is indicative of partial bleaching (see Table 3). This could account for the apparent reversal for USU-2006. Care was taken to sample away from any obvious signs of bioturbation; however, grain-level mixing because of bioturbation that is not apparent in the field has been observed in other studies (e.g. Rink et al., 2013). Ants are very common in the Cooloola region, and this grain-level mixing could explain the skewed results.
At Carlo, dune activity occured during three periods: the emplacement of a Pleistocene dune broadly constrained to the first half of the last glacial ~40–70 ka (MIS 3 or 4) that preceded the blowout development, a phase of blowout activation around 2.6 to 2.3 ka (MIS 1), and a more recent phase of activity at about 0.36 ka. Our study has uncovered a younger Pleistocene unit that was not identified by Walker et al. (2018). Ages from dune system 4 in their study had two different equivalent dose (DE) populations, one with consistent DE values and one with a spread of DE values. When they applied a minimum age model to the samples with heterogenous DE values an average age of 68 ± 3 ka was obtained, which they attribute to a period of reactivation. This is in line with our ages of 58 ± 14 and 68 ± 17 ka and we agree with Walker et al. (2018) that this likely represents a period of reactivation after initial emplacement of dune system 4. Walker et al. (2018) also obtained one age from the Carlo Sand Blow. Their sample was taken at the active slip face of the blowout, however, which explains the discrepancy between our ages.
Given the age constraints, and the thick podzolic E horizon present, Unit 1 is inferred to represent a period of dune stability during the earliest part of the last glacial cycle. There is also evidence of stability and soil formation at around 2800 cal yr BP, and a minor soil forming event around 410 cal yr BP. The next phase of dune activity that is preserved at the site occurred in the late-Holocene and is indicated by the dates of 2.3 ± 0.5 ka and 2.6 ± 0.4 ka in Unit 2, which corresponds to the activation of the blowout. The blowout reactivated again at about 0.35 ka and this activity has continued to the present day. The following section explores the initial cause of late-Holocene activation and the subsequent reactivation of the Carlo Sand Blow.
Blowout activation and maintenance
The Carlo Sand Blow is situated on top of a high coastal bluff, but we argue that the blowout would not have been triggered by erosion or destruction of foredunes on the beach below (Hesp, 2002) as is typical for many coastal settings. Although some input from the beach is likely or possible, the narrow width of Rainbow Beach (see Figures 1 and 2) means that a significant portion of the beach sand will remain wet to moist, under most tidal conditions, and is consequently difficult to move under aeolian processes. The cliff that Carlo has developed into is 70 m high, steep and partly vegetated with trees, which would also reduce the potential for sand transport upslope. The only time when sand is visibly blown up the cliffs is when fans of material from the cliffs form after face collapse, but this material is derived from the cliff itself rather than the beach. For these reasons, we interpret this system not to be a classic cliff top dune (Short, 1988). Once active, the source of the sediment for the blowout is largely from the blowout floor, as can be observed from the fact that the deflation basin of the blow has deeply incised into the underlying older dune units. This disconnection from the beach and only minor input from the cliff face means that non-coastal processes such as fire (anthropogenic or lighting induced) or climatic variability, are likely to have played a significant role in maintaining the blowout after it was first initiated, which extends, at least intermittently, for ~2.5 ka.
Coastal erosion
Because of the fact that Rainbow Beach is continuously eroding, determining the driving mechanism for initial blowout activation is difficult. In this setting, the simplest trigger is the disruption of sand-binding vegetation because of cliff collapse from undercutting by wave erosion. It is likely that this coastal erosion has caused continuous retreat of the cliff since the Holocene high-stand in Queensland was achieved c. 4000 years ago (Lewis et al., 2008, 2013). Sea levels in Queensland during the mid-Holocene were 1–1.5 m higher than present (Leonard et al., 2013; Lewis et al., 2008, 2013), which would have supported accelerated erosion and/orcliff retreat along this coast. Cliff retreat occurs under modern conditions along Rainbow Beach, with cliff failures occurring during high tides, and storm surges resulting in fan deposits extending down the cliff and onto the beach below. These fans of loose sediment provide material that could be reworked and transported upslope; however, they are ephemeral and quickly eroded during high tides. They also buttress the base of the cliff preventing further cliff collapse, until they are removed.
Coastal erosion alone is not sufficient as the sole mechanism responsible for blowout activation. There are obvious land slips and cliff failures present all along Rainbow Beach, but Carlo Sand Blow is the only blowout that has developed along the cliff. These cliff failures do cause a disturbance of the vegetation along the cliff face and edge, but do not sufficiently disrupt vegetation inland from the cliff edge (see Figure 7) to trigger activation. If coastal erosion was indeed the sole cause of activation, then we would expect to see other blowouts develop. Looking at other active blowouts within the Cooloola Sand Mass as well as those active along Fraser Island, the vast majority are all situated several hundred metres inland from the modern beach at elevations greater than 30 m. Barchyn and Hugenholtz (2013) also caution against authors attributing one factor as the single cause of blowout activation. Rather than citing a single disturbance as a driver of reactivation, they suggest that changes to the resistance of the protective skin of a sand body must also be considered (Barchyn and Hugenholtz, 2013). Overall, it is difficult to envision coastal erosion as the primary mechanism responsible for vegetation disturbance at Carlo. The following section will discuss other driving factors of blowout development commonly cited in the literature that may play a role in blowout activity and maintenance.
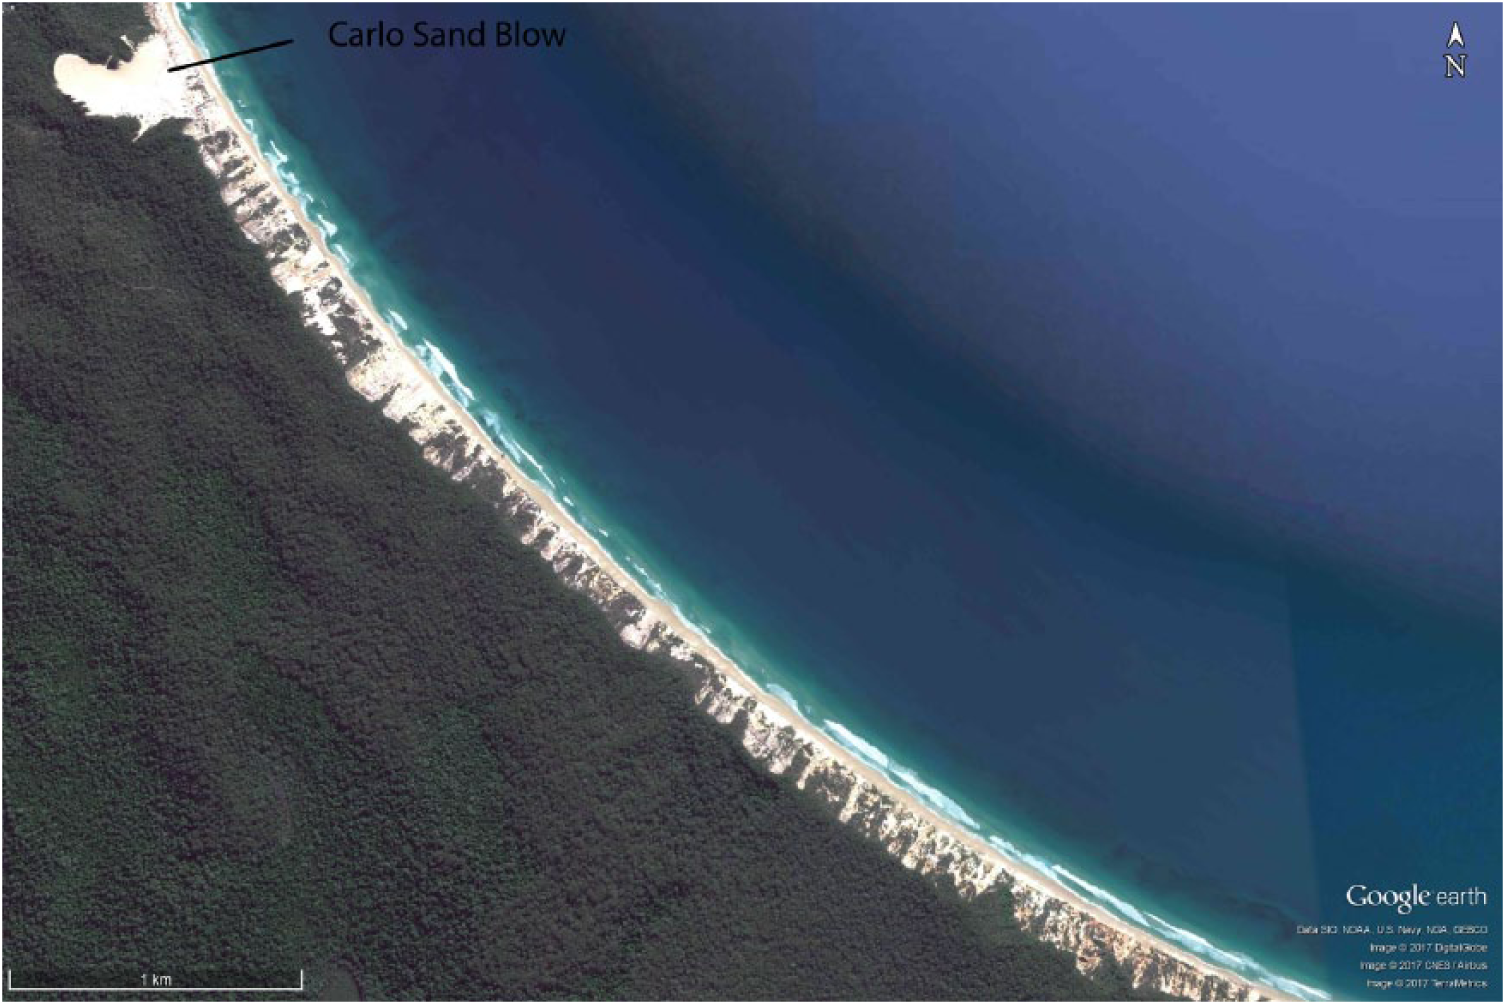
Satellite image of Rainbow Beach showing several cliff failures and bare sediment but no corresponding blowout development occurring along the cliff.
Climate
Climate change is widely suggested to explain dune reactivation in Australia (e.g. Young et al., 1993). Climatic models of dune field activation (largely unproven in the coastal realm) typically involve an increase in wind/storm intensity coupled with increased aridity to prevent vegetation from stabilising bare patches of sand (Pye and Tsoar, 2009). Over the late-Holocene, Australia has experienced a warmer more variable climate (Reeves et al., 2013), driven by intensification of the El Niño Southern Oscillation (ENSO; Donders et al., 2007; Gagan et al., 2004; Shulmeister and Lees, 1995). Although a higher frequency of El Niño events during this period could have led to more frequent or more extended dry conditions, we argue that persistently dry conditions at Carlo were unlikely because of the site being coastal and exposed to the moderating influence of moist onshore easterlies on the northern limb of the sub-tropical anti-cyclone (Ellerton et al., 2017). This is supported by the expansion of sub-tropical rainforest at Fraser Island and nearby Stradbroke Island over the mid- to late-Holocene, with the presence of Agathis spp. and Flindersia spp. indicating annual rainfall of at least 1200 mm/yr (Donders et al., 2006; Moss et al., 2013b) throughout the period.
Over the modern period, we can also see the moderating influence of the local environment. During 2000–2009, eastern Australia experienced a severe drought called the ‘Millennial Drought’ (van Dijk et al., 2013). During the 2000–2009 period, nearby Rainbow Beach (annual rainfall of 1468 mm) received an average annual rainfall of 1327 mm (BOM, 2017). In comparison, Gympie (~50 km inland) experienced multiple years of below average (1124 mm) annual rainfall (BOM, 2017). During 2000–2009 the average annual rainfall at Gympie was 867 mm (BOM, 2017). We therefore suggest that aridity events alone over the late-Holocene were probably not significant enough to seriously disrupt vegetation in the Carlo Sand Blow region.
Variations in wind speed may also play a role in dune reactivation with high wind speed events potentially disrupting vegetation. We cannot comment on this directly as we have no evidence to support either stronger or weaker winds in the last few thousand years. There is, for example, no notable change in grain size through the different dune units. We do note, however, that modern wind speeds in the region are quite capable of moving significant volumes of sand (Figure 5). Working on nearby Fraser Island, Levin (2011) suggested that wind-related vegetation disturbance would require intense tropical cyclones with central pressures < 920 mb, which, although possible in SE Queensland, are very rare. Therefore, we argue that winds are likely to have been sand moving through the entire period contributing to the maintenance of the blowout, but the initial activation depends on vegetation disruption caused by other factors rather than changes in wind speed. We acknowledge, however, that large ex-tropical storms may disrupt vegetation and initiate blowouts, but Levin (2011) suggests that these blowouts are unlikely to persist over longer time frames.
Evidence of fire
The presence of charcoal at the base of several dune/soil units indicates that fire has been a recurrent feature over time in the Cooloola landscape, and the coincidence of the charcoal layers with the activation surfaces indicates that fire could contribute to dune activation. Both of these charcoal layers in the upper surfaces of Units 1 and 2 coincide with exhumed tree stumps (some in growth position) that have been exposed via deflation processes (see Figure 3b). In addition, there is a thin layer of white sand mottled with yellow sand that cap the A horizon at the top of Unit 1 (see Figure 3e). This eluviated material must have come from the older E horizons that were (and are) exposed further seaward along the blowout. This highlights that post fire, the surface was unstable enough for significant wind erosion and perhaps sheet wash to continue.
Fire is rarely suggested as a mechanism responsible for blowout activation as the fires generally will not entirely remove vegetation, and the burnt trees/shrubs can still protect the sand surface from wind exposure (Shumack and Hesse, 2018; Shumack et al., 2017). The vegetation surrounding the Carlo Blowout, however, is dense sclerophyll woodland dominated by Eucalyptus and Corymbia, which can produce large, very intense fires because of forest structure and high amounts of biomass (fuel load) (Price and Gordon, 2016; Prior et al., 2017). Areas with high annual rainfall have also been shown to produce more intense fires than semi-arid regions (Bradstock, 2010), because of the increased fuel load that builds up between fire events.
Recent studies by Shumack et al. (2017) and Shumack and Hesse (2018) that investigated the effect of fire on the destabilisation of coastal dunes found that in Western Australia, fire alone does not lead to dune destabilisation. They do, however, suggest that fires will increase the susceptibility of a sand body to other disturbances. Shumack and Hesse (2018) observed that at one of their sites which experienced a severe burn, short-term (2 months) vegetation regrowth did not occur compared with another site which experienced a more moderate burn. They suggest that intense fires may destroy the seed bank and inhibit short-term recolonisation and regrowth. The vegetation within their study areas, however, was dominated by coastal heath which has a lower biomass than Eucalyptus/Corymbia woodland and a shallower soil depth (organic layer) compared with the Carlo Sand Blow region. Because of the increased fuel load and greater soil depth, it is possible that a fire event would be more intense than the study area of Shumack and Hesse (2018). At Carlo, an intense fire could remove a significant portion of sand binding vegetation, inhibiting regrowth; and coupled with a large sediment supply and high sand DP (Figure 5), the sand surface could remain bare for some time.
Fire, people and blowouts in the great sandy region
With the results presented here, we can begin to explore the activation and evolution of the Carlo Sand Blow. We have no direct evidence of the initiation of the blowout, but based on the erosive nature of the cliff and continuous coastal erosion since the sea-level high-stand was achieved in the mid-Holocene, we argue that coastal erosion preconditions the system for blowout activation. We do know that at 2800 cal yr BP there was a period of stability indicated by soil formation followed by a fire event. We suggest that this fire event, coupled with continual erosion of the cliff destabilised the surface enough to activate the blowout. The depression formed by cliff collapse and the removal of vegetation because of fire likely led to topographic steering of wind and flow acceleration along the cliff crest (Hesp, 2002; Hesp and Smyth, 2016; Walker et al., 2017) with full activation of the blowout. The blowout then stabilised some time before c. 400 cal yr BP before reactivating again around 360 cal yr BP.
The second phase of blowout activity is also associated with charcoal and widespread evidence of forest die-back (see Figure 3b), almost certainly because of the fire. We argue that intense local fires at the crest of the cliff are sufficient to activate the blowout. They are rare because the prevailing SE wind carries fire away from the cliff edge and can only occur if fire initiation is close to cliff or the wind field is from the west (rare except in winter) and coincident with fire-promoting weather (not usual in winter).
We highlight that our interpretation differs somewhat to that of Lees (2006). In a review of coastal dune field activation along Eastern Australia, Lees (2006) suggests that late-Holocene activations were widespread across Eastern Australia (e.g. Lees et al., 1990; Thom et al., 1981). These reactivations all initiated at the coastline, which implies a marine trigger (Lees, 2006). The key difference between the Carlo Sand Blow and other late-Holocene dune activations is the topographic position of the blowout itself. The cliff-top nature of the Carlo Sand Blow means it was not accessing fresh material from the backshore environment. The blowout activation is related to a disturbance event, but the primary mechanism was a combination of factors, not simply a marine trigger (Walker et al., 2018). The event at Carlo therefore is a much more locally constrained activation than other late-Holocene events along Eastern Australia.
Here, we argue that fire has played an important role in landscape evolution within the CSM. Whether these fire events were caused by humans or by natural processes (e.g. lightning strikes) cannot be determined directly from the charcoal record. Lightning-induced fires have previously been considered as a cause of vegetation disturbance that may lead to blowout development such as indicated from fulgurites at Cape Flattery (Pye, 1982). One must be cautious when attributing wildfires to lightning strikes in the Cooloola region, however. Although lightning strike activity is high in Eastern Australia, especially along and to the east of the Great Dividing Range (Kuleshov et al., 2006), lightning is strongly seasonal. In Brisbane, 97% of annual lightning registrations were recorded during humid summer months (October–March) with a peak in January. The correspondence of peak annual lightning activity with peak annual humidity and moisture in south-east Queensland makes the likelihood of major wildfires caused by dry lightning strike less likely.
The use of fire in the Australian landscape by indigenous communities is well known. Fire is a key land management tool to promote more open vegetation communities for hunting as well as for ‘cleaning country’ of snakes and other perceived vermin (Head, 1994; Jones, 1969). Records of Aboriginal occupation in the south-east region of Queensland extend to at least 20,000 yr BP (McNiven, 1991; Moss, 2012; Neal and Stock, 1986). At Cooloola, the earliest cultural and faunal remains occur at c. 5500 yr BP ago (McNiven, 1991), consistent with other archaeological studies that show intensification of coastal use after about 5500 yr BP (Hall and Lilley, 1987; Neal and Stock, 1986; Walters, 1989). However, the archaeological record is likely to underestimate the dates of increased coastal use because of the loss of older sites through coastal erosion during sea-level rise prior to 5500 yr BP. Charcoal records from nearby fens indicate that regular burns were occurring during the entire period of Aboriginal occupation at Cooloola and only declined in post-European times (Moss et al., 2013a). Human settlement would likely have been close to the coast because of the abundance of marine resources and pleasant conditions because of the persistent sea breeze (McNiven, 1990, 1991). This places humans (an ignition source) close to Carlo, during the periods of blowout activity recorded in this study.
Conclusion
This study presents a stratigraphical and geochronological investigation of the Carlo Sand Blow in south-eastern Queensland. We conclude that this cliff-top blowout is unusual in that sand nourishment does not primarily come from the beach below, but from cannibalisation of older sand units in the dune field system itself. We have highlighted that the activation of the Carlo blowout cannot be explained by a single mechanism such as coastal erosion, climatic variability or fire. Stable dunes were present at the site from at least 40 ka and were only reactivated in the late-Holocene. Both the timing and the location of activation suggest that coastal erosion and cliff collapse is the critical precondition for blowout initiation. We note also that blowouts are rare along this stretch of coast and the coincidence of tree stumps and charcoal at dune truncation surfaces provides strong circumstantial evidence that actual blowout activation and maintenance needs the additional trigger of fire. Although possible, lightning-induced fires are unlikely because of lightning activity corresponding with humid and wet summer months. Rather, we suggest that the blowout may have an anthropogenic source as sustaining fire in this area is challenging because of the prevailing wind directions.
Supplemental Material
supplementary_info_carlo_paper_final – Supplemental material for Late-Holocene cliff-top blowout activation and evolution in the Cooloola Sand Mass, south-east Queensland, Australia
Supplemental material, supplementary_info_carlo_paper_final for Late-Holocene cliff-top blowout activation and evolution in the Cooloola Sand Mass, south-east Queensland, Australia by Daniel Ellerton, Tammy Rittenour, Graziela Miot da Silva, Allen Gontz, James Shulmeister, Patrick Hesp, Talitha C Santini and Kevin J Welsh in The Holocene
Footnotes
References
Supplementary Material
Please find the following supplemental material available below.
For Open Access articles published under a Creative Commons License, all supplemental material carries the same license as the article it is associated with.
For non-Open Access articles published, all supplemental material carries a non-exclusive license, and permission requests for re-use of supplemental material or any part of supplemental material shall be sent directly to the copyright owner as specified in the copyright notice associated with the article.