
Abstract
Subarctic permafrost peatlands are important soil organic carbon pools, and improved knowledge about peat properties and peatland sensitivity to past climate change is essential when predicting future response to a warmer climate and associated feedback mechanisms. In this study, Holocene peatland development and permafrost dynamics of four subarctic peat plateaus in Finnmark, northern Norway have been investigated through detailed analyses of plant macrofossils and geochemical properties. Peatland inception occurred around 9800 cal. yr BP and 9200 cal. yr BP at the two continental sites Suossjavri and Iskoras. Younger basal peat ages were found at the two coastal locations Lakselv and Karlebotn, at least partly caused by the time lag between deglaciation and emergence of land by isostatic uplift. Here, peatland development started around 6150 cal. yr BP and 5150 cal. yr BP, respectively. All four peatlands developed as wet fens throughout most of the Holocene. Permafrost aggradation, causing frost heave and a shift in the vegetation assemblage from wet fen to dry bog species, probably did not occur until during the last millennium, ca. 950 cal. yr BP in Karlebotn and ca. 800 cal. yr BP in Iskoras, and before ca. 150 cal. yr BP in Lakselv and ca. 100 cal. yr BP in Suossjavri. In Karlebotn, there are indications of a possible earlier permafrost phase around 2200 cal. yr BP due to climatic cooling at the late Subboreal to early Subatlantic transition. The mean long-term Holocene carbon accumulation rate at all four sites was 12.3 ± 4.1 gC m−2 yr−1 (±SD) and the mean soil organic carbon storage was 97 ± 46 kgC m−2.
Keywords
Introduction
Permafrost peatlands are key components in the global carbon budget due to their high soil organic carbon storage capacity (Gorham, 1991; Hugelius et al., 2014; Korhola et al., 2010; Loisel et al., 2014; MacDonald et al., 2006; Yu et al., 2010). They cover extensive areas in subarctic locations in Canada, European Russia, Siberia and northern Fennoscandia, storing approximately 300 PgC (Hugelius et al., 2014; Schuur et al., 2008; Tarnocai et al., 2009). Permafrost peatlands are mainly found in the discontinuous and sporadic permafrost zones, making them particularly sensitive to changing climatic conditions, and good indicators of climate change (Fronzek et al., 2006; Luoto et al., 2004; Nelson et al., 2001; Seppälä, 1988; Sollid and Sørbel, 1998). In Fennoscandia, boreal and subarctic peatlands cover an area of 200,000 km2, which is equivalent to approximately one-quarter of the land surface (Parviainen and Luoto, 2007). Palsas and peat plateaus are permafrost features found in subarctic peatlands. In Fennoscandia, these landforms are mainly found north of around 67ºN (Gisnås et al., 2017; Parviainen and Luoto, 2007), even if some palsa areas occur at ~1000 m a.s.l. in the mountains of southern Norway (Sollid and Sørbel, 1998).
In northern Fennoscandia, peatlands began to develop after the last deglaciation, and initiation started around 10,000–8000 cal. yr BP (e.g. Ruppel et al., 2013; Weckström et al., 2010). Peatlands formed through three different processes; terrestrialization with infilling of open water bodies by organic material, paludification when waterlogging caused peat accumulation upon previously dry vegetated soil, or primary peatland formation with peat accumulating directly upon moist mineral soil exposed after deglaciation or emerging by postglacial uplift (Ruppel et al., 2013). Weckström et al. (2010) notice a bimodal distribution of basal peat layers, which can be correlated to climatic events. The first period of peatland expansion occurred during the warm and moist early Holocene (10,000–8000 cal. yr BP). Drier and even warmer climate during the Holocene Thermal Maximum (HTM; 8000–4000 cal. yr BP) hampered peatland growth, whereas cool and moist late-Holocene conditions (4000–3000 cal. yr BP) resulted in extensive peatland expansion again. A similar timing is reported by Korhola et al. (2010) and Ruppel et al. (2013).
In subarctic peatlands, Neoglacial cooling resulted in permafrost aggradation and development of palsas and peat plateaus (Kuhry and Turunen, 2006). The oldest preserved palsas in northern Fennoscandia are suggested to date back to ca. 2500 cal. yr BP (Oksanen, 2006). Kokfelt et al. (2010) propose that permafrost aggraded ca. 2600 cal. yr BP, and thawed around ca. 2100 cal. yr BP. Both these recordings could be connected to climatic cooling at the late Subboreal to early Subatlantic (3400–1800 cal. yr BP) transition (e.g. Åhman, 1977; Oksanen et al., 2003). However, most palsas and peat plateaus appear to be less than 1000 years old (Kokfelt et al., 2010; Oksanen, 2006; Sannel et al., 2018; Seppälä, 2005; Zuidhoff and Kolstrup, 2000), formed as a result of cooling from ca. 850 cal. yr BP at the onset of the Little Ice Age (LIA) (Grudd et al., 2002).
In recent decades, permafrost degradation has been observed in Fennoscandian palsas and peat plateaus (Borge et al., 2017; Hofgaard and Myklebost, 2012, 2014; Johansson et al., 2011; Sannel and Kuhry, 2011; Sollid and Sørbel, 1998; Zuidhoff and Kolstrup, 2000). In a future warmer climate, as predicted by for example Collins et al. (2013), permafrost peatlands can contribute to greenhouse gas emission through permafrost thaw. As long as the ground temperature is below 0°C, organic matter is preserved from decay, but deepening of the active layer, ground subsidence and increased decomposition rates could result in release of carbon dioxide (CO2) and methane (CH4). Permafrost peatlands are therefore important for the global carbon-climate feedback (Schaefer et al., 2014; Schuur et al., 2008).
Peatlands are used as Holocene archives because of their sensitivity to climatic variations and because they provide a range of physical, chemical and biological proxies. The timing of permafrost aggradation has been established in northern Sweden (e.g. Kokfelt et al., 2010; Sannel et al., 2018; Zuidhoff and Kolstrup, 2000) and Finland (Oksanen, 2006; Seppälä, 2005), but there are relatively few detailed studies of long-term permafrost peatland dynamics in northern Norway (Åhman, 1977; Vorren, 1972, 1979).
Dating the timing of permafrost aggradation is challenging since there are no good permafrost-specific plant indicator species (Oksanen and Väliranta, 2006; Sannel and Kuhry, 2008). One way to establish the timing is by radiocarbon dating of the transition in the plant macrofossil record from wet-growing fen vegetation, such as brown mosses (e.g. Amblystegiaceae, Calliergonaceae) and sedges (Cyperaceae) into dry-growing bog vegetation dominated by ericaceous shrubs and Betula nana (Oksanen, 2006; Oksanen et al., 2001; Sannel and Kuhry, 2008; Sannel et al., 2018; Seppälä, 2005). Also changes in the carbon-to-nitrogen (C/N) ratio, nitrogen content and isotopic composition are suggested to be useful indications of permafrost occurrence. When palsas or peat plateaus are uplifted, peat is perturbed and the hydrological conditions altered. Aeration causes changed microbial processes and accelerated mineralisation, resulting in changes in the geochemical signals (Krüger et al., 2017; Sannel and Kuhry, 2009; Treat et al., 2016; Vardy et al., 2000).
The aim of this study is to increase our knowledge of Holocene peatland development and permafrost history in subarctic peatlands in Finnmark, northern Norway, where permafrost peatlands are most abundant in northern Fennoscandia. Plant macrofossil analyses of peat profiles provide an opportunity to infer and date palaeoenvironmental and hydrological changes since peatland initiation. This paper presents detailed palaeoecological and geochemical data, age–depth models and long-term carbon accumulation rates from four permafrost peatlands. A better understanding of peat properties and carbon dynamics in subarctic peatlands is key to predicting responses of soil organic carbon stocks to a future warmer climate.
Study area
Finnmark is located in northern Norway, in the northernmost part of continental Europe and north of the Arctic Circle (Figure 1). The interior parts consist of the Finnmarksvidda plateau (>10,000 km2; 300–500 m a.s.l.), while the topography in the northwest is more alpine and influenced by local glaciations. The bedrock of the inner part of Finnmark is dominated by Precambrian rocks, covered by till and glacio-fluvial sediments deposited during the Pleistocene glaciations. Depressions between moraine or bedrock ridges are often occupied by mires (Borge et al., 2017). The studied peatlands on Finnmarksvidda are developed over fine-grained glacio-fluvial and glacio-lacustrine deposits in depressions, which are surrounded by rock outcrops and basal till in varying thickness (NGU – Geological Survey of Norway, 2018). Peat plateaus close to sea level are normally developed on fine-grained (silt-rich) glacio-marine fillings or deltaic deposits developed closer to the ice-margin during deglaciation (NGU – Geological Survey of Norway, 2018).
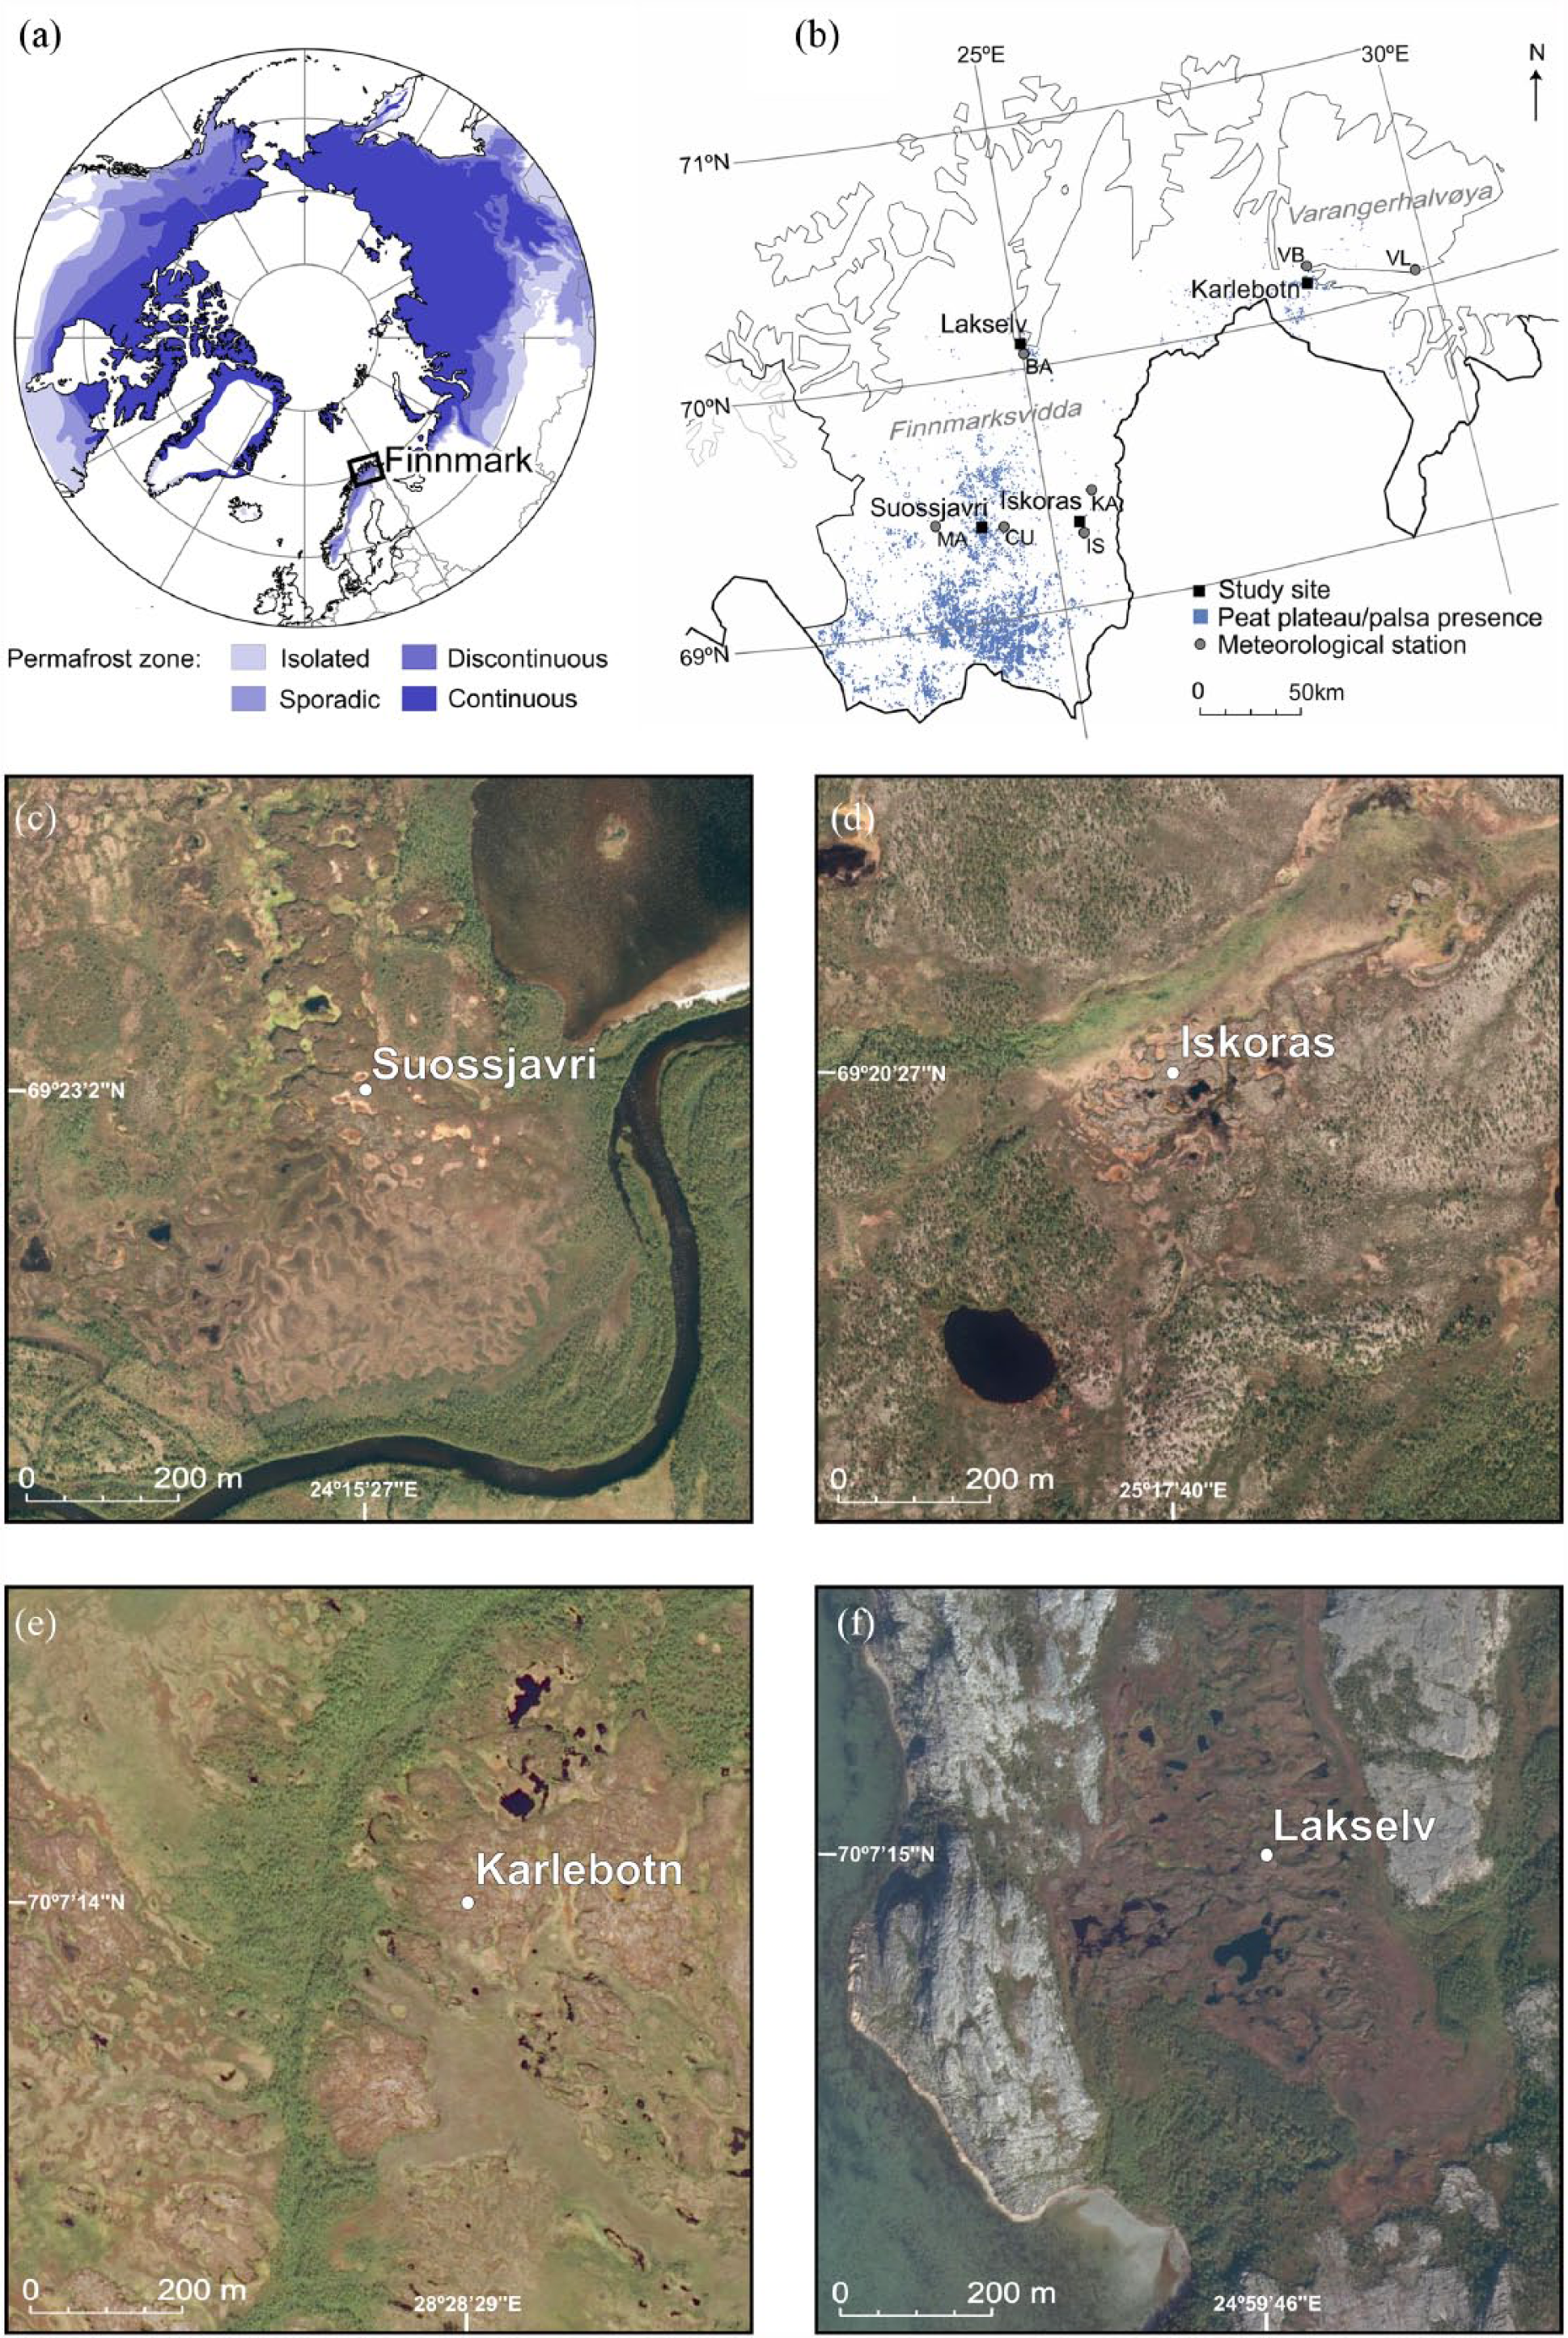
(a) Map showing circumarctic permafrost distribution (adapted from Brown et al., 1997) and location of Finnmark. (b) Finnmark with the four study sites and meteorological stations (BA = Banak, CU = Cuovddatmohkki, IS = Iskoras II, KA = Karasjok, MA = Maze, VB = Varangerbotn and VL = Vardø lufthavn). Peat plateau and palsa presence map adapted from Borge et al. (2017). (c)–(f) The four study sites and sampling locations. Aerial images from 2011 (c and d) and 2008 (e and f) (norgeibilder.no, 2017).
The mean annual air temperature (MAAT) is higher at the coast compared to the inner parts of Finnmark (Table 1), due to influence by the North Atlantic Drift. The coast experiences mild and snow-rich winters and cool and rainy summers, with a MAAT (1961–1990) mostly above 0°C (Aune, 1993). The inner parts of Finnmark are characterized by a more continental climate. Winters tend to be cold (around −15°C) and summers cool (around 10°C) and the mean annual air temperature (MAAT, 1961–1990) is between −2°C and −4°C (Aune, 1993). Annual precipitation as well as maximum snow depth during winter decreases with distance from the coast. Mean annual precipitation (MAP, 1961–1990) is above 1000 mm at the outermost coast, but less than 400 mm at the Finnmarksvidda plateau (seNorge.no, 2016), and mean annual snow depth (MASD, 1971–2000) more than 200 cm at the outer coast and mostly below 50 cm at the plateau (seNorge.no, 2016). The mean annual ground temperature (MAGT) in northern Fennoscandian palsas and peat plateaus is often close to 0°C (Christiansen et al., 2010), and the active layer depth at the investigated sites in this study is around 50–70 cm.
Mean annual air temperature (MAAT) and mean annual precipitation (MAP) for the four study sites during the period 1961–1990. Data are based on the eKlima dataset provided by Meteorologisk institutt (MET, 2017), and MAAT is calculated using the closest meteorological stations (Figure 1), corrected for altitude using a standard lapse rate of −0.65°C/100 m.

Most of Finnmark is covered by mountain birch (Betula pubescens ssp. czerepanovii) forest or tundra vegetation (e.g. B. nana and Empetrum nigrum ssp. hermaphroditum) (Virtanen et al., 2016). The forest limit ranges between 400 and 500 m a.s.l. (Meier et al., 2005).
Approximately one fifth of the land surface is underlain by permafrost (Farbrot et al., 2013; Gisnås et al., 2017). Discontinuous mountain permafrost occurs above ~500 m a.s.l. in the continental parts of Finnmark (Farbrot et al., 2013), whereas sporadic permafrost can be present in peatlands almost down to sea level. Finnmark is the core area of the distribution of palsa mires in Norway, with about 110 km2 covered by palsas and peat plateaus (Borge et al., 2017).
Peat profiles were collected from four peat plateaus within the study area (Figure 1; Supplementary Information, available online). Two of the profiles were collected at inland sites at the Finnmarksvidda plateau; Suossjavri (69º23’2”N, 24º15’27”E; 337 m a.s.l.) and Iskoras (69º20’27”N, 25º17’40”E; 381 m a.s.l.). This area was deglaciated approximately 10,900–10,800 cal. yr BP (Stroeven et al., 2016) and the investigated peatlands are situated above the marine limit. In Suossjavri, the peatland is characterized by large, extensive peat plateaus. The complex in Iskoras is small, consisting of disintegrated peat plateaus separated and surrounded by large fens areas.
The other two profiles were sampled in coastal settings; Karlebotn (70º7’14”N, 28º28’30”E; 26 m a.s.l.) and Lakselv (70º7’15”N, 24º59’47”E; 50 m a.s.l.). Both these sites are located below the local marine limit. Karlebotn was deglaciated ca. 14,200 ± 500 cal. yr BP (Sollid et al., 1973; Stokes et al., 2014) and land emergence is suggested to have taken place around 6500 cal. yr BP (cf. Corner et al., 1999). Permafrost peatlands are abundant in the Karlebotn region, consisting of extensive peat plateaus and fragmented remains of these as well as pronounced palsas. In Lakselv, deglaciation occurred somewhat later, ca. 11,200 ± 500 cal. yr BP (Stokes et al., 2014), and land emergence took place around 9700 cal. yr BP (cf. Corner et al., 1999). The permafrost peatlands are smaller and shallower, located in depressions between bare bedrock.
The vegetation on all four studied peat plateaus consists of dwarf shrubs (e.g. E. nigrum ssp. hermaphroditum, Rhododendron tomentosum, Vaccinium uliginosum, V. vitis-idaea, B. nana and Andromeda polifolia), mosses (e.g. Polytrichum commune), lichen (Cladonia spp.) and Rubus chamaemorus. In depressions and surrounding wet fen areas, sedges (e.g. Carex spp.), cotton grass (Eriophorum spp.) and various Sphagnum species are common.
Materials and methods
Field sampling
The peat profiles were collected in September 2016. The active layer was sampled using a saw, and profiles (12 x 12 cm2 wide and 55–64 cm deep) were cut out. These blocks were later subdivided into 2.5-cm-thick slices in the laboratory. For sampling the frozen peat, a steel pipe (outer diameter 38 mm, inner diameter 30 mm; 1.2-, 2.4- or 3.1-m-long) was hammered down in 10 cm intervals before it was pulled up again, preventing the pipe from freezing to the substrate. The samples were gently pressed out of the pipe using a steel rod. This procedure continued, using the same coring hole, until the minerogenic contact was reached, and additionally 10–20 cm down in the mineral soil. The peat depth was 229 cm in Suossjavri, 155 cm in Iskoras, 104 cm in Karlebotn and 84 cm in Lakselv. Each sample was subsampled into sections representing 2.5 cm depth, and transferred into ziploc bags. After transportation back to the laboratory at Stockholm University, all samples were stored in a freezer until analysis.
AMS radiocarbon dating and age–depth models
Five to seven radiocarbon dates for each profile were obtained using accelerator mass spectrometry (AMS) radiocarbon dating. Basal peat horizons were used to infer peatland inception ages, and depths for dating permafrost aggradation were chosen based on changes in peat characteristics from fen peat to xerophilic peat. The rest of the dated samples were evenly distributed throughout the profiles. When possible, terrestrial plant macrofossils (e.g. B. nana leaves or E. nigrum seeds) were handpicked to avoid potential reservoir effects (e.g. Blaauw et al., 2004). From highly decomposed fen peat samples where it was difficult to pick out any plant macrofossils, bulk peat was submitted. According to Holmquist et al. (2016), there is no statistically significant difference between dated bulk peat and plant macrofossil samples from circumarctic peatlands. Because of problems with reversed ages in the lower part of two profiles, additional bulk peat samples were dated from Karlebotn and Lakselv. Radiocarbon ages were calibrated using OxCal v4.2.4 (Bronk Ramsey, 2009, 2013) and the IntCal13 dataset (Reimer et al., 2013). Age–depth relationships were established with ‘Bacon’ (v. 2.3.3) (Blaauw and Christen, 2011) within the open-source statistical environment ‘R’ (v. 3.4.3) (R Core Team, 2017), using IntCal13 and run with the provided settings. Calibrated ages are presented in cal. yr BP, that is, before AD 1950, and the age of the surface peat set to the year of core collection (−66 cal. yr BP for 2016).
Plant macrofossil analysis
Detailed plant macrofossil analysis was performed to investigate the botanical composition of the peat profiles. Methods for preparation and analysis followed Mauquoy and van Geel (2007). Samples (4–5 cm3) were collected every 5 cm throughout the cores, each representing a 2.5-cm interval. Coverage of roots, epidermis, peridermis, mosses and wood was estimated as volume percentage of the total sample. For seeds and leaves, the numbers were counted and recalculated to represent a fixed volume of 5 cm3. In order to identify the transition from fen peat to xerophilic peat with high precision for radiocarbon dating, every sample around that depth was analysed, subdivided into 1.25 cm intervals when required.
Identification of Sphagnum species followed Laine et al. (2011), while identification of Amblystegiaceae, Calliergonaceae and other mosses was based on Nyholm (1975a, 1975b) Landwehr (1984), Hedenäs (2003), Hallingbäck et al. (2008a, 2008b) and Hedenäs et al. (2014), using the most recent publications for nomenclature. Seed and leaf identification was based on Birks (2007), Mauquoy and van Geel (2007) and Cappers et al. (2012). Mossberg and Stenberg (1992) was used for ecology and geographic distribution, as well as nomenclature of vascular plants. Degree of decomposition was estimated qualitatively on a scale of 1–5, where 1 is almost intact and 5 is highly degraded and hardly identifiable macrofossils. Stratigraphic plant macrofossil diagrams were plotted using C2, version 1.7.2 (Juggins, 2011). Each profile was subdivided into stratigraphic zones based on significant compositional changes. This zonation was a generalization, made visually in order to identify major developmental stages, such as the minerogenic phase, fen and peat bog conditions.
Geochemical analyses and carbon accumulation
Samples (4–5 cm3) for analyses of bulk density and organic matter were collected for the same depths and using the same method as for the plant macrofossil analysis. All samples were dried at 95ºC for 24 h and weighed to calculate water content and bulk density. Loss on ignition was performed at 550ºC for 2 h to document changes in organic matter (OM) content, and at 950ºC for 2 h to quantify the inorganic carbon content. The inorganic carbon content was negligible and not considered in further analyses.
To determine the elemental and isotopic organic carbon and nitrogen composition, 0.5 cm3 cubes of peat were sampled at 10-cm intervals. The samples were dried at 65°C for 48 hours and homogenized in an agate mortar. About 1–3 mg per sample was analysed for carbon and nitrogen content and isotopic composition using an EA 1110 elemental analyzer coupled to a Finnigan MAT DeltaPlus isotope ratio mass spectrometer. An in-house made laboratory standard calibrated against international standards from IAEA (isotopes) or atropine (elemental) was used. Isotopic nitrogen and C/N values were further used to identify peat perturbation, since aeration during peat plateaus uplift results in loss of isotopically light forms of nitrogen, causing increased δ15N values (Krüger et al., 2017). Theoretical δ15N values for unperturbed peat were calculated based on the received C/N values, according to the equation given by Conen et al. (2013):

This correlation was developed for oxic soils, but is suggested to be applicable also to subarctic peatlands (Krüger et al., 2017). Samples deviating more than ±2.4 ‰ (94% of the unperturbed samples in Conen et al. (2013) from the calculated values were defined as perturbed.
Peat accumulation rates were calculated using the age–depth models derived by ‘Bacon’. For Suossjavri, linear interpolation was used between the three lowermost dated samples since the modelled ages were unrealistic. The long-term apparent carbon accumulation rates (Tolonen and Turunen, 1996) were calculated according to the equation:

Where r is the peat accumulation rate (mm yr−1), ρ is the bulk density (g cm−3) and X is the C content in relative proportion (0–1) to the bulk density dry mass. Results are expressed in gC m−2 yr−1.
Results and interpretation
AMS radiocarbon dating and age-depth models
Radiocarbon ages, calibrated age intervals and calibrated mean ages for all four peat profiles are presented in Table 2. Ages of the lowermost samples are assumed to represent peatland initiation and the youngest date in each profile, corresponding to the shift in vegetation assemblages, suggests permafrost aggradation. The two deepest peat deposits were found at the continental sites, with basal peat ages of around 9800 and 9200 cal. yr BP, respectively (Figure 2). According to the age-depth model, the lowermost radiocarbon dated sample from Suossjavri (ca. 9800 cal. yr BP) could be considered an outlier. However, the modelled age (ca. 11,600 cal. yr BP) is too old in relation to deglaciation of the area (10,900–10,800 cal. yr BP) (Stroeven et al., 2016), and therefore not realistic. For the two coastal sites, the peat depth was shallower, with basal peat dated to around 6150 and 5150 cal. yr BP. Permafrost aggradation was dated to between ca. 950 and 100 cal. yr BP.
AMS radiocarbon dates from the four peat profiles. Calibrated ages are mean ages within the 95.4% confidence intervals, and grey samples are considered outliers in the age-depth models.
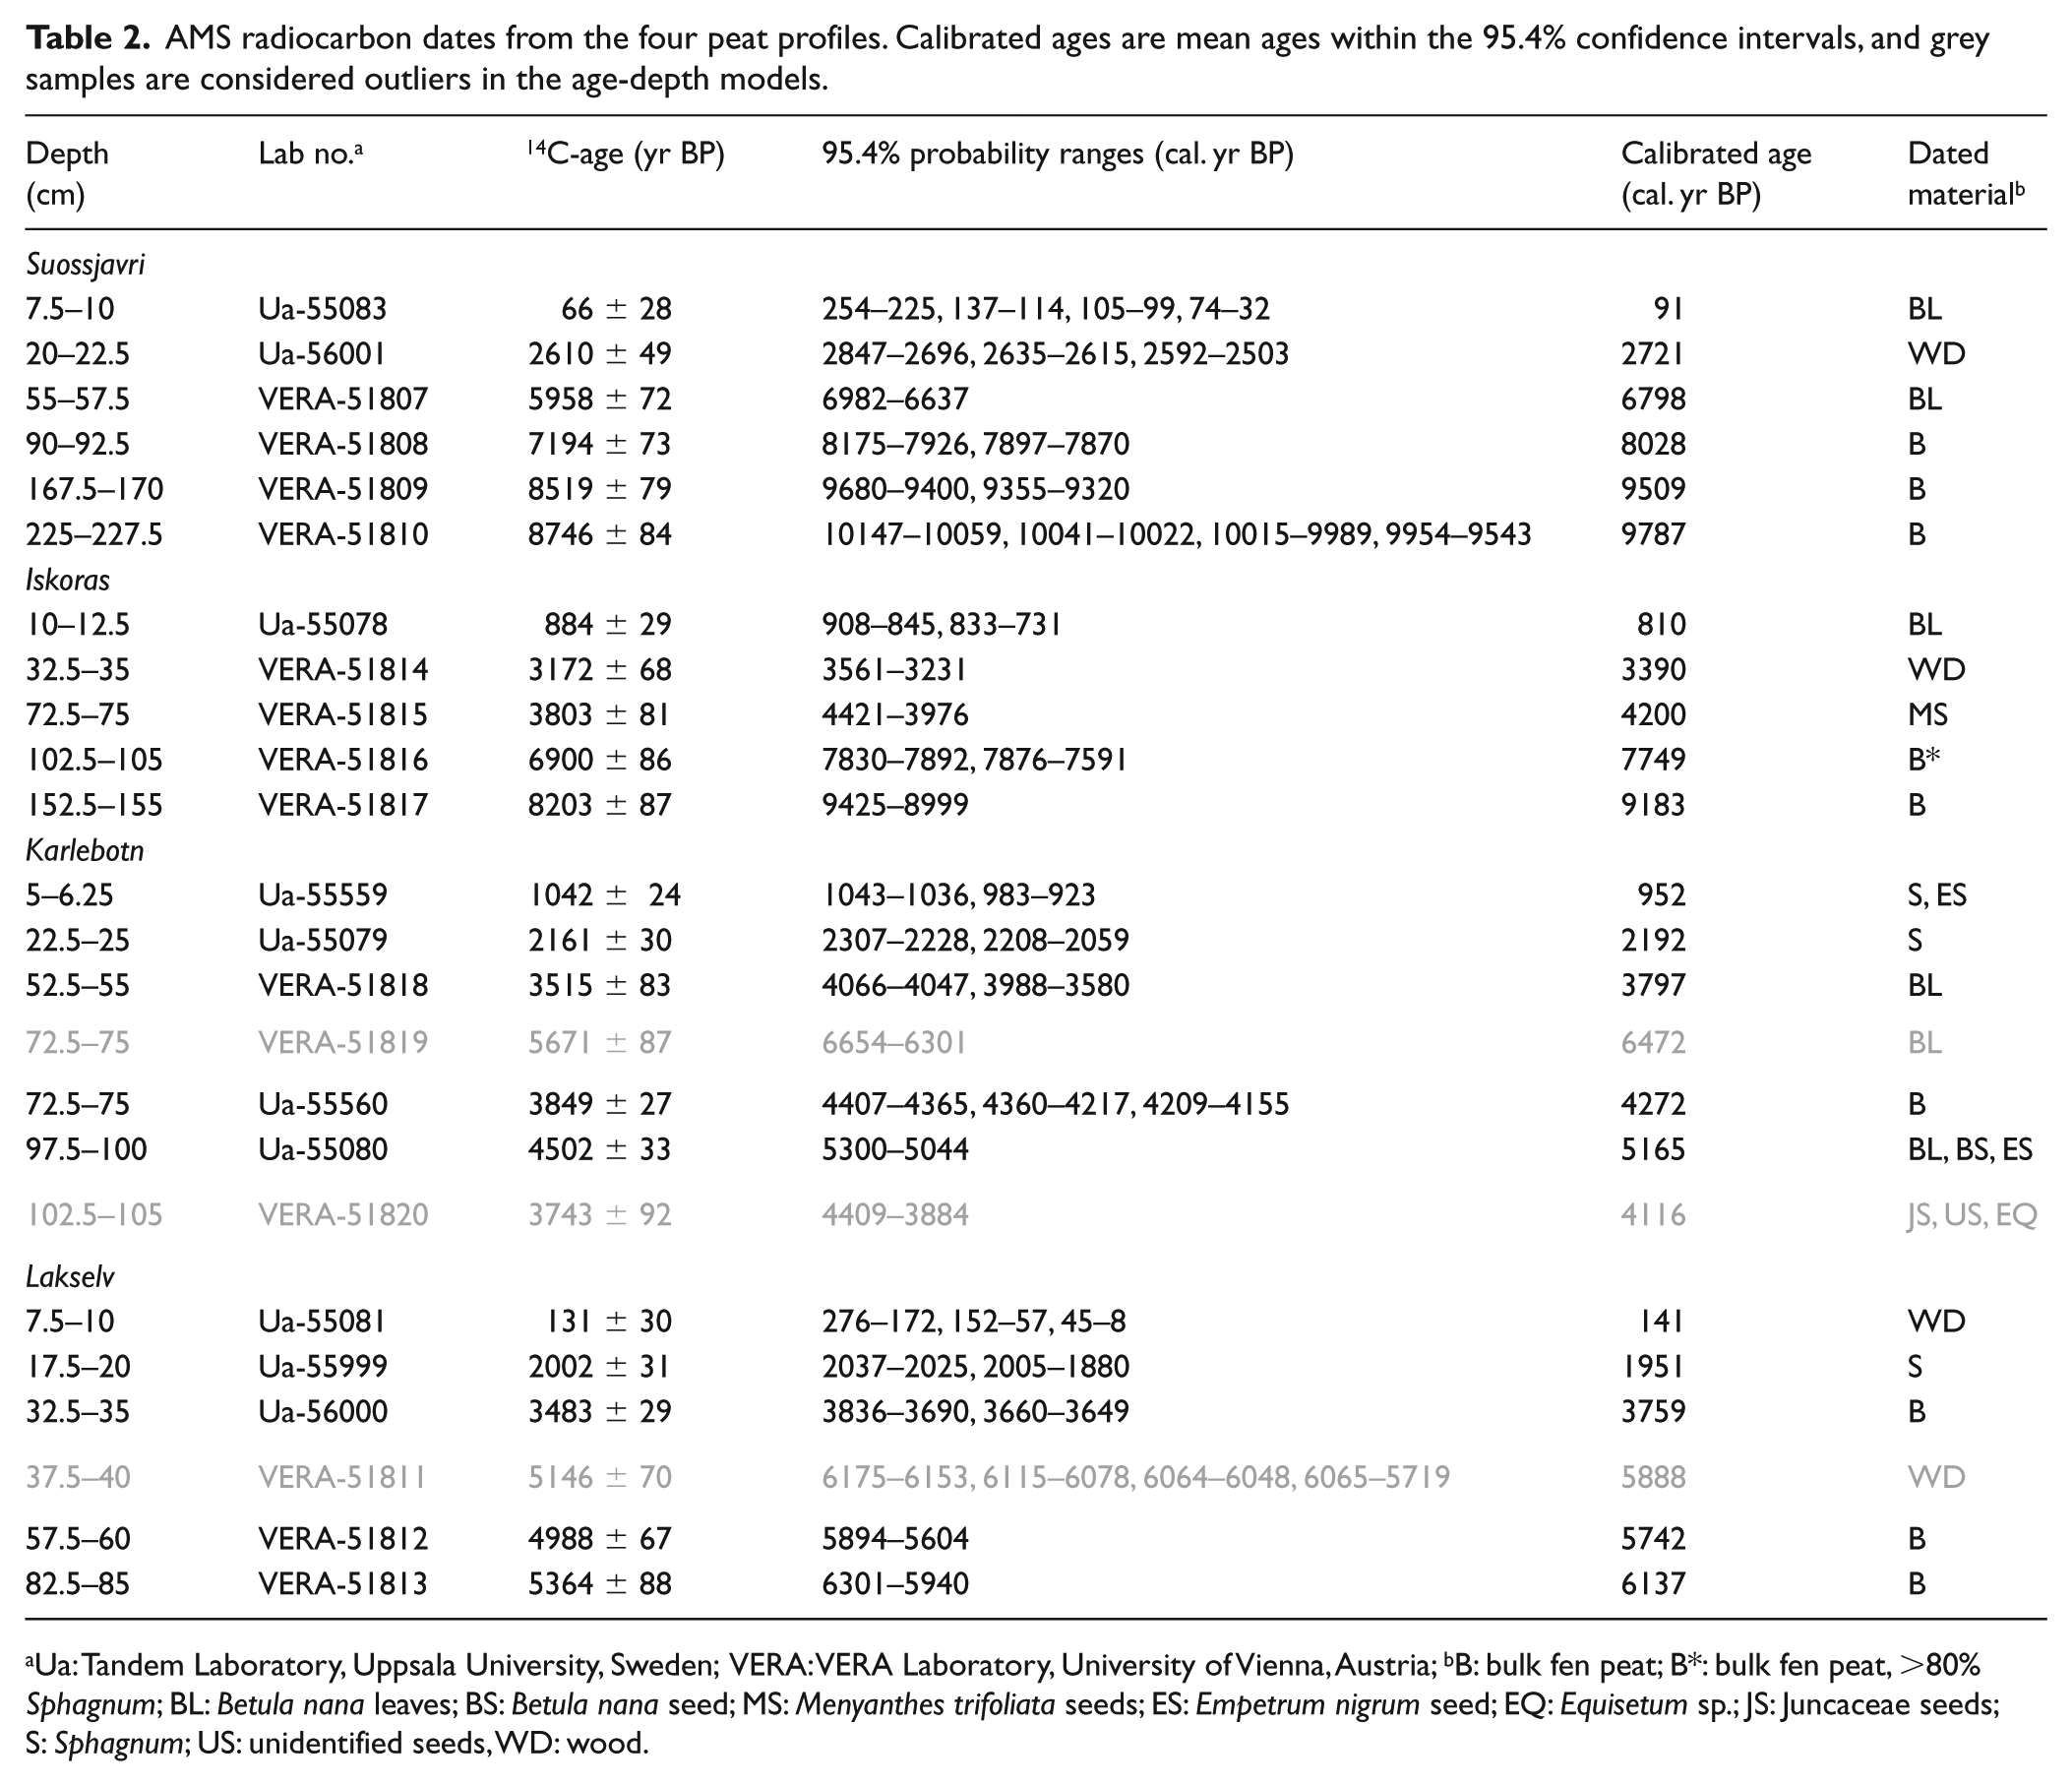
Ua: Tandem Laboratory, Uppsala University, Sweden; VERA: VERA Laboratory, University of Vienna, Austria; bB: bulk fen peat; B*: bulk fen peat, >80% Sphagnum; BL: Betula nana leaves; BS: Betula nana seed; MS: Menyanthes trifoliata seeds; ES: Empetrum nigrum seed; EQ: Equisetum sp.; JS: Juncaceae seeds; S: Sphagnum; US: unidentified seeds, WD: wood.
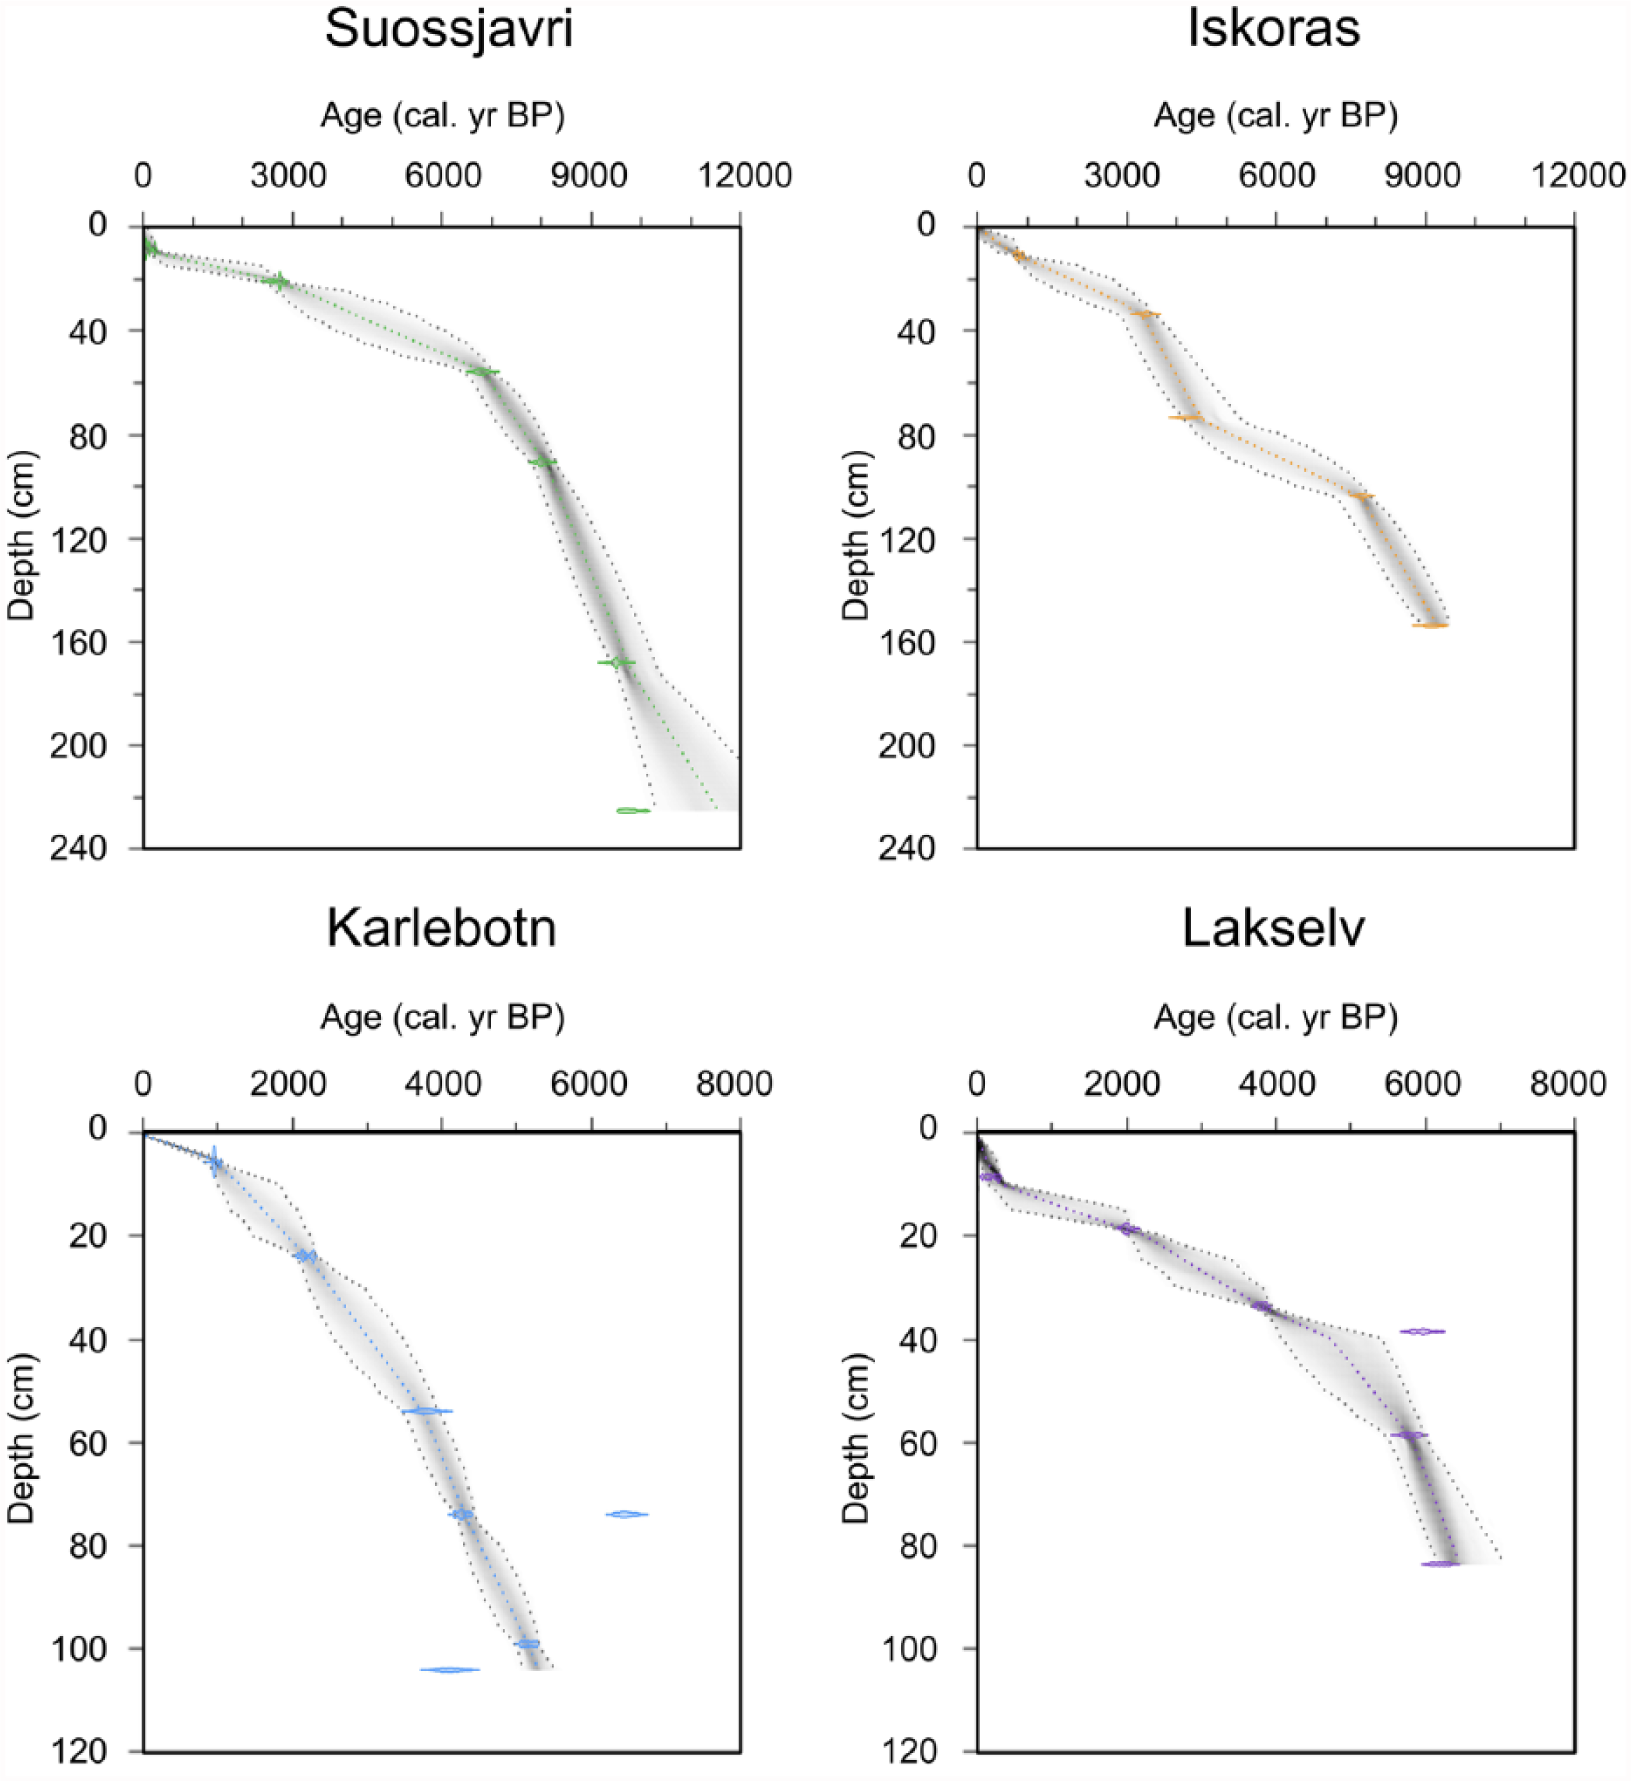
Age–depth models for Suossjavri, Iskoras, Karlebotn and Lakselv, showing calibrated radiocarbon dates and age–depth curves (darker grey indicating more likely calendar ages). Central dotted lines show the best models based on the mean age for each depth and outer dotted lines the 95% confidence intervals.
Plant macrofossil analysis
The plant macrofossil assemblages suggested similar peatland successions at all four investigated sites. The lower parts of the profiles were characterized by sedge and brown moss-dominated fen peat, whereas the top parts consisted of Sphagnum and shrub rootlet peat. Each profile is subdivided into three stratigraphic zones, where zone 0 is the minerogenic phase, zone I represents a minerotrophic fen environment, and zone II ombrotrophic peat bog conditions. For detailed plant macrofossil information of the individual peat profiles, see the diagrams in Figure 3.
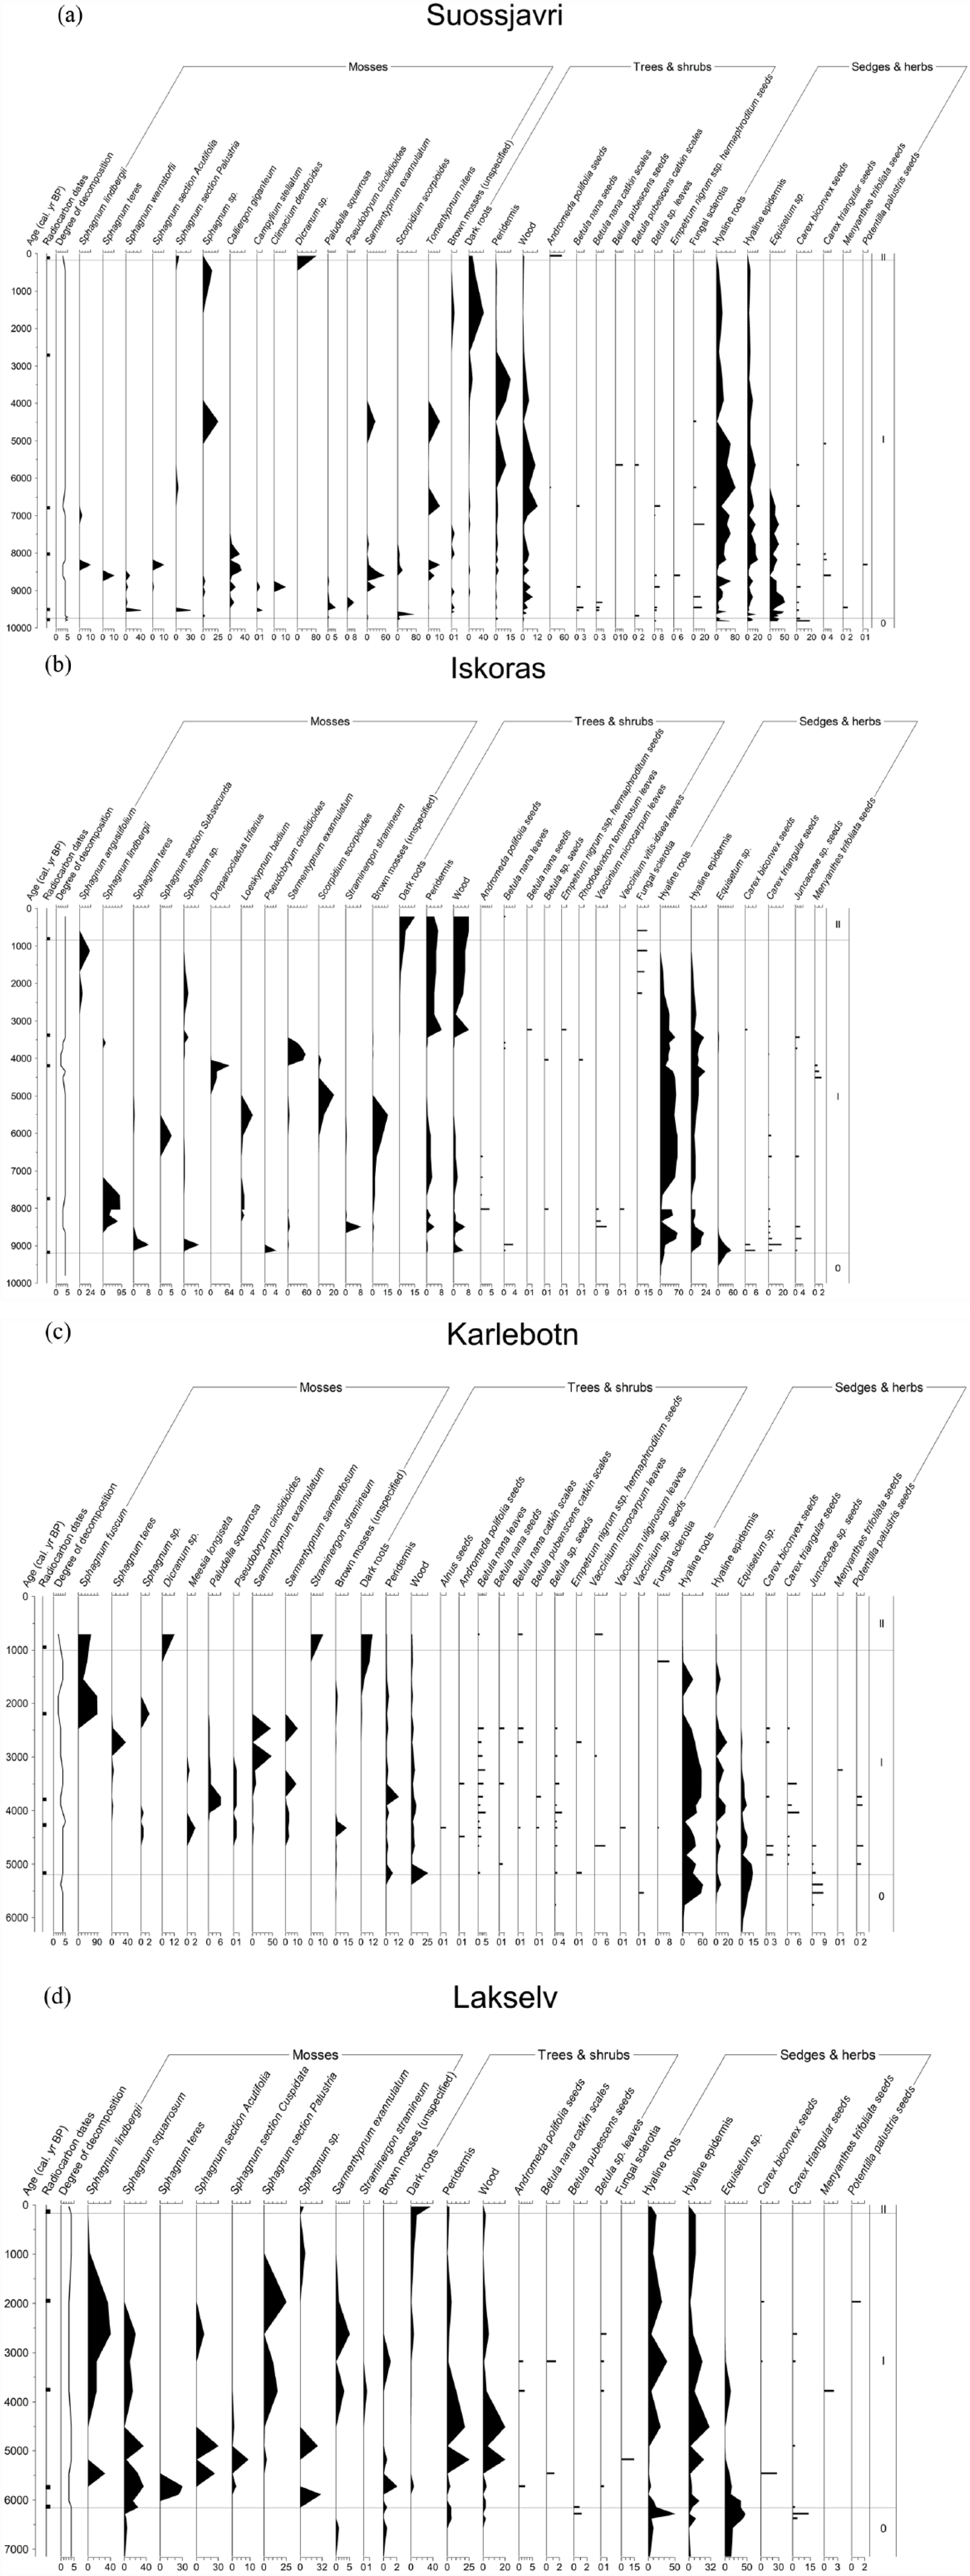
Plant macrofossil diagrams for (a) Suossjavri, (b) Iskoras, (c) Karlebotn and (d) Lakselv. Degree of decomposition is expressed on a scale 1–5 (line), and distributions of macrofossils as volume percentages (silhouette contours) or as counts per 5 cm3 (bars) of analysed material.
Zone 0: Minerogenic soil stage
The lowermost, minerogenic part of all profiles consisted of fine-grained material (sand in Iskoras and Lakselv, silt in Karlebotn and Suossjavri), with low percentage (<6%) of organic material. Some remains of Cyperaceae and Equisetum sp. roots were present, probably penetrating down from higher levels, along with a few mosses (Sarmentypnum exannulatum and Sphagnum squarrosum) and seeds (e.g. Juncaceae and Carex spp.). The contact between minerogenic soil and overlying peat was found at 2.3 and 1.6 m depth at the continental sites (Suossjavri and Iskoras; dated to ca. 9800 and 9200 cal. yr BP) and at 1.0 and 0.8 m depth at the coastal sites (Karlebotn and Lakselv; dated to ca. 5150 and 6150 cal. yr BP).
Zone I: Fen stage
During peatland initiation, fen environments developed at all studied peatlands. At two of the sites, Iskoras and Lakselv, minerotrophic Sphagnum species (e.g. S. lindbergii, S. squarrosum and S. teres) dominated the moss flora at an early stage. In Suossjavri, Sphagnum spp. were accompanied by various brown mosses growing in very wet fen environments (e.g. Scorpidium scorpioides, Sarmentypnum exannulatum and Calliergon giganteum), whereas in Karlebotn, mosses did not appear until around 4600 cal. yr BP. For most of the zone, brown mosses and Cyperaceae were dominating the vegetation. The brown moss assemblages varied slightly from site to site and the composition changed through time, suggesting somewhat different hydrological and nutrient conditions, however all indicating wet and rich to intermediate fen conditions. Generally, the initial fen stage appeared rich in nutrients, as indicated by Pseudobryum cinclidioides, Tomentypnum nitens, S. teres and S. warnstorfii. Later on, species indicative of lower nutrient levels, such as Drepanocladus trifarius, Loeskypnum badium and S. lindbergii were more common. Sarmentypnum exannulatum occurred throughout zone I, often co-existing with Paludella squarrosa, S. sarmentosum, Scorpidium scorpioides or various Sphagnum species. At all sites, Cyperaceae were common throughout the zone, in the beginning accompanied by Equisetum sp. The frequent occurrence of seeds of Potentilla palustris, Menyanthes trifoliata and Carex spp. also indicated a wet fen environment.
Since the plant macrofossil assemblages at the sampling sites were dominated by wet-growing brown mosses and Cyperaceae throughout zone I, sporadically occurring remains of wood, peridermis and leaf fragments (ericaceous shrubs and B. nana) suggesting drier surface conditions, were interpreted to represent vegetation growing on nearby hummocks. At all sites, the uppermost part of zone I was characterized by a high degree of decomposition, suggested to indicate aerobic decay due to exposure above the water table caused by frost heave. In Iskoras and Karlebotn, fungal sclerotia appeared, which are also indicative of drier conditions and interpreted to be a result of post-depositional processes. In Karlebotn, the hummock-growing S. fuscum dominated the last 2200 years. When S. fuscum first appeared, Cyperaceae decreased, possibly representing a vegetation shift caused by frost heave, indicating an early permafrost phase. Sedges became abundant again around 1500 cal. yr BP, suggesting permafrost-free conditions at this time. After ca. 1000 cal. yr BP Cyperaceae disappeared.
Zone II: Peat plateau stage
This zone was characterized by a transition from wet-growing fen vegetation to plant remains indicative of a drier surface environment, such as dark roots, peridermis and leaves of ericaceous shrubs and B. nana. Cyperaceae and brown mosses were mostly absent. In Karlebotn and Suossjavri, Dicranum sp. (generally growing under drier conditions) occurred, in Karlebotn together with S. fuscum. These observations pointed towards dry, ombrotrophic conditions, and vegetation similar to the modern peat plateau surfaces suggested permafrost occurrence. This transition occurred ca. 950 cal. yr BP in Karlebotn, 800 cal. yr BP in Iskoras, 150 cal. yr BP in Lakselv and 100 cal. yr BP in Suossjavri.
Geochemical analyses and carbon accumulation
The mean peat dry bulk density at the four sites varied between 0.08 and 0.28 g cm−3, with a mean bulk density of 0.17 ± 0.06 g cm−3 (±SD) (Figure 4). Lower values below the permafrost table could be explained by high ice content, and in the uppermost part of the profiles by a higher porosity in the dry surface peat. Also, Sphagnum and woody peat generally have lower bulk densities compared to herbaceous or brown moss peat (Loisel et al., 2014).
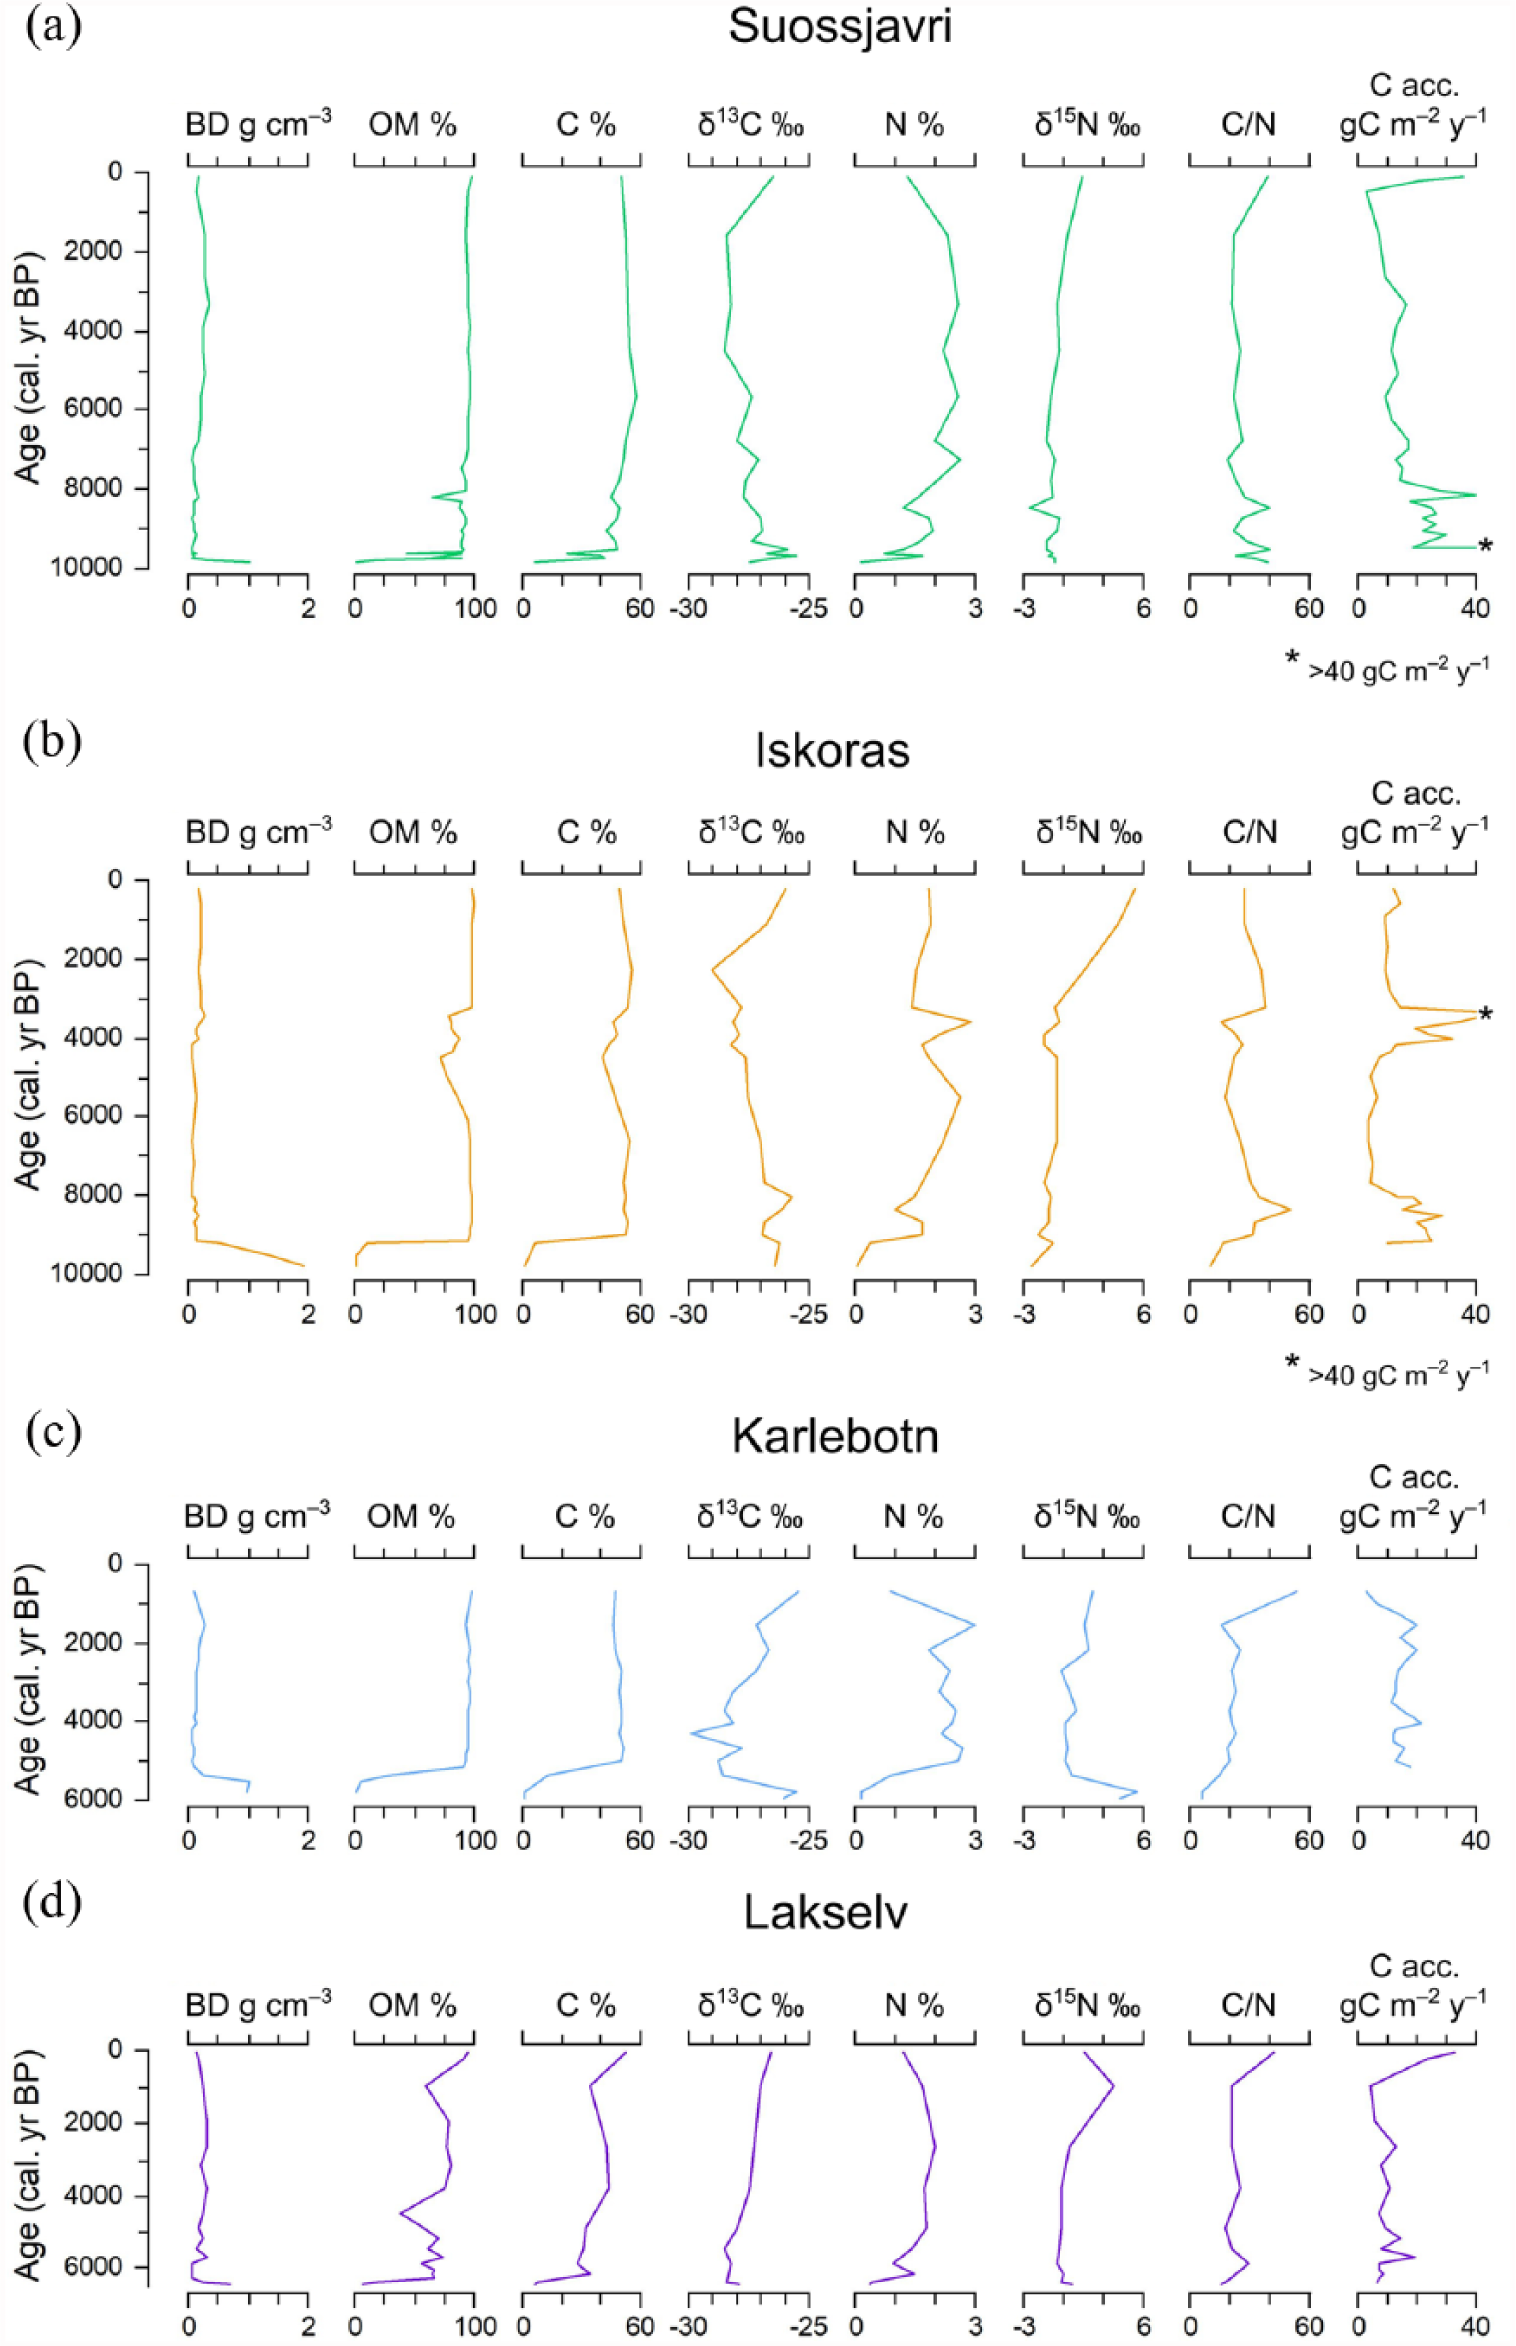
Geochemical data for (a) Suossjavri, (b) Iskoras, (c) Karlebotn and (d) Lakselv. Bulk density (BD g cm–3), organic matter content (OM %), carbon content (C %), isotopic carbon signal (δ13C ‰), nitrogen content (N %), isotopic nitrogen signal (δ15N ‰), carbon-to-nitrogen ratio (C/N) and carbon accumulation rates (C acc. gC m−2 y−1).
The organic matter content was on average 88 ± 13% for all four peat profiles (39–99%). At three of the sites; Suossjavri, Iskoras and Karlebotn, the organic matter content was generally >88%. In Lakselv, the peat organic matter content was lower, averaging 70 ± 14%, probably due to a higher proportion of minerogenic material. The mean carbon content at all four sites was 47.0 ± 7.5% (22.2–56.7%), and the mean nitrogen content 1.9 ± 0.5% (0.7–3.0%). Changes in carbon could be correlated to changes in organic matter content, whereas changes in nitrogen content could reflect changes in plant community or degree of decomposition. In Suossjavri, Karlebotn and Lakselv, the nitrogen content decreased in the uppermost peat.
The mean C/N ratio was 27.0 ± 8.3 (15.3–53.9). In Suossjavri and Karlebotn, changes in the C/N ratios could be explained by changes in nitrogen content, since the carbon content remained relatively stable. In Suossjavri, Karlebotn and Lakselv, the C/N ratio increased in the permafrost peat bog from around 1000 cal. yr BP.
The mean isotopic carbon (δ13C) value was −27.4 ± 0.9‰ (between −29.9 and −25.4‰), and the mean isotopic nitrogen (δ15N) value 0.0 ± 1.5‰ (between −2.6 and 5.4‰) for all four sites. Higher δ13C and δ15N values in the uppermost part of the Suossjavri and Iskoras profiles coincided with the transition to drier conditions during permafrost aggradation. In Iskoras, Karlebotn, Lakselv and possibly Suossjavri, the uppermost peat samples were perturbed according to the relationship between δ15N and C/N ratio (Conen et al., 2013). Samples above the uncertainty envelope (dashed line in Figure 5) indicate losses of isotopically light nitrogen, connected to increased decomposition rates during aeration due to frost heave (Krüger et al., 2017). In Iskoras, also a few samples further down in the peat sequence were perturbed, possibly reflecting changes in the botanical composition, degree of decomposition or mineral influence affecting the nitrogen content. The lowermost samples could also be perturbed, due to mineral influence.
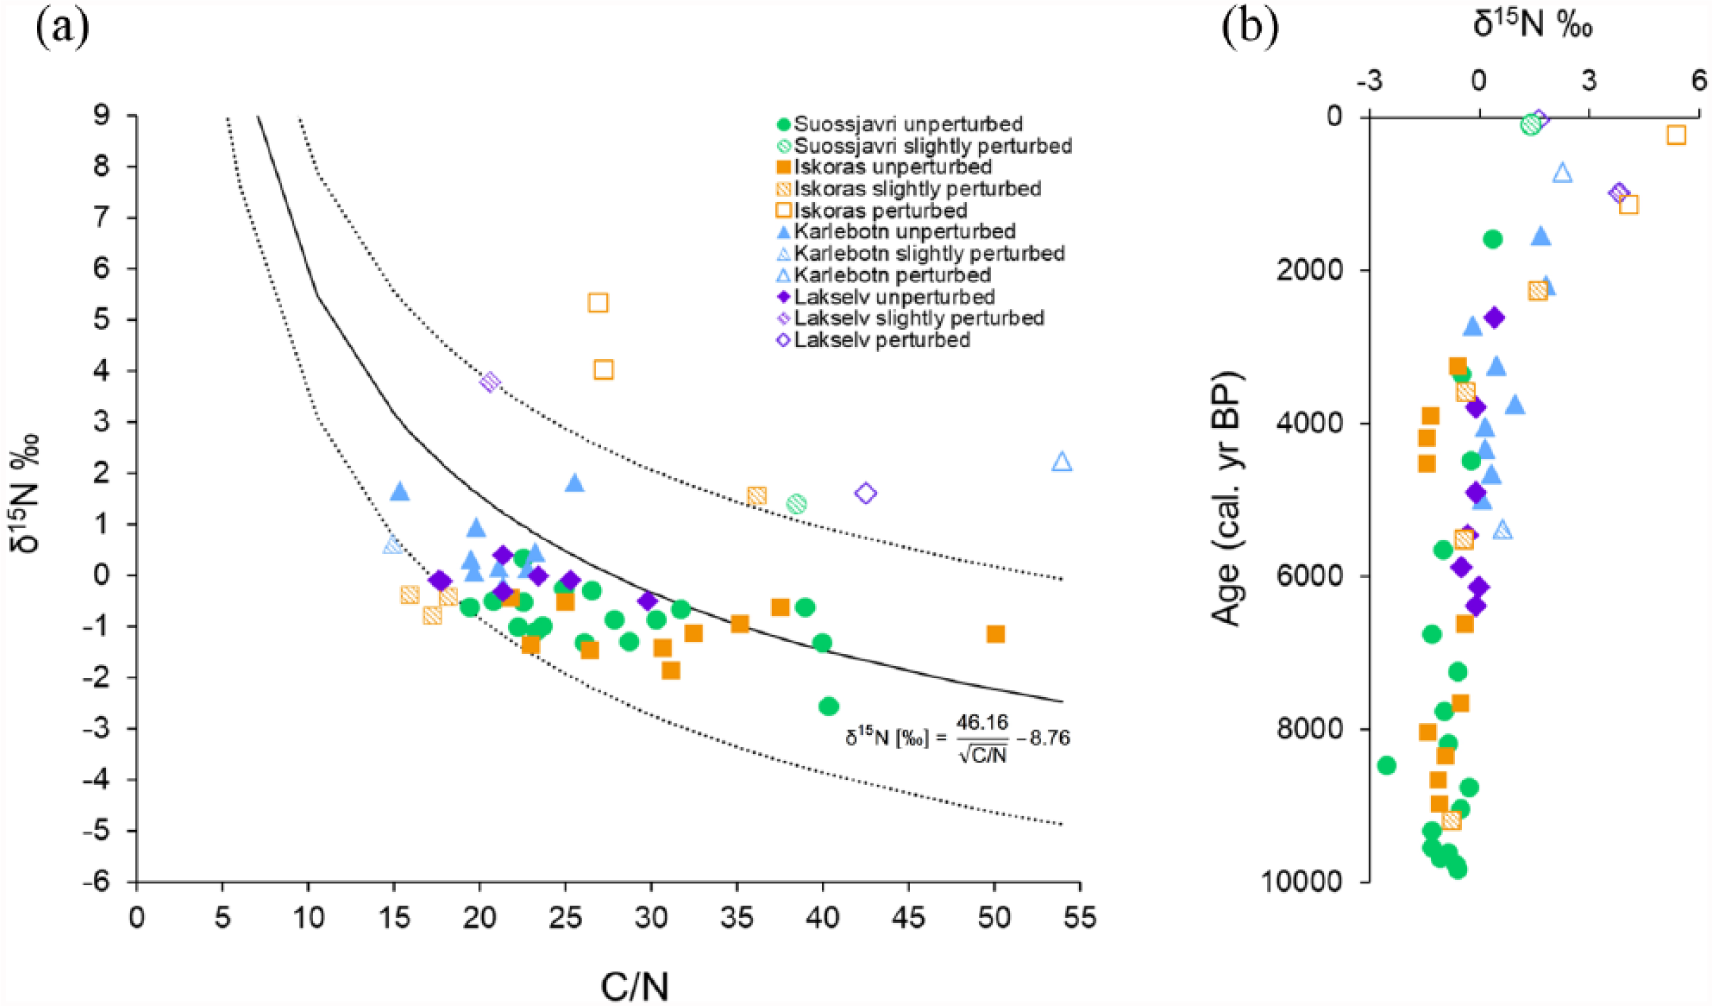
(a) Correlation between δ15N values and C/N ratio for the four study sites. Samples are classified into unperturbed (within uncertainty envelope; dotted lines, ±2.4‰) or perturbed (outside uncertainty envelope), based on the relationship given by Conen et al. (2013). Closed symbols represent unperturbed samples, dashed symbols range 2.4–3.2‰ from the regression function and open symbols indicate perturbed samples. (b) δ15N depth profiles for the four peat profiles, with perturbation status based on the same relationship as in (a).
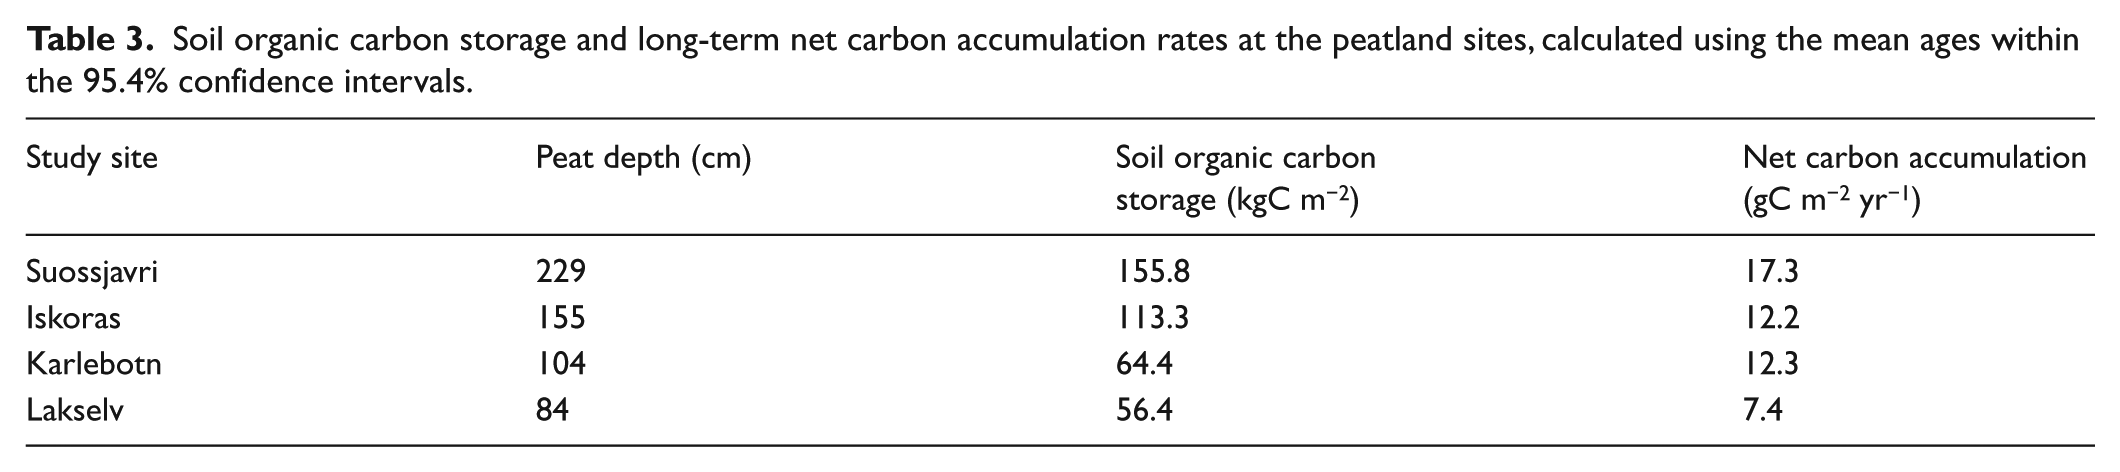
The mean long-term apparent carbon accumulation rate was 12.3 ± 4.1 gC m−2 y−1. The highest carbon accumulation rate (17.3 gC m−2 y−1) was recorded in Suossjavri and the lowest value (7.4 gC m−2 y−1) in Lakselv (Table 3). The soil organic carbon storage was on average 97 ± 46 kgC m−2, with lower values (<100 kgC m−2) at the two younger and shallower peat deposits in Karlebotn and Lakselv, and higher carbon storage (>100 kgC m−2) in the older and deeper peatlands in Suossjavri and Iskoras (Table 3).
Soil organic carbon storage and long-term net carbon accumulation rates at the peatland sites, calculated using the mean ages within the 95.4% confidence intervals.
Discussion
Peatland inception
Extensive peatland initiation started in northern Fennoscandia soon after the last deglaciation, around 10,000–8000 cal. yr BP (e.g. Korhola et al., 2010; Oksanen, 2006; Ruppel et al., 2013; Sannel et al., 2018; Weckström et al., 2010). The timing of peatland inception in Finnmark depended on factors such as local deglaciation pattern, elevation, topography and distance to the ocean. The coastal parts of Finnmark became ice-free around 14,200–11,200 cal. yr BP (Stokes et al., 2014), and the more continental parts ca. 10,900–10,800 cal. yr BP (Stroeven et al., 2016). However, coastal areas remained below sea level after deglaciation (Supplementary Information), until ca. 9700 cal. yr BP in Lakselv and ca. 6500 cal. yr BP in Karlebotn (cf. Corner et al., 1999). Our study shows that peatlands started to form at the Finnmarksvidda plateau (~340–380 m a.s.l.) around 9800 cal. yr BP in Suossjavri, and approximately 600 years later in Iskoras. Further north, closer to the sea and at lower altitude (~30–50 m a.s.l.) peatland inception did not start until later, around 6150 cal. yr BP in Lakselv and ca. 5150 cal. yr BP in Karlebotn. The peatland inception ages for at least two of the sites (Suossjavri and Iskoras) could be correlated to the first period of accelerated peatland initiation in northern Europe, described by Weckström et al. (2010) and Ruppel et al. (2013), falling within the 10,000–8000 cal. yr BP time window.
At our four study sites, the early peatland stages were characterized by plant macrofossils typically found in wet fen environments, such as Equisetum sp., Carex spp. and minerotrophic mosses (e.g. P. cinclioides, S. scorpioides and S. teres). No indications of a lake phase were evident in the plant macrofossil record or the lithology, excluding terrestrialization as the driving force. Peatlands may have formed through paludification, starting in lower-lying terrain, later expanding into the sampling areas. Some wood fragments and peridermis indicated dry conditions nearby, but not at the actual sampling sites since no roots from shrub vegetation were present. Furthermore, wood remains occurred throughout the profiles, even during clearly wet conditions at the sampling sites.
Based on the macrofossil data, with a dominance of wet growing fen species in the initial phase directly on fine-grained soils, we suggest that the main peat forming process was primary peatland formation. However, this can be questioned by long time gaps (1000–3500 years) between estimated deglaciation ages and peatland development. In other Fennoscandian studies, peatland formation is dated to directly or soon after deglaciation (e.g. Kokfelt et al., 2010; Oksanen, 2006; Seppä and Birks, 2001; Seppälä, 2005). Possibly, the deglaciation and/or the emergence ages for our study sites could be reconsidered since they were estimated based on regional reconstructions (Corner et al., 1999; Stroeven et al., 2016). A later deglaciation could be explained by local factors, such as geomorphology, allowing preservation of dead ice. For the coastal sites, shore displacement can vary on a regional or even on a rather local scale. The emergence ages are based on a study from the Norwegian-Russian border, approximately 80 and 200 km east of Karlebotn and Lakselv, respectively (Corner et al., 1999), and are therefore roughly estimated.
Peatland development
After peatland initiation, wet fen environments prevailed at all four study sites throughout most of the Holocene, evident by the dominance of brown mosses, minerotrophic Sphagnum species and herbaceous plants (mainly Cyperaceae) in the plant macrofossil record. Variations in the moss assemblages were probably induced by differences in hydrology, pH and nutrient supply, however not indicative of major alterations, but rather a gradual change from mineral and nutrient rich wet fens to more rich to intermediate wet fens during the later Holocene.
Suossjavri and Iskoras experienced relatively high peat and net carbon accumulation rates immediately after peatland inception until around 7800–6800 cal. yr BP. This could be explained by warm and moist early Holocene conditions during that time favouring plant productivity (Ruppel et al., 2013; Weckström et al., 2010). A possible explanation for the following decrease in accumulation rates could be Neoglacial cooling after the HTM (Loisel et al., 2014). In total, the fen stage persisted for more than 8000–9000 years in Suossjavri and Iskoras and 4000–6000 years in Karlebotn and Lakselv, before a shift took place towards dry peat bog conditions.
Permafrost aggradation
Due to cooler conditions, permafrost eventually developed in the peatlands in Finnmark. In the studied peat profiles, permafrost aggradation was evident by a shift in the macrofossil assemblages towards plants indicating drier surface conditions, such as S. fuscum, Dicranum sp., B. nana and ericaceous shrubs, as well as an increased decomposition level due to oxygen availability. Dry conditions were also suggested by the decrease in carbon accumulation rate in Karlebotn and the decrease in nitrogen in Suossjavri, Karlebotn and Lakselv, also indicative of permafrost (Treat et al., 2016).
Previous studies suggest that most palsas and peat plateaus in northern Fennoscandia formed around 800–100 cal. yr BP (Kokfelt et al., 2010; Oksanen, 2006; Sannel et al., 2018; Seppälä, 2005; Vorren, 1972, 1979; Zuidhoff and Kolstrup, 2000), as a result of climate cooling around 850 cal. yr BP at the onset of the Little Ice Age (Grudd et al., 2002). Earlier periods of permafrost aggradation may be correlated to periods of climatic cooling during the late Subboreal to early Subatlantic (3400–1800 cal. yr BP) transition (e.g. Åhman, 1977; Oksanen et al., 2003). The oldest preserved palsas in northern Fennoscandia are suggested to date back to ca. 2500 cal. yr BP (Oksanen, 2006), and are located in Vaisjeäggi, halfway between Iskoras and Karlebotn. In our four dated profiles, the shift to permafrost bog peat was dated to between ca. 950 and 100 cal. yr BP. These ages are comparable to previous studies from Finnmark (Åhman, 1977; Vorren, 1972, 1979) and fit well with the general trend in northern Fennoscandia (e.g. (Kokfelt et al., 2010; Oksanen, 2006; Sannel et al., 2018) (Table 4).
Peatland inception ages and permafrost aggradation ages for palsas and peat plateaus in northern Fennoscandia. Calibrated ages are mean ages within the 95.4% confidence intervals.
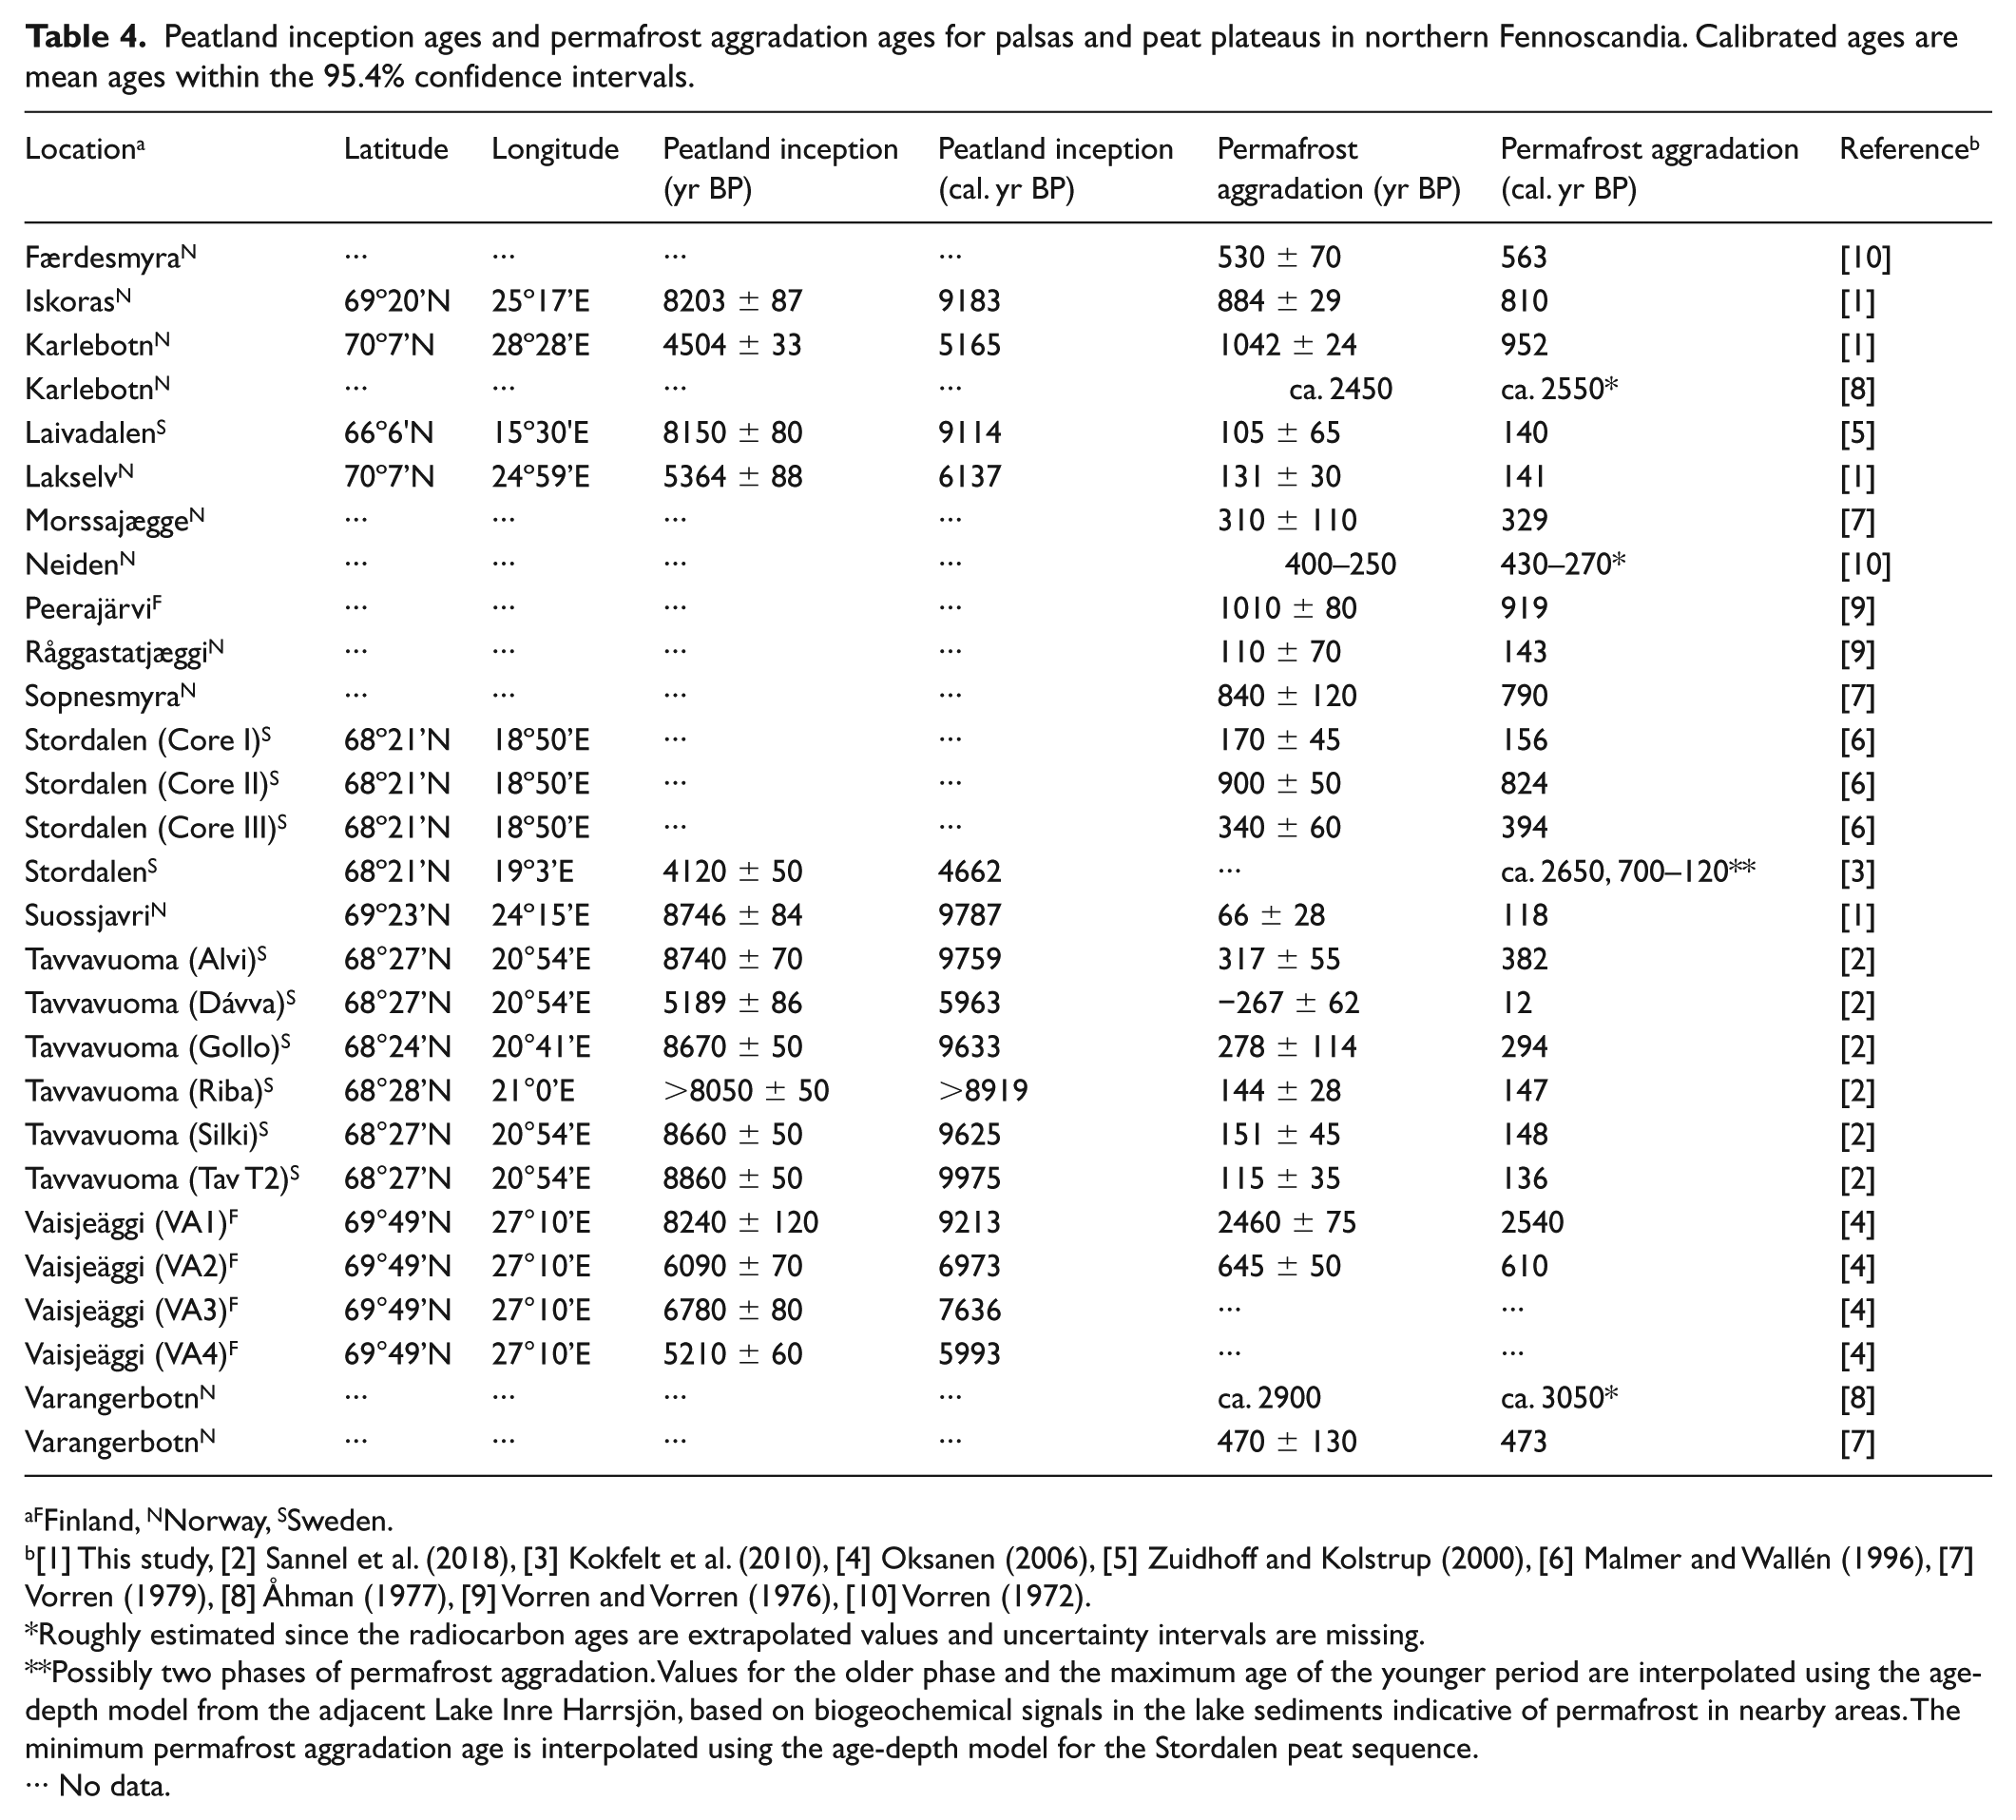
FFinland, NNorway, SSweden.
[1] This study, [2] Sannel et al. (2018), [3] Kokfelt et al. (2010), [4] Oksanen (2006), [5] Zuidhoff and Kolstrup (2000), [6] Malmer and Wallén (1996), [7] Vorren (1979), [8] Åhman (1977), [9] Vorren and Vorren (1976), [10] Vorren (1972).
Roughly estimated since the radiocarbon ages are extrapolated values and uncertainty intervals are missing.
Possibly two phases of permafrost aggradation. Values for the older phase and the maximum age of the younger period are interpolated using the age-depth model from the adjacent Lake Inre Harrsjön, based on biogeochemical signals in the lake sediments indicative of permafrost in nearby areas. The minimum permafrost aggradation age is interpolated using the age-depth model for the Stordalen peat sequence.
··· No data.
In Karlebotn, permafrost aggradation was dated to around 950 cal. yr BP and in Iskoras to ca. 800 cal. yr BP, the latter possibly correlated to the onset of the Little Ice Age (Grudd et al., 2002). Permafrost aggradation was later in Lakselv and Suossjavri, dated to around 150 and 100 cal. yr BP, respectively. In both these profiles, a high degree of decomposition complicated identification of plant material representing the transition from wet fen to dry bog peat, and restricted the depths possible to date. These ages therefore represent minimum ages for permafrost aggradation.
Potentially, there was an earlier phase of permafrost in Karlebotn, as indicated by the dominance of S. fuscum suggesting drier surface conditions, and disappearance of brown mosses and Cyperaceae already around 2200 cal. yr BP. This age is comparable to other studies, suggesting permafrost aggradation during the cool late Subboreal to early Subatlantic transition (Åhman, 1977; Kokfelt et al., 2010; Oksanen, 2006). However, this pattern was not evident at any of the other sites, and occurrence of S. fuscum does not necessarily imply permafrost conditions. Furthermore, no species indicative of palsa collapse (e.g. S. riparium) were encountered, and no signs of perturbation caused by the proposed frost heave were evident when comparing δ15N and the C/N ratio at that depth.
Carbon and nitrogen content, C/N ratio and carbon accumulation
Due to the accumulation of partly degraded organic matter, northern peatlands have acted as long-term net carbon sinks since their initiation in the early Holocene (Loisel et al., 2014; MacDonald et al., 2006; Yu et al., 2010). Different vegetation types contribute to different peat carbon content, so that the net carbon content partly reflects changes in botanical composition (Loisel et al., 2014; Treat et al., 2016). In the studied profiles from Finnmark, the mean carbon content was 47% (averages ranging from 37% to 50%). This is comparable to mean carbon values between 42% and 51% for northern circumpolar peatlands, reported by Loisel et al. (2014) and Treat et al. (2016). Lower mean carbon content in Lakselv (37%) could be explained by higher minerogenic influence at that site, also evident by the higher bulk density in the peat profile. The lowest organic matter content was recorded around 4000 cal. yr BP, coinciding with the end of the HTM. Also in Iskoras, the organic matter and carbon content decreased around 5400–3500 cal. yr BP, possibly because of local deposition of fine minerogenic material due to dry conditions during the HTM. This would hamper vegetation growth on the slopes in the area, resulting in more wind-transported minerogenic particles ending up on the mire. Another possible explanation could be streams flowing through the peatlands, carrying minerogenic material. A stream carrying dissolved nutrients could also possibly explain the increase in nitrogen in Iskoras. The minerogenic influence appears to be lower in Suossjavri and Karlebotn, where the peatlands cover larger areas and there is less exposed bedrock and minerogenic soils in close vicinity.
The mean nitrogen content was 1.9% at all sites (averages ranging from 0.7% to 3.0%). This fits well with the average value of 1.9% for fen peat in the northern permafrost zone (Treat et al., 2016), since all profiles consist mainly of fen peat accumulated in non-permafrost environments. Treat et al. (2016) propose that low nitrogen content can be used to identify peat affected by permafrost. By comparing permafrost peat to non-permafrost peat, they find that the nitrogen content is significantly lower in boreal permafrost peat than in permafrost-free bogs (0.9% compared to 1.6%), for peat with similar botanical composition. This pattern is also evident in Suossjavri, Karlebotn and Lakselv, where the nitrogen values were lower (0.9–1.3%) in the surface peat.
For circumpolar boreal peatlands, Treat et al. (2016) report a mean C/N ratio of 29 ± 14 for fen peat and 37 ± 19 for bog peat. The mean value for permafrost peat in boreal regions is significantly higher, 67 ± 33 (Treat et al., 2016). High C/N values are suggested to reflect the decreased decay during permafrost conditions (Sannel and Kuhry, 2009; Treat et al., 2016; Vardy et al., 2000). At the four sites in Finnmark, the mean C/N ratio was 27 ± 8.3, reflecting the long-term dominance by fen vegetation. Increasing C/N values in the uppermost permafrost bog peat in Suossjavri, Karlebotn and Lakselv from ca. 1000 cal. yr BP fit well with the interpretation of permafrost aggradation during the last millennium. Also the isotopic nitrogen values are suggested to be useful indicators of permafrost aggradation, since aeration during frost heave causes a change in nitrogen source (Krüger et al., 2017). By comparing the relationship between C/N ratio and δ15N, as suggested by Krüger et al. (2017), perturbation indicating permafrost aggradation was evident in the uppermost peat in Iskoras, Karlebotn, Lakselv and possibly in Suossjavri. However, in our study, this new method was considered a complement rather than a substitute to plant macrofossil analysis, since the signals from the two records were not always coherent. In Karlebotn, a possible earlier permafrost phase was not evident in the C/N record, and in Iskoras perturbation was suggested further down by the C/N values than according to the plant macrofossils. This probably represented autogenic peatland succession and/or post-depositional processes rather than an early permafrost aggradation. Perturbed samples further down in the Iskoras peat profile coincided with depths with lower organic matter content, probably reflecting mineral influence affecting the nitrogen source. Also the lowermost samples in Iskoras and Karlebotn appeared slightly perturbed, reflecting disturbance at the mineral to peat boundary.
Our study reports a mean long-term net carbon accumulation rate of 12.3 ± 4.1 gC m−2 yr−1. This fits well with the general Holocene trend for boreal and subarctic peatlands in northern Fennoscandia, with values between 12 and 16 gC m−2 yr−1 (Klarqvist et al., 2001; Mäkilä and Moisanen, 2007; Oksanen, 2006; Sannel et al., 2018). Permafrost-free fens show higher rates (23 gC m−2 yr−1) compared to boreal permafrost peatlands (14 gC m−2 yr−1) (Treat et al., 2016), explaining the higher accumulation rates during the early peatland stages. This pattern fits well with the trend of higher carbon accumulation during moist and warm early Holocene, followed by lower rates during the Neoglacial period (Loisel et al., 2014).
Significance for the carbon–climate feedback
The permafrost peatlands in Finnmark have acted as long-term carbon sinks throughout the Holocene due to carbon sequestration through photosynthesis. In the early Holocene, CH4 emissions may have been higher than today, since wet fens are associated with higher methane fluxes than permafrost bogs due to anaerobic decomposition (Hodgkins et al., 2014; Olefeldt et al., 2013). After permafrost aggradation, greenhouse gas emissions are expected to be low because of the changed hydrological conditions and the frozen state of the soil organic carbon. Under future warmer climatic conditions, carbon that has been stored in the permafrost since the Little Ice Age may be released to the atmosphere as a result of active layer deepening. Also, if dry permafrost bogs are replaced by wet fens through thermokarst, increased emissions of CH4 can be expected (Hodgkins et al., 2014; Olefeldt et al., 2013; Schuur et al., 2008). These processes are part of the carbon-climate feedback and can accelerate permafrost degradation further by increasing surface temperatures. More studies are needed to gain better understanding of the interactions between permafrost, surface hydrology and climate, in order to predict the lability of the soil organic carbon stored in subarctic peatlands.
Conclusion
This study provides new insights into Holocene development and permafrost dynamics in northern Norwegian peatlands. Detailed analyses of peat profiles at four study sites indicate that:
Peatland development started around 9800 cal. yr BP, possibly as a result of primary peatland formation. Peatland formation could start earlier in the continental parts of Finnmark (ca. 9800–9200 cal. yr BP), than closer to sea level (ca. 6150–5150 cal. yr BP) since coastal areas remained below sea level for several thousand years after deglaciation.
The peatlands formed and developed as wet fens and remained permafrost-free during most of the Holocene.
Permafrost aggradation during the last millennium (ca. 950–100 cal. yr BP) could have been caused by cooler climatic conditions that characterized the Little Ice Age.
Possibly, there was an earlier period of permafrost in Karlebotn ca. 2200 cal. yr BP, indicated by the presence of S. fuscum. This could be connected to cool conditions during the late Subboreal to early Subatlantic transition.
The long-term Holocene net carbon accumulation rate was 12.3 ± 4.1 gC m−2 y−1 and the mean soil organic carbon storage was 97 ± 46 kgC m−2.
In a future warmer climate, emissions of CO2 and CH4 can increase if the permafrost thaws and previously frozen organic matter becomes available for decay. As a result, the peatlands in Finnmark may at least in the short-term shift from being net carbon sinks to net carbon sources.
Supplemental Material
Supplementary_revised – Supplemental material for Holocene development of subarctic permafrost peatlands in Finnmark, northern Norway
Supplemental material, Supplementary_revised for Holocene development of subarctic permafrost peatlands in Finnmark, northern Norway by Sofia E Kjellman, Pia E Axelsson, Bernd Etzelmüller, Sebastian Westermann and A Britta K Sannel in The Holocene
Footnotes
Acknowledgements
We would like to thank Dr Jaroslav Obu and Prof. Terje Koren Berntsen (University of Oslo) for assistance during field sampling, Dr Lars Hedenäs (The Swedish Museum of Natural History) for valuable assistance with identification of mosses and Ass. Prof. Minna Väliranta (University of Helsinki) for help with identification of seeds. Two anonymous reviewers and the editor provided helpful comments that improved the manuscript.
Funding
This study was supported by COUP (JPI Climate, Research Council of Norway, no. 244903/E10), the Department of Geosciences, University of Oslo and the PERMANOR project (Research Council of Norway, no. 255331). Funding was also provided by the Bolin Centre for Climate Research (Research Area 3: Hydrosphere, cryosphere and climate and Research Area 5: Historical to millennial climate variability) and the Swedish Research Council Formas (no. 214–2014-562). C/N analysis was performed at the SILVER facility, the Stable Isotope Laboratory for Environmental Research, University of Vienna, Austria.
References
Supplementary Material
Please find the following supplemental material available below.
For Open Access articles published under a Creative Commons License, all supplemental material carries the same license as the article it is associated with.
For non-Open Access articles published, all supplemental material carries a non-exclusive license, and permission requests for re-use of supplemental material or any part of supplemental material shall be sent directly to the copyright owner as specified in the copyright notice associated with the article.