




Abstract
Using the numerical experiments undertaken by nine climate models within the framework of the Paleoclimate Modeling Intercomparison Project Phase 3 (PMIP3), the ensemble simulations with the Community Earth System Model for the last millennium (CESM-LME), and proxy data, we investigate the climate over China during the ‘Little Ice Age’ (LIA; from 1450 to 1850 CE) against the background of the last millennium (from 850 to 1850 CE). The surface air temperature averaged over China generally decreased over time during the last millennium, with several multi-decadal to centennial variations superimposed on the long-term cooling. Relative to the climatology of the last millennium, the annual surface temperature during the LIA decreased over the country, with an average cooling of −0.07°C for the median of the PMIP3 models. Different magnitudes of cooling occurred in all seasons except spring. The cooling over China during the LIA was largely attributed to changes in volcanic eruptions and land use, while the change in orbital parameters played a role on a seasonal scale. The precipitation over China during the LIA decreased for the annual mean and summer and autumn but slightly increased in winter and spring. Model–data comparisons indicate that the models reproduced the colder and drier climate of the LIA reasonably, although there are some differences in certain aspects.
Introduction
The last millennium is a key period that connects modern instrumental observations with proxy records. Investigating climate changes during this period is of importance for advancing our knowledge of the background of modern climate on multi-decadal and centennial timescales. Great efforts have been made on the last millennium climate by reconstructions (e.g. Cook et al., 2010; Juckes et al., 2007; Mann and Jones, 2003; Moberg et al., 2005) and simulations (e.g. Atwood et al., 2016; Bauer et al., 2003; Crowley, 2000; Osborn et al., 2006).
During the last millennium, two episodes, the ‘Medieval Climate Anomaly’ (MCA, ca. 950–1250 CE) and ‘Little Ice Age’ (LIA; ca. 1450–1850 CE), have drawn much attention in recent decades (e.g. Andres and Peltier, 2016; Goosse et al., 2006; Lee and Park, 2015; Masson-Delmotte et al., 2013). Between them, the LIA climate change is more widespread and robust (McGregor et al., 2015; Mann et al., 2009; PAGES 2k Consortium, 2013) and has produced profound impact on human society (Pei et al., 2013; Zhang et al., 2011). Although the LIA featured a global cold anomaly, the onset of cold conditions was asynchronous at the continental scale, with the Arctic, Europe, and Asia cooling earlier than North America and the Southern Hemisphere (PAGES 2k Consortium, 2013). The magnitude of LIA cooling also varied with region, especially between the Northern and Southern Hemispheres and between ocean and land (deMenocal et al., 2000; Fischer et al., 1998; Keigwin, 1996; Neukom et al., 2014; Orsi et al., 2012). Furthermore, hydroclimate changes during the LIA were more inhomogeneous as the sign of moisture and precipitation changes varied largely with regions in both reconstructions and simulations (e.g. Fu et al., 2016; Jones and Mann, 2004; Mayewski et al., 2004). This result indicates that there is a strong regionality to LIA climate changes.
China has long been a populous country with complex climatic features and is vulnerable to climate change (McMichael, 2012; Zhang et al., 2008). It is therefore important to understand the fact and cause of its climate change on varying timescales. A number of proxy records over China, including ice cores, tree rings, peat, lake cores, speleothems, and historical documents, have been applied to reconstruct the LIA climate (e.g. Chu et al., 2012; Tian et al., 2013; Tong et al., 1996; Wang et al., 2014; Zhang et al., 2008). In the meantime, a hierarchy of models with different complexities have been used to simulate the LIA climate over China and elucidate the underlying mechanisms (e.g. Liu et al., 2011; Man and Zhou, 2014; Man et al., 2012; Peng et al., 2009b; Xiao et al., 2012; Zhou et al., 2011). Those models have reproduced a cooling over China and a weakening of the East Asian summer monsoon during the LIA and highlighted the importance of external forcings (Jiang et al., 2015). However, both the magnitude of cooling and the magnitude and sign of precipitation changes varied in earlier individual simulations. For example, compared with the MCA, the simulated LIA summer precipitation over eastern China exhibited a ‘drought in north and flooding in south’ pattern in the FGOALS-gl Climate System Model (Man and Zhou, 2014) but was characterized by an in-phase decrease in the north and south in the ECHO-G model (Liu et al., 2011). Such model-dependent results stress the necessity of discussing the LIA climate from the perspective of multiple models. The last millennium climate simulations in the Paleoclimate Modeling Intercomparison Project Phase 3 (PMIP3) are conducted by state-of-the-art climate models, ranging from fully coupled atmosphere–ocean general circulation models (AOGCMs) to atmosphere–ocean–vegetation general circulation models (AOVGCMs). These simulations employ similar boundary conditions under the framework of PMIP3 protocol and have been widely used to address the regional and hemispheric climate (e.g. Coats et al., 2015a; Goosse et al., 2012; Shi et al., 2016).
Moreover, most previous model–data comparisons over China were restricted to the temperature evolutions during the last millennium between reconstructions and single model simulations (e.g. Liu et al., 2005, 2006b; Tan et al., 2009). Now, using the PMIP3 models and widespread proxy records, a comprehensive comparison of the spatial pattern of LIA climate over China between multi-proxy reconstructions and multi-model simulations can be performed.
Taken together, the PMIP3 climate simulations for the last millennium are employed in this study to analyze the LIA climate over China, especially for temperature and precipitation. We aim to identify (a) the temporal and spatial changes in the LIA climate, (b) causes of these changes, and (c) the extent to which the simulations are compatible with the reconstructions.
Data and method
All available models conducting the last millennium experiment under the PMIP3 framework were adopted in this study, except for the Model for Interdisciplinary Research on Climate Earth System Model (MIROC-ESM) because of its abnormal warming drift during the last millennium (Sueyoshi et al., 2013). In addition, the E2 version of the Goddard Institute for Space Studies Climate Model (GISS-E2-R-p121) displayed a cooling drift during the early centuries of the last millennium. Considering GISS-E2-R-p121 showed at least qualitatively consistent results with other models, this model was applied for the present analysis, as did by previous studies (Coats et al., 2015a, 2015b; Goosse et al., 2012). All simulations span 850–1850 CE, which is regarded as the last millennium by PMIP3/CMIP5 protocol. The boundary conditions were composed of time-varying external forcings of volcanic eruptions, atmospheric greenhouse gas (GHG) concentrations, orbital parameters, solar radiation, and land use (Schmidt et al., 2011). Descriptions of these models and boundary conditions are provided in Table 1, and the temporal evolution of the forcing datasets is depicted in Figure 1. More details can be found in Schmidt et al. (2011).
Basic information of the nine PMIP3 models and associated boundary conditions.
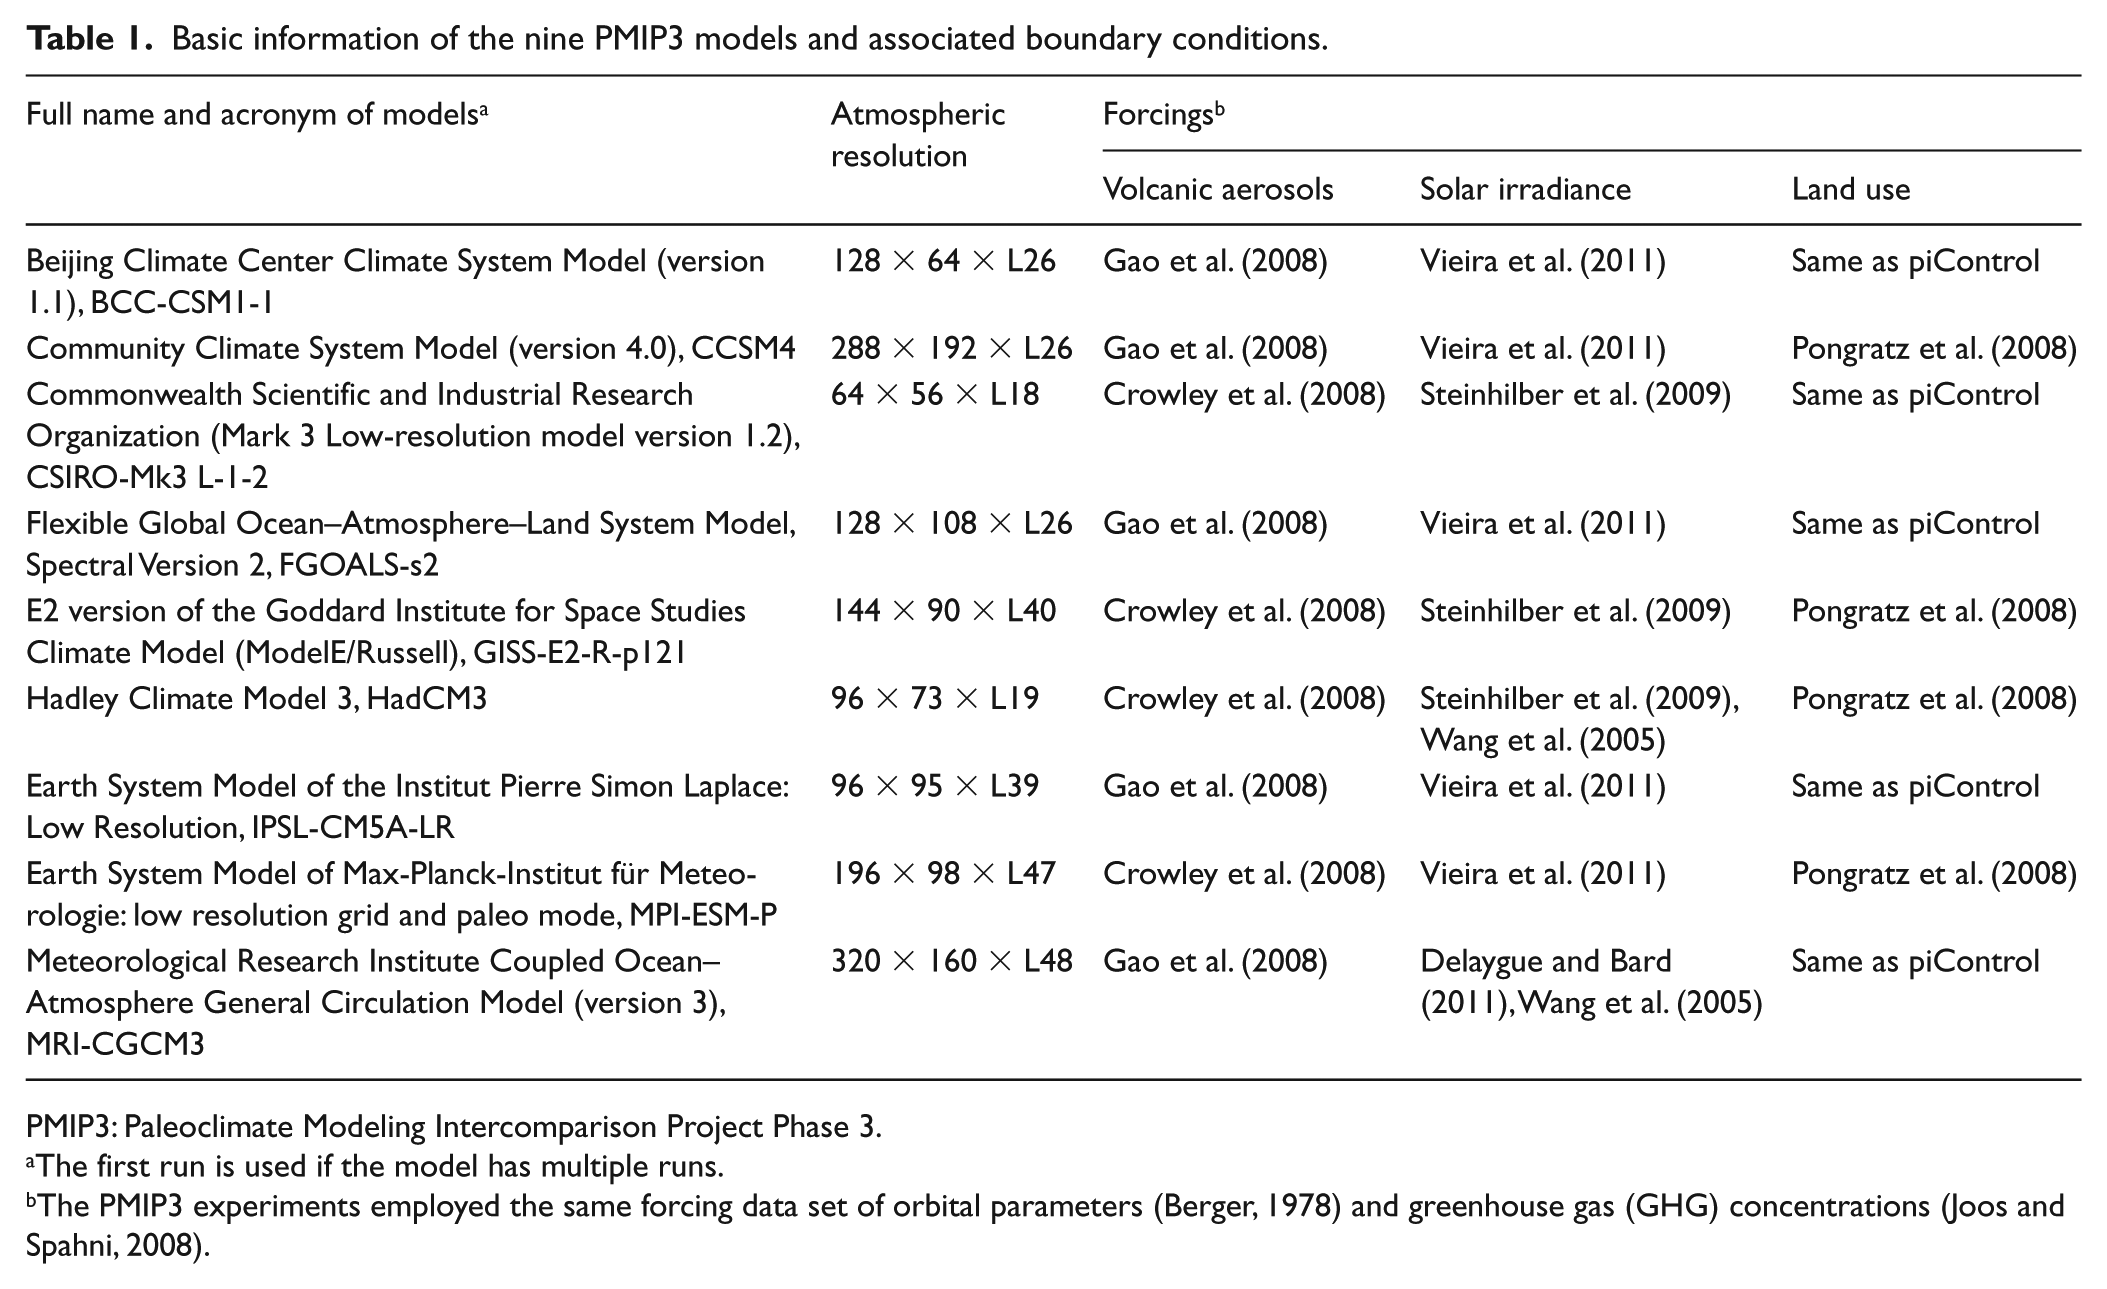
PMIP3: Paleoclimate Modeling Intercomparison Project Phase 3.
The first run is used if the model has multiple runs.
The PMIP3 experiments employed the same forcing data set of orbital parameters (Berger, 1978) and greenhouse gas (GHG) concentrations (Joos and Spahni, 2008).
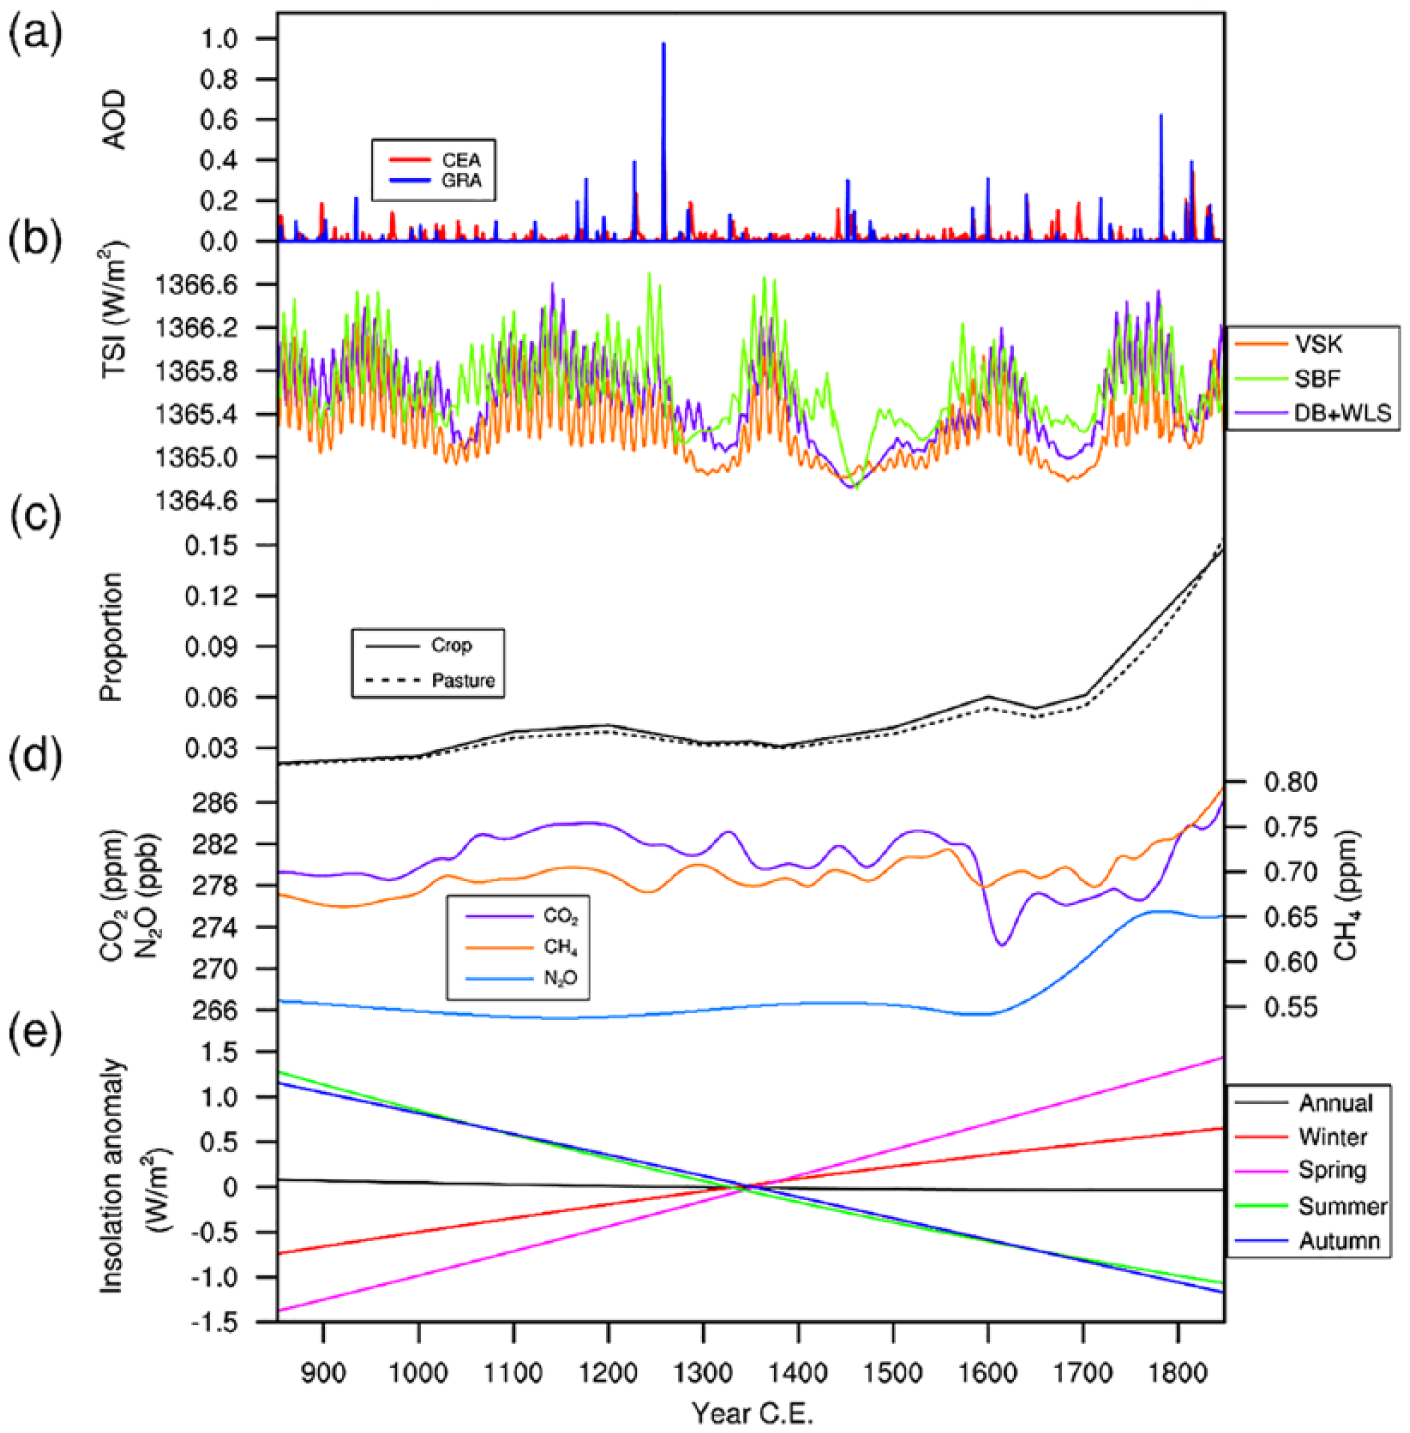
Temporal evolutions of external forcings. (a) Volcanic aerosol reconstructions from Crowley et al. (2008) (red, CEA) and Gao et al. (2008) (blue, GRA), represented by aerosol optical depth (AOD). (b) Total solar irradiance (TSI) reconstructions from Vieira et al. (2011) (orange, VSK), Steinhilber et al. (2009) (green, SBF), Delaygue and Bard (2011), and Wang et al. (2005) (purple, DB + WLS). (c) Proportion of total land area covered by crop (solid line) or pasture lands (dash line) over China. (d) Greenhouse gas concentration reconstructions from Joos and Spahni (2008), including CO2, CH4, and N2O. (e) Annual and seasonal insolation anomalies at the top of the atmosphere over China relative to 850–1850 CE caused by orbital parameters according to Berger (1978).
The PMIP3 simulations are feasible for addressing the LIA climate but are not appropriate for examining the relative contribution of individual forcings. For this reason, we further employed the ensemble simulations undertaken by the Community Earth System Model for the last millennium (CESM-LME), containing full forcing simulations with all external forcings and sensitive simulations with only one time-varying forcing. The CESM-LME is composed of 13 full forcing, 5 volcanic-only, 3 GHG-only, 3 orbital-only, 5 solar-only (only 4 available), and 3 land-use-only simulations, and the forcing datasets are identical to the datasets used in the PMIP3 climate simulations for the last millennium. More details can be found in Otto-Bliesner et al. (2016), and the data were downloaded directly from the Earth System Grid website (www.earthsystemgrid.org).
Reanalysis data used to evaluate the ability of the models in reproducing modern climatology over China during the period of 1979–2005 are taken from the ERA-Interim temperature data set of the European Center for Medium-Range Weather Forecasts (ECMWF) (Dee et al., 2011) and from the Precipitation Reconstruction Dataset over Land (PREC/L) of the National Oceanic and Atmospheric Administration (NOAA) (Chen et al., 2002). These data are referred to as observations in the text below for convenience. The corresponding model datasets are obtained from the historical experiment from 1979–2005.
Several time series of temperature over China for the last millennium that were reconstructed from lake cores, ice cores, speleothems, tree rings, peat, and historical documents (Ge et al., 2013; Shi et al., 2012; Wang et al., 2007; Yang et al., 2002) were applied for a temporal model–data comparison. Furthermore, reconstructions of LIA temperature and precipitation at 24 and 46 sites, respectively, over China were collected from peer-reviewed articles to compare with the simulated temperature and precipitation patterns during the LIA.
To maintain the uniformity of data, the model and observation data were interpolated to the same grid with a spatial horizontal resolution of 0.5° × 0.5° through a bilinear interpolation. For the statistical test, we used the Monte Carlo test, and the sampling number was set to 10,000.
Results
Evaluation of PMIP3 models
The ability of PMIP3 models to reproduce modern temperature and precipitation climatology concerns the credibility of the simulations for the LIA. Therefore, the spatial correlation coefficients (SCC), standard deviation, and centered root-mean-square error (CRMSE) of each historical experiment relative to observation were calculated based on 4205 grid points in mainland China. The Taylor diagram (Figure 2) indicates that the SCCs range from 0.88 to 0.98 (0.65–0.85), the normalized standard deviations range from 0.88 to 1.12 (0.78–1.81), and the normalized CRMSEs range from 0.20 to 0.47 (0.53–1.39) for annual temperature (precipitation). Note that all SCCs are statistically significant at the 95% confidence level, even for GISS-E2-R-p121, which displays a relatively poor skill, and thus the PMIP3 models simulate the modern climate reasonably well. In addition, climate models have better simulation abilities for temperature than precipitation, and the median of the nine models performs the best for nearly all aspects. As such, the median of the PMIP3 models is mainly analyzed in the following Sections.
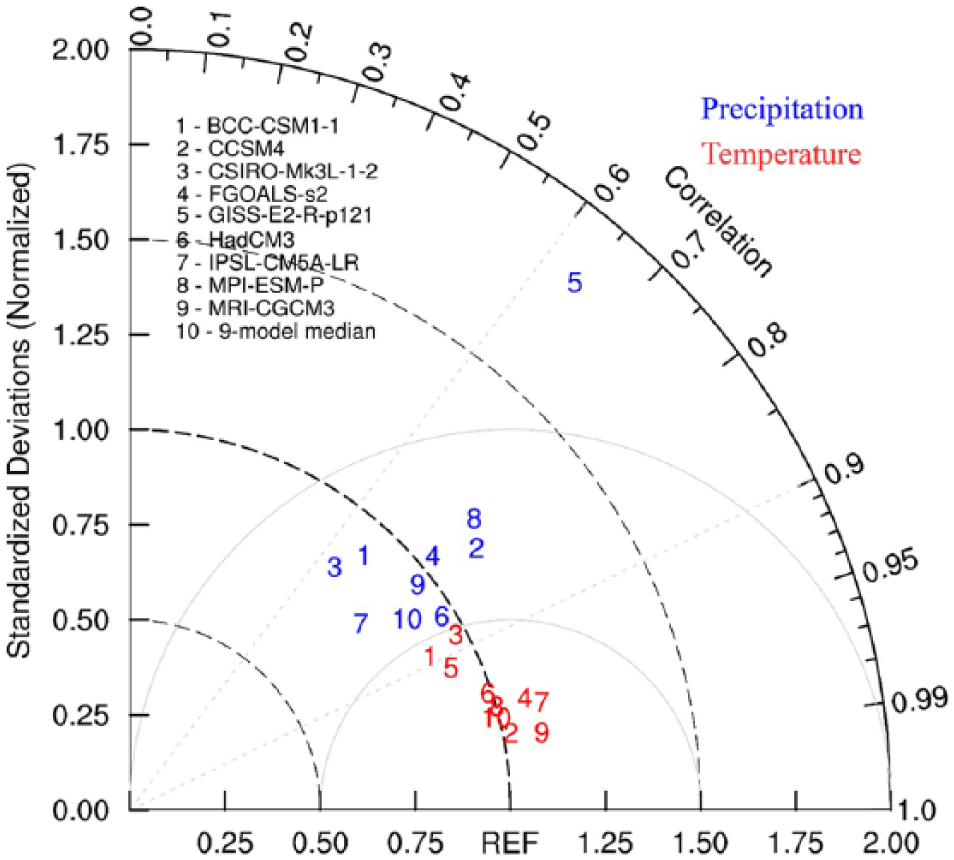
Taylor diagram (Taylor, 2001) displaying the normalized pattern statistics of climatological annual mean temperature (red) and precipitation (blue) over China between the historical experiments of nine models (together with their median) and observation during 1979–2005. The observation is treated as the reference (REF). The standard deviation and centered root-mean-square error are normalized by the REF. For every number on the Taylor diagram, its radial distance from the origin is the normalized standard deviation, and its radial distance from the REF is the normalized centered root-mean-square error. The correlation between the model and observation results is provided by the azimuthal position of the test field.
Surface temperature change
In response to the external forcings shown in Figure 1, the temperature evolution over China displayed a significant cooling tendency during the last millennium in the PMIP3 models and was characterized by the relatively warm MCA and cold LIA (Figure 3). During the LIA, there were several multi-decadal to centennial variations with sharp temperature drops of up to 0.4°C for the multi-model median even after it was multi-decadally smoothed. The variations subdivided the LIA into three cold episodes, which was in accordance with reconstructions (Qian and Zhu, 2002; Wang et al., 1998; Yang et al., 2003). Temperature evolutions in individual models were similar to the multi-model median but with somewhat different amplitudes. The spectral analysis indicates that there were three main periodicities in most models and the multi-model median (Supplementary Figure S1, available online). More specifically, all models displayed a quasi-60-year cycle, which may be related to the natural internal variability. Most models also showed quasi-100-year and quasi-200-year cycles, which are compatible with the Gleissberg (~88 years) and Suess (~210 years) solar cycles, implying an influence of solar radiation on these timescales.

Temporal evolutions of temperature anomalies over China during the last millennium relative to 850–1850 CE in the nine PMIP3 models and their median (black). The gray shading indicates the inter-model spread (one standard deviation) across individual models. The time series are smoothed using a 30-year moving average filter. The dashed vertical line represents the onset of the LIA.
Against the background of long-term cooling during the last millennium, we examined the spatial temperature changes over China during the LIA. Compared with the climate mean of the last millennium (which was considered as the reference period unless otherwise specified), the multi-model median showed a statistically significant cooling in annual temperature of −0.02 to −0.12°C over China (Figure 4a). The cooling was generally stronger at higher latitudes, with the strongest cooling in Northeast China, followed by North, East, and West China. Averaged over the entire country, the temperature significantly decreased by 0.07°C for the multi-model median. Compared with the mean state of 1850–2005 CE as derived from historical experiments undertaken by the same models, the LIA is 0.62°C cooler in the multi-model median.
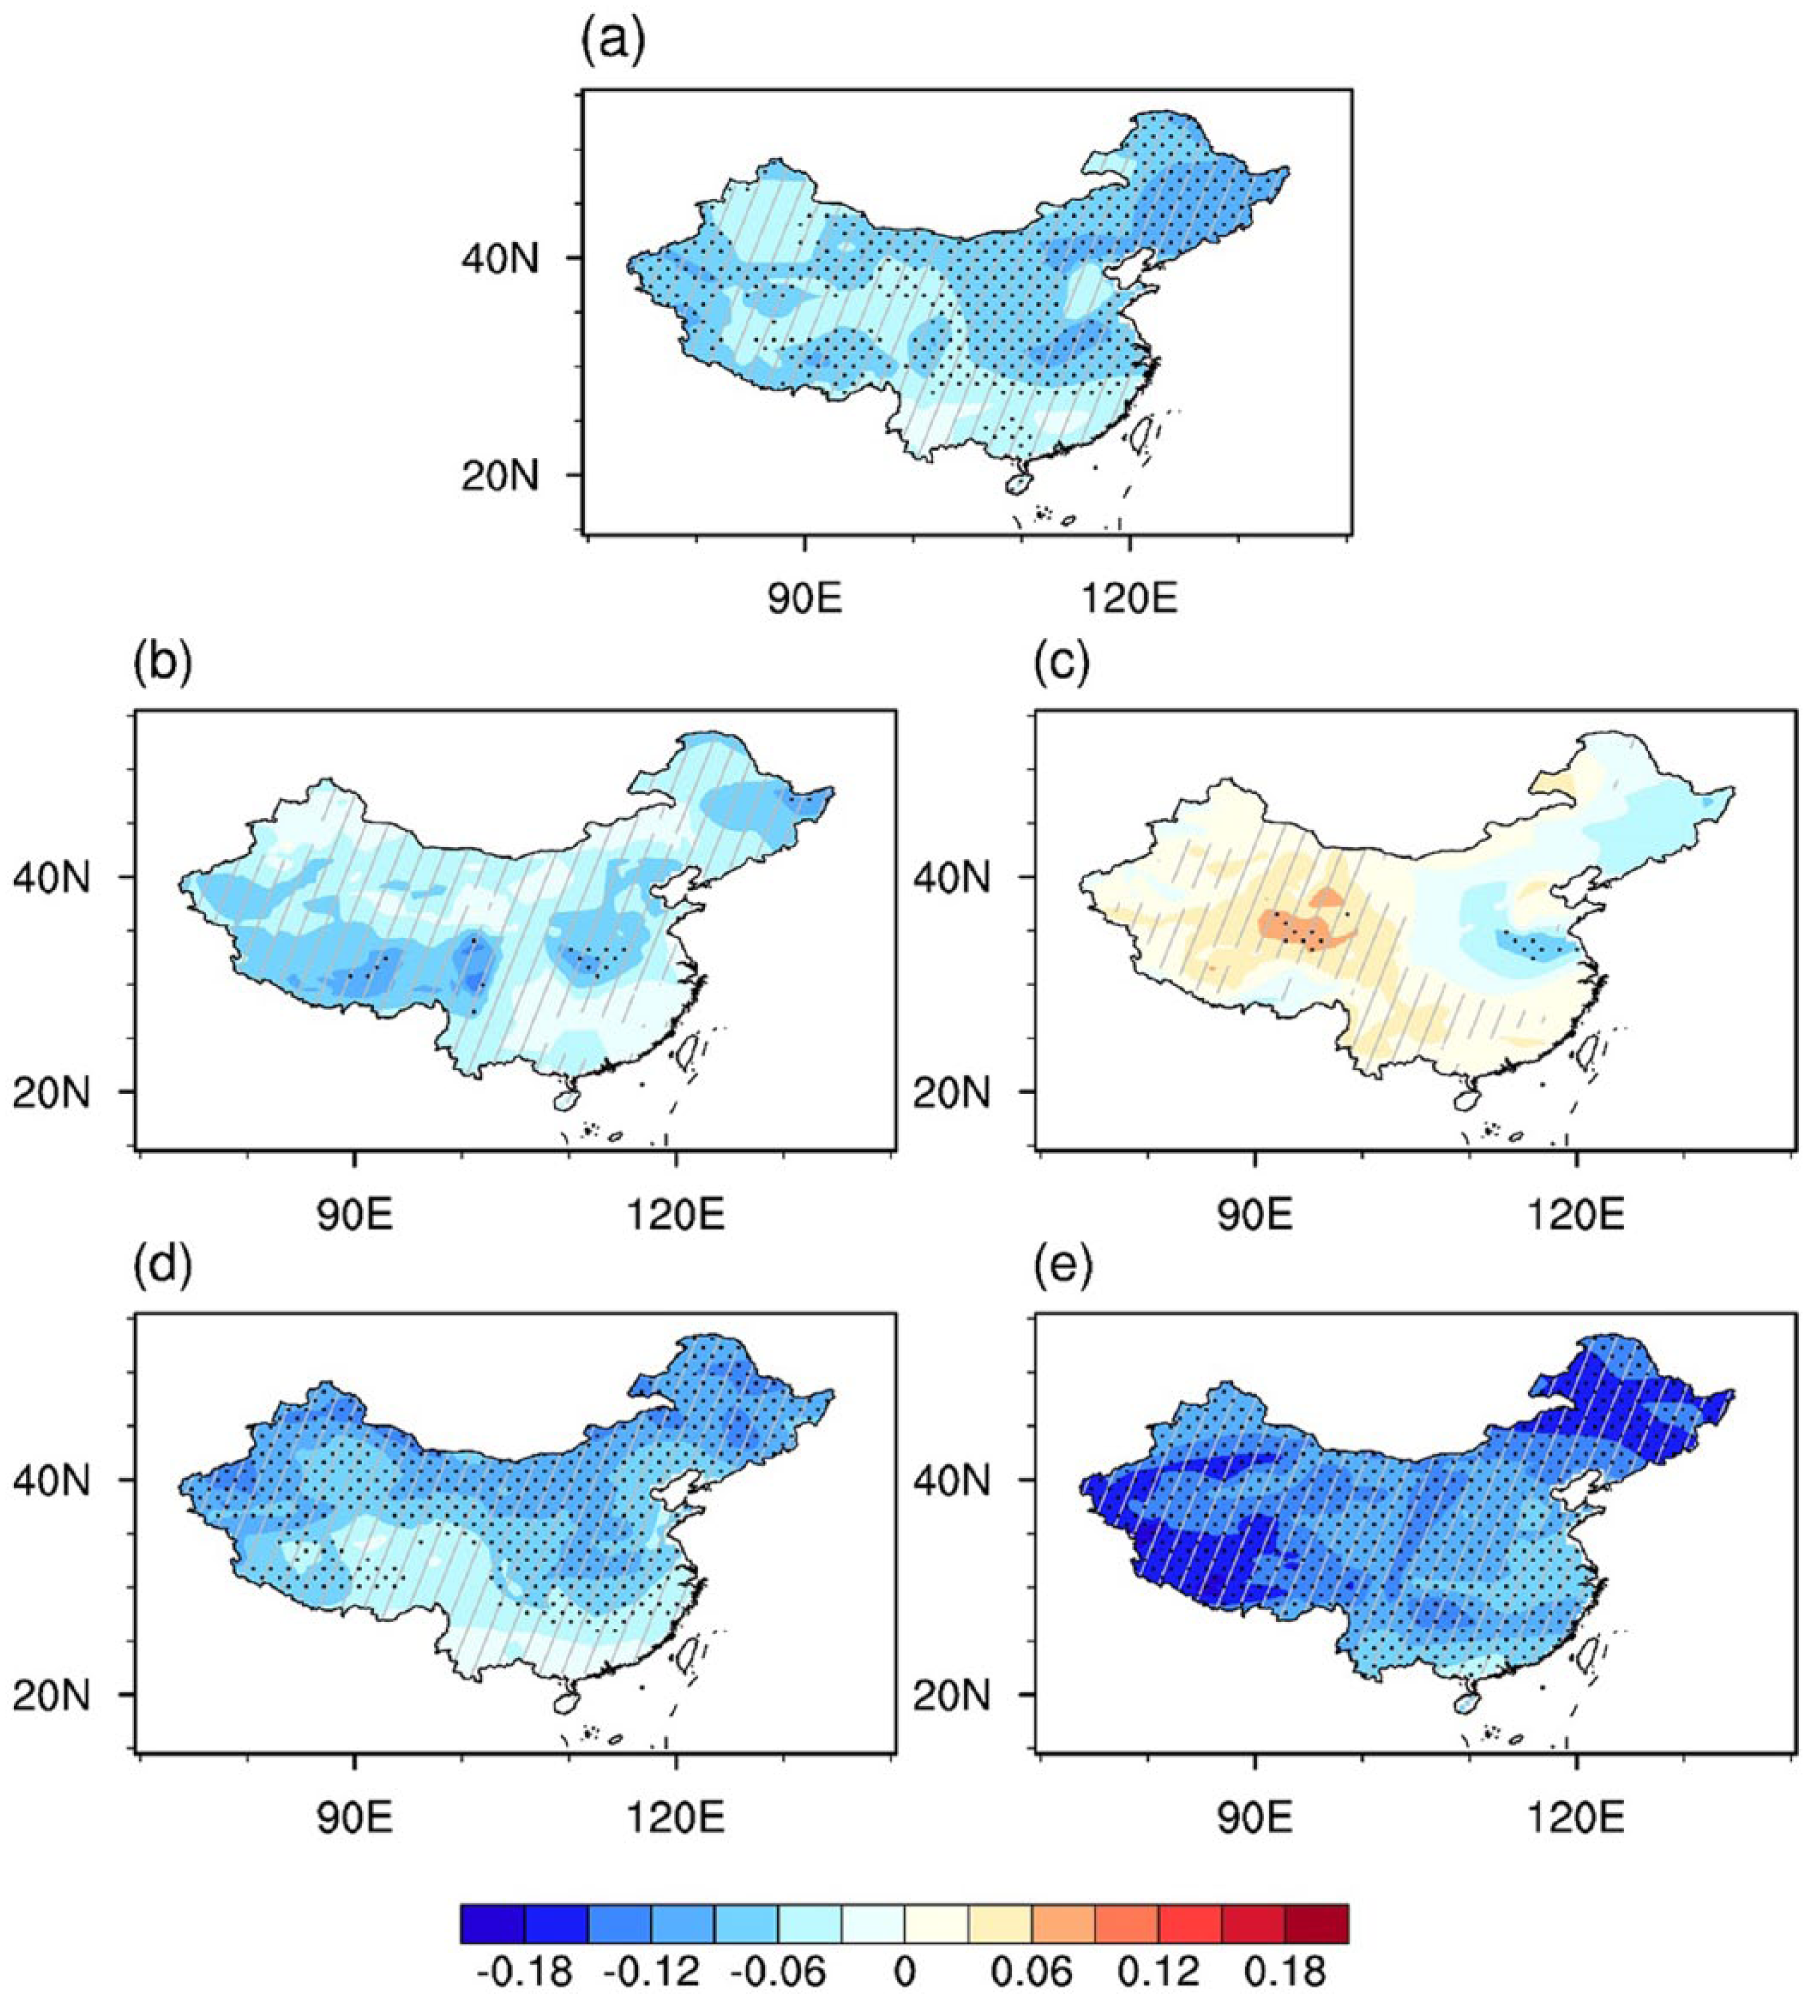
Annual and seasonal surface temperature anomalies (units: °C) over China during the LIA relative to 850–1850 CE as derived from the median of the nine PMIP3 models. The areas with gray oblique lines represent regions where at least six out of the nine models share the same sign of change. The dots indicate areas with significant anomalies at the 95% confidence level. (a) Annual. (b) Boreal winter. (c) Boreal spring. (d) Boreal summer. (e) Boreal autumn.
The LIA cooling was consistently simulated by individual models, with a range of −0.02°C (BCC-CSM1-1) to −0.14°C (GISS-E2-R-p121) (all significant at the 95% confidence level, Supplementary Figure S2, available online). The different magnitudes among the models could arise from the varying sensitivity to external forcings. The different forcing datasets used in the models also play a role. For example, only four models adopted time-varying land use change as an external forcing (Table 1), and their cooling magnitudes were generally larger than those in the other five models.
The LIA seasonal temperature declined over China in winter (December, January, and February), summer (June, July, and August), and autumn (September, October, and November) for the multi-model median, which was qualitatively consistent with the annual mean. In spring (March, April, and May), the temperature rose over Northwest, Southwest, and South China and declined in other regions (Figure 4b–e). For China as a whole, the temperature significantly decreased by 0.06, 0.08, and 0.13°C in winter, summer, and autumn, respectively, but slightly increased in spring. The individual models reproduced the cooling in winter, summer, and autumn but exhibited large scatters in spring (Supplementary Figure S2, available online).
Precipitation change
As shown in Figure 5a, the precipitation evolution over China during the last millennium displayed a significant decreasing trend in the multi-model median of PMIP3 models. Superimposed on this downtrend were several multi-decadal to centennial variations, and most of the troughs corresponded to large volcanic eruptions. With respect to individual models, the temporal evolution had a level of spread among models, which could be attributed to the following factors. First, CSIRO-Mk3L-1-2 exhibited a considerable variation and no correlation with other models. Moreover, it did not show a significant downtrend as most models did (Figure 5b). This could be related to the inadequacy of CSIRO-Mk3L-1-2 in reproducing the modern East Asian summer monsoon (Shi et al., 2018), which is a key system for precipitation over China. Second, GISS-E2-R-p121 showed a large downtrend, which was at least double the magnitude of the other models (Figure 5c) and might be linked to its cooling drift (Coats et al., 2015a). Third, the two volcanic eruption datasets used in the PMIP3 models provided different timing and magnitudes of eruptions (Figure 1a). This caused different variations between simulations using the datasets of Gao et al. (2008) and Crowley et al. (2008) (Figure 5d and e). The spectral analysis indicates that most models and the multi-model median showed a quasi-60-year cycle, and some models had an additional quasi-80-year cycle (Supplementary Figure S3, available online). These cycles implied a relationship with the natural internal variability, such as the Atlantic Multi-decadal Oscillation and Pacific Decadal Oscillation, which has been discussed in earlier studies (e.g. Peng, 2009a; Peng et al., 2015).
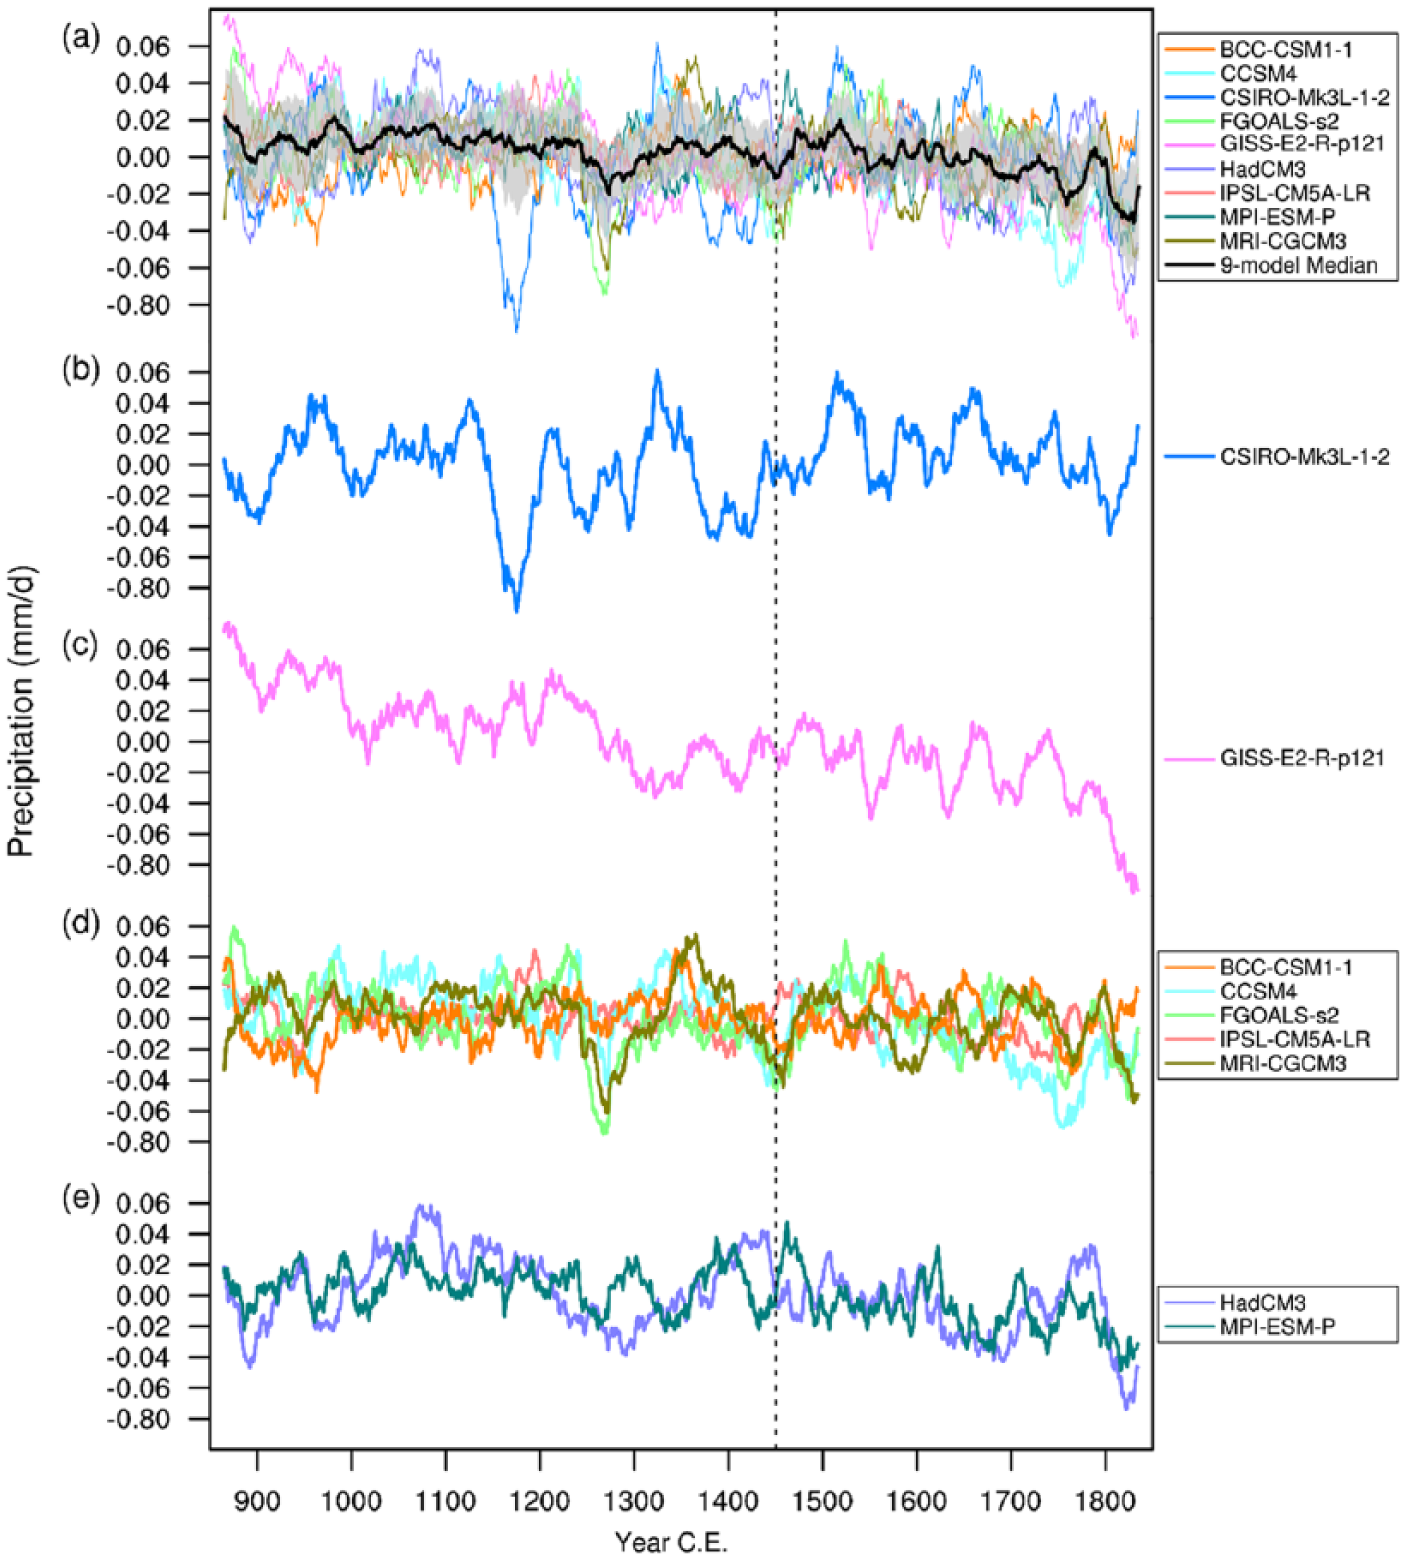
Temporal evolutions of precipitation anomalies over China during the last millennium relative to 850–1850 CE as derived from (a) the nine PMIP3 models (colored lines) and their median (black lines); (b) CSIRO-Mk3 L-1-2; (c) GISS-E2-R-p121; (d) BCC-CSM1-1, CCSM4, FGOALS-s2, IPSL-CM5A-LR, and MRI-CGCM3; and (e) HadCM3 and MPI-ESM-P. The gray shading in (a) indicates the inter-model spread (one standard deviation) across individual models. All time series are smoothed using a 30-year moving average filter. The vertical dashed line presents the onset of the LIA.
With regard to LIA precipitation changes over China, Figure 6a indicates that the LIA annual precipitation slightly decreased over most of China for the multi-model median, with a statistically significant decrease over North China, but there was also an excess in South and Northwest China. Averaged over the country, the LIA annual precipitation significantly decreased by less than 0.1 mm/d in the multi-model mean, and most models reproduced a deficit (Supplementary Figure S4, available online). Compared with the mean state of 1850–2005 CE as derived from historical experiments undertaken by the same models, the LIA annual precipitation over China showed no significant change in the multi-model median.

Same as Figure 4, but for precipitation (units: mm/d). (a) Annual. (b) Boreal winter. (c) Boreal spring. (d) Boreal summer. (e) Boreal autumn.
On a seasonal scale, the geographical distribution and sign of precipitation change differed from the annual mean. In winter and spring, the LIA precipitation varied slightly in the multi-model median (Figure 6b and c) and increased on average by less than 0.01 mm/d over the country (Supplementary Figure S4, available online). In summer and autumn, precipitation decreased over most of China, except for the wetter conditions in Central China in summer, and a statistically significant deficit occurred over North and Southwest China (Figure 6d and e). For China as a whole, precipitation decreased by approximately 0.02 mm/d in summer and autumn (Supplementary Figure S4, available online). With respect to individual models, most reproduced excessive precipitation in spring but deficits in summer and autumn. In winter, although there is a large inter-model spread and inconsistency in the sign, the precipitation changes were overall small for individual models (Supplementary Figure S4, available online).
Discussion
Causes of temperature change
In many studies, volcanic eruptions and solar activity have been revealed to play an important role in temperature change on continental to hemispheric scales during the last millennium, especially during the LIA (e.g. Crowley, 2000; Mann, 2007; Phipps et al., 2013; Schurer et al., 2013; Shindell et al., 2003). It is of significance to examine whether this applies to China. The CESM-LME were thus employed to evaluate the contributions of individual external forcings to temperature change over China. As shown in Figure 7f, the ensemble mean of CESM-LME full forcing simulations reproduced the cooling trend during the last millennium and the LIA cold episode, both of which are consistent with the median of the PMIP3 models (Figure 3). The temporal correlation coefficient of regionally averaged temperature anomaly is 0.85, statistically significant at the 95% confidence level, between the CESM-LME and the PMIP3 median. Spatially, the cold LIA and stronger cooling over Northeast, Northwest, and East China in the median of PMIP3 models (Figure 4a) were also demonstrated by the ensemble mean of CESM-LME full forcing simulations (Figure 8f), with a spatial correlation coefficient of 0.41 (significant at the 95% confidence level). Meanwhile, the seasonal temperature changes in the median PMIP3 models were also well reproduced by the ensemble mean of CESM-LME full forcing simulations (Figure 9 and Supplementary Figure S2, available online). This indicates that the outputs from the CESM-LME full forcing simulations broadly agreed on the temperature evolution over China during the last millennium and the spatial pattern of temperature change during the LIA as shown in the PMIP3 simulations. It is therefore reasonable to use the individual forcing simulations of CESM-LME to evaluate the contribution of each forcing.
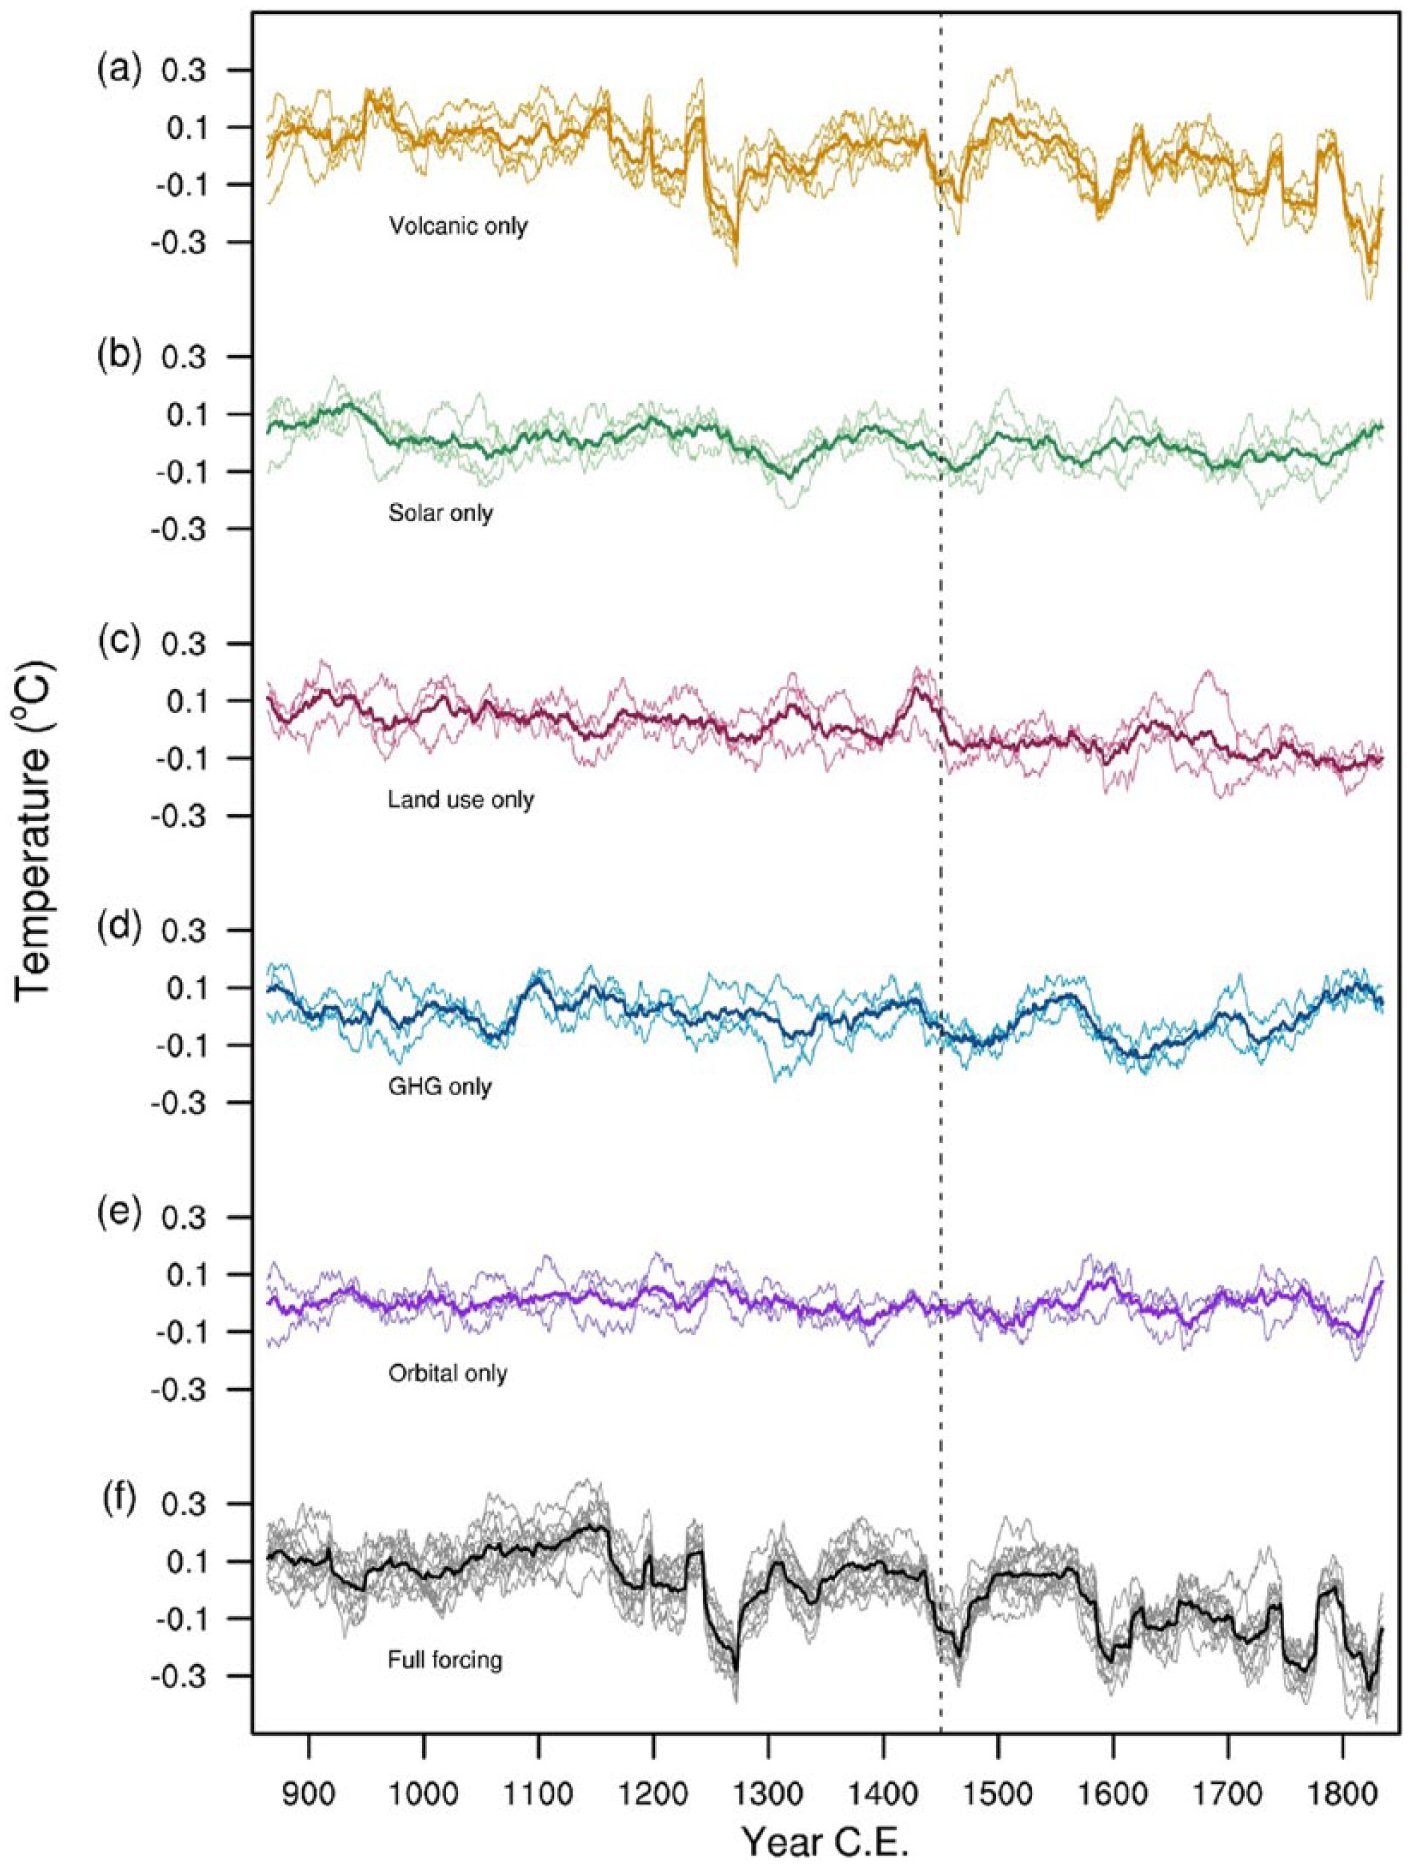
Temporal evolutions of temperature anomalies over China during the last millennium relative to 850–1850 CE in full and individual forcing CESM-LME simulations and their ensemble mean. The time series are smoothed using a 30-year moving average filter. The vertical dashed line represents the onset of the LIA. (a) Volcanic only. (b) Solar only. (c) Land use only. (d) GHG only. (e) Orbital only. (f) Full forcing.
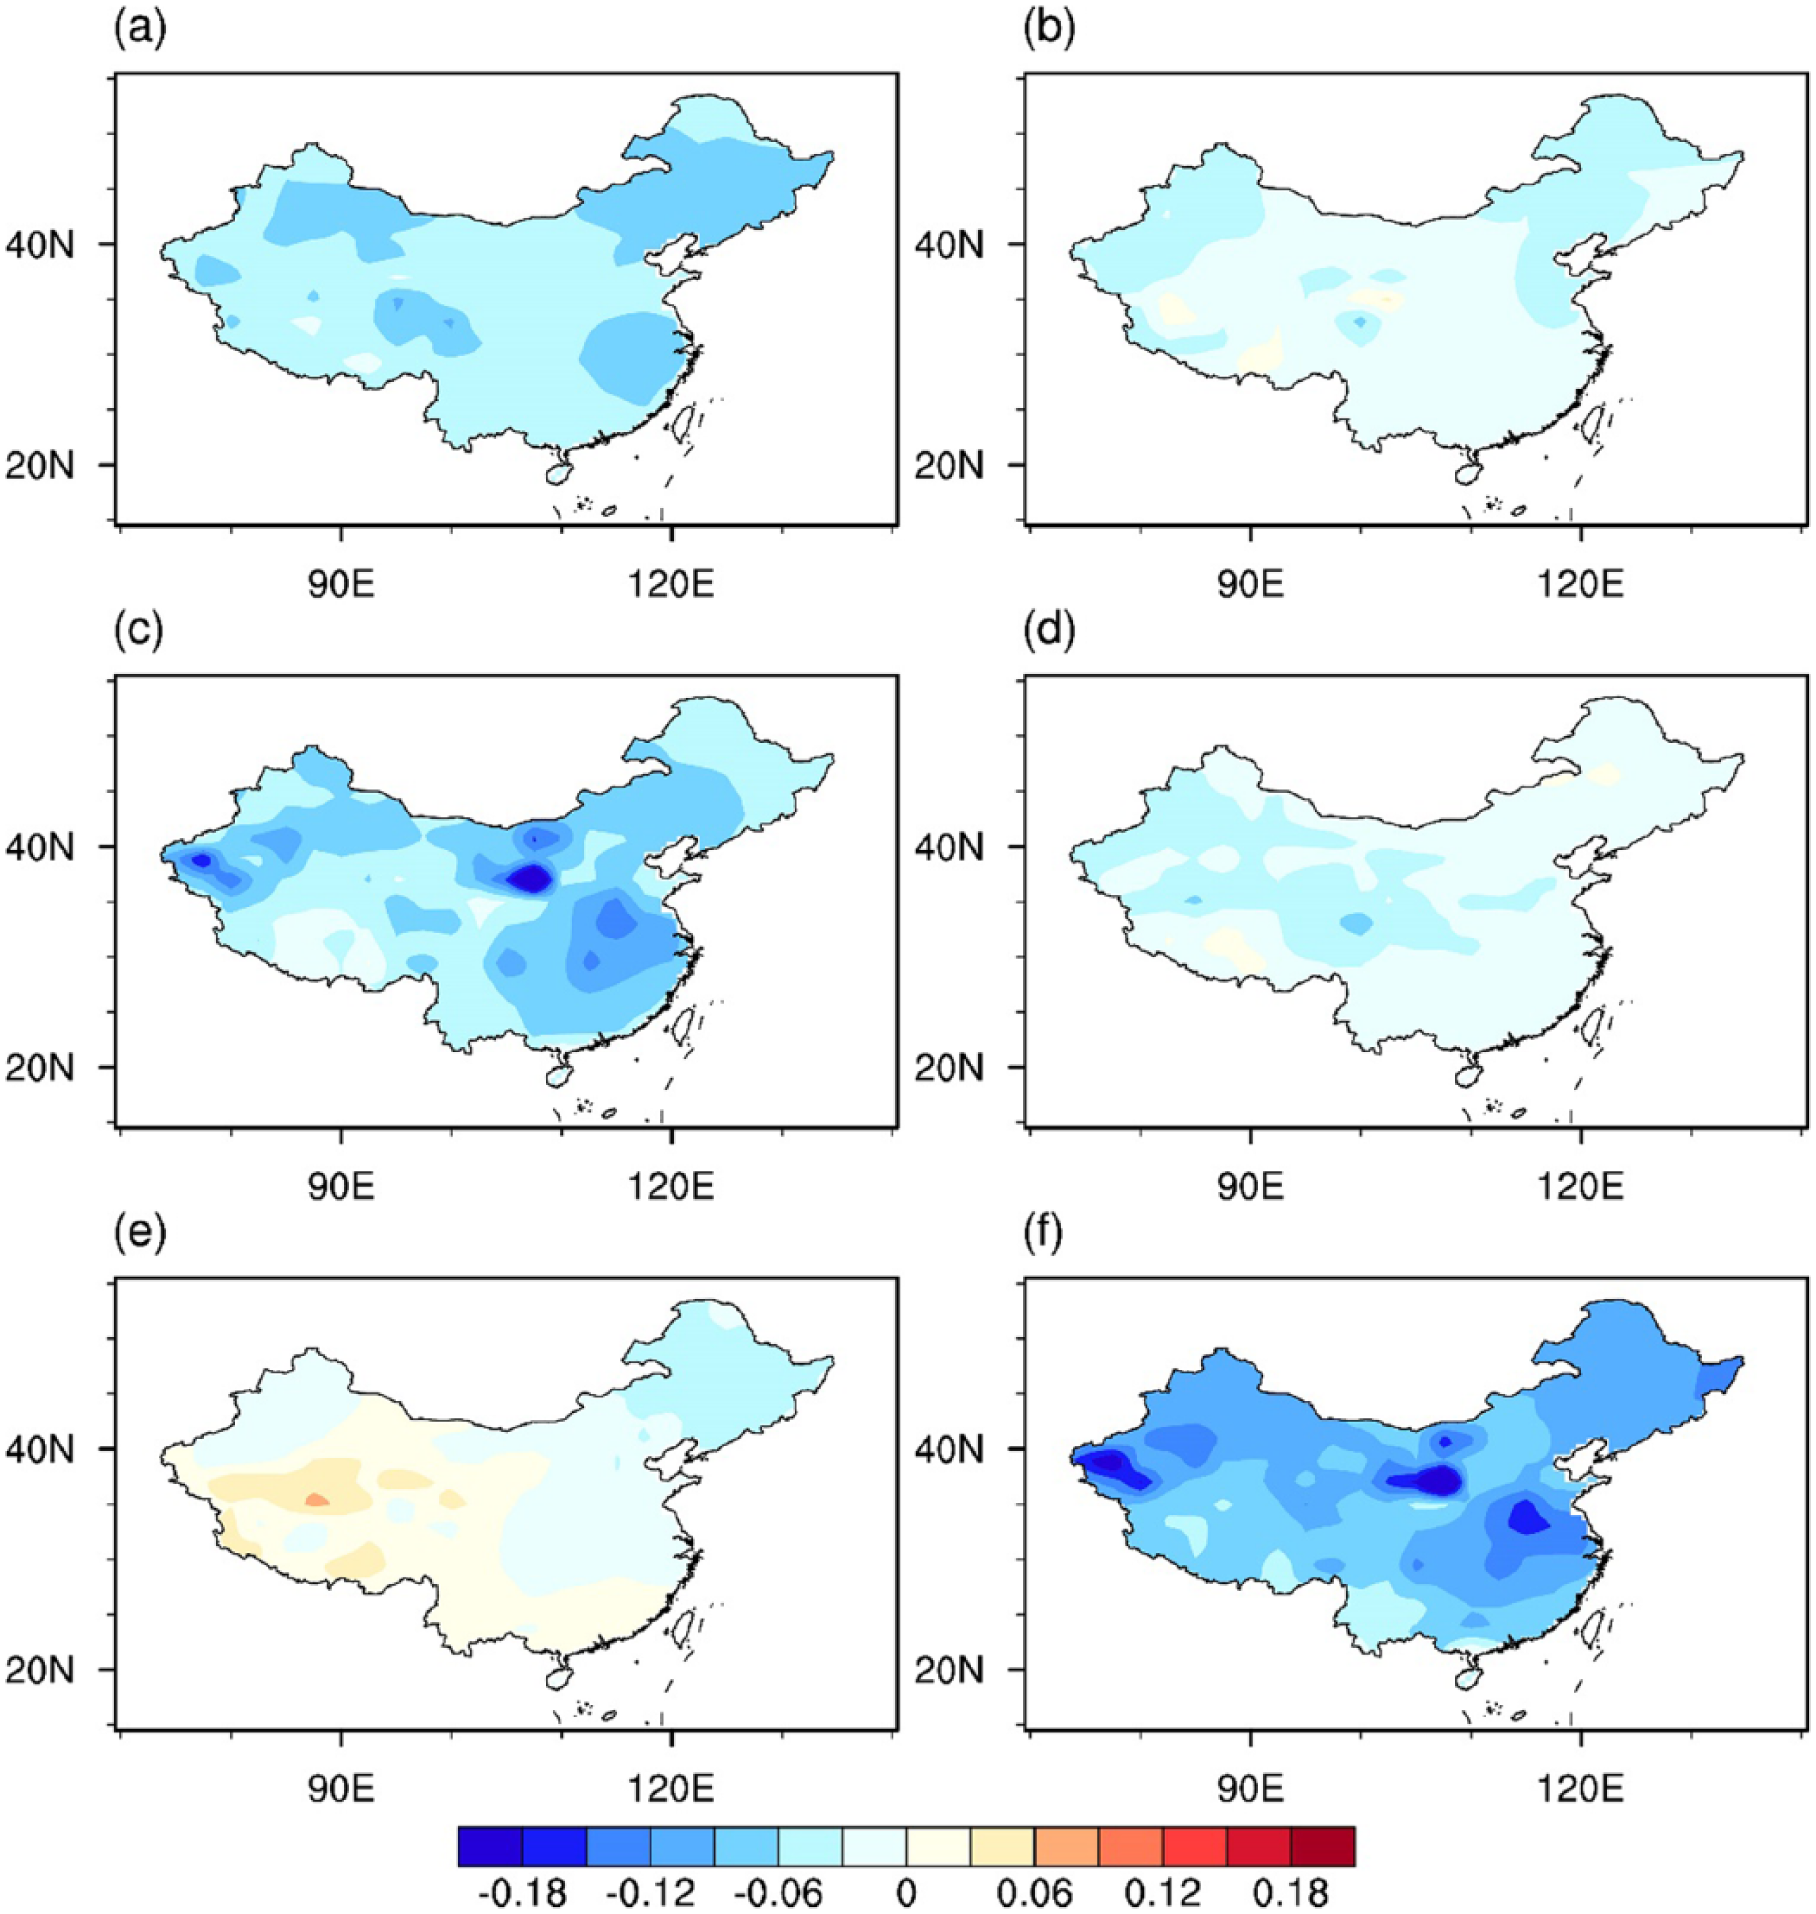
Annual temperature anomalies (units: °C) over China during the LIA relative to 850–1850 CE for the ensemble mean of full and individual forcing CESM-LME simulations. (a) Volcanic only. (b) Solar only. (c) Land use only. (d) GHG only. (e) Orbital only. (f) Full forcing.

Seasonal temperature anomalies over China during the LIA relative to 850–1850 CE in full and individual forcing CESM-LME simulations. The plus sign represents the ensemble mean temperature anomalies of each season.
During the last millennium, the cooling trend was different in CESM-LME individual forcing simulations (Figure 7a–e). It was −0.02°C/century for the ensemble mean of volcanic-only and land-use-only simulations and −0.01°C/century for solar-only and GHG-only simulations, with all statistically significant at the 95% confidence level, while there was no significant trend for orbital-only simulations. Among them, the strongest variations appeared in the volcanic-only simulations after large volcanic eruptions. These variations were highly consistent with the changes in full forcing simulations, including a large temperature drop around 1258 CE and three cold episodes during the LIA. The temperature in solar-only simulations exhibited clear variations in response to low solar irradiance during the solar minimums but with smaller amplitude than those of volcanic-only simulations. In the GHG-only simulations, the responses mainly appeared during the LIA. The multi-decadal to centennial variations in the land-use-only and orbital-only simulations were weak.
For the LIA, all simulations displayed cooling conditions over China, except for the orbital-only simulations (Figure 8a–e). The larger cooling over Northeast, Northwest, and East China in the ensemble mean of full forcing simulations was reproduced by the ensemble mean of land-use-only simulations. For China as a whole, cooling was greater in the ensemble mean of land-use-only (−0.06°C) and volcanic-only (−0.05°C) simulations, followed by solar-only (−0.03°C) and GHG-only (−0.02°C) simulations, and no significant cooling was shown in orbital-only simulations.
The above analysis demonstrates that changes in volcanic eruptions and land use played critical roles in the cooling over China, but in different ways. It has been well documented that large volcanic eruptions can inject a significant amount of volcanic ash and aerosol particulates into the upper atmosphere, scattering more solar radiation back to the space. However, volcanic eruptions and their climate effects are not uniform in time and intensity (Figures 1a and 7a). In general, frequent large volcanic eruptions during the LIA induced several remarkable cooling events, while few volcanic eruptions had little impact during the MCA. Spatially, because volcanic ash spreads with atmospheric circulation, volcanic eruptions often induce large-scale cooling. This is why the influence of large volcanic eruptions on the LIA is detectable on continental to hemispheric scales (Atwood et al., 2016; Crowley, 2000; Le et al., 2016). Here, the cooling effect of land use worked through turning the natural land cover (low albedo) into crops and pasture (high albedo), leading to more reflection of solar radiation. The persistent reclamation and grazing (Figure 1c) caused a more temporally consistent cooling effect (Figure 7c) compared with the discontinuous volcanic eruptions. Spatially, because of different developmental levels of agriculture and animal husbandry, land use and its climate effect exhibit local and dispersive characteristics. This explains the larger cooling in some regions over China in the land-use-only simulations and explains why this cooling effect on LIA climate was only found on a regional scale, such as Europe (Goosse et al., 2006). In fact, in the land-use-only CESM-LME simulations, larger cooling generally appeared over China, Europe, and North America (not shown), which were also the areas with substantial land use changes during the last millennium (Moberg, 2013).
On a seasonal scale, most individual forcing CESM-LME simulations displayed similar cooling among seasons, except for the orbital-only simulations (Figure 9). In the ensemble mean of orbital-only simulations, the LIA temperature over China increased by 0.02°C in winter and 0.07°C in spring but decreased by 0.01°C in summer and 0.11°C in autumn. This coincided with insolation changes caused by orbital parameters at the top of the atmosphere over China (Figure 1e), which increased by 0.46 W/m2 in winter and 0.94 W/m2 in spring but decreased by 0.56 W/m2 in summer and 0.65 W/m2 in autumn according to equations from Berger (1978). As such, the seasonal LIA temperature changes (Figure 8f) were a combination of seasonally varying temperature changes due to orbital parameters and relatively consistent seasonal cooling due to other external forcings. Specifically, in spring, temperature slightly changed in the ensemble mean of full forcing simulations because the warming induced by orbital parameters was comparable with the cooling induced by other external forcings. In other seasons, temperature significantly decreased because orbitally induced slight warming was less than the cooling induced by other forcings in winter and orbitally induced cooling coacted with other forcings in summer and autumn. Note that earlier simulations have also revealed the modulation of orbital parameters on seasonal temperature changes during the last millennium and the LIA in the Arctic (Crespin et al., 2013), Antarctica (Goosse et al., 2012), and land areas from 30°N to 70°N (Bauer and Claussen, 2006).
It should be kept in mind that the present attribution analysis was obtained from one model with specific reconstructed forcing datasets, which may vary with models and forcing data. For example, the amplitude of solar radiation variations used for PMIP3/CESM-LME simulations are an order of magnitude smaller than the one reconstructed by Shapiro et al. (2011). If this reconstruction is used as the external forcing, the influence of solar radiation on the LIA climate could be enhanced, although some studies demonstrated that simulated temperature evolutions forced by solar radiation variations with small amplitudes best coincide with reconstructions (Ammann et al., 2007; Schurer et al., 2014).
Causes of precipitation change
The precipitation deficits over eastern China and the southern Tibetan Plateau in summer and autumn accounted for most of the LIA annual precipitation changes, except for the excess over South China where precipitation significantly increased in spring (Figure 6). In summer, because of the different thermal response to LIA forcings between land and ocean, LIA cooling over the East Asian mainland was stronger than in the western Pacific, and thus the thermodynamic contrasts and sea level pressure gradients between the land and ocean decreased (Figure 10a and b). Accordingly, the southerly winds weakened, implying the weakening of the Asian summer monsoon. This agreed with the simulations from the MPI Earth System Model (Man et al., 2012) and FGOALS-gl Climate System Model (Man and Zhou, 2014), and with the reconstructions from lake sediments (Ji et al., 2005) and stalagmite records (Zhang et al., 2008; Zhao et al. 2015). Therefore, less warm and wet air from the ocean flowed into China, and thus less precipitation occurred over China. In autumn, the sea level pressure and wind change patterns resembled those of summer (Figure 10c and d), explaining similar changes in precipitation between the seasons. In winter and spring, temperature change was smaller in both the East Asian mainland and western Pacific. Therefore, land–ocean thermal contrast was little varied, causing less change in the atmospheric circulation and hence in precipitation (not shown).

The difference between LIA and last millennium in surface air temperature (units: °C) during (a) summer and (c) autumn and in sea level pressure (units: hPa; shading) and wind anomalies at 850 hPa (units: m/s; vectors) during (b) summer and (d) autumn, as derived from the median of the nine PMIP3 models. The dots indicate the areas with significant anomalies at the 95% confidence level for the surface air temperature and sea level pressure, and only the statistically significant winds are drawn. In panels (b) and (d), regions with an elevation above 1500 m are left blank.
Model–data comparison
Figure 11 shows the time series of temperature averaged over China during the last millennium from the median of the PMIP3 models and four multi-proxy reconstructions. The simulation agreed well with the reconstructions in reproducing the long-term temperature change and the cold LIA. First, the correlation coefficients between the simulation and the reconstructions of Yang et al. (2002), Wang et al. (2007), Shi et al. (2012), and Ge et al. (2013) were 0.49, 0.24, 0.40, and 0.26, respectively, all of which were statistically significant at the 95% confidence level. Second, the simulation matched well with data in the cooling trend, with a level of −0.03°C/century in the simulation, Wang et al. (2007), and Shi et al. (2012), and −0.05°C/century in Ge et al. (2013). Third, the temperature range between the warmest and coldest decades was comparable between the simulation and reconstructions, with a level of 0.6°C in the simulation and Wang et al. (2007), 0.4°C in Shi et al. (2012), and 0.8°C in Ge et al. (2013), respectively. By contrast, on the multi-decadal to centennial scale, there were model–data discrepancies in temperature variations in response to large volcanic eruptions, where the most pronounced difference occurs during the 13th century. Such discrepancy may arise from the dating bias and low spatial and temporal resolutions in the multi-proxy reconstructions (Ge et al. 2013; Jones et al., 2009). Another reason may lie in the inappropriate representation of volcanic eruptions in the simulations. To be specific, the complex nonlinear aerosol microphysics has not been fully understood, hence the parameterization scheme and processes used for characterizing large volcanic eruptions may be oversimplified in models (Schurer et al., 2013; Stoffel et al., 2015; Timmreck et al., 2009).

Comparisons of reconstructed (colored lines) and the multi-model median (black line) temperature anomaly series over China relative to the last millennium. The gray shading indicates the inter-model spread (one standard deviation). The time series are smoothed using a 30-year moving average filter. Reconstructions are named by author’s family names and published years. The right-hand Y-axis is for Yang et al. (2002), and the left-hand Y-axis is for the model results and other reconstructions. The vertical dashed line represents the onset of the LIA.
Regarding the LIA mean state by taking China as a whole, the simulated cooling averaged −0.07°C, which was comparable with proxy-inferred cooling of −0.06°C in Shi et al. (2012) and −0.08°C in Wang et al. (2007) but weaker than −0.14°C in Ge et al. (2013). Regionally, 24 site-based records of the mean temperature change were collected in the present work (Supplementary Table S1, available online) and indicated consistently colder conditions during the LIA (Supplementary Figure S5a), which were in agreement with widespread cooling in the simulation (Figure 4a).
For precipitation, according to 34 records in Chen et al. (2015) and 12 records we further collected (Supplementary Table S1, available online), there was a tripole pattern of LIA precipitation change, with an excess in Northwest China, a deficit in North and Central China, and an excess in East and South China (Supplementary Figure S5b, available online). This distribution was further supported by stalagmite records and historical documents in North China (Tan et al., 2011) and by historical documents in Jiang-Huai and Jiang-nan Area (Zheng et al., 2006). In general, the simulation qualitatively resembled the reconstructions over most of China, with an exception over East and Southwest China.
Quantitatively, two reconstructions over the northeastern Tibetan Plateau indicated a deficit of 0.02 mm/d (Liu et al., 2006a) and 0.03 mm/d (Yang et al., 2014), while it was little changed in the reconstruction of Shao et al. (2006) and in the present simulation. Discrepancies also occurred over Jiuxian Cave (33.57°N 109.10°E), where an excess of 0.17 mm/d in the reconstruction (He et al., 2003) disagreed with a normal state in the simulation, and over Ngamring Tso Lake (29.30°N 87.20°E), where a reconstructed excess of 0.70 mm/d in summer (Conroy et al., 2017) was opposite to a deficit of 0.08 mm/d in the simulation. On the whole, the magnitude of precipitation changes in the simulation was smaller than that in the reconstruction.
The model–data disagreement in precipitation could arise from both reconstructions and simulations. On the reconstruction side, there are limitations linked to environmental noise, unstable proxy–instrumental relationship, and different statistical methods (Phipps et al., 2013; Wahl and Smerdon, 2012). On the modeling side, there are three potential reasons. First, although more than six out of the nine PMIP3 models agreed on the annual precipitation changes over most of China, there was still uncertainty across simulations in Northwest and South China (Figure 6a). Second, global models perform well on a large scale (Fernández-Donado et al., 2013) but have limitations on a regional scale. This is particularly true over the complex topography of the Tibetan Plateau (Jiang et al., 2016; Su et al., 2013). Third, large volcanic eruptions were related to the precipitation deficit over eastern China (Peng et al., 2010; Shen et al., 2007) but may be inappropriately represented in models as mentioned above. Thus, more work needs to be carried out to enrich proxy-based reconstructions and improve the modeling capability for a better understanding of the LIA climate over China.
Conclusion
This study examined the LIA climate over China based on simulations from the last millennium experiment undertaken by nine PMIP3 models and the CESM-LME experiment. Furthermore, we compared the PMIP3 simulations with available proxy-based reconstructions of the LIA temperature and precipitation changes over China. The main conclusions are as follows.
Temperature averaged over China generally decreased over time during the last millennium and featured three cold episodes during the LIA. Relative to the last millennium climatology, the LIA temperature decreased by an average of 0.07°C over the country for the multi-model median, with greater cooling in higher latitudes. Except for spring, seasonal temperature exhibited different magnitudes of decrease. The cooling trend over the last millennium and the LIA cooling over China were mainly caused by the changes in volcanic eruptions and land use, while orbital parameters modulated seasonal temperature changes.
Precipitation averaged over China decreased over time throughout the last millennium. During the LIA, annual precipitation slightly decreased, while seasonal precipitation was characterized by a slight excess in winter and spring but showed a deficit in summer and autumn. The deficient precipitation in summer and autumn accounted for most of the annual deficit and was mainly caused by atmospheric circulation adjustments due to land–ocean thermal contrast changes.
The simulated evolution of temperature averaged over China during the last millennium generally agreed with the reconstructions, although disagreements occurred after large volcanic eruptions. The simulated cold and dry LIA climate was qualitatively consistent with reconstructions, although there were differences in some regions.
Supplemental Material
Supplementary_material – Supplemental material for A multi-model analysis of ‘Little Ice Age’ climate over China
Supplemental material, Supplementary_material for A multi-model analysis of ‘Little Ice Age’ climate over China by Xuecheng Zhou, Dabang Jiang and Xianmei Lang in The Holocene
Footnotes
Acknowledgements
We sincerely thank the two anonymous reviewers for their insightful comments and suggestions to improve this manuscript. We also thank Xinyu Wen and Xuemei Shao for providing information on proxy data and the climate modeling groups participating in the CMIP5/PMIP3 for producing and sharing their model outputs.
Funding
This research was supported by the National Basic Research Program of China (2017YFA0603302) and the National Natural Science Foundation of China (41421004 and 41625018).
Supplemental material
Supplemental material for this article is available online.

References
Supplementary Material
Please find the following supplemental material available below.
For Open Access articles published under a Creative Commons License, all supplemental material carries the same license as the article it is associated with.
For non-Open Access articles published, all supplemental material carries a non-exclusive license, and permission requests for re-use of supplemental material or any part of supplemental material shall be sent directly to the copyright owner as specified in the copyright notice associated with the article.
