



Abstract
This paper explores long-term trends in human population and vegetation change in the Levant from the early to the late Holocene in order to assess when and how human impact has shaped the region’s landscapes over the millennia. To do so, we employed multiple proxies and compared archaeological, pollen and palaeoclimate data within a multi-scalar approach in order to assess how Holocene landscape dynamics change at different geographical scales. We based our analysis on 14 fossil pollen sequences and applied a hierarchical agglomerative clustering and community classification in order to define groups of vegetation types (e.g. grassland, wetland, woodland, etc.). Human impact on the landscape has been assessed by the analysis of pollen indicator groups. Archaeological settlement data and Summed Probability Distribution (SPD) of radiocarbon dates have been used to reconstruct long-term demographic trends. In this study, for the first time, the evolution of the human population is estimated statistically and compared with environmental proxies for assessing the interplay of biotic and abiotic factors in shaping the Holocene landscapes in the Levant.
Introduction
The Levant represents an excellent case study for investigating the impact of anthropogenic activity on landscape transformation and land-use change throughout the Holocene. This area, which saw the earliest onset of agriculture and a complex economy, the emergence of urban systems and their collapse, the rise and fall of regional kingdoms, and the domination by vast empires over the region, is a mosaic of different cultural and environmental landscapes (Asouti et al., 2015; Enzel and Bar-Yosef, 2017; Fall et al., 2018; Finkelstein, 1995, 2013; Finlayson and Warren, 2010; Gophna and Portugali, 1988; Greenberg, 2002; Rosen, 2007; Savage et al., 2007). These landscapes are linked in certain ways but ultimately can be shown to have followed varied socio-ecological trajectories (Bar-Yosef and Belfer-Cohen, 2002; Cordova, 2007; Issar and Zohar, 2004; Kaniewski et al., 2017; Langgut et al., 2015; Lu et al., 2017; Philip, 2011; Porter, 2016; Rambeau, 2010; Roberts et al., 2018; Rosen, 2007; Rosen and Rosen, 2017). Recent studies have shown that population size substantially increased at the beginning of the Holocene with the introduction of farming economies and ameliorated climatic conditions, while population levels were lower when hunter-gatherers were still active in the Levant (cf. Borrell et al. 2015; Goring-Morris and Belfer-Cohen, 2010; Maher et al., 2011; Roberts et al., 2018). A higher rate of population growth, characterised by patterns of booms and busts, occurred with the rise of the earliest urban societies in the Bronze Age and peaked in the late Holocene with the establishment of Iron Age territorial kingdoms and the rule over the region by vast empires (e.g. Assyrian, Persian, Babylonian, Roman, etc.; cf. Bar, 2004; Falconer and Savage, 2009; Finkelstein, 1996, 1998; Greenberg, 2017). The regional archaeological records reflect these processes and events, demonstrating sharp settlement fluctuations and episodes of destruction. In the late Holocene (from 4.2 ka cal. yr BP onward), the thriving of population, often nucleated in large urban centres demanding agricultural surplus from the surrounding intensively farmed rural hinterland, led to heavy anthropogenised landscapes (Finkelstein and Langgut, 2018; Neumann et al., 2007).
In this perspective, scholars have developed a research agenda addressing how population growth contributed to transforming the environment from nature-dominated to culturally modified by making use of pollen-based reconstruction of Holocene vegetation change (see Butlin and Roberts, 1995; Hajar et al., 2010; Kaniewski et al., 2013; Langgut et al., 2013, 2014, 2015, 2016; Roberts et al., 2011, 2018). Although human activity could have altered the local landscape via land management practices such as agriculture, grazing and burning (Roberts et al., 2011), pollen data suggest that early Holocene (11.7–8.3 ka cal. yr BP) regional composition of woodland and landscape openness in the Levant were mainly linked to natural drivers (Cheddadi and Khater, 2016; Djamali et al., 2010; Litt et al., 2012; Van Zeist and Bottema, 1991). Instead, a strong human impact on vegetation starts being more evident from the Chalcolithic and Bronze Age onwards and peaked in the Roman and Byzantine periods (see Hajar et al., 2010; Izdebski et al., 2016b; Langgut et al. 2013, 2016; Schiebel and Litt, 2018; Schwab et al., 2004). Overall, the Holocene vegetation changes in the Levant are to be interpreted as the results of multiple factors interplaying with each other such as climate events, ecological dynamics and anthropogenic impacts (cf. Kaniewski et al., 2008; Roberts et al., 2011; Rosen, 2007). Likewise, episodes of population increase punctuated by periods of stagnation and decrease could be related to multiple causes not necessarily mutually exclusive such as climate change, migrations, warfare, exceeding carrying capacity of the land, environmental disasters and so on (Leroy, 2006; Leroy et al., 2010; Rosen, 2007).
With these premises in mind, estimating Holocene landscape dynamics and population fluctuations over the longue durée and assessing their relationships is pivotal for how we understand cultural and environmental change. Most studies concerning human impact on the landscape during the Holocene in the Levant have used a limited corpus of archaeological evidence or have focused on assessing human and environmental responses to one or more major rapid climate changes (e.g. the so-called 9.4 ka, 8.2 ka, 4.2 ka and 3.2 ka cal. yr BP events) and within well-defined cultural periods. In this work, we will draw upon a large corpus of archaeological data (in the form of archaeological settlement data and radiocarbon dates) and pollen records available in the Levant and assess how the impact of anthropogenic and natural factors on the landscape varies significantly by region and depends, in part, on the long-term socio-ecological dynamics prevailing in different areas from the early to the late Holocene (ca. 11,700–500 cal. yr BP).
The advantage of this multi-proxy approach is that the divergences and convergences among the patterns defined by each archaeological and environmental proxy will provide powerful insights and a wider range of explanations in describing demographic and vegetation change both throughout the Holocene time span as a whole and in particular sub-periods. In addition, we will use a multi-scalar approach to detect specific patterns on sub-regional scales (North Levant, Transjordan, Cisjordan) and to tackle possible misunderstandings derived from analysing data just on a single scale of analysis. Furthermore, we compare the pollen and archaeological data with palaeoclimate records in order to assess the relative impact of climate and human population size on the Holocene vegetation composition in the Levant (Izdebski et al., 2016a).
Geographical setting and materials
The study area
The portion of the Levant examined here covers around 65,000 sq. km, encompassing present-day Lebanon, Israel, the West Bank and part of western Jordan and south-western Syria (Figure 1). This region can be subdivided into four geographical units: Lower North Levant, Cisjordan highlands (i.e. West Bank) and lowlands, and Transjordan (Figure 1). The spatial coverage of the present study area has been selected (1) according to the regions where a sufficiently high intensity of archaeological excavations and surveys have been conducted and (2) because of the need to provide a coherent framework both spatially and chronologically for analysing comparatively archaeological data and pollen records.

Map showing the distribution of (a) sites with radiocarbon dates and (b) archaeological sites, pollen records and palaeoclimate proxies.
The area under study shows a varied topography that moving from west to east includes a landscape of coastlands and plains, the mountain ranges of Lebanon and Anti-Lebanon in the north, the Cisjordan highlands in the south, and the Syrian and Transjordan deserts to the east of the Syro-African Rift valley (Suriano, 2013: 14–20). The altitudinal gradient ranging from the highest peak of the Qurnat as Sawda’ (3088 m above mean sea level) in Lebanon to the lowest point in the Dead Sea Rift (413 m below mean seal level) results in marked differences in terms of climate and vegetation composition (Danin, 1988; Zohary, 1962, 1973). Average annual rainfall shows a latitudinal gradient with values exceeding 1000 mm in the northern mountain chains of Lebanon to approximately 100 mm at the shores of the Dead Sea (Cheddadi and Khater, 2016: 147–148; Ziv et al., 2006). As a result, the present study area is subdivided into three different vegetation zones (cf. Danin, 1988; Langgut et al., 2014: 282–283; Schiebel and Litt, 2018, Figure 2a): (1) a desert (Saharo-Arabian) territory along the shores of the Dead Sea and in the Arava Valley characterised by Chenopodiaceae plants, (2) a semi-desert (Irano-Turanian) zone distributed along the eastern slopes of Cisjordan highlands and in the Moab plateau and (3) a Mediterranean vegetation dominated by maquis and evergreen and deciduous oaks over Cisjordan, Lower North Levant and large parts of the Transjordanian plateau.
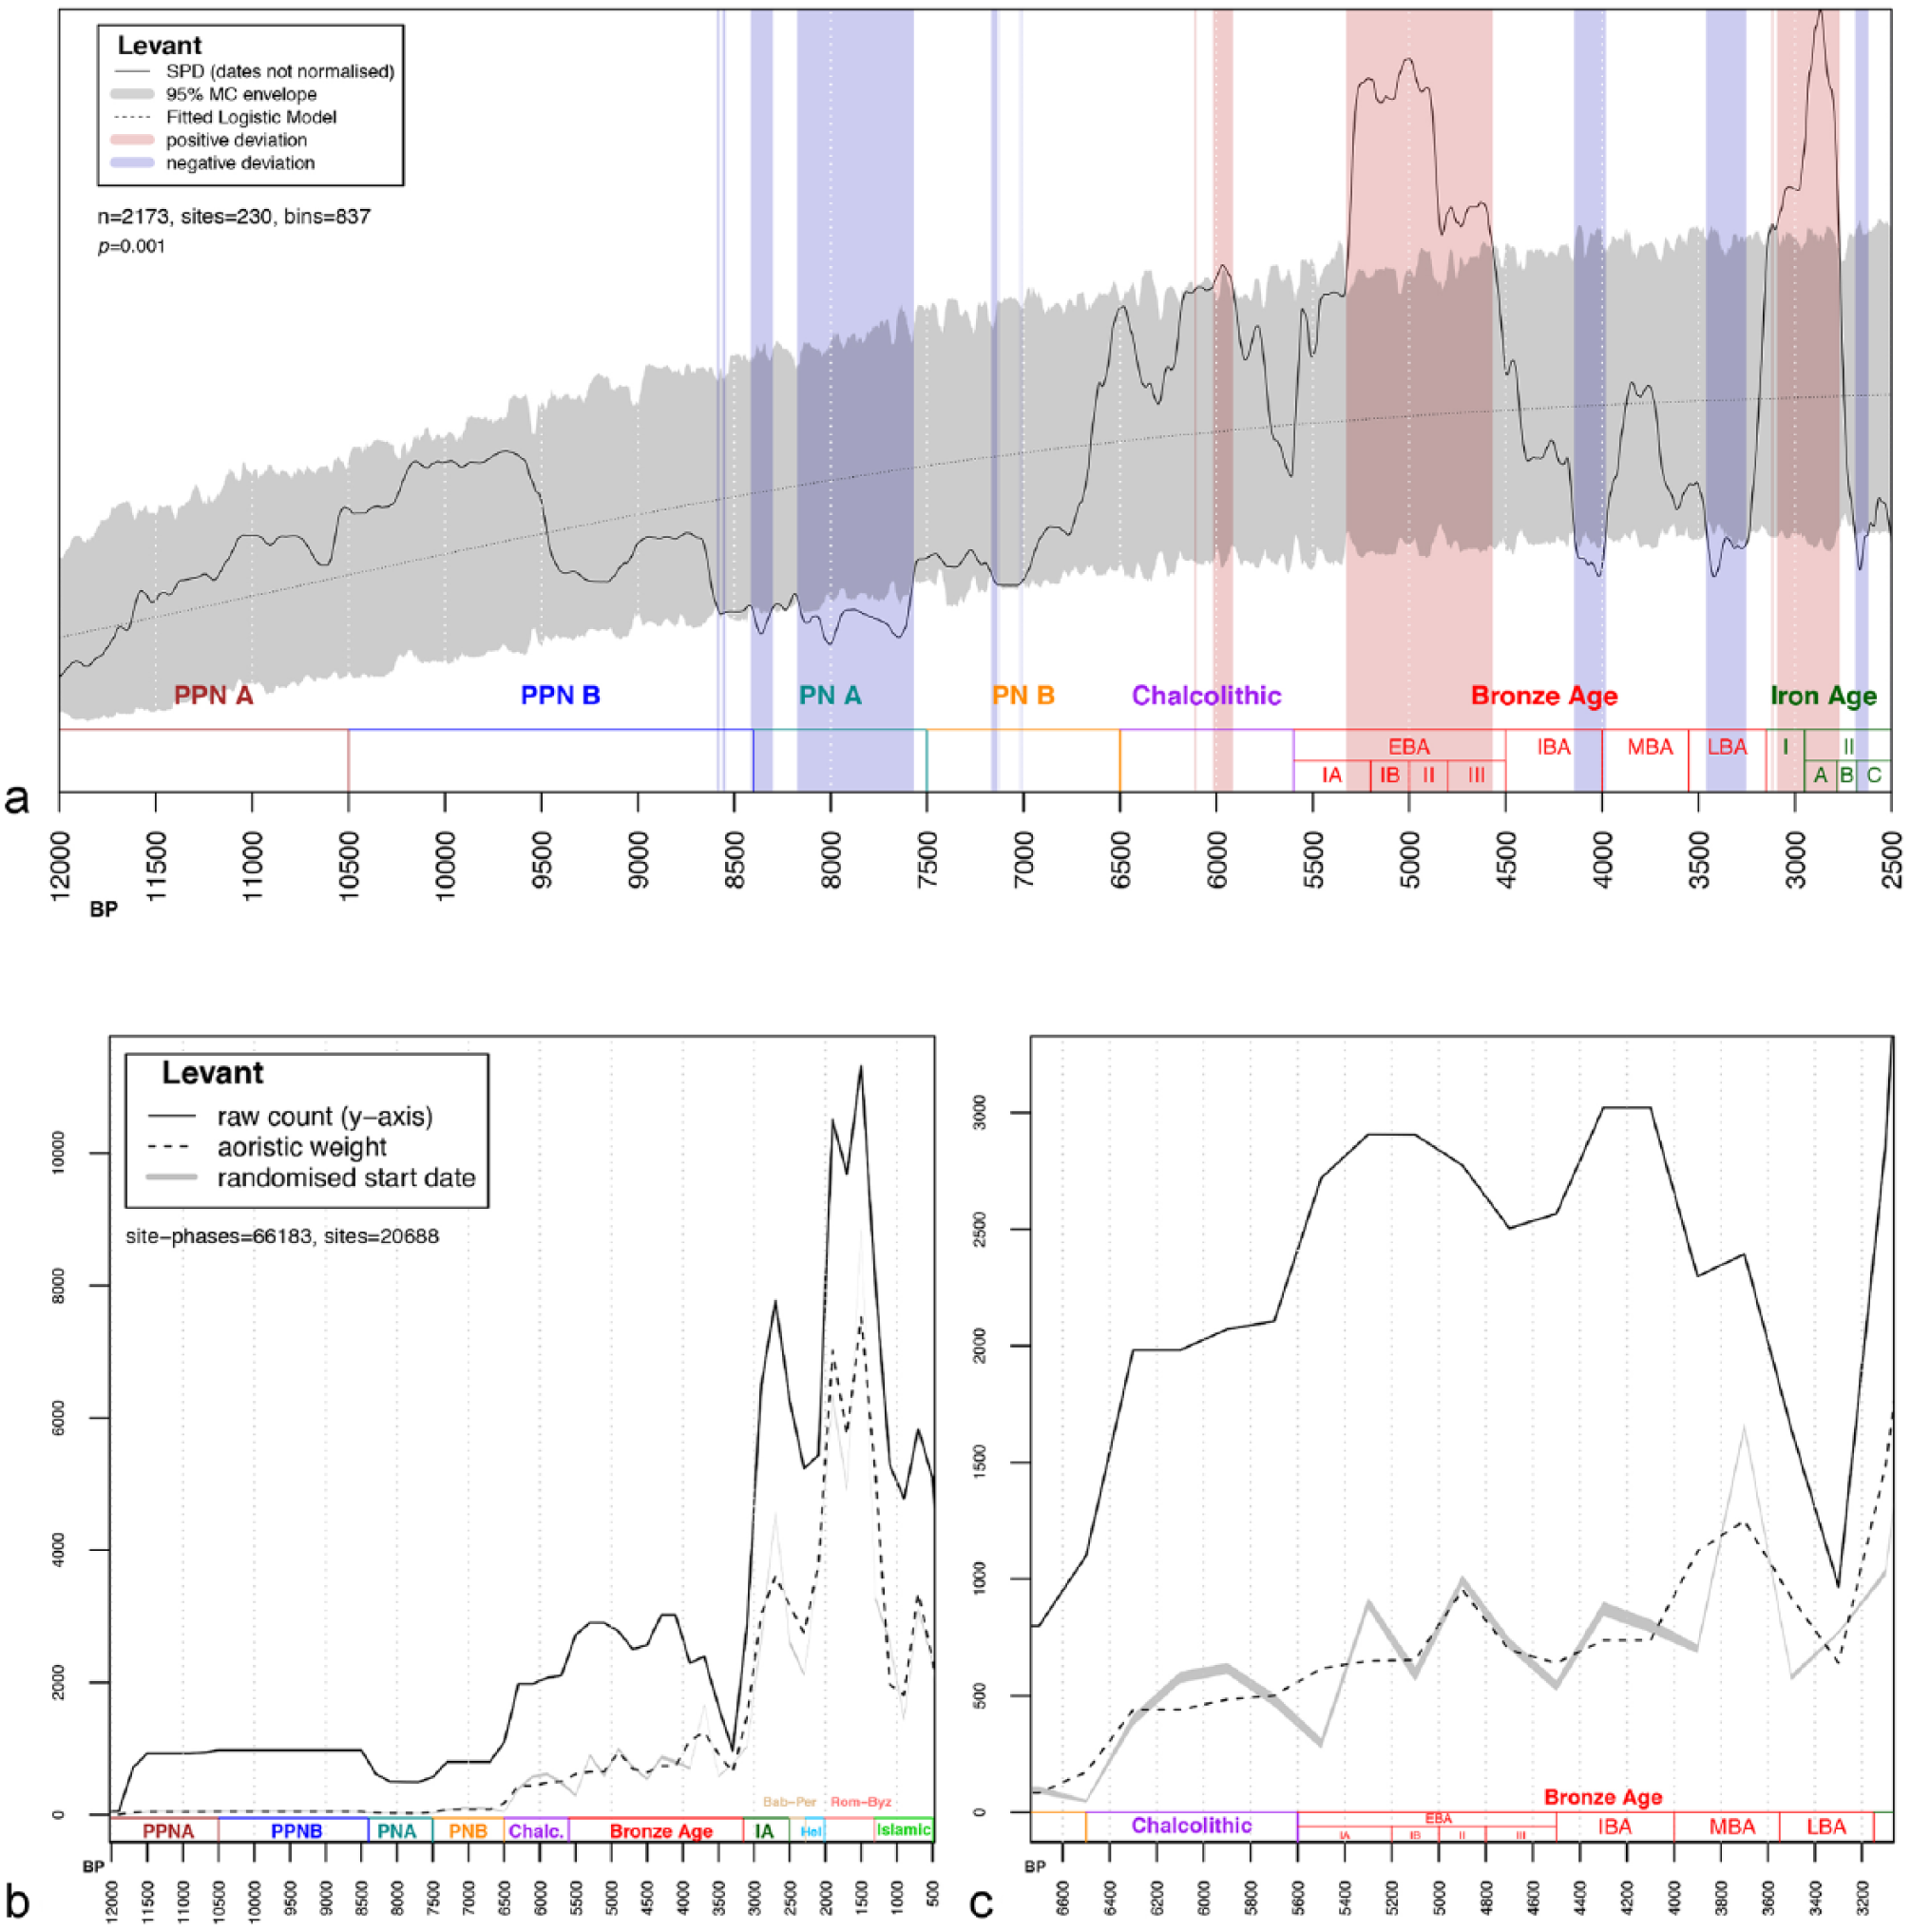
(a) Summed Probability Distribution (SPD) of unnormalised calibrated radiocarbon dates versus a fitted logistic null model (95% confidence grey envelope). Blue and red vertical bands indicate, respectively, chronological ranges within the observed SPD deviates negatively and positively from the null model. (b) Comparison of sites raw count (solid line), aoristic sum (dashed line) and randomised start date of sites (grey envelope) from 12,000 to 600 cal. yr BP. (c) Inset of population change between 6600 and 3000 cal. yr BP.
Archaeological data
The archaeological datasets (archaeological settlement data and radiocarbon dates) have been collected as exhaustively as possible via harmonisation of existing online databases and both electronic and print publications to create two geo-referenced databases (unprojected LatLon coordinate system, WGS84 datum), one for radiocarbon dates (Figure 1a) and one for archaeological sites (Figure 1b). A total of 2173 uncalibrated radiocarbon dates have been identified from 230 sites and either collected from several existing online databases in some cases (EUROEVOL, RADON, EX ORIENTE) or more often added from a wide range of publications (see Supplemental material 1 for a full list of sources, available online; Figure 1a). This number exceeds the suggested minimum threshold of 200–500 to produce reliable Summed Probability Distribution (SPD) of radiocarbon dates with reduced statistical fluctuation for a time interval of 10,000 years (cf. Michczyńska et al., 2007; Michczyńska and Pazdur, 2004; Williams, 2012: 580–581). All of these radiocarbon dates come from archaeological contexts, with the majority being samples of bone, charcoal and wood. Radiocarbon dates obtained from marine samples such as shell have been removed (and are not part of the above total) in order to avoid complicating issues arising from unknown or poorly understood marine reservoir offsets.
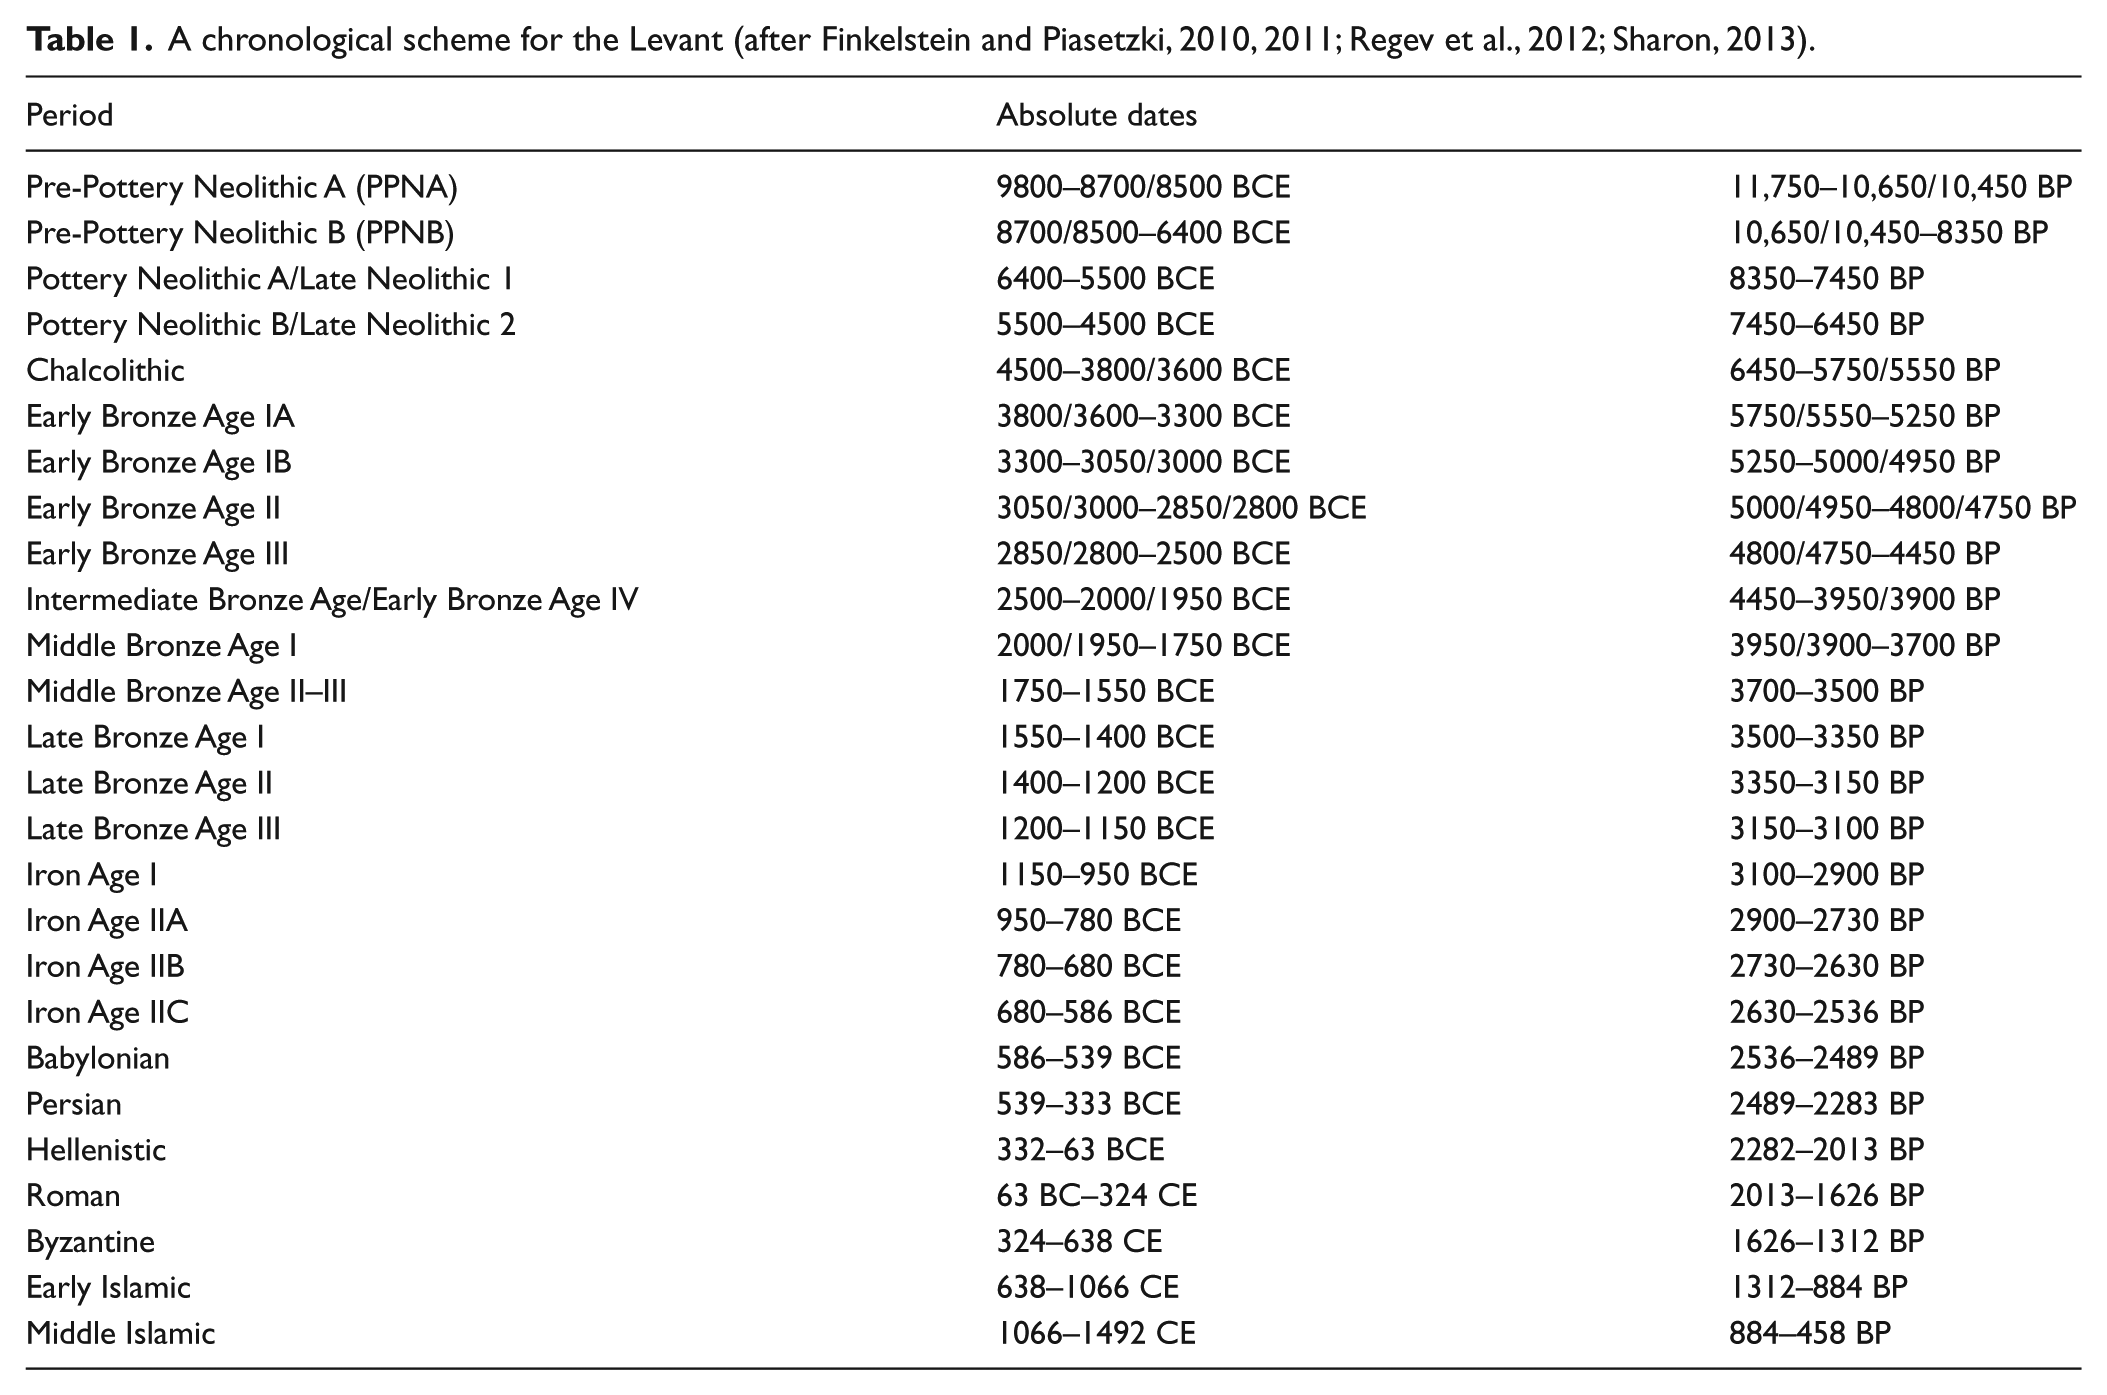
To create the database of archaeological sites used below, we conducted a comprehensive synthesis and standardisation of Holocene settlement data from two online databases which represent an excellent source of more than 47,000 sites across the Levant: (1) The Digital Archaeological Atlas of the Holy Land (Savage and Levy, 2014) 1 and (2) The West Bank and East Jerusalem Archaeological Database (Greenberg and Keinan, 2009). 2 Settlement data were recorded as geo-referenced points per cultural period. The use of the term ‘period’ here refers to familiar archaeological episodes in the region such as Chalcolithic, Early Bronze Age, Iron Age and so on. These cultural units were found to be the most common level of aggregation and standardisation but were typically expressed without any absolute calendric dates. By recording both the stated cultural period and approximate estimated start and end dates in calendrical years, we have sought to provide maximum comparative potential across archaeological sites from different regions, standardising period-based terminology where necessary (see Table 1 for the chronological scheme adopted). One major caveat is that the estimated site extent per cultural period was not recorded for all the sites stored in the two online databases. As a consequence, in this work, we use site counts as a proxy for population. A total of 20,688 sites and 66,183 occupation phases have been collected using the above approach (with these numbers showing that most sites experienced multiple periods of occupation; see Figure 1b).
A chronological scheme for the Levant (after Finkelstein and Piasetzki, 2010, 2011; Regev et al., 2012; Sharon, 2013).
Pollen data
The fossil pollen dataset includes 14 sequences from 13 sites (Figure 1 and Table 2), and the modern pollen dataset includes 35 surface pollen samples from locations across the Southern Levant. The pollen data primarily derive from collaborators (Table 2), and the European modern (Davis et al., 2013) and fossil pollen databases (Leydet et al., 2007–2017). These records formed part of a Mediterranean-wide analysis of vegetation change based on cluster analysis and community classification (see Fyfe et al., 2018; Woodbridge et al., 2018, for further details). Only pollen sequences with reliable chronologies were selected for analysis (see Giesecke et al., 2014). Hence, new chronologies were made for collaborators’ datasets and confirmed with the original authors. This allows us a more reliable control on the reconstruction of vegetation change than has been possible in previous studies.
List of fossil pollen sites and their contributors.

Palaeoclimate data
The palaeoclimate data derive from analyses of cave speleothem archives at Soreq and Jeita (Figure 1) and provide past precipitation proxies inferred from δ18O (Bar-Matthews et al., 1999, 2003; Cheng et al., 2015). The isotope values of these two datasets have been normalised around their Holocene mean and standard deviation to produce a z-score (Figure 6), which has been transformed in order to have higher positive values indicating wetter climatic conditions and lower negative values for dry climate.
Methods
Demographic trends from archaeological data
Population estimates build on the assumption that an observable density of archaeological evidence over time and across a study region is proportional to population (see Drennan et al., 2015, for a good overview). In this work, we use two types of archaeological data as proxies for estimating population fluctuations over the long run: (1) SPDs of radiocarbon dates and (2) settlement data including site counts.
We reduced the potential ‘wealth-bias’ of oversampling specific site-phases by aggregating uncalibrated radiocarbon dates from the same site that are within 100 years of each other and dividing by the number of dates that fall in this bin (Timpson et al., 2014). Dates having a gap of at least 100 years from the previous one are assigned to a new bin. In this step, our 2173 radiocarbon dates have been grouped into 837 bins. The probabilities from each calibrated date are combined to produce an SPD. Following previous works (Weninger et al., 2009, 2015; Williams, 2012) demonstrating that normalised calibrated dates emphasise narrow artificial peaks in SPDs due to steepening portions of the radiocarbon calibration curve, we opted to use unnormalised dates prior to summation and calibrated via IntCal13 curve (Reimer et al., 2013; see former applications in Bevan et al., 2017; Palmisano et al., 2017; Roberts et al., 2018). Consequently, a logistic null model representing expected population growth and plateau has been fitted to the observed SPD in order to produce a 95% confidence envelope (composed of 1000 random SPDs) and to statistically test if the observed pattern significantly departs from this model (for the general approach, Shennan et al., 2013; Timpson et al., 2014; Bevan et al., 2018; as specifically implemented in Bevan and Crema, 2018: modelTest, ‘uncalsample’). Deviations above and below the 95% confidence limits of the envelope, respectively, indicate periods of population growth and decline greater than expected according to a logistic model of population growth. This theoretical null model of population change builds on the assumption that a population’s per capita growth rate decreases to zero as population size approaches a maximum imposed by limited resources in the environment as there might be an upper bound to pre–Iron Age population growth. However, it is important to bear in mind that a logistic model cannot be considered strictly as a realistic model for population growth, but rather as an elementary model useful for quantitatively testing population fluctuations (cf. Turchin, 2001). In this case, we preferred a logistic model to other possible null-models (e.g. uniform, exponential) given the observed shape of SPD of radiocarbon dates in our study area (see Figure 2a).
We calculated the sites count for 200-year time slices starting with periodt1 (12,000–11,800 cal. yr BP) and ending with periodt57 (800–600 cal. yr BP). Bearing in mind that archaeological cultures result in larger or shorter time spans according to the dating precision of archaeological artefacts, we applied a probabilistic approach known as aoristic analysis to deal with the temporal uncertainty of occupation periods (for a more detailed explanation of the methodology, see Crema, 2012: 446–448; Crema et al., 2010: 1118–1121; Palmisano et al., 2017: 63–65). In addition, to mitigate the discrepancy between wide chronological uncertainties and narrower likely site durations, we applied Monte Carlo methods to generate randomised start of occupation periods for sites with low-resolution information (cf. Crema, 2012: 450–451; Kolář et al., 2016: 518–519; Orton et al., 2017: 5–6; Palmisano et al., 2017: 63–64). The resulting probabilistic distributions of site frequencies through time, based on the aoristic sums and Monte Carlo simulations, provide useful comparisons with the raw site frequency data.
Pollen-inferred land cover vegetation
Pollen count data have been summed into 200-year time windows through the Holocene and vegetation cluster group change is presented as the percentage of samples assigned to each vegetation type. Descriptions of the methodological approaches developed and applied to the pollen datasets are provided in Woodbridge et al. (2018) and Fyfe et al. (2018).
Simpson’s diversity index has also been applied to the data to explore major changes and shifts in diversity patterns over time. Simpson’s index has been calculated for each pollen sample using pollen percentage data. This index takes both species richness and evenness into account and is often used to explore diversity change in pollen datasets (e.g. Morris et al., 2014; Woodbridge et al., 2018). Values for a number of pollen indicator groups have been calculated. This includes Arboreal Pollen (AP%), an Anthropogenic Pollen Index (API: Artemisia, Centaurea, Cichorioideae, Plantago, cereals, Urtica and Trifolium type; Mercuri et al., 2013a), an indicator group for cultivated trees (OJC: Olea, Juglans, Castanea; Mercuri et al., 2013b) with the addition of Vitis (OJCV) and a group of pastoral land-use indicators (Artemisia, Chenopodiaceae, Plantago lanceolata and Plantago major/media, Asteroideae, Cichorioideae, Cirsium-type, Galium-type, Ranunculaceae and Potentilla-type; adapted from Mazier et al., 2006, 2009). An additional pollen indicator group including ruderal weeds (Polygonaceae, Urticaceae, Plantago lanceolata) and grazing resistant plants such as Cirsium, Carduus and different species of Centaurea (C. nigra, C. solsticialis and C. cyanus) has been calculated (adapted from Langgut et al., 2014). Because this latter group encompasses together secondary anthropogenic (ruderal weeds) and grazing indicators, an increase of these taxa reflect more generally a more intense human impact on the vegetation such as woodland clearance, increase of pasture lands, building activity (e.g. settlements, mining, roads, etc.) and agriculture (e.g. terracing, abandoned fields, irrigation, etc.).
It is important to point out that the regional pastoral indicators group was developed using the same grouping of taxa used in France, so is less informative about landscape change in the Levant, but has been included to allow comparisons between different case study regions within a Mediterranean-wide synthesis (Roberts et al., this volume).
Amalgamated results are shown for the entire region, and the Arboreal Pollen (%), OJCV index, API and regional pastoral indicators are also presented for individual sites. The Arboreal Pollen (%) includes the cultivated trees. Indicator groups are useful to assess the anthropogenic impact on landscape transformation across time. Although the indicator groups are based on literature that describe the taxa as ‘anthropogenic indicators’, some of these taxa are also indicators of natural vegetation types, for example, Chenopodiaceae, Asteroideae and Cichorioideae indicate natural steppe vegetation.
Results
Demographic trends
Figure 2a shows the SPD of 2173 unnormalised calibrated radiocarbon dates from 12,000 to 2500 cal. yr BP compared with a 95% confidence envelop for a logistic null model. Deviations above (in red) and below (in blue) the null model represent, respectively, patterns of population growth and decline beyond than expected under a long-term logistic demographic trend. The observed SPD (black solid line) shows a significant overall departure from the envelope of the logistic model (global p value = 0.001).
From the end of the Younger Dryas at ~11,700 cal. yr BP, corresponding to the onset of the Holocene, a steady increase of population occurs until 9500 cal. yr BP. Then, population starts decreasing during the PPNB and falls below the null model in the PNA (8400–7600 cal. yr BP). The population rises in the late PNB and in the Chalcolithic, and it reaches a peak above that expected between 6100 and 5800 cal. yr BP. The Bronze Age is characterised by peaks of population in the EBA (5300–4600 cal. yr BP) and MBA (this one is not statistically significant) punctuated by significant population decrease in the IBA (4200–4000 cal. yr BP) and in the LBA (3400–3200 cal. yr BP). A further dramatic increase of population occurs at the start of the Iron Age (~3100–2800 cal. yr BP). After this period, the radiocarbon population proxy gradually decreases until the end of the Iron Age. In addition, it is important to point out that the later periods (after 2500 cal. yr BP) have been excluded in the present analysis because the SPD of radiocarbon dates massively underestimates a widely agreed and widely evidenced boom in population during the Roman and Byzantine periods (Bar, 2004; Broshi, 1979; Geva, 2014). This is due to the reliance by most Roman and Byzantine archaeologists on typo-chronological schemes defined by short-lived pottery types and coins for dating rather than using radiocarbon samples. Furthermore, a caveat in the patterns described by the SPD of radiocarbon dates is represented by the fact that certain chronological periods are more likely to be sampled than others. For instance, the significant growth of population during the EBA and the IA could reflect research biases related to the interest of many archaeologists in providing a better chronology for the EBA sub-periods and the LBA/IA transition (cf. Braun, 2012; Finkelstein and Piasetzky, 2010, 2011; Mazar and Bronk Ramsey, 2008, 2010; Regev et al., 2012).
Figure 2b shows the frequency per 200-year time-block of 66,183 site occupation phases from 20,688 sites. Three different versions have been derived from archaeological settlement data to infer population dynamics over the long run: raw site counts, aoristic sum and randomised start date of site-phase. The results show for all three proxies an increase of population from the onset of the early Holocene (at least more pronounced for the site counts) and a decrease during the PNA (~8500–7500 cal. yr BP). Then, population starts growing again during the Chalcolithic and is characterised by patterns of boom and bust during the Bronze Age (see Figure 2c). The results show a substantial growth of population in the Iron Age (~3100–2700 cal. yr BP), in the Roman-Byzantine period (~2000–1300 cal. yr BP) and in the Middle Islamic (900–600 cal. yr BP). These episodes are punctuated by a population decline in the Babylonian-Persian period (~2500–2300 cal. yr BP) and in the Early Islamic (1300–900 cal. yr BP).
Figure 3 shows the regionally subdivided SPD of unnormalised radiocarbon dates compared against the pan-regional trend (grey envelope) described above. In this case, we assess to which degree the demographic patterns of each sub-region depart from the pan-regional trend via a permutation test (see Crema et al., 2016, for a detailed description of the methodology). Such a technique also deals with the issues represented by the size of the samples, as the resulting grey envelopes of the pan-regional trend are larger in those sub-regions with less radiocarbon dates (see Figure 3). Therefore, the grey envelopes are larger because of more uncertainty. It is important to emphasise that this approach allows us to compare relative change through time of the SPDs (and so the proportional change of population) within each sub-region and not their differences as absolute magnitudes in terms of population. Cisjordan lowlands (Figure 3b) and highlands (Figure 3c) show significant departures from the pan-regional trend (p < 0.05), while the Lower North Levant (Figure 3a) and Transjordan (Figure 3d) do not depart significantly from the overall shape of the pan-regional trend (p > 0.25). Although the latter ones have global demographic trends similar with the pan-regional one, they still show some local deviations. In fact, in the Lower North Levant (Figure 3a), the population density is significantly above the pan-regional pattern in the PPNB (9700–9500 cal. yr BP), in the PNA (7700–7500 cal. yr BP) and in the EBA (4800–4500 cal. yr BP). Transjordan (Figure 3d) shows short-local deviations above the general trends through the PNA and a significant negative deviation in the IA (~3200–2800 cal. yr BP). In the Cisjordan lowlands (Figure 3b), the population trend is flat and lies below the pan-regional confidence envelope in the PPNA (11,400–11,100 cal. yr BP) and significantly exceeds the global pattern in the IA (~3200–3100 cal. yr BP). The Cisjordan highlands (Figure 3c) are characterised by a local positive demographic departure in the PPNA (12,000–10,800 cal. yr BP) and a significant decrease below the pan-regional trend in the PNA (~7900–7400 cal. yr BP).

Regional summed probability distributions (SPDs) of calibrated radiocarbon dates for (a) Lower North Levant, (b) Cisjordan lowlands, (c) Cisjordan highlands and (d) Transjordan, compared with a 95% Monte Carlo envelope of the pan-regional model produced via permutation of sub-regional dates.
Figure 4 shows settlement dynamics in the four sub-regions. In all regions, population as inferred by this particular proxy seems to increase since the beginning of the Holocene and then is stable until the PNA (~8500–7500 cal. yr BP), at which time it decreases in Cisjordan and (Figure 4b and c) Transjordan (Figure 4d). Then, population starts increasing rapidly in the Chalcolithic and Bronze Age, and peaks during the Iron Age and Roman-Byzantine periods. Episodes of marked population decline occur in all four regions during the Late Bronze Age (~3300–3100 cal. yr BP) and in the Early Islamic (~1200–800 cal. yr BP).

Regional comparison of sites raw count (solid line), aoristic sum (dashed line) and randomised start date of archaeological sites (grey envelope) for (a) Lower North Levant, (b) Cisjordan lowlands, (c) Cisjordan highlands and (d) Transjordan.
Unlike the radiocarbon dates, the three proxies derived from archaeological settlement data (raw count, aoristic sum and randomised start date) provide a better coverage both chronologically and spatially in the area under investigation, as they are the results of intensive and extensive archaeological surveys carried out across the Levant. A pairwise Spearman’s correlations between all demographic proxies show that they are strongly correlated and describe similar patterns (Table 3). In particular, the demographic trends defined by SPD of radiocarbon dates are strongly correlated with the ones derived from the archaeological settlement data (r > 0.68) during the period from 12,000 to 2600 cal. yr BP.
Spearman’s rank correlation coefficient (R) value matrix for the period 11,000–600 cal. yr BP (to 2600 cal. yr BP for 14C SPD).

Significant correlations are indicated by bold numbers.
p < 0.05, **p < 0.01.
Land cover vegetation change
The 14 pollen records from 13 sites have been used to infer Holocene vegetation change in the study area as a whole. Unfortunately, the patchiness of data in terms of spatial and chronological coverage of the records does not allow us to subdivide vegetation cluster group trends into two or more sub-regions, as patterns are highly influenced by a small number of sites. The pollen samples have been divided into 16 pollen-inferred vegetation clusters via hierarchical clustering according to the classification of Mediterranean pollen assemblages described by Fyfe et al. (2018) and Woodbridge et al. (2018). In the Levant, not all the 16 vegetation clusters are represented (see Figure 5). The main groups are 1.1 (sclerophyllous parkland), 1.3 (steppe parkland) and 1.4 (parkland/grassland). Moderately prominent are the groups 1.2 (evergreen shrubland: Oleaceae) and 2.0 (evergreen shurbland: Quercus). Cluster 1, which is the aggregation of four groups, is the dominant vegetation feature across the whole Holocene. This cluster represents open and human-modified vegetation and includes several constant taxa such as Poaceae, Chenopodiaceae, Artemisia, Quercus and Asteraceae. Evergreen shrubland (Oleaceae, group 1.2) starts appearing at 7000 cal. yr BP and reaches its peak (~30%) at around 6500 cal. yr BP. Since then, it gradually decreases and disappears between 4500 and 2400 cal. yr BP. It starts increasing again at ~2000 cal. yr BP and constantly represents the 20–25% of the pollen assemblage until the 1000 cal. yr BP before declining again. Evergreen shrubland (Quercus) is recorded between 10,500 and 9800 cal. yr BP and then from 6400 cal. yr BP onwards until the present. Deciduous oak parklands and woodlands (clusters 6.1 and 6.2) are recorded only between 11,000 and 9200 cal. yr BP.

Pollen-inferred vegetation cluster groups (11,000 cal. yr BP–modern) for the Levant.
Arboreal Pollen (AP%) fluctuated between 15% and 45% throughout the Holocene with a gradual decline from 10,000 to 6600 cal. yr BP (Figure 6). After this, the arboreal pollen percent starts increasing steadily until 4000 cal. yr BP and it gradually decreases until 1500 cal. yr BP. Following this time, it grows steadily (Figure 6). A marked increase of cultivated trees (Olea, Juglans, Castanea and Vitis) occurs between 6500 and 1000 cal. yr BP as indicated by the OJCV index (Figure 6). This general trend is punctuated by a decline of cultivated trees between 4000 and 1500 cal. yr BP, and from 1000 cal. yr BP onwards. It is important to point out that the dominant taxa in the OJCV index in this region is represented by Olea. The API indicates an increase of anthropogenic activity from 9000 to 6500 cal. yr BP, and a gradual decrease after this time. The inferred anthropogenic activity starts increasing again from 4000 cal. yr. BP onwards. Similar trends throughout the Holocene occur also for the regional pastoral indicators. The ruderal and grazing resistant plants suggest an increase of human pressure on the natural environment between 11,000 and 9500 BP, followed by a sharp decline until 6500 BP. After this, the ruderal weeds and grazing resistant plants increase again until 4500 BP, and then starts decrease gradually until the modern era (Figure 6). However, it is important to point out that the regional pattern provided by this latter indicator is mostly skewed by the pollen assemblage from Al Jourd (see Figure 9), which is characterised by a substantial peak during the 5500–4500 BP reflecting a stronger human activity such as oak and cedar deforestation (Hajar et al., 2010). Simpson’s index suggests that landscape diversity increased since the early Holocene and increased further from 2500 cal. yr BP onwards.

Pollen-inferred indicator groups: arboreal pollen (AP%); sum of Olea, Juglans, Castanea and Vitis (OJCV); anthropogenic pollen index (API); ruderal weeds + grazing resistant plants; pastoral indicators and Simpson’s diversity Index averaged for all sites in the study area (11,000 BP to modern) compared with proxy archaeological data and palaeoclimate records from Soreq and Jeita’s caves. Time windows with insufficient radiocarbon dates for reliable SDP of calibrated 14C dates are shown in white.
Comparing landscape dynamics versus population proxies
The demographic proxies (SPD of radiocarbon dates, aoristic sum and raw count) and the z-score of the palaeoclimate records are binned into 200-year time slices to match the time windows used in the analysis of pollen sequences. The use of a 200-year time window for all the proxies is justified by the fact that this is the finest chronological resolution provided by the pollen data. We also calculated the median of the envelope of the randomised start date of sites, which is the result of 1000 randomised runs, and binned this into 200-year time slices. This step provides a measurement comparable with the other demographic and environmental proxies. A Spearman’s rank correlation matrix between pollen indicators, archaeological demographic proxies and palaeoclimate records for the period from 11,000 to 600 cal. yr BP is given in Table 3. Pairwise Spearman’s correlations between SPD of radiocarbon dates and all other proxies have been calculated in a shorter time span between 11,000 and 2600 cal. yr BP, because after this time, the radiocarbon dates are not a good proxy for inferring demographic trends as discussed above. Spearman’s correlations between all demographic proxies indicate strong positive correlation (p < 0.001) and suggest that the archaeological data depict similar population dynamics over the long run. The palaeoclimate records are negatively correlated with all demographic proxies and pollen indicators such as AP percent and OJCV index. Instead, the API and the regional pastoral indicators show a positive relationship with climate proxies. The clearest significant correlations (p < 0.001) are between the demographic proxies and OJCV index, which implies that cultivated trees were more abundant when there was a higher population. Regional pastoral indicators are negatively correlated with population, while the AP percentage is positively related with demographic proxies. The Simpson Index does not show any correlation with the demographic proxies. The positive correlation between all demographic proxies and AP percent suggests that demographic growth is not associated with a decline of trees as would be expected in the case of negative correlation. Nevertheless, this anomaly of tree cover not declining at times of increasing human population is that AP percent also includes cultivated trees such as olive and vitis that are positively correlated with demographic growth. Positive correlations between ruderal weeds + grazing resistant plants and demographic proxies indicate that disturbed lands are a result of human activity. The palaeoclimate records from Soreq and Jeita caves are positively correlated (p < 0.001) throughout the Holocene (Table 3). Their averaged z-scores indicate wetter conditions in the early and mid-Holocene (until ~7000 cal. yr BP), which is followed by a drier climate until ~1000 cal. yr BP.
However, the results described here only provide us with an overall picture of long-term trends, by treating the Holocene as a whole. Instead, in order to have a better understanding of the human impact on the landscape, we have adopted a moving window approach. The advantage of this approach is to identify periods of correspondence and divergence between human population size, vegetation change and palaeoclimate records over shorter time periods from the early to the late Holocene (11,000–600 cal. yr BP). Thus, a 2000-year-time moving window Spearman’s correlation has been used, with ten 200-year bins in each time window (see Supplemental Material 2: Tables S1–S10, available online). In addition, cross-correlation analysis has been performed in order to assess if one time series ‘causes’ changes in another and if they occur with a defined time lag between each other. Here, the time lag unit is 200 years. Cross-correlation values have been indicated in Supplemental Material 2 (Tables S1–S10, available online) only for those 2000-year time windows showing significant Spearman’s correlations.
The results in Supplemental Material 2 (Table S1, available online) show that population is positively correlated with AP percentage (trees and shrubs) during the mid-Holocene. Most of the correlations have a lag equal to 0 indicating contemporaneity between demographic trends and vegetation change. This is also due to the fact that our 200-year resolution is quite coarse to assess time lags between demographic proxies and pollen indicators. The results in Supplemental Material 2 (Table S2, available online) show a strong positive correlation between demographic trends and OJCV pollen during the mid-Holocene, encompassing those periods when population starts increasing from 7000 cal. yr BP onwards. Also in this case almost all correlations have a lag equal to 0. Other strong positive correlations occur in the late Holocene (from 3800 cal. yr BP onwards). Negative correlation occurs between demographic proxies and API and regional pastoral indicators (Supplemental Material 2: Tables S3 and S4, available online) in the mid-Holocene, while they are positively correlated in the late Holocene. In this case, some cross correlations have negative lags (–1), indicating that the increase of population anticipates by 200 years the increase of those taxa related to the anthropogenic activity and pastoral land use. Secondary anthropogenic indicators (ruderal weeds + grazing resistant plants) show positive correlation with demographic proxies during the middle Holocene (~8600–4400 BP; Supplemental Material 2: Table S5, available online). Not particularly strong correlations occur between population and Simpson’s diversity Index (Supplemental Material 2: Table S6, available online). The pollen indicators AP percentage and OJCV are negatively correlated with the palaeoclimate records in the mid-Holocene, indicating that these pollen taxa groups decreased despite wetter climatic conditions and increased when climate was drier (Supplemental Material 2: Tables S7 and S8, available online). The API index shows a strong positive correlation during the mid-Holocene (~7800–4600 cal. yr BP) and a negative correlation during the late Holocene (~4000–1600 cal. yr BP) with palaeoclimate records from Jeita cave (Supplemental Material 2: Table S8, available online). This indicates that anthropogenic pollen indicators decreased with drier climatic conditions during the mid-Holocene and increased despite unfavourable hydroclimatic trends occurring between 4000 and 1600 cal. yr BP. The regional pastoral indicators are positively correlated with the palaeoclimate proxy from Jeita cave during the early and mid-Holocene (Supplemental Material 2: Table S8, available online). The ruderal weeds + grazing resistant plants show no significant correlations with the palaeoclimate records from Soreq’s cave and are negatively correlated in the early and mid-Holocene with the climate trends inferred from Jeita’s cave speleothem records.
The archaeological proxies from Southern Levant show negative correlation with the palaeoclimate records from Soreq cave (Supplemental Material 2: Table S9, available online), except for those windows encompassing early Holocene (between 11,000 and 9000 cal. yr BP) and late Holocene (4200–2200 cal. yr BP). In this latter case, we have a correlation with a positive time lag (+1) indicating that a decline of population is delayed by 200 years and represents a worsening of hydroclimate conditions. A pattern similar to the one described above occurs between demographic proxies from Lower North Levant and the palaeoclimate records from Jeita cave (Supplemental Material 2: Table S10, available online).
However, it is important to bear in mind that in this study, we provide some general trends on a broad chronological scale of analysis. The interplay of human and environmental dynamics is difficult to disentangle with a 200-year resolution, and micro-regional socio-ecological trajectories are not discernible at the spatial scale of analysis adopted in the present paper.
Discussion: Socio-environmental trajectories from the early to the late Holocene
The Pre-Pottery Neolithic and Pottery Neolithic (ca. 11,750–6450 cal. yr BP/9800–4500 BCE)
The Pre-Pottery Neolithic A (PPNA) is the period when people started living in sedentary communities and practising farming activities, although it is still debated as to whether domestication of crops and animals occurred at this time (Colledge, 1998; Colledge et al., 2004). However, the transition from a hunter-gatherer economy to sedentary agriculture occurred gradually and unevenly in time and space (Finlayson, 2013; Horwitz et al., 2000; Vrydaghs and Denham, 2007). In the later Pre-Pottery Neolithic B (PPNB), a full development of the Neolithic lifestyle took place with an extensive use of crops and livestock management (Asouti and Fuller, 2012), which culminated with large nucleated settlements such as Jericho and Yiftahel in Cisjordan, ‘Ain Ghazal and ‘Ain Jammam in Transjordan, and Tell Ramad in Syria (Bienert, 2004; Goring-Morris and Belfer-Cohen, 2013). The wetter climatic conditions in the early Holocene could have triggered high-risk but high-yield subsistence strategies, which coincide with the first increase in population from ~11,700 until 9500 cal. yr BP (Roberts et al., 2018; see Figure 2a, Supplemental Material 2: Tables S9 and S10, available online). Given the stable warm and wet climatic conditions, the decrease in population in the late PPNB from 9500 cal. yr BP onwards is perhaps endogenous and related to the depletion and overexploitation of resources and the exceeded carrying capacity of the landscape (Finlayson, 2013: 130; Goring-Morris and Belfer-Cohen, 2010). Alternatively, the pronounced sub-centennial rainfall fluctuations between moist and dry conditions (not visible here in the 200-year averaged z-scores of the climate records from Jeita and Soreq’s caves) and a general decrease of the Dead Sea level suggest less favourable climate trends between ~9500 to 7000 cal. yr BP, which could have affected the fragile socio-economic systems of the Levantine community (Bar-Yosef, 2002; Stein et al., 2010). A decrease in population occurred in Northern Levant and Cisjordan (Figure 3a–c), while the Transjordan communities did not experience a break in the occupation (cf. Betts, 2013: 178; Rollefson, 2001: 86; see Figure 3d).
The early Holocene landscape shows the predominance of steppe and parkland/grassland vegetation (clusters 1.1, 1.3–4), which could be the result of both anthropogenic activity and climate conditions. An increase of AP percentage is evident from the onset of the Holocene and is likely related to the increase in winter temperature and rainfall after the Younger Dryas (cf. Cheddadi and Khater, 2016; Litt et al., 2012; Roberts et al., 2018). The percentage of arboreal pollen starts decreasing gradually from 9500 to 6500 cal. yr BP and seems not to be related to large-scale woodland clearance as the population decreases as well (Figure 6). The pattern is also visible at a site-scale in the Southern Levant (Ein Gedi, Dead Sea, Sea of Galilee, Huleh) and in Northern Levant (Ammiq, Al Jourd; Figure 7). Therefore, the drop of the AP assemblage could be linked to a period of increased aridity (cf. Litt et al., 2012). The shift from wetter climatic conditions that occurred for most of the PPNB to more arid conditions, exacerbated by the 8.2 ka event, could have stressed the Levantine social and economic system and negatively impacted upon the population, which seems to decrease significantly in the PNA (between ~8500 and 7500 cal. yr BP) and stagnates for most of the PNB (see Figures 2a, 2b and 3; cf. Bar-Yosef, 2002; Flohr et al., 2016; Kuijt and Goring-Morris, 2002). Overall, the archaeological evidence suggests low population densities in southern and Lower North Levant during the Neolithic and the decrease of the AP assemblage seem difficult to relate to extensive farming and widespread land management (Rosen, 2007: 99).

Pollen-inferred indicator groups at a site-level scale: arboreal pollen (AP%), and sum of Olea, Juglans, Castanea and Vitis (OJCV). Sites ordered from left to right according to a South–North gradient.
Chalcolithic and Bronze Age (ca. 6450–3100 cal. yr BP/4500–1150 BCE)
Between the mid-seventh and the early sixth millennium cal. yr BP, a series of cultural changes and successful adaptations culminated in more complex societies throughout the Levant, which was characterised by a substantial increase of population and expansion of villages that in some cases reached an extent of 10 hectares (Levy, 1998; Rowan, 2013; see Figures 2–4). An overall increase in the number of settlements occur in all the four sub-regions (Figures 3 and 4), and while most of the sites are small in size, larger villages are known in the Lower Galilee (e.g. Beit Netofa, Horvat Usa, Tell Qiri), in the Cisjordan lowlands (e.g. Nazur, Meser) and in Northern Negev (e.g. Shiqmim, Abu Matar, Horvat Beter; cf. Levy et al., 2006; Rowan, 2013). In this period, farming strategies became more intensive, with greater evidence for the production and consumption of cereals and newly domesticated olives (Besnard et al., 2013; Galili et al., 1989, 1997), and of mixed livestock (but a prevalence of sheep and goat) that also became sources of secondary products such as milk and fibres (Levy, 1992; Zohary et al., 2012). After 5800 cal. yr BP population suffered a general decline and increased again during the EBA I, when the first proto-urban centres (measuring 10–30 ha) became common (Figures 2 and 3). The Bronze Age is characterised by patterns of booms and busts where pronounced periods of population growth during the EBA I–III (~5300–4500 cal. yr BP) and the MBA (~4000–3600 cal. yr BP) were punctuated by a marked decline in population at the end of the IBA (~4200–4000 cal. yr BP) and in the LBA (~3400–3200 cal. yr BP) throughout the Levant (see Figures 2–4; cf. Falconer and Savage, 2009; Finkelstein, 1993, 1994, 1996; Finkelstein and Gophna, 1993; Greenberg, 2017; Ofer, 1994). While the role of the 4.2 ka event in explaining population decrease is debated (cf. Clarke et al., 2016; Finkelstein and Langgut, 2014; Kaniewski et al., 2008; Roberts et al., 2011; Rosen, 2007; Staubwasser and Weiss, 2006; Weiss et al., 1993), there is a broader consensus among scholars in recognising the 3.2 ka event as having contributed to societal collapse (cf. Izdebski et al., 2016b; Kaniewski et al., 2008, 2010, 2015; Langgut et al., 2013; Litt et al., 2012). The impact of the 4.2 ka BP event is not easy to assess with the synthesised demographic proxies at 200-year resolution. The SPD of radiocarbon dates shows a significant decrease of population between 4200 and 4000 cal. yr BP (Figures 2a and 3), while the demographic trends described by the settlement data do not show a sharp decline in population that, instead, seem to stagnate across the IBA in the Southern Levant (Figure 4b–d). This scenario could be the result of several factors such as the reduction of rainfall that would have hampered the creation of agricultural surplus, the lack of available marginal agro-pastoral areas given the successful expansion of walled settlements during the EBA II–III (~5000–4450 BP) and the exceeded carrying capacity of the land (Wilkinson et al., 2014: 90–92). It seems that a pronounced decline in population occurred in the Lower North Levant (Figure 3a), where the demographic proxies are positively correlated with the drier climatic conditions depicted by the isotopic records from Jeita cave (Supplemental Material 2: Table S10, available online).
The trend depicted by regional pastoral indicators seems to not corroborate the traditional view of the IBA as a period characterised by the spread of pastoral subsistence strategies (Horwitz, 1989; Miroschedji, 2009; Figure 6). In fact, except the pollen record from Ein Gedi and Ammiq, the patterns showed by the other pollen sites do not show an increase of pastoral indicators (Figure 8). Instead, the OJCV index from the Sea of Galilee, Birkat Ram and Ein Gedi (between 4200 and 4000 cal. yr BP) indicate well-maintained orchards (Langgut et al., 2015; Figure 7). All archaeological proxies show a substantial decrease in population in the LBA II–III (~3400–3200 cal. yr BP; Figures 2 and 3). From the Chalcolithic onwards, we observe a human-modified landscape as highlighted by a sharp increase of cultivated trees (OJCV: Olea, Juglans, Castanea, Vitis), which peaks in the EBA I at around 5500 cal. yr BP (Figure 6). A decrease of OJCV pollen values during the EBA II–III could be related to socio-economic causes rather than to climatic conditions as witnessed by the reduced demand of oil products from Egypt that established new trade relations with the communities in the North Levant (cf. Kaniewski et al., 2012; Langgut et al., 2014, 2016). At a site-level scale, this general trend is confirmed by all sites except Hula, which shows an increase of cultivated trees in the EBA II–III (~5000–4500 cal. yr BP; Figure 7). However, the OJCV pollen index is strongly related to the human activity and tends to vary according to the demographic dynamics (Table 3 and Table S2). The proportion of arboreal pollen increased during the Chalcolithic and was steady across the whole Bronze Age indicating no particular evidence of human or climate impact (Figure 6; Tables 3 and Supplemental Material 2: Table S1, available online). The same pattern occurs at a site-level scale except for Ammiq and Al Jourd that reflect a stronger human activity such as oak and cedar deforestation (Figure 7; Hajar et al., 2010). In this case, the secondary anthropogenic indicators (ruderal weeds + resistant grazing plants) from Al Jourd indicate an increase in open fields and disturbed lands during the Chalcolithic and Bronze Age (~6500–3500 cal. yr BP; Figure 9). The API and the pastoral pollen indicators decrease during the Chalcolithic and the Bronze Age and are negatively correlated with demographic trends (Supplemental Material 2: Tables S3 and S4, available online) indicating that highly sedentary communities mostly rely on horticulture products rather than herd-based economy (Figures 6 and 8). In fact, the EBA II–III (~5000–4450 BP) was characterised by the spreading of nucleated walled settlements in marginal agro-pastoral zones practising intensive agricultures and exerting the control over the surrounding lands and the agricultural products (cf. Philip, 2003; Wilkinson et al., 2014: 88–90). An increase of the API and pastoral indicators occur in the LBA, in concomitance with a decline in population and cultivated trees (OJCV) and drier climatic conditions, perhaps indicating a shift in subsistence strategies of some local communities from intensive farming to pasture (Figures 6 and 8). An increase of secondary anthropogenic indicators (ruderal weeds + grazing resistant plants) from 6500 BP onwards indicate a higher human impact on the natural environment (Figure 6; Supplemental Material 2: Table S5, available online) in the Cisjordan highlands (Ein Gedi), in the Huleh basin and on the Golan Heights (Birkat Ram; Figure 9).

Pollen-inferred indicator groups at a site-level scale: anthropogenic pollen index (API) and regional pastoral indicators. Sites ordered from left to right according to a South–North gradient.

Pollen-inferred indicator groups at a site-level scale: ruderal weeds + grazing resistant plants. Sites ordered from left to right according to a South–North gradient.
From Iron Age I to the Persian period (ca. 3100–2283 cal. yr BP/1150–333 BCE)
The Iron Age is characterised by the decline of the Egyptian domination over the Southern Levant and by the establishment of medium-sized regional kingdoms such as Israel and Judah in the Southern Levant and Moab, Edom and Ammon in Transjordan, and Phoenician city-states in Lebanon and the northern coast of Israel. This is a period of highly complex societies and is characterised by the thriving of population in the IA I and II (~3100–2700 cal. yr BP) particularly in Cisjordan and Transjordan (Figures 2a, 2b and 3b–d). Although the SPD of radiocarbon dates may overestimate the population in this period given the possible research biases in collecting radiocarbon samples, this picture is corroborated by the trends described by the archaeological settlement data (Figure 2b and c). However, studies on micro-regional scales show a reduction in human occupation at Akko and Tel Dan during phases of enduring drought (~3200–2700 cal. yr BP) and a resurgence after 2500 cal. yr BP, during the Persian and Hellenistic periods (cf. Kaniewski et al., 2013, 2017). A decrease in population occurs in concomitance of the Persian domination (~2600–2300 cal. yr BP) across the Southern Levant (Figure 4b–d). During the Early Persian period (~2470–2400 cal. yr BP), drier climatic conditions caused the abandonment of those steppe-marginal areas of the southern Levant, more fragile to climatic shifts and prompted nomadization of some segments of the local population (cf. Langgut and Lipschits, 2017).
During the Iron Age and Babylonian/Persian period, despite drier conditions indicated by the isotopic records from Soreq and Jeita caves, the overall trend is that population increased dramatically and was negatively correlated with palaeoclimate trends (Table 3 and Supplemental Material 2: Tables S9 and S10, available online). In fact, in this period, we may see a decoupling of demographic trends and climate conditions because population is less vulnerable to climatic shifts due to advances in technologies coping with drought and food stress, and extensive trade networks and logistic infrastructures typical of state and empires, which are societies capable of transferring resources from areas with agricultural surplus to the ones with failed crops (Lawrence et al., 2016; Rosen, 2007: 101; Wilkinson and Rayne, 2010). Nevertheless, the patterns on micro-regional scale can depict a different scenario as local communities can experience different adaptation strategies to social and environmental stress. In the third millennium BP the parallel gradual increase of OJCV, API, Simpson’s Index, and pastoral indicators, and a decrease in AP percentage suggest that the landscape became heavily anthropogenised and that Levantine communities could have adopted a diversified subsistence economy as a response to climatic shifts (cf. Finkelstein and Langgut, 2018, Figure 6; Langgut et al., 2015).
Hellenistic, Roman and Byzantine Period (ca. 2282–1312 cal. yr BP/332 BCE–AD 638)
Population started increasing in the latter half of the Hellenistic period and boomed throughout the Levant when the Roman Empire imposed its hegemony over the region (Bar, 2004; Figures 2b and 3). The population continued growing until the end of the Byzantine period (~1300 cal. yr BP), when it reached the highest level ever, which was then reached again only in the 20th century (Bar, 2004; Broshi, 1979; Scheidel, 2007: 43). The Roman hegemony of the Mediterranean integrated the farming systems of the Levant into a large economic and political superstructure that mitigated the impact of climatic hazards and stimulated the production and management of highly demanded eastern Mediterranean products such as oil and wine (Alcock, 2007). During this period, the landscape was deeply transformed by human impact, reflecting the dramatic growth of population and a well-structured land management typical of imperial economies. The cultivated trees (OJCV) peaked across the Southern Levant (Figures 6 and 7) and the olive-oil production occupied a very important role in the local economy as highlighted by the discovery of several heavy oil stone presses (cf. Ali, 2014; Safrai, 2003 [1994]; Waliszewski, 2014). The decrease of AP percentage (Figures 5–7) and the simultaneous increase of API and pastoral indicators (Figures 6 and 8) show the woodland clearance and the widespread of agriculture and an intensification of pasture. In particular, the very low percentage of AP at Chamsine and Aammiq reveal a heavy deforestation in favour of grazing activities (Hajar et al., 2010: 753–754; Figures 7 and 8).
Early and Middle Islamic period (ca. 1312–458 cal. yr BP/AD 638–1492)
After the end of the Byzantine hegemony, the Levant was dominated by the Arabs, and the region was characterised by a decrease of population that slightly recovered between 1200 and 1500 cal. yr BP without reaching the magnitude recorded during the Roman-Byzantine period. In the Early Islamic period, a sharp decline of cultivated trees (OJCV) accompanied by an increase of the evergreen shrubland (Quercus) is seen as evidence of forest regeneration and lowered human impact on the region (Figures 5–7). A decrease in the API and pastoral indicators suggests that not only agriculture but also herd-based economy was affected by a general decline of population and the collapse of the Roman-Byzantine economic structures (Figure 6). This trend occurred throughout the Levant and gradually slowed down in the Middle Islamic period (~1200–1500 cal. yr BP) when population started increasing again (Figure 8). The palaeoclimate records from Soreq and Jeita caves depict wetter conditions from ~1000 cal. yr BP onwards, after dry conditions between 1300 and 1000 cal. yr BP (Figure 6). The decrease of cultivated trees (OJCV) is not significantly correlated with climatic conditions (Supplemental Material 2: Tables S7 and S8, available online), while it shows a strong correlation with demographic proxies (Supplemental Material 2: Table S2, available online). In fact, the decline of cultivation seems to slightly precede the climatic changes and is probably more related to the Arab conquest and the social and rural instability (Izdebski et al., 2016b: 204–205; Leroy, 2010). In the end, the forest regeneration during the Islamic period could be the combination of decreased population and better climatic conditions.
Conclusion
This work has shown the socio-ecological trajectories occurring in the Levant across the Holocene. We adopted a multi-proxy and multi-scalar approach in order to assess if patterns of convergence and divergence between archaeological and environmental proxies (pollen and palaeoclimate records) vary at different geographical scales of analysis. The human footprint seems not to play a determinant role in the evolution of the early Holocene landscape that, instead, seems to be more affected by abiotic factors. Despite a demographic increase after the onset of the Holocene, perhaps favoured by wetter climatic conditions, the population density was fairly low if compared with later periods and the Neolithic communities may have been more vulnerable to climatic shifts. In the early Holocene, fluctuations in the percentage of arboreal pollen seems to be more related to climate change than to human activity. From the Chalcolithic onwards, the sharp increase of cultivated trees is positively correlated with demography, indicating more extensive farming to sustain a growing population. The late Holocene landscape is heavily anthropogenised and characterised by a large-scale agricultural and herd-based economy that caused a pronounced woodland clearance during the Hellenistic-Roman-Byzantine period. The late Holocene is also the period where the demographic trends appear to decouple from the climatic shifts given the advancements in technology and the extensive social and extensive networks of empires that geared the capability of local communities to deal with environmental stress. However, it is important to point out that in this study, we defined some general trends on a broad chronological scale of analysis. In addition, it is difficult to disentangle the interplay of human and environmental dynamics with a 200-year resolution. In fact, marked climate fluctuations occurred within shorter time spans and so human populations would have immediately responded and progressively adapted to those changes over similar sub-centennial timescales. In addition, the regional scale of analysis adopted in this study does not allow us to discern localised socio-ecological trajectories. A future research endeavour will be to analyse human population and environmental dynamics at a micro-regional scale in order to assess how social behaviour varies in different ecological niches. Furthermore, a comparative approach on a broader geographical scale will be useful to assess how the socio-ecological dynamics occurring in the Levant are interrelated with the surrounding regions such as Egypt, Central Arabia and the Northern Fertile Crescent. It is clear from the present work that while a wealth of archaeological data exist in the Levant, a higher number of palaeoclimatic and pollen data are required to provide a more even spatial and chronological coverage and guarantee a more accurate interpretation. This could be possible with future tighter ongoing interdisciplinary collaborations between archaeologists and natural scientists.
Supplemental Material
Supplemental_Material_1 – Supplemental material for Holocene landscape dynamics and long-term population trends in the Levant
Supplemental material, Supplemental_Material_1 for Holocene landscape dynamics and long-term population trends in the Levant by Alessio Palmisano, Jessie Woodbridge, C Neil Roberts, Andrew Bevan, Ralph Fyfe, Stephen Shennan, Rachid Cheddadi, Raphael Greenberg, David Kaniewski, Dafna Langgut, Suzanne AG Leroy, Thomas Litt and Andrea Miebach in The Holocene
Supplemental Material
Supplemental_material_2 – Supplemental material for Holocene landscape dynamics and long-term population trends in the Levant
Supplemental material, Supplemental_material_2 for Holocene landscape dynamics and long-term population trends in the Levant by Alessio Palmisano, Jessie Woodbridge, C Neil Roberts, Andrew Bevan, Ralph Fyfe, Stephen Shennan, Rachid Cheddadi, Raphael Greenberg, David Kaniewski, Dafna Langgut, Suzanne AG Leroy, Thomas Litt and Andrea Miebach in The Holocene
Footnotes
Acknowledgements
This work is the result of a workshop held in Mallorca in September 2017 under the umbrella of the Leverhulme Trust funded project ‘Changing the Face of the Mediterranean: Land Cover and Population Since the Advent of Farming’ (Grant Ref. RPG-2015-031), a Plymouth-UCL collaboration. We are grateful to Steven Savage and Thomas Levy for allowing us to use a large portion of data from The Digital Archaeological Atlas of the Holy Land (DAAHL; https://daahl.ucsd.edu/DAAHL/). Pollen data were extracted from the European Pollen Database (EPD;  ) and amalgamated from the work of data contributors. The EPD community is gratefully acknowledged and gratitude is given to Michelle Leydet (the EPD manager), and many data contributors who have made a valuable contribution to this research. We thank Alexander Kabelindde and Fayrouz Ibrahim for helping with the inputting and geo-referencing of the radiocarbon dates. This study is a contribution to the LandCover6k working group of Past Global Changes (PAGES), which in turn received support from the Swiss Academy of Sciences. We are also grateful to Joan Estrany and the University of the Balearic Islands for hosting a workshop on Mallorca during which much of this work was discussed.
Funding
This research was funded by the Leverhulme Trust (grant number RPG-2015-031) for the project ‘Changing the face of the Mediterranean: land cover and population since the advent of farming’.
Supplemental material
Supplemental material for this article is available online.
Notes
References
Supplementary Material
Please find the following supplemental material available below.
For Open Access articles published under a Creative Commons License, all supplemental material carries the same license as the article it is associated with.
For non-Open Access articles published, all supplemental material carries a non-exclusive license, and permission requests for re-use of supplemental material or any part of supplemental material shall be sent directly to the copyright owner as specified in the copyright notice associated with the article.
