
Abstract
The Sakarya River is among the largest fluvial systems of the southern Black Sea basin, draining most of NW Anatolia. The river crosses the high relief of the Pontide mountain range through successive narrow gorges and strike-slip basins formed by the North Anatolian Fault (NAF) System. We have investigated this fluvial record along the course of the main river channel at its lower reaches. The study site is located south of the Adapazarı Basin, ~50 km inland from the Black Sea, where remnant floodplains are preserved as a three-step terrace staircase resulting from continuous uplift to the south of the NAF. The combination of high resolution mapping with a detailed luminescence (OSL and p-IR-IRSL) and radiocarbon geochronology has shed light on changes in the level of the Black Sea and in the hydrological system during the late Pleistocene to recent. The last glacial period is represented by the highest terrace (T3) indicating deposition during marine isotope stage (MIS) 3 in between two low stands of the Black Sea. Following a long-term erosional period initiated prior to last glacial maximum (LGM), the initiation of the deposition (T2) was synchronous with the proposed catastrophic sea level rise of the Black Sea (cal. C14 9.3 ka BP) which continued throughout the Holocene until the Roman warm period (1.8 ka BP). The late-Holocene to recent morphological evolution of the region is marked with two sequential erosional and depositional (T1 and T0) periods, which can be correlated with the well-documented historical climate shifts affecting the hydrological system. These results reveal that the erosional and depositional periods on the Sakarya River floodplain are controlled by major sea level changes and climatically induced fluctuations in discharge and sediment supply.
Keywords
Introduction
River terraces are remnants of former river floodplains that are fossilized above present-day river channels, often in staircase systems (Bull, 2008; Pazzaglia, 2013). The formation of terrace staircases is attributed to both uplift (either tectonic or regional; e.g. Bridgland, 2000; Bridgland and Westaway, 2008; Demoulin et al., 2017; Lave and Avouac, 2001; Macklin et al., 2012; Olszak, 2017), climate and sea/base level changes (e.g. Blum and Törnqvist, 2000; Faust and Wolf, 2017; Schumm, 1993; Vandenberghe, 2002, 2003). Variations in the crustal movements and climatic conditions cause perturbations in the fluvial system, which, over time, lead to widening of valley floors, aggradation, and incision, thereby producing terraces (Pazzaglia, 2013) representing the complex response of the fluvial system (see the special issue edited by Cordier et al., 2017).
Climatic changes trigger fluctuations in fluvial regime and in sediment dynamics (e.g. Blum and Törnqvist, 2000; Macklin et al., 2012). Hydrological regime is controlled by the amount and type of precipitation within the drainage basin of the river, and influenced by plant cover on valley slopes, both determine fluvial processes leading to aggradation or incision (Faust and Wolf, 2017). Aggradation occurs when sediment supply exceeds river transport capacity, and incision in the opposite case. In contrast, climate transitions resulting in increased annual precipitation trigger a boost in river discharge causing valley deepening and floodplain abandonment (e.g. Blum and Törnqvist, 2000; Bull, 2008; Faust and Wolf, 2017; Macklin et al., 2012; Vandenberghe, 2002, 2003). Cyclic changes in global sea level during glacial/interglacial periods initiate aggradation/degradation phases especially close to coastal areas (Schumm, 1993). River incision creates terrace risers and isolates each terrace step, thus making terraces more evident in the landscape and forming valuable archives when their chronostratigraphical frameworks can be reconstructed (e.g. Rixhon et al., 2017; Wallinga, 2002). Consequently, initiation and duration of aggradation/degradation phases can be placed in the context of the Quaternary climate and sea level fluctuations. The mechanisms of terrace staircase formation or contribution and interaction of each variable are still under debate (Faust and Wolf, 2017), but they have potential to provide data on major shifts in the Earth system especially in regional settings.
Climatic variations on the longer glacial/interglacial are known to be very large in both amplitude and areal extent. These variations are studied with high resolution data from various types of geological archives which reflect the Earth system response at a global scale (Elias, 2017). In contrast, short term (e.g. millennial to centennial) climatic fluctuations (Alley, 2000; Bond et al., 2001) have been much smaller in amplitude and were often spatially incoherent (e.g. Wanner et al., 2008). After the onset of the current interglacial period (Holocene) warm and humid conditions prevailed in northern mid- to high latitudes, in between about 9 ka BP and 5–6 ka BP. This is evidenced by a remarkable increase in rainfall amount and intensity, and called the Holocene climatic optimum (Wanner et al., 2008). There are also Holocene rapid climate changes (RCCs) (Mayewski et al., 2004), which caused perturbations in socio-economic systems throughout the prehistoric period, especially in eastern Mediterranean and Middle East (Weninger et al., 2009). From those RCCs, the ones that occurred at 9.2, 8.2, and 4.2 ka BP are the best documented (Flohr et al., 2016; Göktürk et al., 2011). There is also evidence for the influence of other RCCs at around 6.0–5.2 and 3.1–2.9 ka BP; the latter is also known as late Bronze Age collapse and onset of dry and cold conditions during the Iron Age (Kuzucuoğlu, 2009), followed by the warm and humid Roman Period (~2–1.3 ka BP), the dry and cold Medieval Dark Ages (~1.3–1 ka), ‘Medieval Warm Period’, and at last the ‘Little Ice Age’ (Drake, 2012). Yet, there are certain uncertainties about spatial and temporal variations of these events as well as their effect on regional precipitation regimes and river-flow dynamics.
Late Pleistocene global sea-level changes (Spratt and Lisiecki, 2016), especially the ~120 m drop during the last glacial maximum (LGM), have significantly affected the coastal areas and adjacent fluvial systems to compensate for base-level change. As a consequence, the post-glacial sea level rise caused landward invasion of the sea which was later compensated by the river deltas thus reaching the current equilibrium. The episodes and rate of the sea-level rise since the LGM and relevant fluvial responses are quite well-known for ocean systems. Nevertheless, the post-glacial sea level history of the Black Sea has been one of the most interesting geological phenomena during the Holocene (cf. Yanko-Hombach et al., 2007 and references therein). The Black Sea, which is also the base level of Sakarya River, experienced major and well-documented changes during the late Pleistocene. Today’s large inland sea is connected with the Mediterranean by the narrow Bosphorus strait with a 65 m b.s.l. (meters below sea level) sill depth (Soulet et al., 2011). During the Pleistocene glacial periods, the Black Sea was repeatedly isolated from the global ocean and became a freshwater to brackish lake with its level related to the hydrological changes within the catchment (Badertscher et al., 2011). Therefore, during the last glacial period, Black Sea level changed independently and were reported to be down to a lowest stand (>140 m b.s.l.) during the LGM (Panin and Popescu, 2007). It is suggested that this last isolation was terminated with a catastrophic event at about cal. 14 C 9.3 ka/BP (known as the ‘flood hypothesis’ by Ryan et al. (1997)), which has been claimed to have direct impact on the prehistoric society causing migration and re-settlement (Ryan and Pitman, 2000). After extended research, the debate on the flood hypothesis still continues to reveal the complex history of sea-level change at the beginning of (cf. Giosan et al., 2009; Soulet et al., 2011; Yanchilina et al., 2017 and references therein), and also on small variations within, the Holocene (Fouache et al., 2012).
The current paper reports on data collected from the terrace staircases formed in the lower reaches of the Sakarya River, south of the Adapazarı Basin, NW Anatolia (Figure 1). A well-developed set of three terraces plus the recent floodplain has been investigated with extensive mapping surveys while the chronology is established using both luminescence (optically stimulated luminescence, OSL and infrared stimulated luminescence, IRSL) and radiocarbon dating. Precise relative positions and ages of the initiation and termination of depositional periods has helped us to enhance our understanding of the fluvial response to Black Sea level changes and regional climate from ~41 ± 2 ka to recent, and also provide insights on the uplift rate.
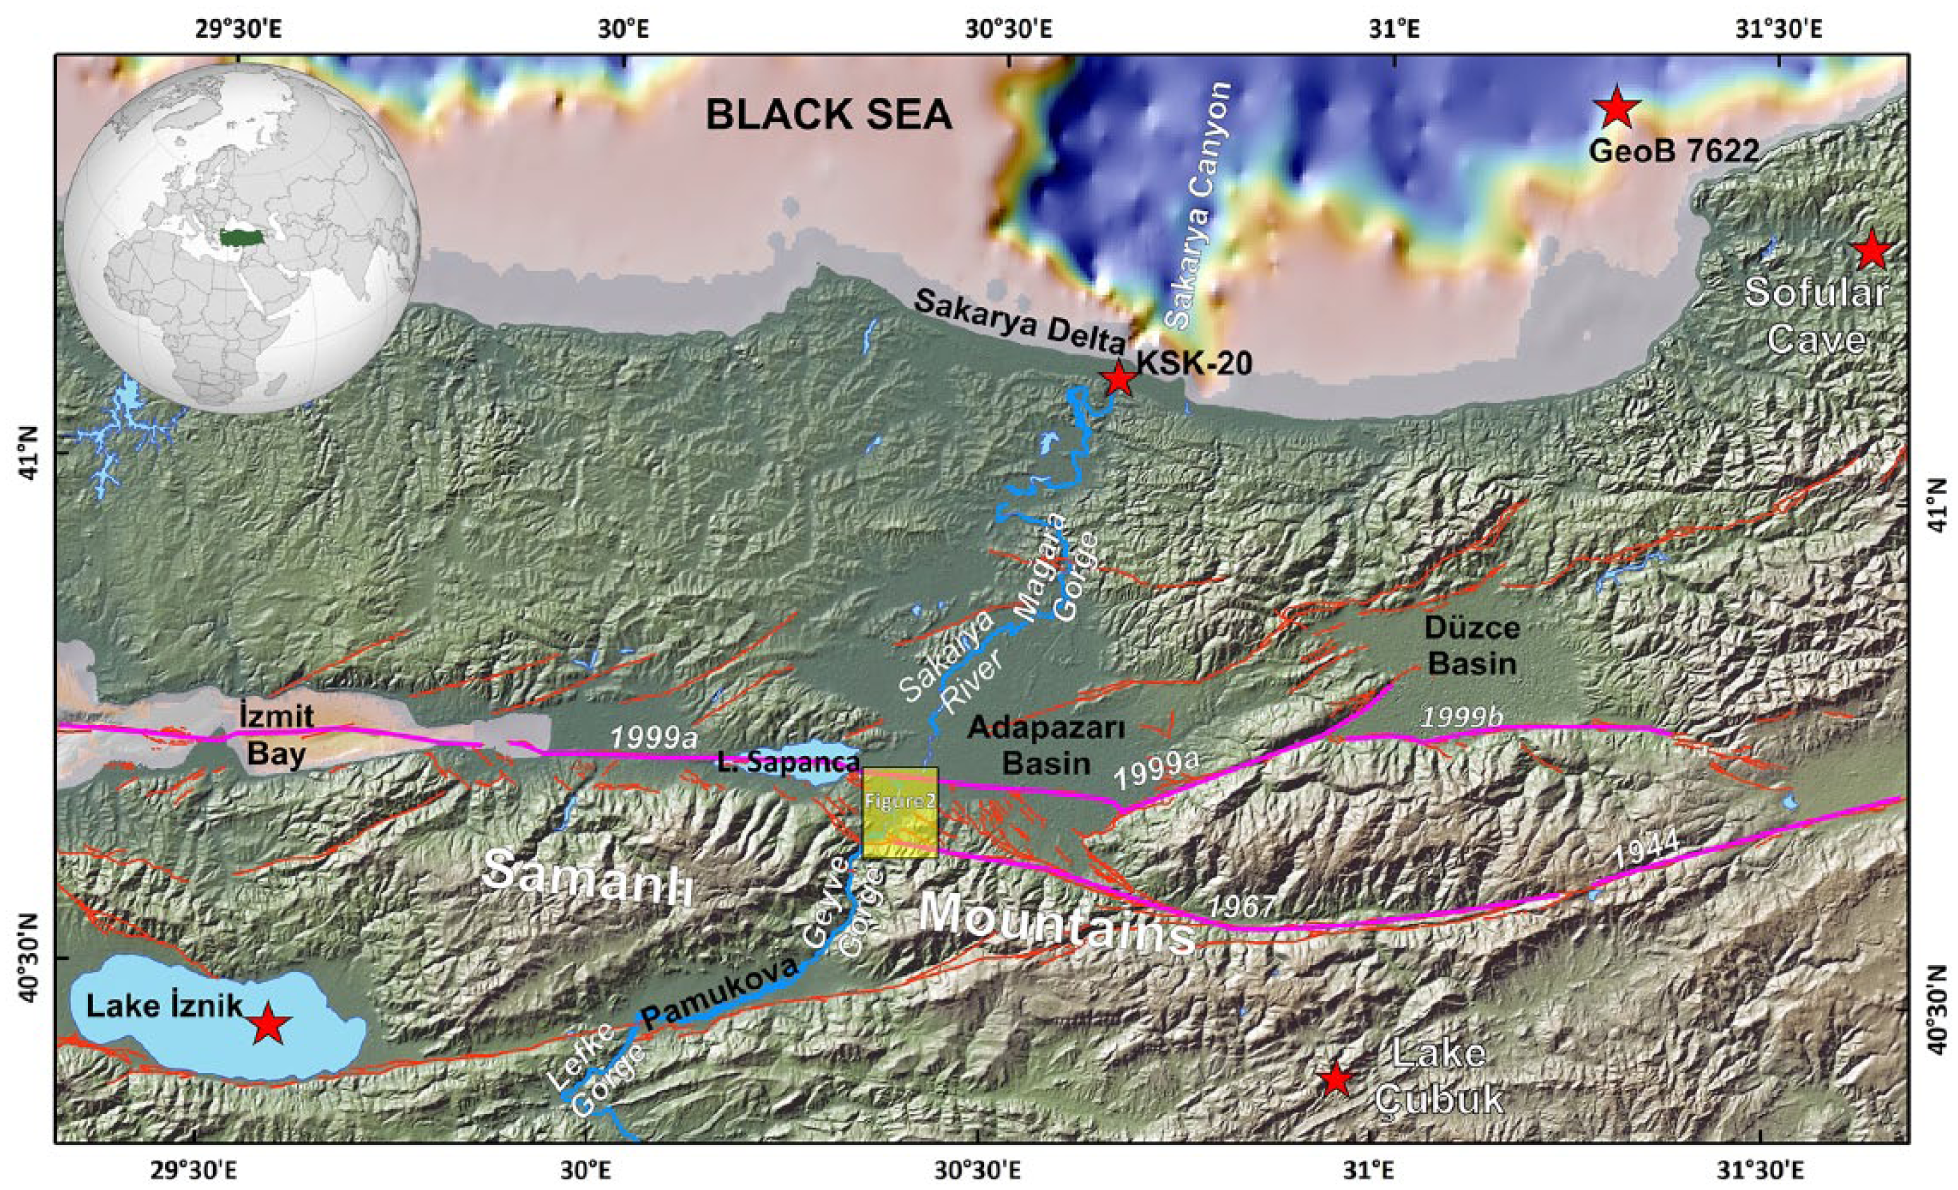
Physiographic map of NW Turkey and the location of the study area. Yellow shaded box indicates detail mapping represented at Figure 2. Red lines are active faults whereas purple lines represent surface ruptures along the North Anatolian Fault during the last 100 years (Dikbaş et al., 2018; Emre et al., 2018). Stars present the locations of the adjacent climate records (KSK-20, Görür et al., 2001; GeoB 7622 core, Lamy et al., 2006; Sofular Cave; Fleitmann et al., 2009; Lake İznik, Ülgen et al., 2012; Lake Çubuk, Ocakoğlu et al., 2016). Basemap adapted from GeomapApp software (Ryan et al., 2009).
Study area
The study site is located in the eastern Marmara region, south of Adapazarı Basin, NW Turkey (Figure 1). The general morphology of the region is marked by the high peaks of western Pontide mountain range (Samanlı Mountains, ~1800 m) and by significant tectonic depressions such as the Adapazarı and Pamukova basins, İznik and Sapanca Lakes, and İzmit Gulf, which are formed on the branches of the dextral strike-slip North Anatolian Fault (NAF) Zone (Figure 1). These basins are hydrologically connected to each other and with the Sakarya River and its major tributaries, which flow along significant and narrow gorges carved inside the high-relief mountains. The total drainage basin of Sakarya River has a total area of 63,343 km2, with mean (1953–2000) discharge at 124 m3/s, carrying ~12 million tons of suspended sediment load annually to the Black Sea (1963–1991; Ozturk, 1996). The climate of this catchment is classified as ‘Marmara Transition Zone’ between the Mediterranean and Black Sea climate regimes (Türkeş, 1996), with mean precipitation at 534 mm (Ozturk, 1996) and covers the CSa and CSb climate zones of the Köppen-Geiger classification (Öztürk et al., 2017).
Crossing the Adapazarı Basin (15 km in width and 10 km in length, with mean elevation ~30 m), and passing through the Mağara Gorge for some 50 km, the river meets the Black Sea forming the narrow Sakarya Delta (Figure 1). Here, the continental shelf is very narrow and the effect of sea-level changes reflects in the high relief of the Sakarya Canyon carved in the floor of the Black Sea (Algan et al., 2002; Görür et al., 2001).
First mapped in detail by Bilgin (1984), the terraces between Boğazköy and Arifiye (Figure 2) provide one of the most well-known best fluvial records in Turkey. The terraces have been re-visited by Demir et al. (2004), who attributed terrace formation to marine isotope stages (MIS), although without any age control. The terraces were later grouped under the late Pleistocene Kirazca formation by Doğan (2004). The terrace treads sit unconformably on the early-middle Pleistocene Karapürcek formation (Ünay et al., 2001) which is formed of fluvial clastic sediments, expressing the initial development of the Adapazarı tectonic basin. The bedding of the Karapürçek formation can be observed as tilted ~20° southwards implying that there has been recent tectonic activity. This was caused by movement of the NAF, which has recently ruptured with an Mw: 7.3 earthquake (August 1999) forming 140-km-long surface rupture with max 5.1 m dextral slip (Barka et al., 2002). The horizontal slip rate of the NAF in the study area is constrained at 22.2 ± 3 mm/yr within the last 1000 years (Dikbaş et al., 2018).
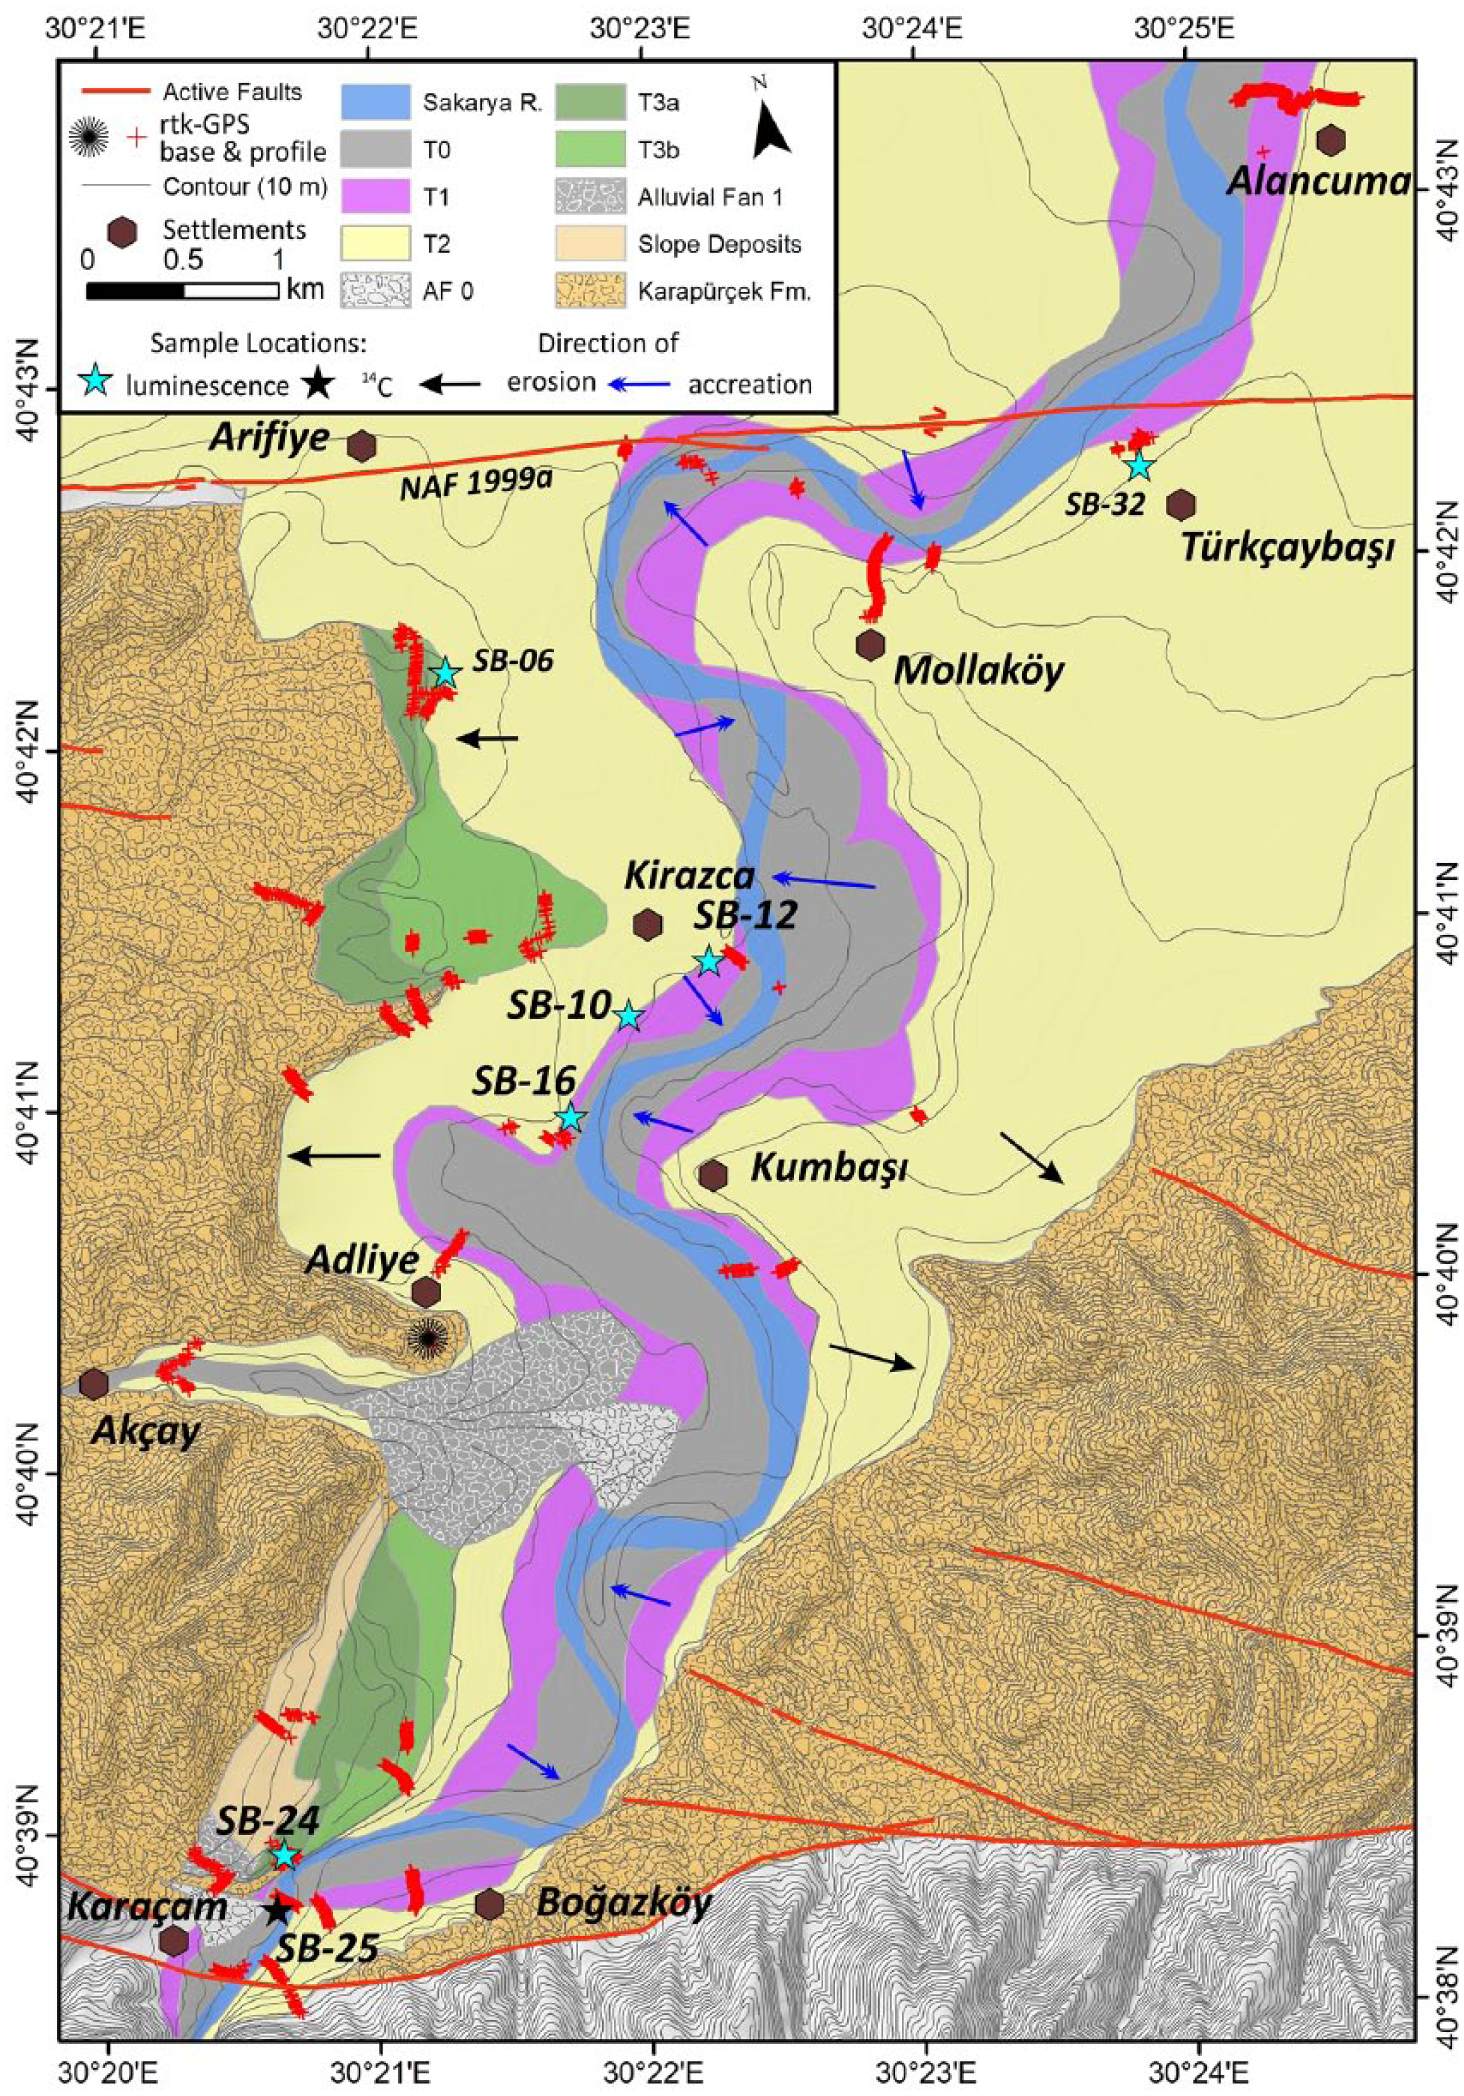
Quaternary geological map of South of Adapazarı Basin between Arifiye and Boğazköy, showing the distribution of terrace staircases and rtk-GPS profiles. Stars represent section/sample locations Active faults are from Emre et al. (2018).
Methodology
Mapping
In order to understand the late Pleistocene-recent evolution of the Sakarya River, we focused on fluvial terrace staircases and alluvial fans between the outlet of Geyve Gorge (Boğazköy Village) in the south and Arifiye to the north (Figure 2). Field surveys based on previous maps (Bilgin, 1984; Doğan, 2004) and 1/25k topographic maps (1990) helped us to pinpoint the terrace surfaces and sections representing depositional architecture. Morphologically, terrace levels form broad low sloping surfaces easily separated from each other with reference to the distinct difference in relative height. Natural and artificial sections of the depositional layers were carefully inspected and measured, in order to understand changes in sedimentary facies both laterally and vertically.
For precise measurement and construction of the 3D spatial distribution of the terrace staircases, we employed real-time kinematic (RTK) GPS accompanied by UAV-based aerial photogrammetric surveys. These methods enabled us to construct high (cm) resolution topographic profiles and digital elevation models.
Figure 2 represents the results of the mapping survey, rtk-GPS profiles, sample/section locations, terrace classification and distribution within a combined Quaternary geology map. We should note that the original course of the Sakarya River and most of its floodplain have been completely destroyed by sand mining during the last 30 years in the study area (Okur and Erturaç, 2018). Therefore, we used georeferenced 1973 KH-1 imagery and the topographic map (1990) for digitizing the river course and contouring the borders of terrace levels. The map represents the pre-sand mine era for the study area. Migration of the meander belts of the river is also evident from the mapping where black arrows indicate the direction of late Pleistocene incision (black) of the Karapürçek formation and the T3 terrace level. The blue arrows indicate lateral accretion (blue) during the late-Holocene (Figure 2).
Dating
In order to construct the depositional history of Sakarya terraces, luminescence protocols were applied to both pure quartz (OSL) as well as K-Feldspar (IRSL) crystals; moreover, radiocarbon dating was applied when appropriate organic material was available. Luminescence dating of mineral grains is a measure of the time between the last light exposure (during grain transport), and sample retrieval from the site (after the burial period, when the grains are shielded from further light exposure) (Aitken, 1998). The accuracy and precision of luminescence dating have improved considerably in the past decade with refinements to single aliquot regeneration (SAR) protocols, to measure the burial time of quartz (OSL) and K-feldspar (IRSL) grains spanning the past 150 ka (e.g. Duller, 2012; Murray and Wintle, 2003; Wintle and Murray, 2006) for OSL and even further back in time for post IR-IRSL (p-IR-IRSL hereafter, Li et al., 2014; Li and Li, 2011; Thiel et al., 2011). The reliability of luminescence for dating fluvial sediments has been addressed in several previous studies (e.g. Wallinga (2002) and Rixhon et al. (2017) and references therein), but there are yet very few applications in Turkey and even fewer for fluvial sediments (e.g. Erturaç and Kıyak, 2017; Kiyak and Erturaç, 2008; Van Gorp et al., 2013). Within the scope of this study, we sampled 11 locations, 10 for luminescence and 1 for radiocarbon dating.
Sampling
To achieve optimum sample quality for luminescence dating, we targeted low energy and laterally continuous sedimentary facies, preferably laminated fine (silt to fine sand) grained layers to avoid partial bleaching of crystals and consequently high dispersion values. The section was cleaned and sampling was achieved by hammering light-proof black PVC or rust-proof stainless metal tubes (7.5 cm width and 20 cm long) in to the section. Both ends of the tubes were sealed by using aluminum foil, wrapped using black PE bags, and sealed with opaque duct tape to avoid further light exposure. The stratigraphic position, sedimentary composition, organic content, and humidity are noted. The geographic location and depth from the surface of the sample were measured with rtk-GPS.
Mineral separation
The luminescence sample tubes were opened in safe-light conditions (Red LEDs illuminating at a dim 620–640 nm wavelength). The bulk sediment removed from the tips of the tube was used for humidity measurements and geochemical analysis of radioactive elements (U, Th, K, and Rb) to determine the environmental dose rate. The geochemical analysis was carried out at an accredited ALS laboratory, using Inductively Coupled Plasma–Mass Spectroscopy (ICP-MS) for trace elements (ALS Code: ME-MS81) and Inductively Coupled Plasma–Atomic Emission Spectroscopy (ICP-AES) for major oxides (ALS Code: ME-ICP06), to determine the environmental dose rate. The remaining bulk sediment was first treated using HCl and H2O2 (10%) to remove carbonates and organic material. Neodymium magnetic rods were used to separate magnetic minerals. Wet sieving was applied (mesh sizes, 60, 90, 140, 250 μm) to isolate the 90–140 μm fraction. Heavy liquid separation of the sediments was performed using the sodium–polytungstate solution with measured density (2.62, 2.7 g/cm3) to isolate quartz and heavy minerals (apatite, zircon). Na-Feldspars are separated as the fraction between 2.58 and 2.62 g/cm3 and the fraction below 2.58 g/cm3 is accepted to be K-Feldspar in majority. The quartz grains were then immersed for 40 min in HF (40%) to etch the outer ~10 μm, which can be affected by alpha radiation. Later they were rinsed in HCl (37%) to remove any insoluble fluorides formed after the treatment with HF. Petrographic investigation of the heavy liquid separated mineral populations was carried out with Leica EZ4 HD binocular microscope. Examination of the quartz populations revealed that more than ~85% of the grains showed clear transparent quartz grains with conchoidal fracture; the rest was opaque white-orange crystals interpreted as quartzite grains. The K-Feldspar population showed ~85% of the grains to be orange to white in color, semi-transparent, and with apparent cleavage; the rest of the population is a mixture of transparent quartz and white quartzite grains. The purity of the quartz populations is also been examined using an IR-test (Infrared/blue stimulated luminescence ratios < 1% (cf. Murray et al., 2015).
Selection of protocol and equivalent dose (De) measurements
In order to obtain a reliable chronology, using the SAR protocol of luminescence dating (Murray and Wintle, 2003), we applied the fundamental tests to inspect the nature of luminescence signal in separated mineral crystals. The aliquot size was 5 mm which corresponds to 500–1000 mineral grains within the selected 90–140 μm sediment fraction. All measurements were performed using Risø TL/OSL Reader DA-20 equipped with 90Sr/90Y (0.13 ± 0.04 Gy/s) source installed in Ankara University, Institute of Nuclear Sciences, Luminescence Research and Dating Laboratory. We calculated the fast component in the initial part of OSL signal (Durcan and Duller, 2011). The results of the tests reveal that five of nine samples emitted a bright OSL signal with a reliable fast component ratio, suitable for OSL dating. In four samples, the OSL signal from quartz crystal had a considerable amount of slow component so we employed Post-IR50IR225 protocol (all indexes indicating measurement temperatures, Thiel et al., 2011) to pristine K-feldspar crystals. The successful application of the applied protocols with the specific corresponding parameters was further checked by a dose recovery test, which includes two room temperature optical stimulations for 200 s, in order to bleach the aliquots, with a 10 ks room temperature storage in between. Afterwards, each sample was given a laboratory β dose, selected to be of the same order of magnitude as the equivalent dose estimated by the double SAR analysis. This dose was further treated as an unknown, and the same protocols were then applied using the same regenerative doses and measuring parameters. Dose recovery results indicated that for all aliquots, the ratio of the measured to given dose is within ~11% of unity. Dose recovery tests were applied to only one sample.
Equivalent Dose (De) measurements were performed using selected stimulation techniques (OSL and Post-IR IRSL) within the SAR protocol. We programmed 6 SAR cycles to be applied to each aliquot, with increasing artificial doses to achieve dose response curve, each calibrated for sensitivity with a test dose as described in detail by Murray and Wintle (2003). The doses were selected in order to bracket the De. The investigation of the luminescence signal from quartz (Preheat200, IR and OSL110) and K-feldspar (TL220, IR50, IR225, all indexes indicating temperatures) crystals was carried by programming a single SAR cycle to measure natural signal and response to an applied dose. Individual De values were accepted based on the following acceptance criteria: recycling ratio between 0.90 and 1.10, recuperation < 12%, dose recovery within ± 11% uncertainties, ability to recycle and recover a laboratory attributed dose, limited IR response at room-temperature, and presence of a fast OSL component (the latter two especially for quartz). For the majority of the measured aliquots, these criteria were fulfilled. Integration limits were selected for the first 5 s for luminescence signal and last 100 s for background illumination for the fast component of OSL, and the first 10 s for luminescence signal and last 50 s for background illumination for the p-IR-IRSL protocol.
Results
Systematic of terrace staircases
The thicknesses, relative positions, and simplified sedimentary architecture of the Sakarya River terrace staircases are summarized within a synthetic profile (Figure 3). This profile is constructed for the center of the study area, showing relative elevations (above the recent floodplain) of the terrace surfaces. We identified a three step terrace staircase, in which risers reach +22 m (T3), +10 m, (T2), and +3 m (T1) above the recent floodplain. Thanks to the sections created by the considerable sand mining in the study area (Okur and Erturaç, 2018), we were able to measure the thickness and the sedimentary structures of the recent floodplain (T0). The thicknesses of the depositional terraces are limited to 5–10 m and reveal a uniform sedimentary architecture (Figure 3). At the base, a thick (2–3 m) bedload with blocks up to 20–30 cm in diameter is observed. The thickness of this facies decreases to the north. Grain size continuously fines upward progressively where the terrace ends with 1- to 2-m-thick silt-fine sand and silt layer, which is observed to be both homogeneous and intercalated with dark brown, clay rich laminae. The direct contact of the T3 terrace with Karapürçek formation is visible along the river, enabling us to measure the channel slope prior to deposition (~0.21%).
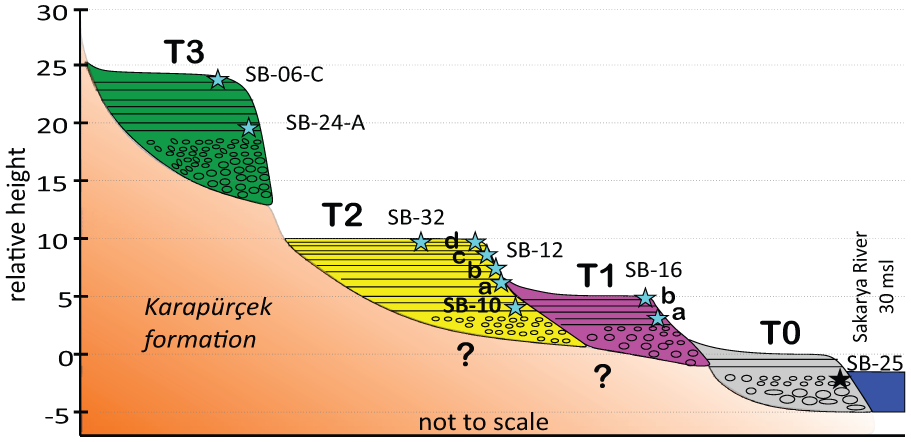
Synthetic profile of the Sakarya River terraces showing their relative height above the recent floodplain. Stars indicate the position of luminescence (blue) and C14 (black) samples.
All terrace surfaces tend to decline toward the north where T3 level is not observed to the north of the NAF. At Alancuma village, the T2 riser is positioned at +3.7 and the T1 at +1.7 m (Figure 2). The slope of the T2 terrace to the south of the NAF is measured as 0.05–0.1%, while it steepens in the vicinity of the fault to 0.24% and coincides with the Adapazarı plain to the north of the NAF.
Terrace chronology
We applied the OSL and post IR-IRSL techniques to 10 samples (T3: 2; T2: 6 and T1: 2 samples) to reveal the depositional history of the Sakarya terraces. De values were measured from 16 disks from each sample using the SAR protocol. The measurements were evaluated with Radial Plotter (Vermeesch, 2009) software to statistically analyze and visualize the distribution of De values (Figure 4). All variables and results required for the age assessment of all samples from the present study are presented in Table 1. As described in detail by Galbraith and Roberts (2012), determination of De using central age model (CAM) can be reliable only if the dispersion (OD) value of measurements lies within an acceptable range (20–30% maximum) which was applicable to seven of our samples. For the majority of the samples (these aforementioned seven samples), both the radial plots of Figure 4 as well as the error values presented in Table 1 provide strong arguments regarding the effective bleaching of the corresponding grains. A total of 28 aliquots were measured for the two samples with high OD, along with the Finite Mixture Model (FMM, Galbraith and Roberts, 2012) calculated by the radial plotter software (Vermeesch, 2009 after Galbraith, 2005) to separate De populations. After removal of the outliers (3 disks), the number of aliquots is very close to the number suggested by Rodnight (2008) for the application of more complex models in cases of heterogeneous bleaching. Environmental and cosmic dose rates (Dr) and OSL ages for each sample were calculated using the Dose Rate Calculator (DRc, Tsakalos et al., 2016) software. The dose rate derived according to this software also includes the contributions from cosmic rays and internal beta dose rate for the cases of feldspathic minerals. The low g values that have been measured for the case of pIR50 IRSL225 justify the use of the specific stimulation mode.
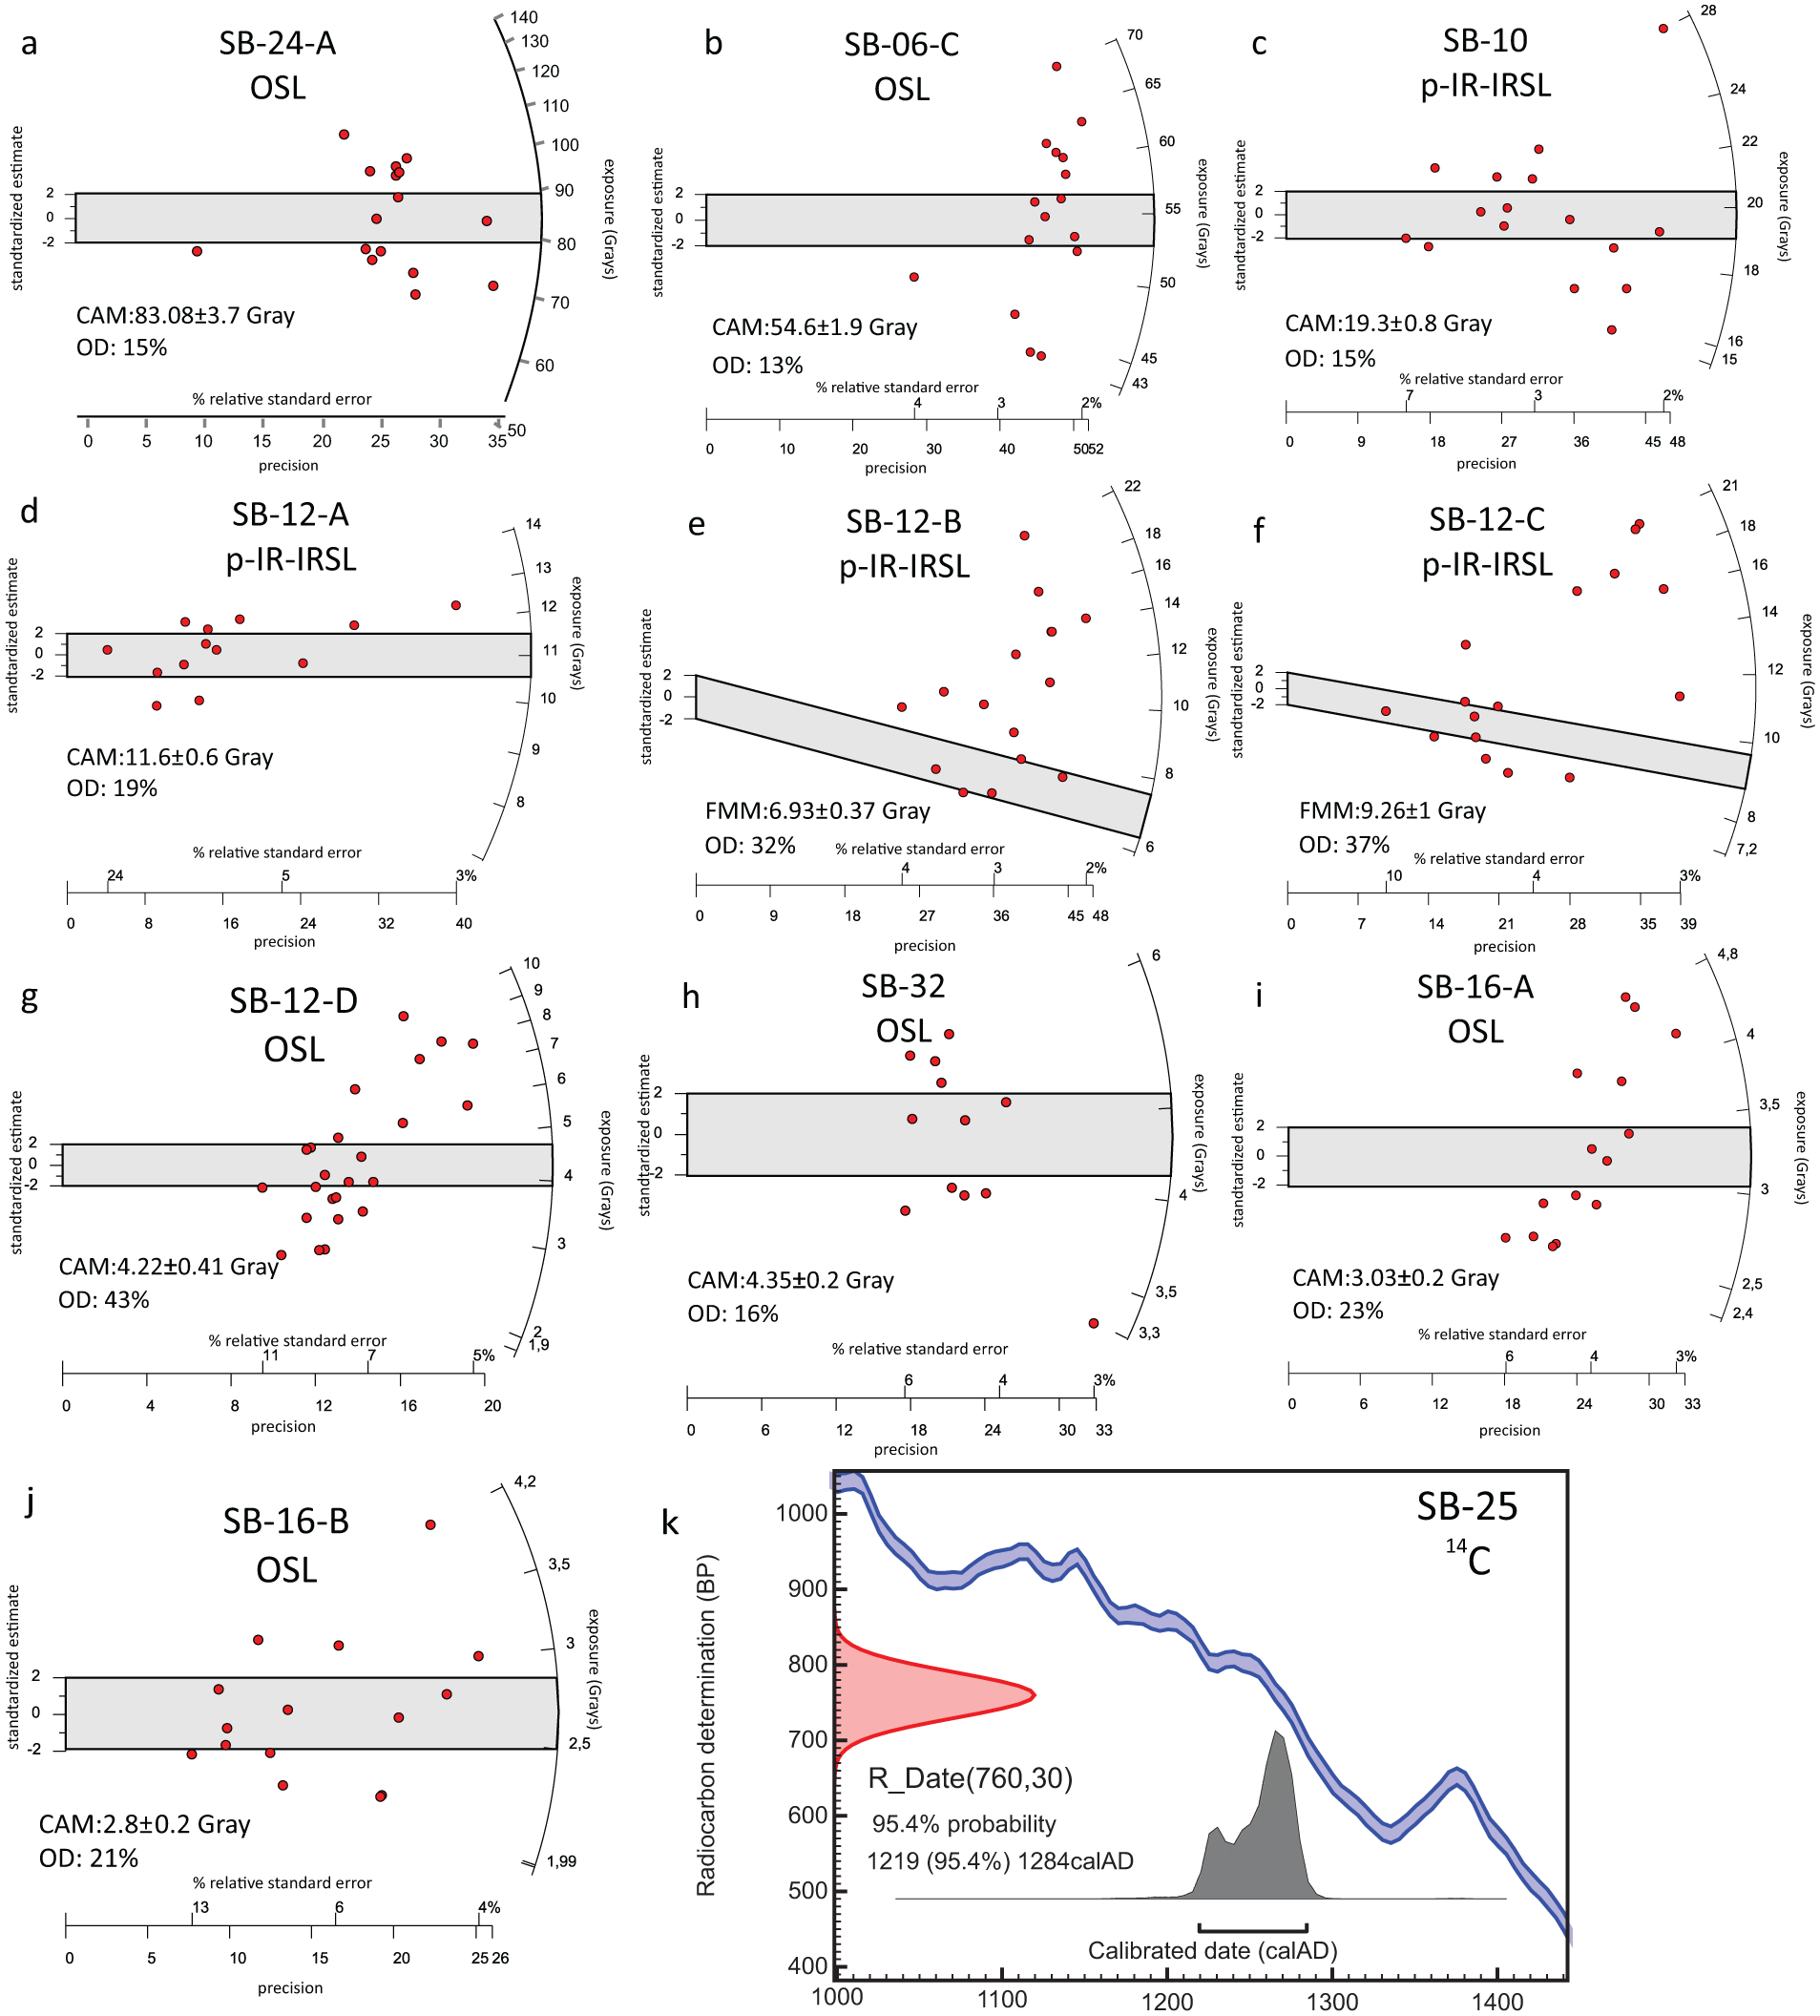
(a-j) Radial distribution of equivalent doses measured from 10 luminescence samples and (k) OxCal calibration graph of the radiocarbon (14C) age of the SB-25 wood sample.
Details on the 10 luminescence dates used in this study.

LAT: latitude; LON: longitude; Z: elevation above mean sea level; Depth: relative position of the sample below surface; Luminescence Protocol: OSL, TL220, IR, and OSL110 (quartz crystals), P-IR-IRSL TL220, IR50, IR225 (K-feldspar crystals); CAM: central age model; FMM: finite mixture model; OD: over dispersion; U: uranium; Th: thorium; K: potassium; Rb: rubidium; H20: water content.
g values for feldspars due to Huntley and Lamothe (2001). Equivalent doses of K-feldspars were corrected related g values.
Two samples from the middle and uppermost level of the T3 terrace deposits (SB-24-A and SB-06-C) are dated as 41.10 ± 1.83 ka and 30.04 ± 0.2 ka, respectively. These dates constrain the deposition history and also pre-date the initiation of LGM erosion. The rest of the OSL ages are confined within the Holocene and are compatible with each other in terms of their relative positions. Dating the T2 terrace was possible by using six luminescence samples (Figure 3). While sample SB-10 represents the base of the floodplain deposits (9.04 ± 0.4 ka), samples SB-12 A; B; and C were taken evenly upward through the section (4.95 ± 0.4; 4.02 ± 0.4; 3.84 ± 0.3; 1.83 ± 0.2 ka, respectively). The uppermost samples from the T2 level, which reflects the termination of the depositional period, are SB-12-D and SB-32 (Figures 3 and 4). These samples were taken from approximately the same position (just below the soil level) and exhibit very close facies similarity (homogeneous very fine sand and silt). Sample SB-12-D shows a high (43%) dispersion from 24 measured disks. The determination of De varies with minimum age (2.14 ± 0.27) and central age (4.22 ± 0.41 Gy) models. Although it is suggested that the MAM determination in such cases should be chosen, the result is not compatible with the ages (SB-12-A; B; C) obtained within the same terrace section (Table 1). Sample SB-32 yielded a 16% dispersion value and was suitable for CAM determination of De (4.35 ± 0.2 Gy). This value is close to CAM determination of De from SB-12-D and the calculated ages are compatible with each other (Table 1). Therefore, for this individual case, we applied the CAM to a sample showing relatively high dispersion value. The T1 terrace is dated by two sequential samples (SB-16-A; B) revealing a short depositional period in between 1.1 and 1.0 ka.
A single specimen from a 2-m-long intact tree trunk (SB-25-C14), buried within the bedload of the T0 level, was dated with AMS 14C (Poznan Radiocarbon Lab.) to 760 ± 30 yr BP. This age was calibrated with OxCal (Ramsey, 2009) to cal. AD 1219 to 1284 (Figure 4k) and stands for the only organic material that could be dated with this method.
Discussion
According to the chronology of the terrace staircases of the Sakarya River between Boğazköy and Arifiye, we can identify four distinct erosional and depositional periods. Notwithstanding any tectonic uplift, these periods are interpreted as reflecting major and also multicentennial-scale hydrological changes in the environment, such as the Black Sea level and regional climate. In order to test our assumption and question the integrity of the dates, we correlate our conclusions with the paleoclimate records within the region (Figures 5 and 6).
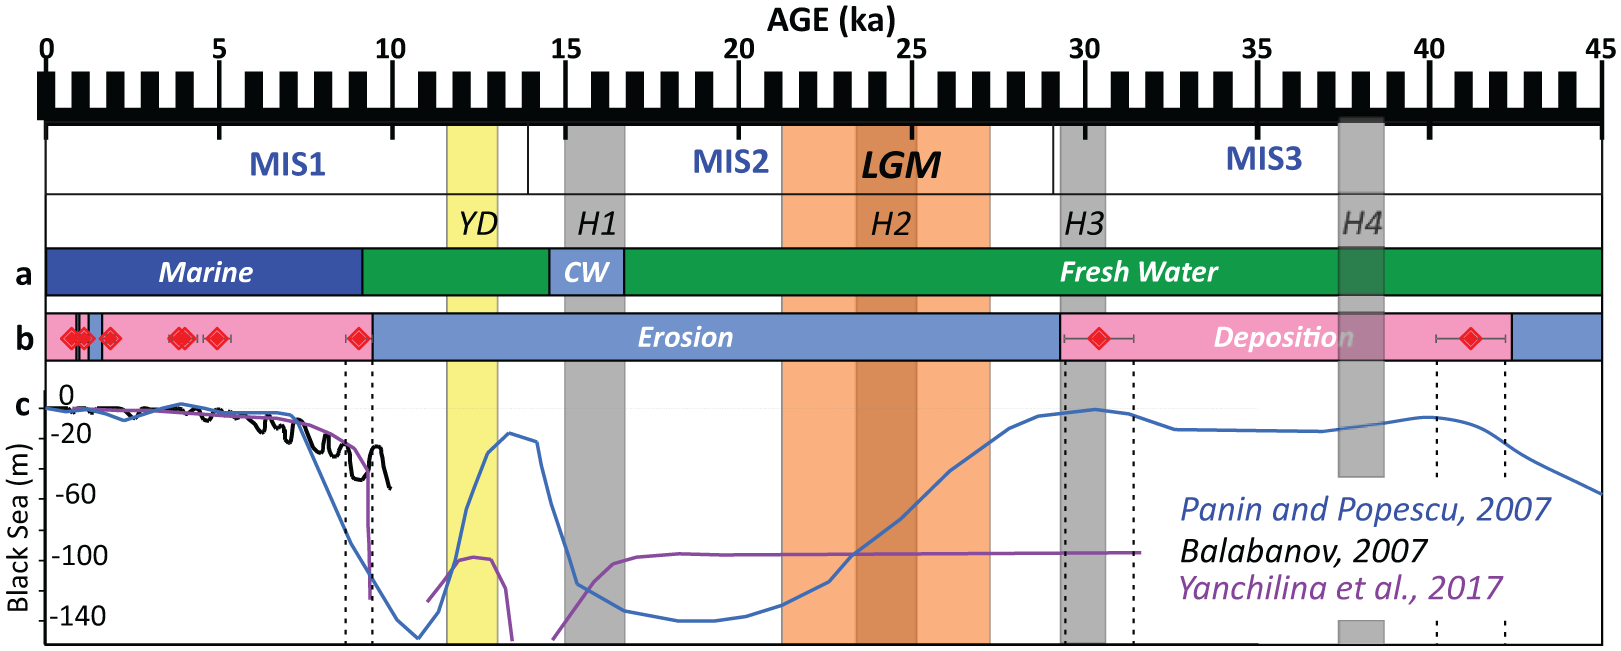
The correlation of the Sakarya terraces with the properties of the Black Sea during the last 45 ka: (a) Changes in salinity of the Black Sea (Badertscher et al., 2011) during the last glacial period from fresh water to marine and also intrusions of Caspian Sea waters (CW), (b) erosional and depositional periods observed in the Sakarya River terrace staircases constrained by luminescence ages, and (c) Black Sea level curves (Balabanov, 2007; Panin and Popescu, 2007; Yanchilina et al., 2017). Timing of Heinrich events is from Hemming (2004).
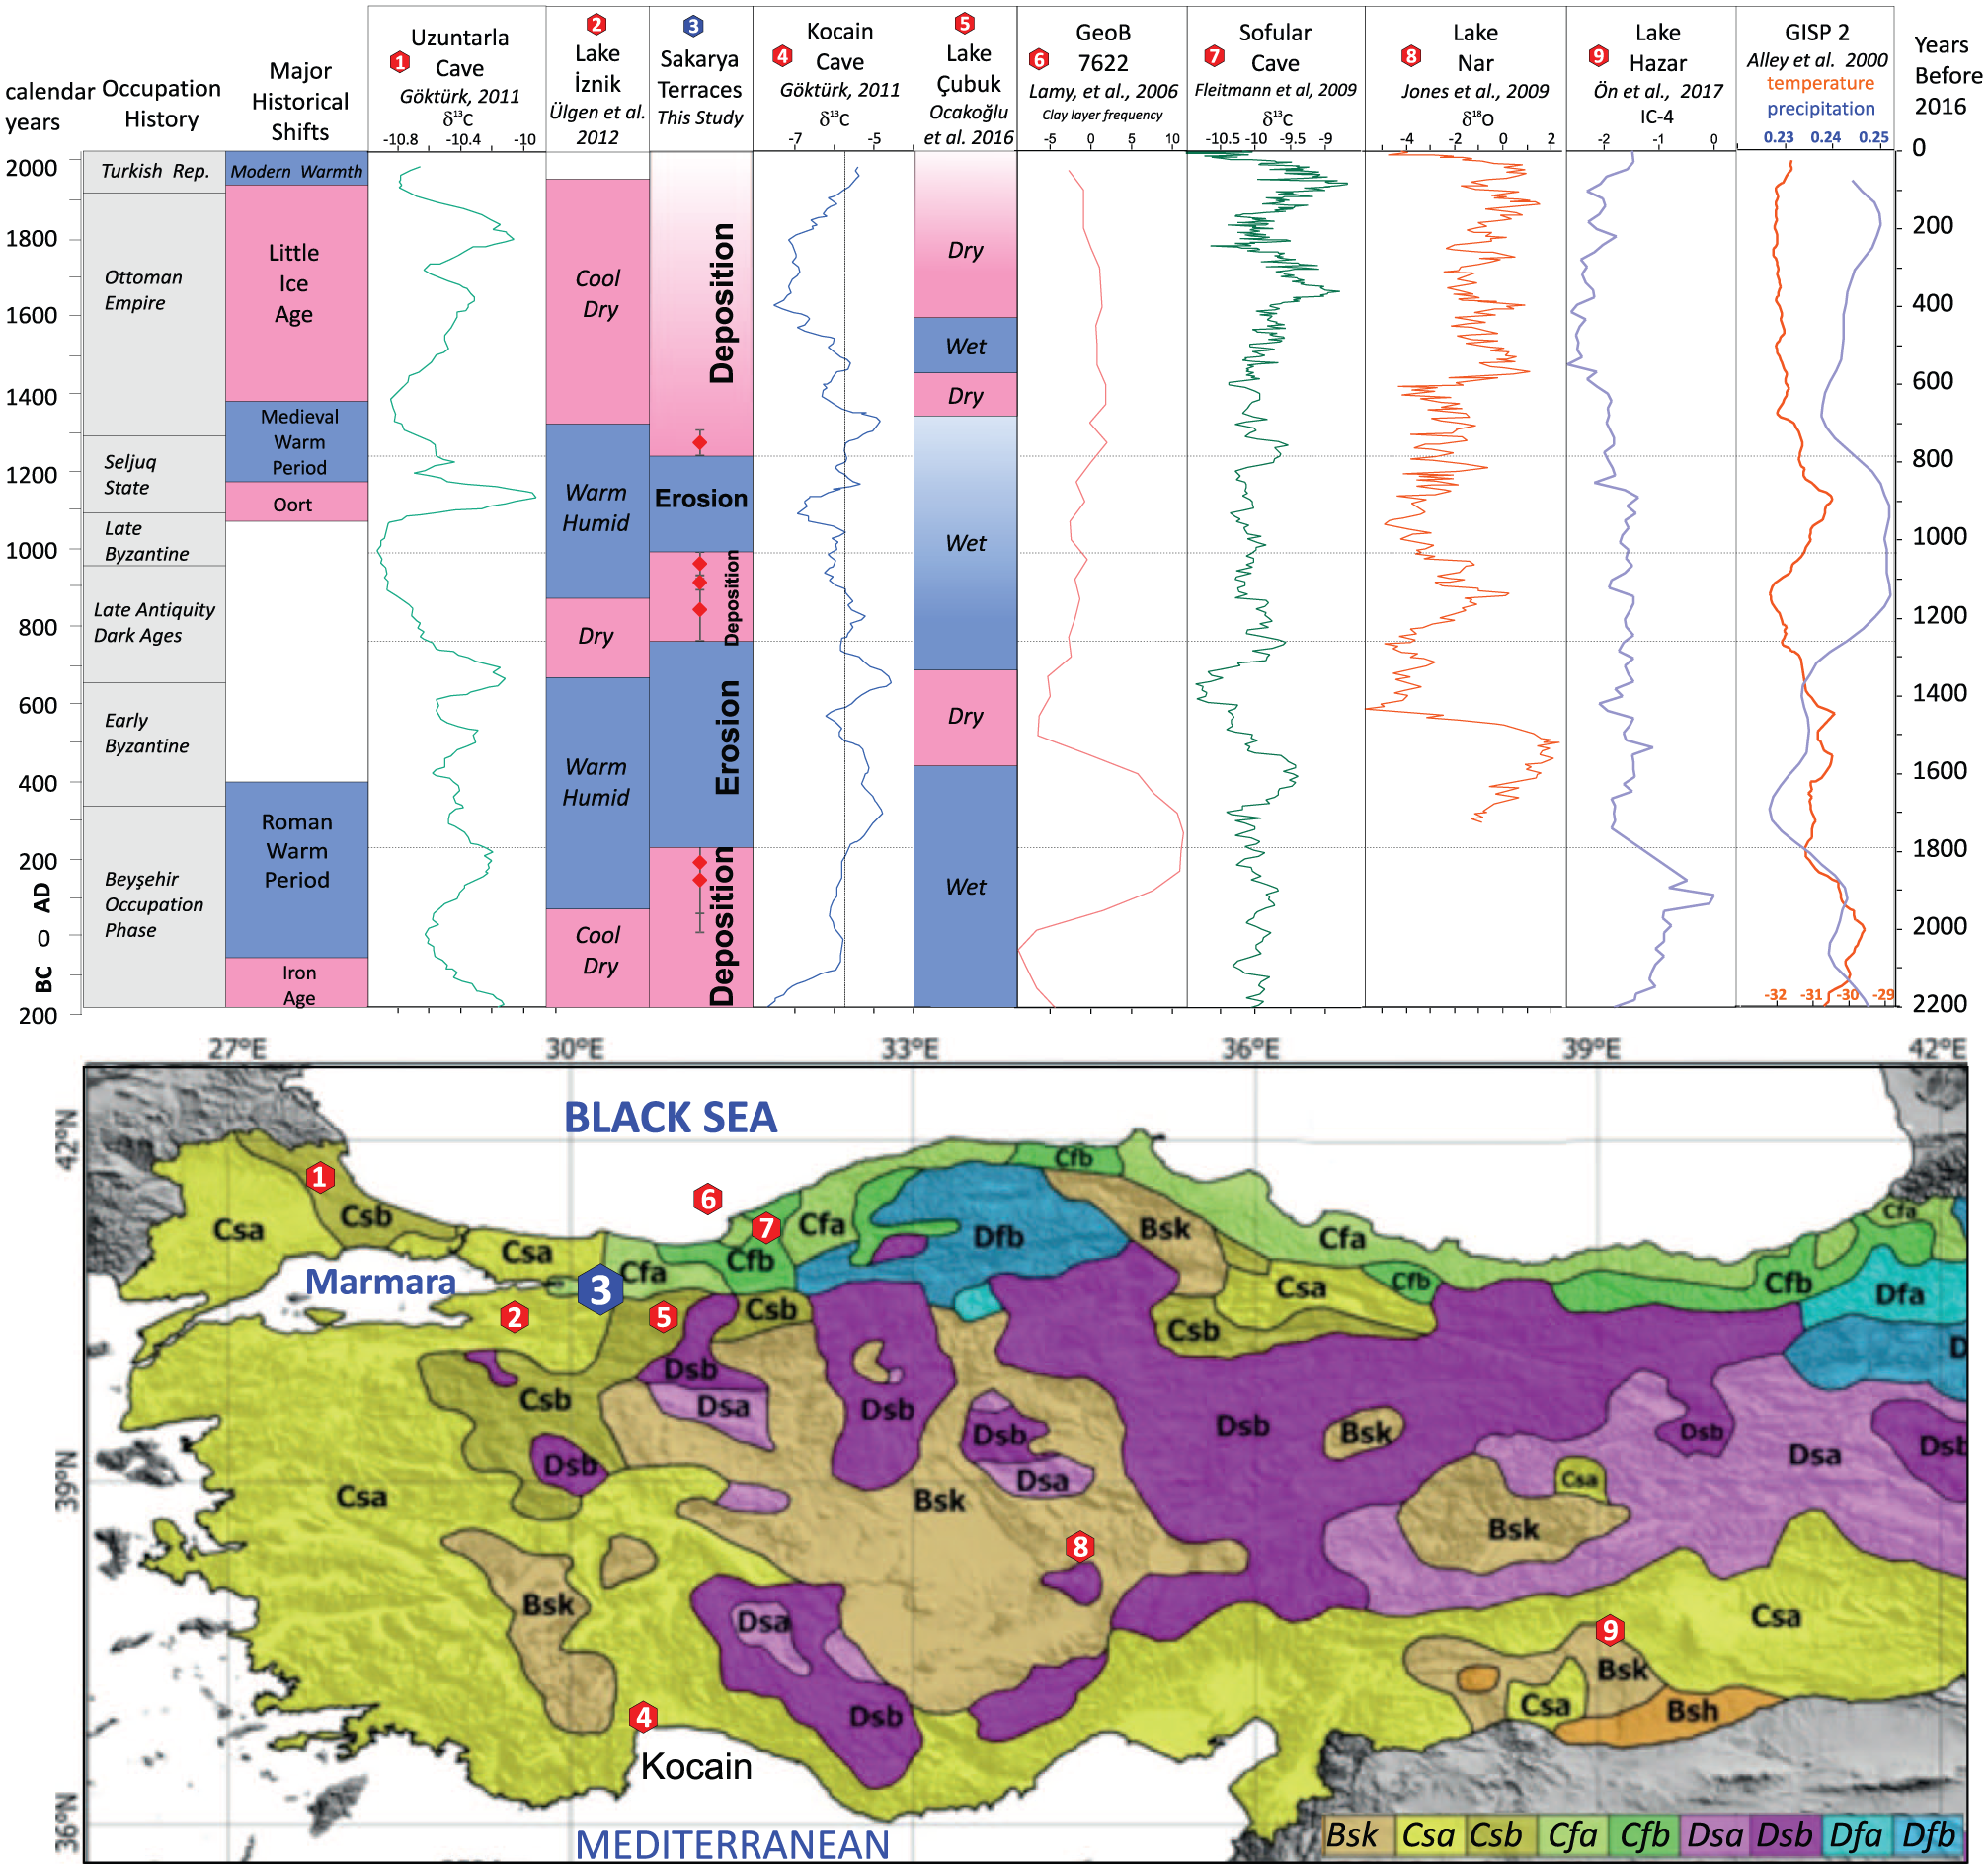
Comparison of the results of this study with other paleoclimate studies concerning the last 2.2 ka. The left axis is calendar years and the right axis is years before present (2016). From west to east: (a) δ13 C record from Uzuntarla Cave stalagmite (Göktürk, 2011); (b) climate interpretation from Lake İznik cores pollen and chemical data (Ülgen et al., 2012); (c) depositional and erosional periods observed at Sakarya River during late-Holocene and ages; (d) δ13 C record from Kocain Cave stalagmite (Göktürk, 2011); (e) climate interpretation from Lake Çubuk (Ocakoğlu et al., 2016); (f) Clay layer frequency from GeoB 7622 core (Lamy et al., 2006); (g) δ13 C record from Sofular Cave stalagmite (Fleitmann et al., 2009); (h) δ18O record from Nar Lake (Jones et al., 2006); (i) IC-4 Precipitation record from Lake Hazar (Ön et al., 2017). Locations of the sites are draped over modified Köppen-Geiger climate classification of Turkey (Öztürk et al., 2017). Ages are calibrated to luminescence ages (before 2016) used in this study.
Latest Pleistocene (~41–30 ka) deposition
The initiation of deposition of the T3 terrace is dated prior to 41.10 ± 1.83 ka (SB-24-C) from a silty fine sand bar just above thick bedload deposits. The deposition continued until 30.04 ± 1 ka (SB-06-C) dated from the fine floodplain deposits. Terrace formation correlates with the MIS3 high stand (Surozhian; Panin and Popescu, 2007) in between two significant declines: first the ~100 m drop at ~MIS4 (post-Karangatian; Panin and Popescu, 2007) and next the Neoeuxinian phase (Panin and Popescu, 2007).
Latest Pleistocene-early Holocene (~30–9 ka) erosion
The termination of deposition and immediate incision of the T3 terrace correlates well with the reported significant fall (~140 m b.s.l.) in Black Sea level (Figure 5c, Panin and Popescu, 2007). This major base level change clearly forced the river to abandon its floodplain at that time (T3) and incise into the basement for at least 25 m (Figure 3) through the LGM to early Holocene. The morphological imprint is very clear at the study area, where the river formed large sinusoidal bend while incising through the bedrock (Figure 2). During this period, the amount of vertical incision exceeded 35 m in the main river channel in the Karasu Delta (Borehole KSK-20; Görür et al., 2001).
9–1.8 ka, continuous deposition
The initiation of formation of the T2 terrace is dated at 9 ± .0.4 ka (SB-10) just above the bedload and was continuous until ~1.8 ka (SB-12-D; SB-32). This timing is quite well correlated with the timing of Mediterranean water invasion (Badertscher et al., 2011) and the abrupt rise in the level of Black Sea (Ryan et al., 1997; Ryan and Pitman, 2000), which was calibrated recently to 9.0 (Soulet et al., 2011) to 9.3 ka BP (Yanchilina et al., 2017). Considering the amount of erosion in the Adapazarı Basin during the LGM to early Holocene, we can assume that the abrupt rise in the sea-level caused significant intrusion of the sea toward inland. This possibly acts as a barrier against the increased flow of the Sakarya River. This would explain the high relative position of the T2 terrace (+10 m) at the study site. This period also corresponds to a long climatic optimum in the region, reflected in warm temperatures and increasing precipitation. The Sofular stalagmite record (Göktürk et al., 2011) indicates a remarkable increase in rainfall amount and intensity, between ~9.6 and 5.4 ka BP. This would have brought about an increase in river flux and also sediment input to study area, therefore contributing to compensation (refill) of the significant erosion of the Adapazarı Basin during the LGM. This continuous deposition is also evidenced in borehole records from the Karasu Delta (Görür et al., 2001). Our terrace record misses other documented RCC events, such as the LBA collapse (Wanner et al., 2008).
1.8–1.2 ka, erosion
The initiation of erosion of the T2 terrace is started at 1.8 ka and is well constrained by two OSL samples (SB-12-D and SB-32). The erosion continued for over 600 years and the fluvial response was an apparent ~10 m incision in close proximity to the modern channel in the study area (Figure 2). The incision narrows and decreases gradually along the river and falls to ~5 m in the center of Adapazarı Basin.
The timing of this apparent erosional period corresponds to the historical Roman Warm Period and is correlated well with the adjacent paleoclimate records within ± 200 years error margin (Figure 6). The Uzuntarla Cave (labeled 1 in Figure 6) speleothem record (Göktürk, 2009) reflects an apparent decrease in δ13 C values corresponding to increased precipitation. The Lake Iznik (labeled 2 in Figure 6) borehole records point to a warm and humid period (geochemistry, Ülgen et al., 2012) and a sudden increase in pollen assemblage of Mediterranean trees and shrubs (Miebach et al., 2016). Stalagmite records from the Kocain cave (labeled 4 in Figure 6, Göktürk, 2009) show a decrease in δ13 C values and advocates increased precipitation. Evidence for wet conditions is also reported from Çubuk Lake (Ocakoğlu et al., 2016; labeled as 5 in Figure 6). Borehole GeoB-7622 from the Black Sea shelf (Lamy et al., 2006; labeled 6 in Figure 6) recorded a significant increase in clay layer frequency correlated with negative AO/NAO climatic phases and associated increases in the Sakarya River discharge and thus sediment flux. The Sofular stalagmite record (labeled 7 in Figure 6; Fleitmann et al., 2009; Göktürk et al., 2011) reflects a decrease in δ13 C values. This period also corresponds (with –200 year time shift) to a decreased values in Lake Nar (central Anatolia, labeled as 8 in Figure 6) δ18O record (Jones et al., 2006), which is attributed to humid climatic conditions in the region. Analyzing the records from Lake Hazar (located in southeast Anatolia, labeled 9 in Figure 6), Ön et al. (2017) have reported an apparent increase in precipitation for the beginning of this time period. To provide a global context, this period corresponds to increased temperatures and snow accumulation in the GISP 2 record (Alley, 2000) with some time shift. Although a 5–6 m regression at Black Sea was proposed during the middle of the 1st millennium BC (so-called Phanagorian regression), this theory is now disputed as the relevant coastal archives are related with local tectonic subsidence (see Fouache et al., 2012 for a discussion).
1.2–1 ka, deposition
A relatively short period of deposition took place in between 1.2 and 1 ka BP (T1; SB-16 A and B) and led to the deposition of a maximum 4-m-thick terrace in the study area (Figure 3). This level also declines gradually toward the north where it finally disappears in the center of the basin. This depositional period corresponds to the late Antiquity (Medieval) Dark Ages (Drake, 2012) and also the Oort solar minimum event, reflected as shifts (increases) in Uzuntarla, Kocain and Sofular Cave δ13 C values and related to decrease in precipitation (Göktürk, 2009). This is interpreted as a dry period in the Lake İznik and Çubuk (Ocakoğlu et al., 2016; Ülgen et al., 2012) records. It also corresponds (with a 200 year time shift) to an increase in Lake Nar δ18O record (Jones et al., 2006; 8 in Figure 6), while Izdebski et al. (2016) reported that shift to drier conditions in Anatolia occurred at ~AD 730 and related to early Medieval drought. This period also correlates with the Bond 1 arid event (1.35–1.15 ka; Bond et al., 2001). This terrace level is cut and right-laterally offset by NAF by 18.5 ± 0.5 m, which is the cumulative offset of four distinct earthquakes (Dikbaş et al., 2018).
1–0.75 ka, erosion
The erosion of the T1 terrace took place over some 250 years, corresponding to 6 m of erosion. This period corresponds to the ‘Medieval Warm Period’ and is reflected by an apparent decrease in δ13 C values in the Uzuntarla stalagmite record (Göktürk, 2009), a warm and humid period in Lake İznik, with increasing arboreal pollen ratio (Miebach et al., 2016) and a decrease in δ18O values in the Lake Nar Record (Jones et al., 2006).
0.75 ka to last 100 years, deposition
Recent floodplain formation is assumed to have started at cal. 14 C 0.75 ± 0.03 as dated from a tree trunk buried inside the bedload facies (SB-25). The amount of deposition is 5 m. This period corresponds to the ‘Little Ice Age’ cold and dry (drought) period from historical records and is well documented in paleoclimate archives, such as an increase in δ13 C values in stalagmite records (Göktürk, 2009), cool and dry conditions reflected in the Lake İznik sediment geochemistry (Ülgen et al., 2012), and a decrease in arboreal pollen populations (Miebach et al., 2016).
Impact of tectonic uplift
The elevation of the high terrace riser is used to determine the uplift rate in the study area. This is achieved by the calculating the ratio between the position of the top of T3 terrace relative to the modern floodplain and the age (SB-06 C; 30.04 ± 1 ka).
Using the ratio of the relative position of the riser of the T3 terrace (22 ± 1 m) to the recent floodplain and the age of the uppermost level in the terrace sequence reflecting the end of depositional period (30 ± 1 ka), we can propose a block uplift rate of 0.73 ± 0.06 mm/yr to the south of the NAF (Erturaç et al., 2017; Şahiner et al., 2018). Assuming this rate was continuous throughout the late Pleistocene to the recent, it would contribute 1.3 m (T2) and 0.95 m (T1) to the terrace riser elevations which would have no effect on the interpretation related to changes in discharge of the Sakarya River.
Conclusion
A well-developed terrace staircase (with three distinct steps) located at the lower reaches of the Sakarya River has been mapped and precisely measured. The depositional history has been revealed using the luminescence (OSL, p-IR-IRSL) and radiocarbon geochronological methods.
The T3 terrace riser stands at 22 ± 1 m relative to modern floodplain and its uppermost age (SB-06-C; 30.04 ± 1 ka) reflects the termination of deposition and initiation of an erosional period, which corresponds to a significant drop in the level of the Black Sea prior to the LGM.
The ratio between the relative position of the T3 terrace riser and its age points to an uplift rate of 0.73 ± 0.06 mm/yr for the study area.
Our findings support the ‘Flood Hypothesis’ by Ryan et al. (1997). The fluvial response to proposed abrupt base-level rise of the Black Sea at 9.3 ka BP was continuous deposition until 1.8 ka BP, filling the basin and forming the T2 terrace.
The late-Holocene to recent history of the region is marked with two sequential erosional (1.8–1.2 ka; 1–0.75 ka) and depositional (1.2–1 ka; 0.75–0.1 ka) periods.
These periods are well correlated with published nearby paleoclimate records achieved from Lake İznik, Lake Çubuk, Soflular Cave, and the Black Sea and also with documented historical climate shifts (‘Roman Warm’, ‘Medieval Cold’, ‘Medieval Warm’ and ‘Little Ice Age’, respectively) affecting the hydrological system.
The correlation of these events (dated with luminescence) with published paleoclimate records (dated with radiocarbon and uranium series) shows a ± 0.2 ka temporal error between these dating methods.
Footnotes
Acknowledgements
The idea of the manuscript is brought together while exploring the mysteries of the Holocene of the Anatolia and benefited much from fruitful discussions with Drs Catherine Kuzucuoğlu, Nizamettin Kazancı, and Z. Bora Ön. The contributions from Dr. David Bridgland and two anonymous reviewers significantly improved the original script. The first author expresses his gratitude to undergraduate students for their kind assistance during field and laboratory studies.
Funding
This study was supported by research grants TÜBİTAK 115Y132, 117Y426 and Sakarya University 2016-02-18-001.