
Abstract
Vertical water transport plays an important role in the development and maintenance of lakes in arid zones. However, previous study of this phenomenon has focused mainly on the effects of regional precipitation, rather than effects of groundwater recharge, on arid-zone environmental change. We selected a sedimentary profile from a seasonal lake basin located in the hinterland of the Badain Jaran Desert, northwestern China, to assess the Holocene environmental evolution of this region and its response to climate change. Our results show that peat deposition from 11 to 10 ka indicates humidification after Younger Dryas (YD) event; the lake sediment and lower EM2 and lower principal component analysis (PCA)-1 scores indicate relative more humid environment from 10 to 7.8 ka; the lake sediment and higher EM2 and higher PCA-1 scores indicate most humid environment from 7.8 to 5.8 ka; the transition from lacustrine facies to limnetic facies and increasing salinity indicate drying trend from 5.8 to 2.5 ka; the aeolian sand sediment and lowest EM2 and lowest PCA-1 scores indicate driest environment from 2.5 to 0.8 ka; and lacustrine facies and finest grain size indicate relative humid environment during the ‘Little Ice Age’ period. The environment was relative humid in early Holocene, most Humid in mid-Holocene, and dry in mid-late Holocene. The moisture pattern in the hinterland of the Badain Jaran Desert was synchronous with that in the northeastern of Tibetan Plateau, which implies that the groundwater recharge lake was dominated by the intensity of groundwater recharge from monsoon margin area, especially the northeastern of Tibetan Plateau. As a record from groundwater recharge lake without runoff, our study provides the groundwater output quantity record from northeastern of Tibetan Plateau and would benefit the environment change research and regional water resources allocation around the Tibetan Plateau.
Introduction
The traditional model of lake evolution is focused on the important role of atmospheric precipitation in the hydrological system (An et al., 2000; Chen et al., 2008). Atmospheric circulation is regarded as a key factor for basin hydrological change based on its influence on regional precipitation (Long et al., 2017). In Xinjiang Province (Zhang and Li, 2005b) and the Hexi Corridor (Zhang and Li, 2005a), in the arid regions of northwestern China, the amount of natural recharge of groundwater in the main inland river basins is at least equal to, if not greater than, the surface water resources. Groundwater recharge plays a crucial role in the maintenance and development of the internal water cycle of these basins. Furthermore, arid zones are more sensitive to temperature changes during global climate change (Huang et al., 2016) and the resulting changes in evaporation (Li et al., 2013). Changes in groundwater recharge and evapotranspiration lead to the expansion and shrinkage of lakes (Wang et al., 2016).
The mode of water transport in these regions is characterized by intensely interspheres vertically water circle and material system interaction, which is different considerably from the traditional mode driven by atmospheric precipitation. As a result, the effective humidity, controlled by interspheres vertically water circle, determines the lake evolution mode in arid regions. Therefore, modeling bi-directional groundwater–climate coupling based on the relationship between land hydrology and regional climate is key to understanding the response mechanisms of the water cycle in groundwater recharge lakes under climate change.
The Badain Jaran Desert, located in a monsoon–westerly transition zone, is sensitive to climate change (Yang et al., 2010, 2011). Because the hinterland of this desert area is extremely arid, there is almost no surface runoff and groundwater recharge accounts for more than 90% of total lake recharge (Dong et al., 2016; Ma et al., 2014; Wang et al., 2016). Therefore, the lakes of this region are an ideal location to study environmental evolution under the water vapor transport model. Previous studies of the Holocene environmental evolution of the Badain Jaran Desert hinterland have mainly focused on geomorphology and lacustrine relics (Wang et al., 2016; Yang et al., 2010), without systematic analysis of lake sedimentation records. Based on the analysis of grain size, salinity, ratio of carbon to nitrogen (C/N), and n-alkanes as proxies, we inferred paleotemperature and hydroclimate changes of groundwater recharge lakes during the Holocene in this extremely arid region.
Geographical setting
The Badain Jaran Desert is located in the west of the Alxa Plateau, northwestern China (Figure 1). With an area of 52,162 km2, it is the second largest desert in China after the Taklimakan Desert (Zhu et al., 2010). Groups of high megadunes cover the southeast of the desert and reach 200–400 m in height. The dunes strike 10–30°NE with a dominant wind direction of SW–NE. There are 110 lakes in total in the interdune areas of the megadunes, including perennial lakes, seasonal lakes, and extinct lakes. These lakes vary greatly in area and hydrochemical properties (Lu et al., 2010). The largest lake, named Nuoertu, covers an area of 1.5 km2 and has a depth of 15.9 m (Zhang et al., 2013). The monthly average temperature in this area ranges from 7.6°C (January) to 27°C (July), and the annual average temperature is 11.1°C (Figure 1c). Precipitation is concentrated between May and September, and the average annual rainfall is 87 mm. Annual evaporation of a lake with a TDS of 304.5 g/L (Lu et al., 2010) is about 1450 mm (Dong et al., 2016; Wang et al., 2016). Without overland runoff, groundwater recharge is the main source of water for these lakes (Dong et al., 2016; Wang et al., 2016). The surface vegetation coverage is sparse and mainly composed of xerophytes and super-arid shrubs and semi-shrubs. The surface sediments of the desert consist mainly of fine sand (Ning et al., 2013).
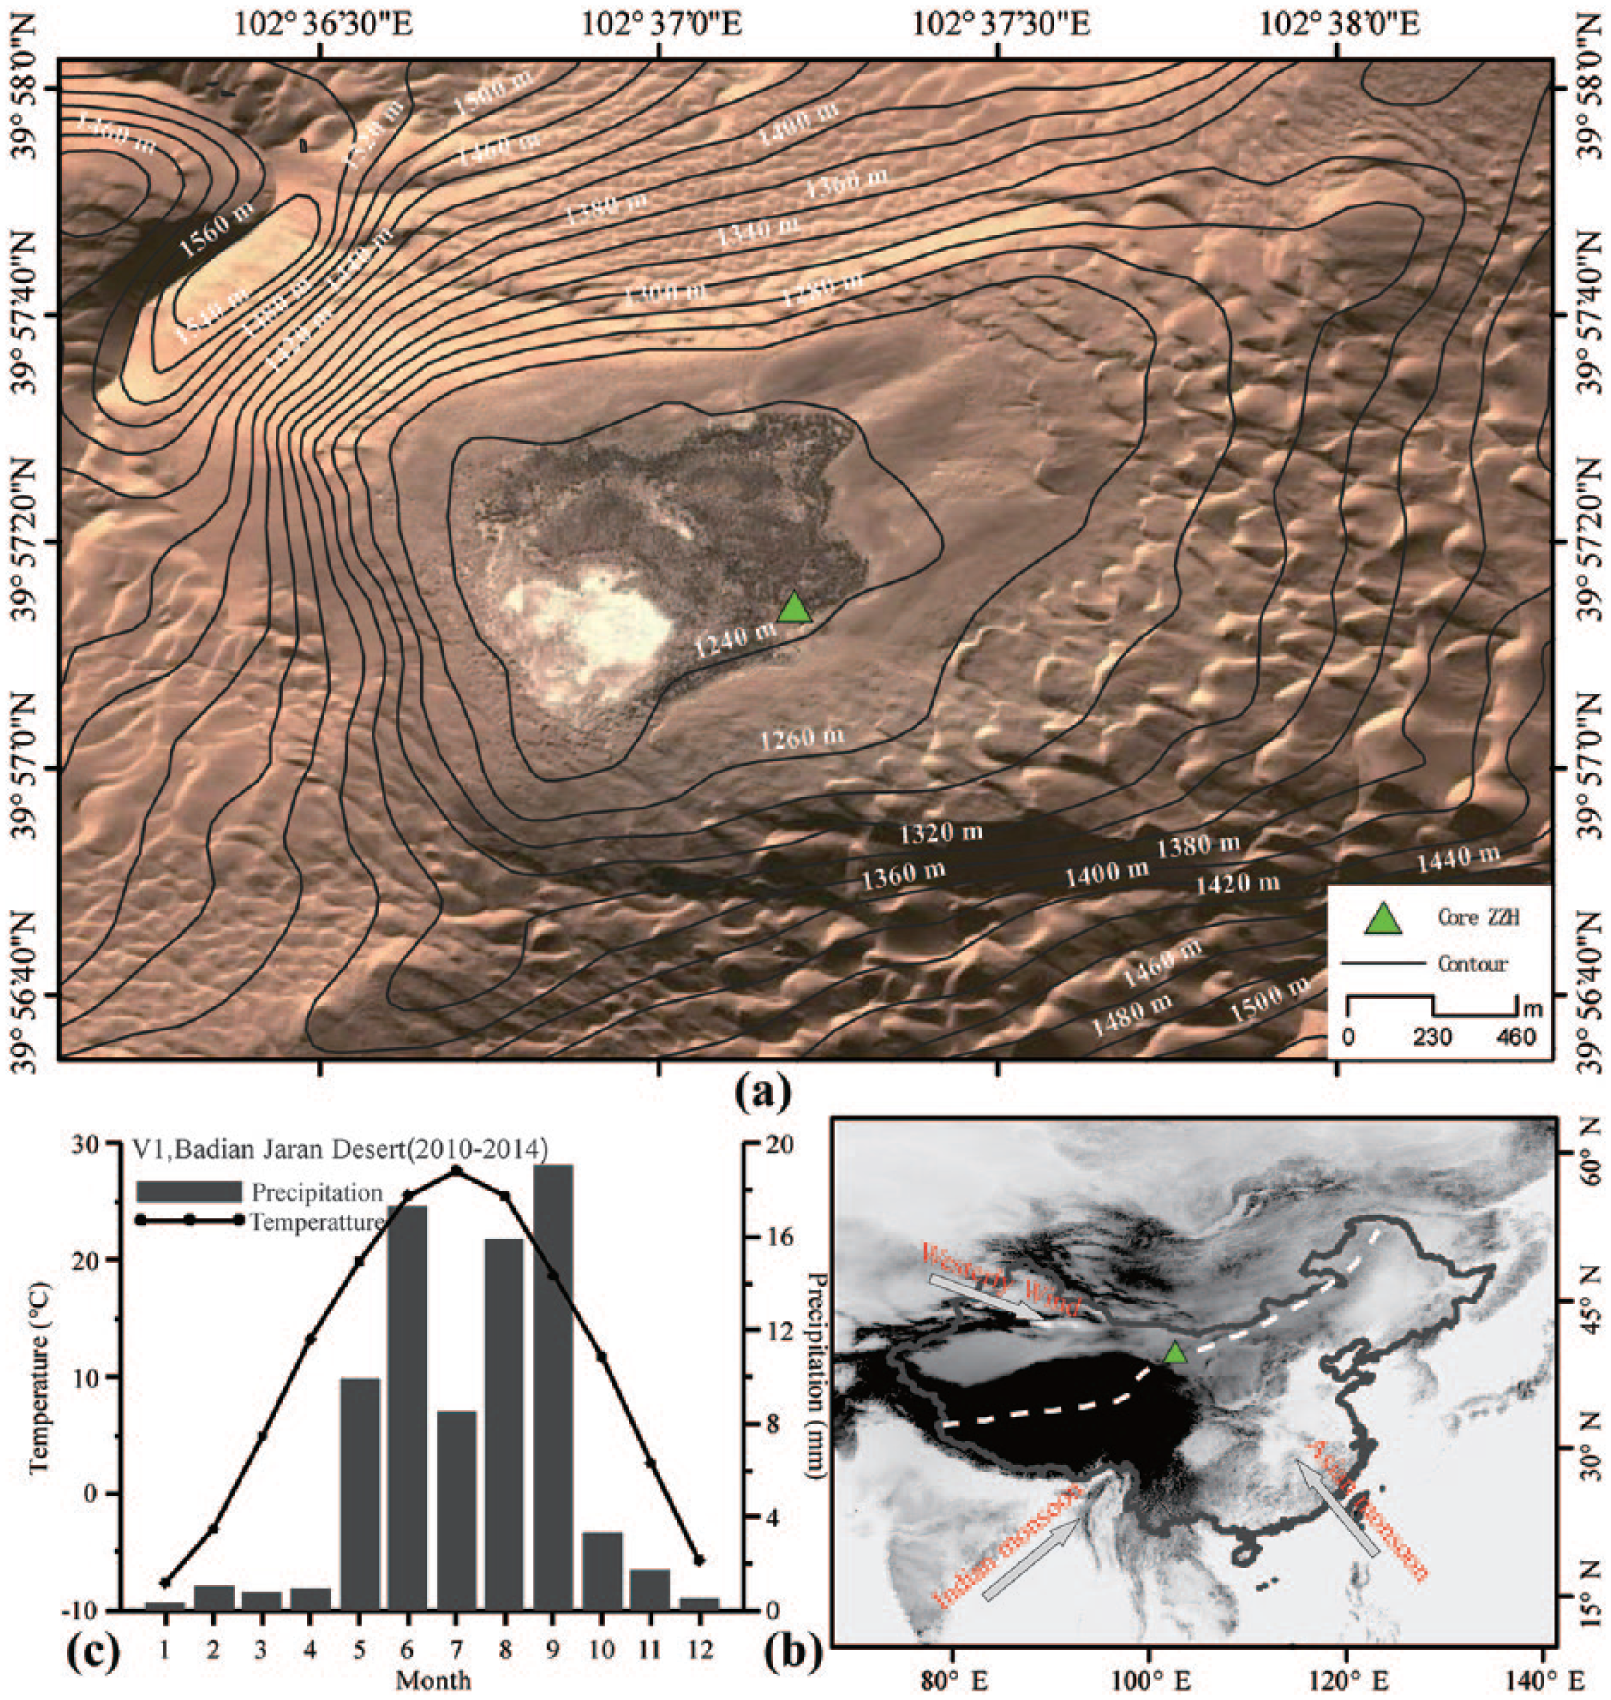
(a) The location of Sedimentary profile ZZH in the Zhunzhahan Jaran Basin. (b) The location of Sedimentary profile ZZH on a map of the climate system of China. (c) Monthly average temperatures and precipitation (2010–2014) from V1 automatic meteorological station in the Badain Jaran Desert, Northwest China.
The Badain Jaran Desert lies within the depression basin of the Alxa Plateau. Since the early Pleistocene, the crust has sunk considerably to form this basin, and 150 m of Quaternary sediments have accumulated therein. Grid-like fracture structures are developed in the underlying layers. The desert has experienced MIS (Marine isotope stages) 13–15, MIS 5, and Holocene wetting periods since 1200 ka (Wang et al., 2015) and permafrost periods during the Last Glacial Maximum and the Late Glacial (Ning et al., 2015).
Materials and methods
Lithology
We obtained a 390-cm-long sediment section (named sedimentary profile ZZH) extracted from a seasonal lake depression (39°57′N, 102°37′E; 1246 m a.s.l.) in the hinterland of Badain Jaran Desert. The samples were collected at 2 cm intervals from 0 to 220 cm depth and at 5 cm intervals from 220 to 390 cm depth, which yielded a total of 138 samples. The section can be divided into seven lithological units based on texture, color, and structure (see Figure 2): (1) below 385 cm, brown loose aeolian sand immersing in the groundwater level; (2) 385–348 cm, a black peat layer mixed with abundant plant residues; (3) 348–175 cm, yellow-green silt-sand. In the under layer (348–248 cm), it shows grayish-green. In the upper layer (248–175 cm), it shows permanently yellowish-brown with grayish-green rust spots. (4) 170 −125 cm, a gray-black silt limnetic layer with more silt; (5) 125–100 cm, a yellow sand layer with rust spots; (6) 100–40 cm, a gray-black limnetic layer; and (7) above 40 cm, grayish-yellow moderately consolidated sand layer.
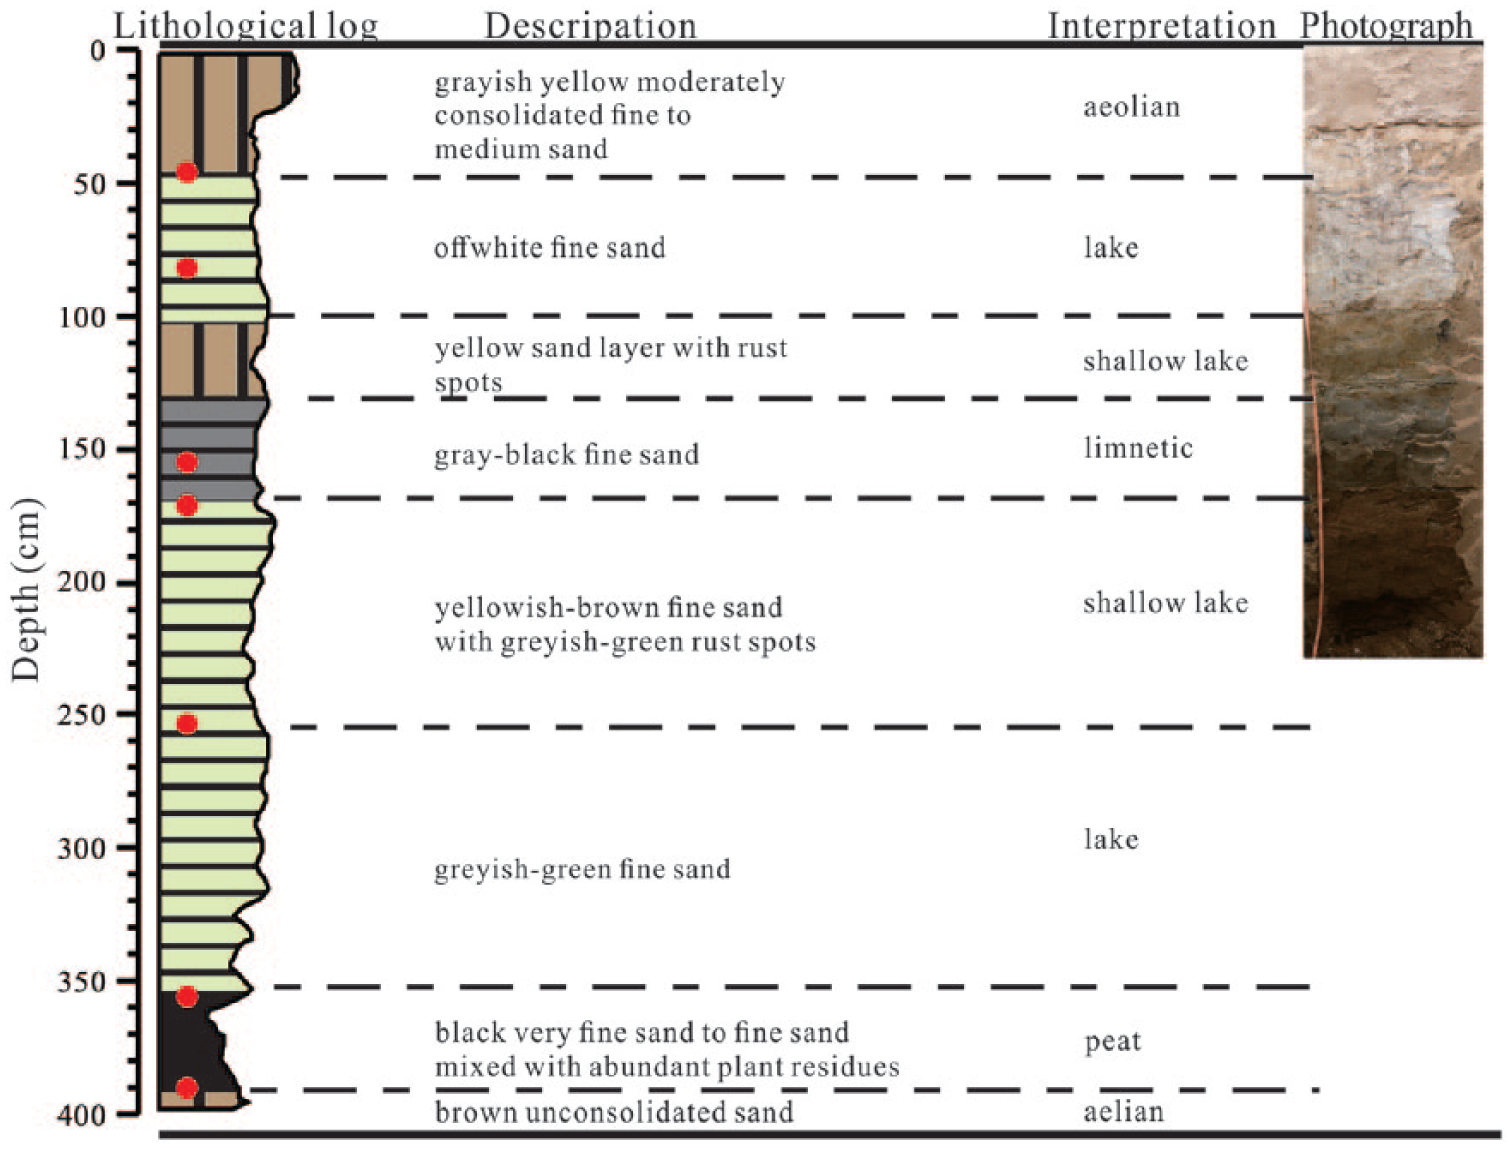
Sedimentary log and photo of profile ZZH.
Analytical methods
Eight samples were collected from Sedimentary profile ZZH for accelerator mass spectrometry (AMS) 14C dating to set up chronostratigraphic sequence. Three of the samples were dated at the AMS Dating Laboratory at Beijing University, China, and the other four were obtained by Beta Analytic, Florida of the USA. All dates were calibrated to calendar years before present (BP, before 1950 AD) with program CALIB 6.0.1 using IntCal09 calibration data set (Reimer et al., 2009). The age–depth model (Figure 3) was established with the age control points using fitting spline functions of Clam 2.2 program in statistical software package R (Blaauw, 2010). At the same time, additional organic matter samples were collected to evaluate the possible effect about ‘carbon storage effect’.
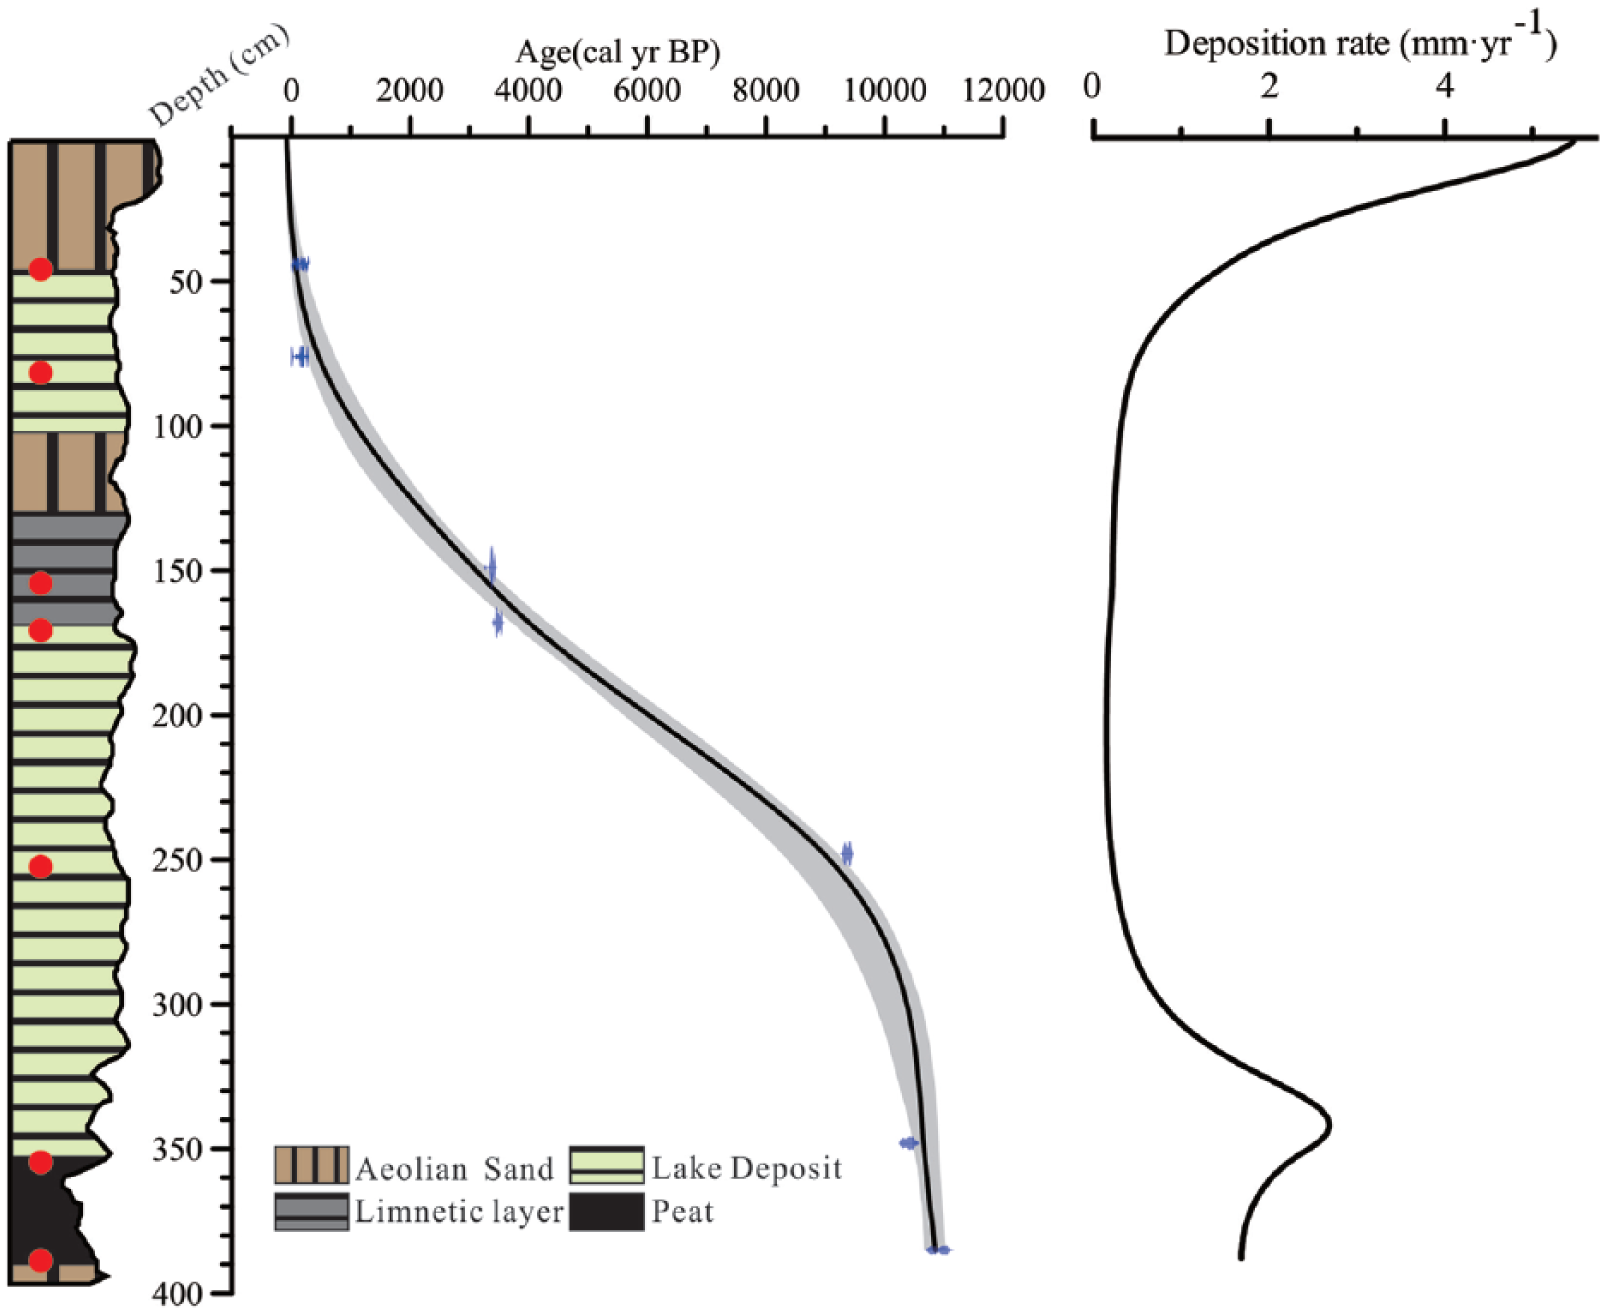
Lithostratigraphy and chronology for Sedimentary profile ZZH.
Grain size distribution was determined using a Mastersizer 2000 particle analyzer from Malvern, the Netherlands. A total of 138 samples were pretreated by heating to 100°C in 106 mL of 10% H2O2 and 10 mL of 10% hydrochloric acid to remove organic matter and carbonate and left at room temperature for 12 h. The upper solution of each sample was then removed and shaken in dispersant (0.05 mol/L sodium hexametaphosphate) for 20 min prior to analysis. Grain sizes were measured in the particle size range from 0.02 to 2000 μm with repetitive error of less than 2%. The end-member analysis was carried by the end-member-modeling algorithm (EMMA; Weltje, 1997; Weltje and Prins, 2003).
Total organic carbon and total nitrogen contents were determined with an elemental analyzer. Freeze-dried samples of known mass were treated with hydrochloric acid for 24 h to remove carbonate and then washed with distilled water to neutral pH. The freeze-dried samples were then measured using a Vario-III elemental analyzer made by Elementar, Germany.
Salinity was calculated based on ions identified via liquid chromatography. Samples were shaken for 3 min with deionized water and centrifuged. Then, the samples and solutions were filtered through a 0.22-μm filter prior to analysis. Ions were identified with an ICS-1500 ion chromatography system produced by Dionex Corporation, America.
The n-alkanes were identified with a 450-GC gas chromatograph produced by Varian Corporation, America. Three grams of each freeze-dried sample was extracted with the extract liquor (CH2Cl2:MeOH = 93:7) for 12 h and ultrasonicated at room temperature five times for 20 min each. The resulting extracts were combined and filtered, and the filtrate was concentrated under gentle ultrapure nitrogen flow. The concentrate was passed through a silica gel column and eluted with n-hexane. The eluate was concentrated in a gentle ultrapure nitrogen stream and derivatized with BSTFA. The volume of the eluate was directly measured using the Varian 450-GC device; a flame ionization detector and a set of n-alkanes (nC12 to nC40) of known concentrations were used as internal standards for quantification. The concentration distributions of n-alkanes were used to calculate environmental proxies, such as average chain length (ACL) (Poynter et al., 1989), carbon preference index (CPI) (Allan and Douglas, 1977), odd-even predominance (OEP) (Yunker et al., 1994), nC27/(nC27 + nC31) (Bai et al., 2009; Xie et al., 2003), proportion of aquatic plant n-alkanes (Paq) (Ficken et al., 2000), proportion of land plant n-alkanes (Pwax) (Ficken et al., 2000), and the total concentration of n-alkanes (Con_nak).
To further determine the response patterns of the distributions of n-alkanes and grain size to climate change, we conducted a dimensionality reduction analysis. The mode selection and the operation of the dimension reduction analysis were carried out using the software Canoco v. 5.0. Because the maximum length of the gradient of the detrended correspondence analysis (DCA) is 1.4 times the standard deviation, that is, less than 2, principal component analysis (PCA; linear model) was used (Birks and Birks, 1998).
Results
Core chronology
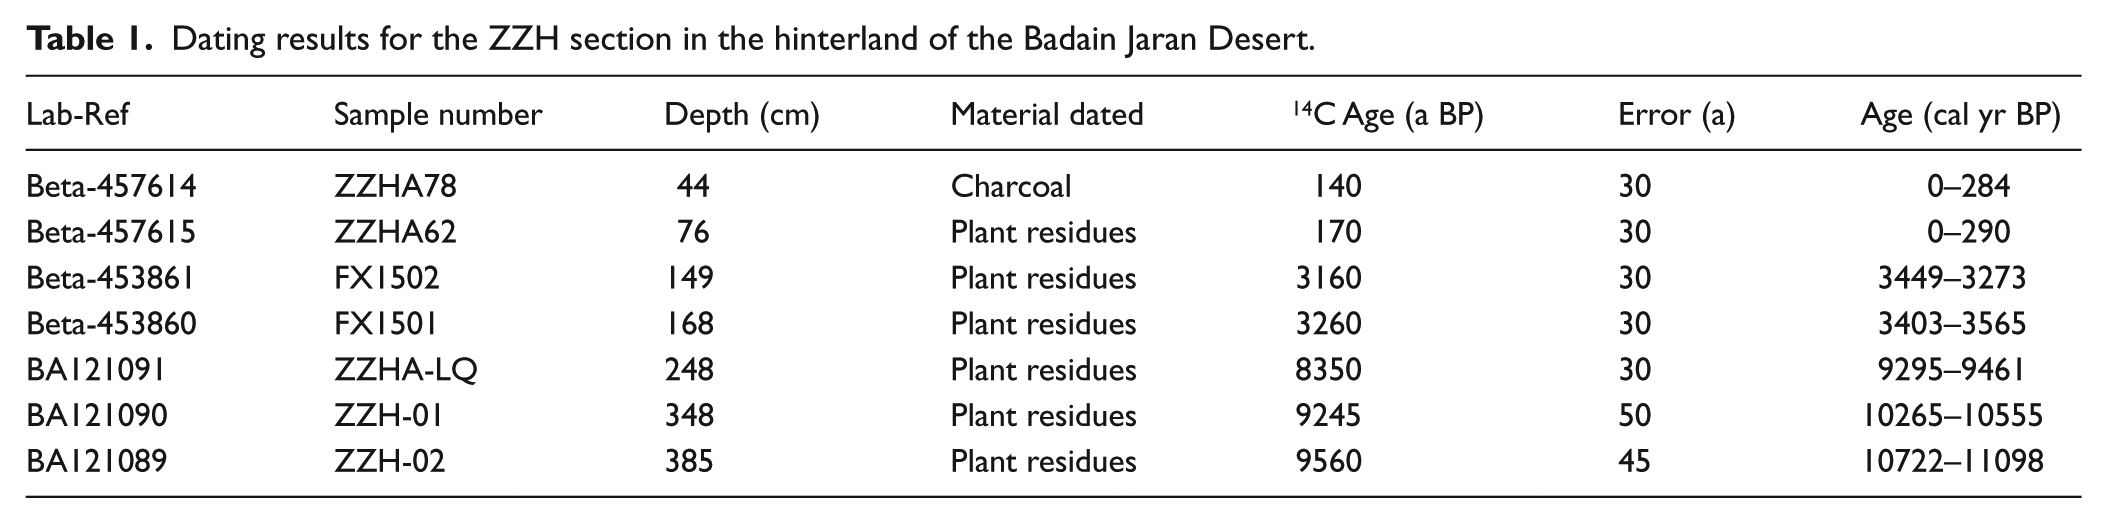
The freshwater snail shells from Wosigu Lake (this lake has retreated at present), located in the southeast of the Badain Jaran Desert, were dated at 47–273 cal yr BP (laboratory preference: BA111630) and 306–469 cal yr BP (laboratory preference: BA111631), which are consistent with the latest humid period ‘the Little Ice Age’. The modern aquatic plant material from Tian’e Lake in the northwest of the Badain Jaran Desert was dated to be modern (laboratory preference: LUG06-132), indicating that even the aquatic plant material could be directly used to reconstruct chronosequence without correction of ‘Carbon Pool Effect’. Generally, there may be ‘carbon pool effect’ in shells and aquatic plants. As suggested above, the 14C dating results included in this study are less strongly affected by the carbon pool and are therefore reliable evidence for reconstruction of the Holocene environment.
The detailed sample properties and dating results are listed in Table 1. All the dating results were used to establish age-depth model in Clam (see Figure 3). The deposition rate stands overall stability value of about 0.25 mm·yr−1 except for that above 100 cm with a maximum value of about 5.5 mm·yr−1 and that below 320 cm with a maximum value of about 2.5 mm·yr−1. As the sediment mainly derived from aeolian sand around the lake in the groundwater recharge lake without almost surface runoff input, the deposition rate is higher when the lake had not yet formed or drying and profile lay nearer with aeolian sand around the lake, vice versa. The depositional pattern is very different from that in general lakes of arid area. The resulting age–depth relationship indicates that the peat and the aeolian sand layer has accumulated at a higher constant rate, while the lacustrine strata has accumulated at a lower constant rate, which is consistent with the wind transport capacity during the corresponding periods. As mentioned above, the photo of profile ZZH also shows homogeneous lithology without hiatus or rapid accumulation records. Despite the lack of extra dating data, we regard the chronosequence to be credible.
Dating results for the ZZH section in the hinterland of the Badain Jaran Desert.
General changes in grain size, TOC, and salinity
Most of the sediment in the core, 43–67%, is fine sand, with a median grain size range of 130–200 μm (see Figure 4). Grain size varies considerably in the upper layers (0–150 cm, 0–3 cal ka BP). Below this interval, the median grain size falls within a relatively narrow range between 135 and 165 μm. Based on lithology and grain size, we divided the section into seven zones. Thereinto, the relatively finer fraction covers more content in Zone A, Zone B, Zone D, and Zone F, while the relatively coarser fraction covers more content in Zone C, Zone E, and Zone G.
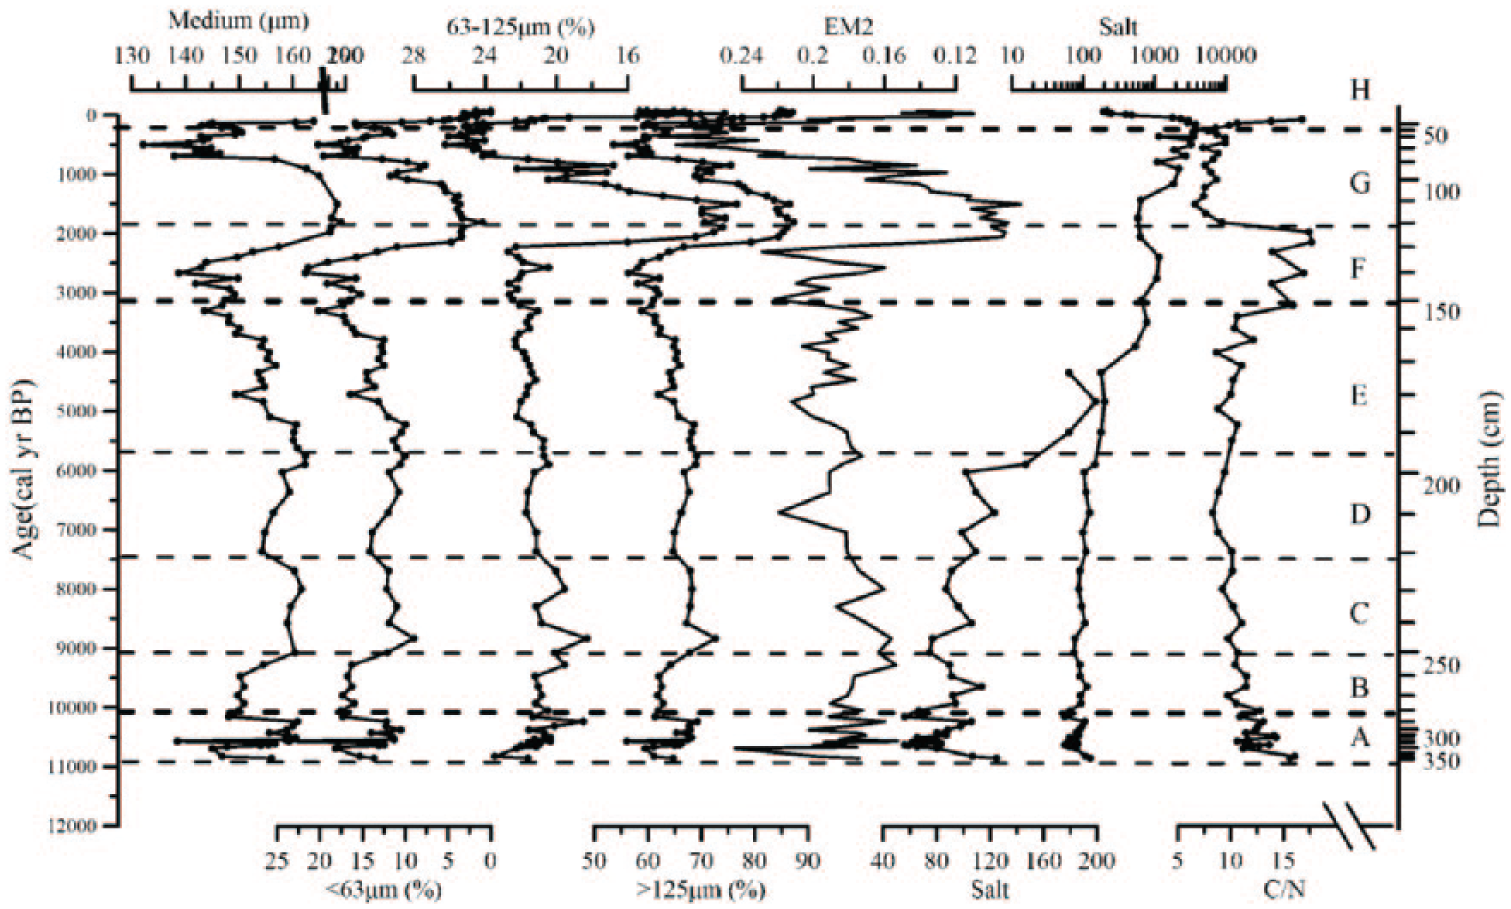
Sediment grain size record of Sedimentary profile ZZH.
There are large variations in the salinity and C/N, which are illustrated in Figure 4. The C/N ranges from 6.6 to 36 with a mean of 14. There is higher value of C/N in Zone A, Zone F, and Zone H. The salinity varied from 0.14 to 9.80 mg/g with a mean of 2 mg/g. The salinity increased sharply above 200 cm (about 6ka) and the highest salinity value occurred at the Zone G.
Variations of n-alkanes
The n-alkane proxies show considerable variability (see Figure 5). All the proxies wildly fluctuate at Zone H (above 60 cm). Below 60 cm, the majority n-alkane proxies fluctuate weaker. The total concentration of n-alkanes (con_nak) exhibits higher values at Zone D. ACL, OEP, and C31/(C31 + C27) sharply increased at the depth of 200 cm (about 6 ka). Paq sharply decreased and Pwax sharply increased at depth of 150 cm (about 3 ka).
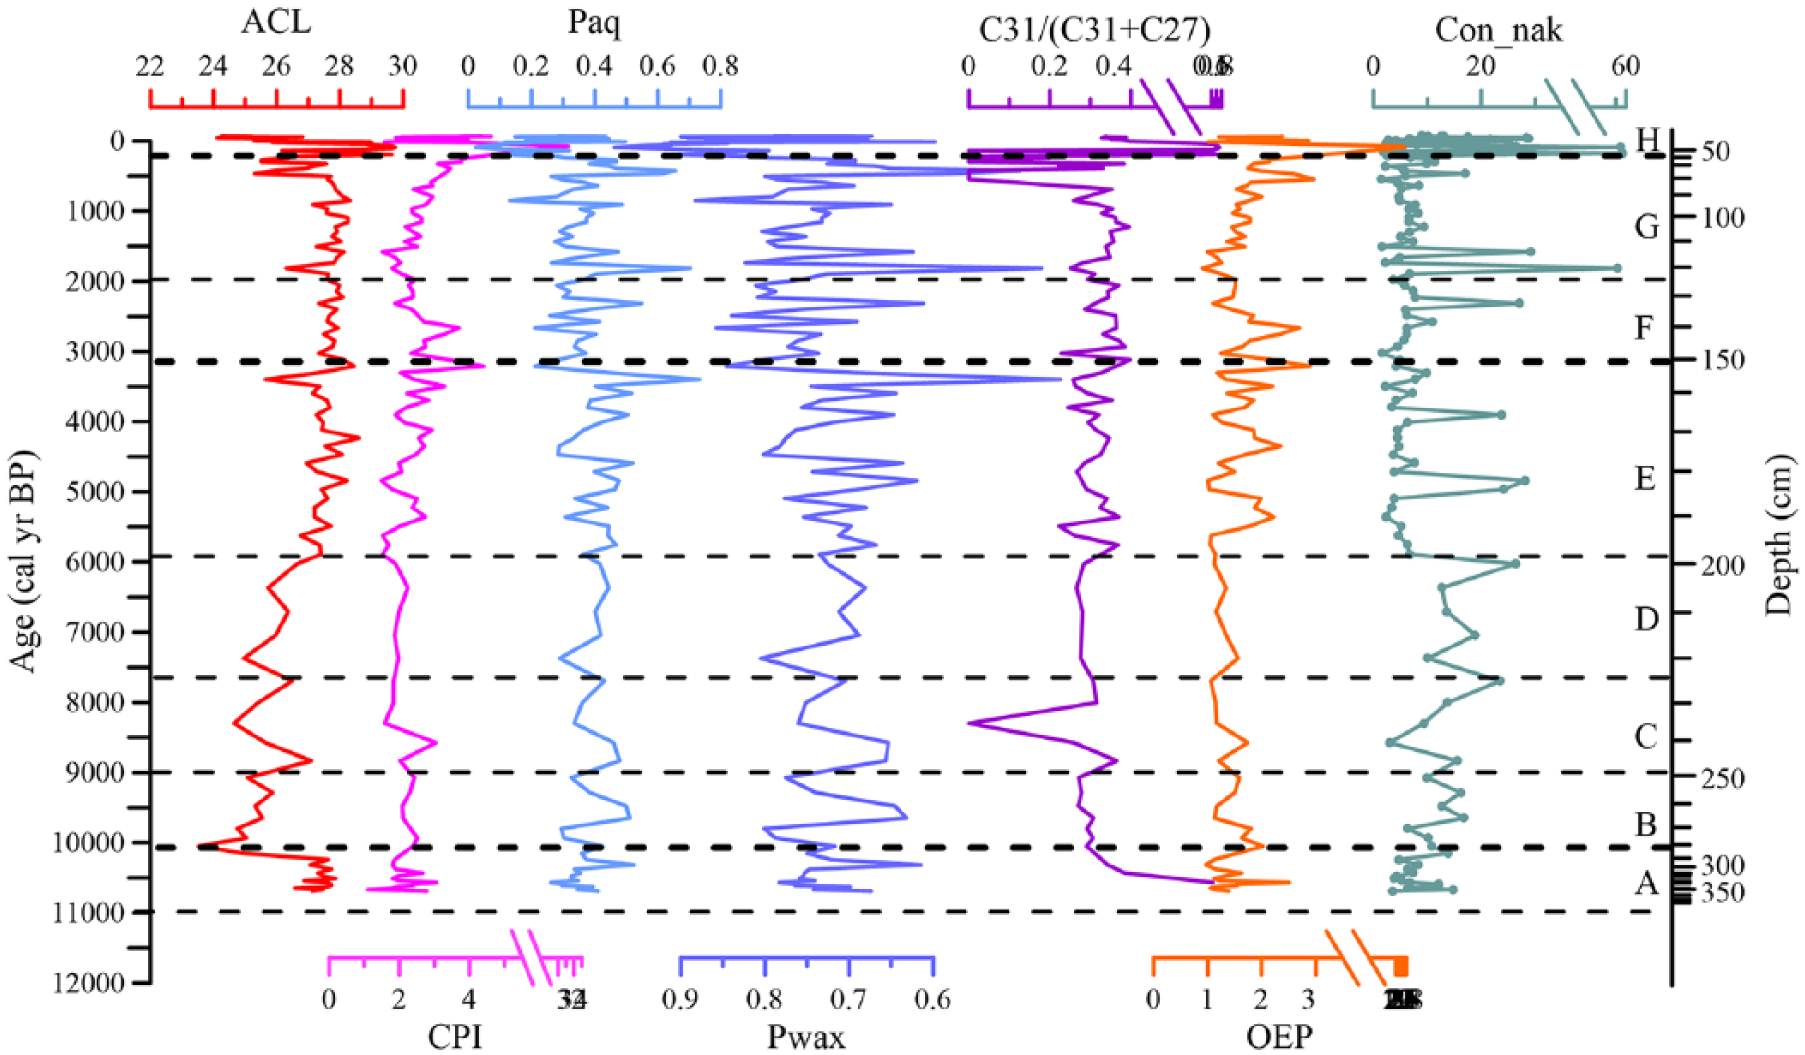
Variations of n-alkanes proxies in Sedimentary profile ZZH.
Results of PCA
The PCA results based on grain size and n-alkanes proxies in Sedimentary profile ZZH reflect environmental change in groundwater recharge lake in this extremely arid zone. The first two principal components of the analysis account for 33% and 28% of the total variance, respectively. Grain size, TOC, and con-nak are high-load variables of the first principal component; CPI, OEP, and nC27/(nC27 + nC31) are high-load variables of the second principal component. The projection of proxies on a biplot diagram (see Figure 6) shows cluster distribution; these cluster groups correspond to the zones defined based on grain size (Figure 4) and n-alkanes (Figure 5).

Biplot of PCA result for main climatic proxies data from Sedimentary profile ZZH.
Discussion
Environmental significance of the proxies
The lake from which Sedimentary profile ZZH was extracted is a groundwater recharge lake with almost no surface runoff. The sediment of Sedimentary profile ZZH consists mainly of authigenic lake sediments and aeolian sand of the basin. The source, transport capacity, and distance from the lake’s shore affect lake sediment grain size (Xiao et al., 2009). The sediment source and transport capacity are relatively stable in the Badain Jaran Desert. Therefore, the grain size is most sensitive to lake level; the finer particle sizes indicate farther distance from the lake shore and a higher lake water level (Li et al., 2018; Xiao et al., 2009) when the lake is relatively stable. While if the lake rapidly expands, the coarse aeolian sand around the lake would be transported into lakes and make coarser grain size. On the contrary, if the lake rapidly shrinks, the exposed lacustrine sediment, between migratory dune and lake, and suspended load driven by wind would be main source for lake depositional process; the grain size of source would be finer with the lake shrinking. The area covered by exposed lacustrine sediment would be enough broad to prevent from the aeolian sand which is proved by the remaining exposed lacustrine sediment along the lake margin. This would make the grain size of source particle finer and the sediment further finer. The relative more suspended load prompt more silt in the sediment, which matches with grain size of suspended load.
The organic matter and n-alkanes are mainly authigenic and transported from the basin around lake. The organic matter content and the total concentration of n-alkanes reflect lake biomass (Finlay and Kendall, 2007; Meyers and Lallier-Vergés, 1999). Because organic matter content and the total concentration of n-alkanes are influenced by microorganisms, which are controlled by environmental change, these values reflect effective humidity (Meyers and Lallier-Vergés, 1999). C/N is a common proxy for source of organic matter (Krishnamurthy et al., 1986; Meyers and Lallier-Vergés, 1999) and depositional environment (Wang et al., 2013a). In general, the mean C/N value of benthos is about 3.0, phytoplankton is about 6.0, alga is less than 10, aquatic plant range from 12 and 20, and terrestrial higher plant range from 14 to 23 (Müller and Mathesius, 1999). As for lake without runoff in the desert, organic matter mainly includes endogenous plants in the lake, such as alga and aquatic plant, and exogenous higher plants around the lake. When the lake expands, more phytoplankton and alga were produced and relatively less terrestrial plant was transported to bosom of the lake, showing lower value of C/N. This is different from the lake with runoff.
In n-alkanes, higher percentages of long-chain n-alkanes (>C22) indicate more abundant vascular plants (Eglinton and Hamilton, 1967). ACL (ACL = ∑(Ci*[Ci])/∑[Ci], [Ci]) is the concentration of n-alkanes with the carbon number Ci (Poynter and Eglinton, 1990; Poynter et al., 1989). As the temperature rises, the proportion of longer n-alkane chains increases (Eglinton and Hamilton, 1967). ACL values indicate the relative paleotemperature change to some extent (Poynter et al., 1989; Zhou et al., 2005). However, with changes in vegetation associated with significant climate change, ACL may mainly reflect changes in local plant species (Pu et al., 2011).
Phytoplankton and algae are predominantly characterized by short-carbon n-alkanes with a maximum carbon number of C17 (Blumer et al., 1971; Cranwell et al., 1987; Gelpi et al., 1970); submerged plants and phytoplankton are dominated by C21, C23, and C25 (Cranwell, 1984; Viso et al., 1993); emergent plants are dominated by n-alkanes with maximum carbon numbers of C27 and C29 (Cranwell, 1984); and terrestrial plants are dominated by n-alkanes with maximum carbon numbers of C27, C29, and C31 (Eglinton and Hamilton, 1967; Pancost et al., 2002). The CPI is the ratio of even to odd numbers of carbon atoms; CPI = (([C21]–[C31]) + ([C23] – [C33])odd/2 × ([C22] – [C32]) (Allan and Douglas, 1977). The CPI in fresh sediment represents the relative proportion of higher plants to algae and bacteria. A greater CPI value indicates a greater proportion of higher plants and a lower proportion of algae and bacteria (Bray and Evans, 1961; Marzi et al., 1993). The CPI is also affected by microbial degradation and thermal alteration processes, which are controlled by climatic factors during and after sedimentation. Lower CPI values in lake sediments represent higher microbial activity and warmer climatic conditions, and the reverse is also true (Andersson and Meyers, 2012; Jansen and Nierop, 2009; Kuder and Kruge, 1998; Xie et al., 2004; Zheng et al., 2007; Zhou et al., 2010b). The proportion of aquatic plant n-alkanes (Paq), Paq = ([C23] + [C25])/([C23] + [C25] + [C29] + [C31]) (Ficken et al., 2000), reflects the contribution of aquatic macrophytes to sedimentary organic matter. Submerged plants and phytoplankton are dominant when the Paq value is greater than 0.4 (Ficken et al., 2000). The proportion of land plant n-alkanes (Pwax), Pwax = ([C27] + [C29] + [C31])/([C23] + [C25] + [C27] + [C29] + [C31]) (Ficken et al., 2000), reflects the contribution of emergent and terrestrial plants (Pu et al., 2011; Zheng et al., 2007).
Woody plants are dominated by nC27 and n29, and herbs are dominated by nC31 (Cranwell, 1973; Meyers and Ishiwatari, 1993); therefore, changes in nC27/(nC27 + nC31) reflect changes in the types of plant in the area around the lake (Bai et al., 2009; Xie et al., 2003). Because most woody plants in the Badain Jaran Desert area are shrubs, higher nC27/(nC27 + nC31) values represent more abundant shrubs, which grow in drier and warmer conditions (Xie et al., 2003).
The high-load variables of the first principal component are mainly grain size and TOC content. The load of the first principal component is negative to TOC content and the percentage of very fine sand and positive to median grain size. Because TOC and grain size reflect the lake level and effective humidity, the first principal component indicates effective humidity. Higher scores of the first principal component correspond to lower effective humidity. The high-load variables of the second principal component are mainly CPI, OEP, and nC31/(nC27 + nC31). The load of the second principal component is positive to nC27/(nC27 + nC31) and negative to CPI and OEP. The second principal component is related to paleotemperature. A higher score for the second principal component corresponds to higher paleotemperature.
The phase change of paleotemperature
PCA2 high-load variables consist of the CPI, OEP, and nC27/(nC27 + nC31), which together represent temperature conditions. According to the PCA-2 scores, we reconstructed the paleotemperature change during Holocene in a lake of Badain Jaran Desert. As is shown in Figure 7e, the paleotemperature conditions from PCA-2 scores (see Figure 7e) demonstrated lower value before 10 ka, relatively higher value between 10 and 9.2 ka, highest value between 8.1 and 5.8, and lower value after 5.8 ka on a whole, while the value in 8.8–8.2 ka is relatively lower between 10 and 5.8 ka, the value in 4.5–4.0 ka and 0.6–0.1 ka is relatively lower between 5.8 and today, and the value in 2.4–1.6 ka is relatively higher between 5.8 and today.

Comparison with regional and global records on temperature and effective humidity change: (a) PCA-1 scores for ZZH profile (this study), (b) EM2 of grain size for ZZH profile (this study), (c) redness record from Qinghai Lake, in the northeastern of Tibetan Plateau (Ji et al., 2005), (d) δ18O record from Dongge Cave (Dykoski et al., 2005; Wang et al., 2005), (e) PCA-2 scores for ZZH profile (this study), (f) δ13C record from Zhuyeze Lake, in southeastern of Badain Jaran Desert (Long et al., 2010), (g) woody pollen percentage, in Northern China (Li et al., 2004), (h) temperature record from Qinghai Lake, in the northeastern of Tibetan Plateau (Hou et al., 2016), (i) temperature change in 30–90°N during Holocene (Marcott et al., 2013), (j) Northeast Atlantic overflow recorded in silt-sized particles (10–64 m) for NEAP-15K (Bianchi and McCave, 1999), and (k) July insolation at 37°N latitude (Laskar et al., 2004).
In order to evaluate the geographic representation of our record, we compared with some published records from surrounding areas.
To the south of the desert, warm environment in early to middle Holocene was widely reported. The warmest period is about 8.5–6.7 ka from Zhuyeze δ13C records (Long et al., 2010, 2012) and 7.3–5.8 ka from Hongshui River δ18O records (Zhang et al., 2000); the second warmest period is about 4.5 ka from Hongshui River δ18O records (Zhang et al., 2000) and 4.4 ka from Zhuyeze δ13C records (Long et al., 2010), which is quite similar to our study, implying our paleotemperature records could apply to the study region. Interestingly, the pattern of desert temperature value is very similar to that in Qinghai Lake (see Figure 7h), in the northeastern of Tibetan Plateau (Hou et al., 2016). The highest temperature period occurred at about 5.8–8.1 ka, second highest temperature period occurred at about 10–9.3 ka, and relatively colder period occurred after 5.8 ka. This is consistent with the desert pattern. Even the abrupt period matches with the desert results, such as in about 8.6, 4.7, and 1.7 ka. However, the records in the central and south of Tibetan Plateau show warm in early Holocene and relatively cold in middle and late Holocene (Herzschuh et al., 2006; Thompson, 1997; Thompson et al., 2006), inconsistent with the desert pattern.
To the west of the desert, a warm early and middle Holocene phase was reported in Hexi Corridor and Xinjiang. The warm period implied by pollen record in eastern of Hexi Corridor (Mao et al., 2007) and Xinjiang (Jiang et al., 2013) lasted between 9.2 and 5.8 ka, while there was prominent difference between temperature in early Holocene and middle Holocene, which implied the summer insolation (Laskar et al., 2004) rather than the remaining ice covers in high latitudes area (Ruddiman, 2001; Tarasov et al., 2007) dominated temperature change in Xinjiang.
To the east of the desert, the Daihai Pollen record shows warmest period in 8.5–6.5 ka and second period in 10–8.8 ka, and cold period in late Holocene (Li et al., 2004), which is coincident with the desert.
To the north of the desert, the warmest period occurred during 6.6–4.5 ka in central Mongolia implied by the Lake Ugii Nuur record (Wang et al., 2011) and during 5.5–4 ka in northern Mongolian Plateau implied by pollen in Lake Gun Nuur (Feng et al., 2013), which were later than that in the desert. The delay of warmest period in Mongolian Plateau implied greater impact of ice sheets in higher latitude area.
Compared with global temperature records (Marcott et al., 2013), the desert temperature values exhibited overall similarity and regional characteristics, that is, the desert cooling trend is almost identical with the global temperature records after 4 ka, and desert warm period is similar to global temperature records before 6 ka. The desert temperature was overall synchronous with orbital factors (see Figure 7j) and ice sheet of high latitudes in millennial scale. In 11–10 ka, the remaining ice covers in high-latitude area (Ruddiman, 2001; Tarasov et al., 2007), the remaining local permafrost extent (Dong et al., 1997; Shan, 1996, 1997; Yu et al., 2017), and the lower summer insolation (Laskar et al., 2004) result in a lower temperature. In 10–8.8 ka, the highest summer insolation (Laskar et al., 2004), higher CO2 concentration (Bush, 2005; Indermühle et al., 1999), and the stronger North Atlantic Deep Water (NADW) flow (Bar-Matthews et al., 1999) produced, preserved, and brought more heat for mid-latitude areas to keep a relatively higher temperature. In 8.8–8.1 ka, lowest CO2 concentration (Bush, 2005; Indermühle et al., 1999) and weaker NADW flow (Bar-Matthews et al., 1999) contributed to trough period of temperature. In 8.1–5.8 ka, with the increasing CO2 concentration (Bush, 2005; Indermühle et al., 1999) and final melting of ice covers, although the summer insolation slightly decreased (Laskar et al., 2004), the temperature reached the maximum value during Holocene. After 5.8 ka, with the largely decreasing in summer insolation (COHMAP Members, 1988; Laskar et al., 2004), the temperature gradually decreased. But higher temperature events in about 5–4.5 ka and 2.4–1.6 ka occurred in the desert, Zhuyeze Lake (Long et al., 2010), Daihai Lake (Li et al., 2004), Qinghai Lake (Hou et al., 2016), Erlongwan Maar Lake (Tao and Qi, 2012), and Hongyuan Peat (Hong et al., 2003), which were synchronous with the weaker NADW flow (Bar-Matthews et al., 1999). Hence, the abrupt climate event may be dominated by the Thermohaline Circulation.
Lake evolution and environment change based on multiple proxies
The study area is sensitive to climate change, especially change in humidity, because of its location in a typical arid monsoon–westerly transitional zone (Wang et al., 2016). We have assessed the lake evolution and changes in the effective humidity in the study area based on analysis of variations in grain size, TOC, TDS, total concentration of n-alkanes, and PCA-1 score.
During 11–10 ka, the deposition of a peat layer below the lacustrine layer and the relatively large amount of TOC and higher EM2 indicate higher effective humidity after Younger Dryas (YD) event. Higher C/N value (Meyers and Lallier-Vergés, 1999; Wagner, 2000) and C31/(C31 + C27) (Cranwell, 1973; Meyers and Ishiwatari, 1993) indicate more terrestrial herbs and less aquatic plant, which is in agreement with the lithologic character. The abrupt climate event after the YD is widely recorded around the desert, such as Huahai Basin (An et al., 2012), Zhuyeze Lake (Li et al., 2009; Long et al., 2012), Huangqihai Lake (Zhang et al., 2016), Juyanze Lake (Hartmann and Wunnemann, 2009), and Qinghai Lake (Ji et al., 2005), implying it is responding to climatic warming in regional scale.
Between 10 and 7.8 ka, lacustrine deposit indicates relative humid environment than that before 10 ka. However, the grain size, the EM2, con_nak, and PCA-1 scores indicate not exactly the same moisture conditions. The grain size and PCA-1 score indicate relatively more humid in 10–9 ka than that in 9–7.8 ka. However, more silt content, higher Paq, lower Pwax, lower salinity, and decreasing C/N indicate gradually wetting and more aquatic plant between 10 and 8.5 ka in the desert. One possible explanation for this apparent discrepancy is that the sedimentary process is influenced by both lake and swamp as the transition of peat layer and lacustrine facies layer in 10–9 ka. The coarse aeolian sand is blocked by more emerging plant and terrestrial plant and swamp in the lakeside in 10–9 ka which is supported by the higher C/N and lower salinity, respectively. After 8.5 ka, the coarser grain size, lower Paq, higher Pwax, and relatively higher salinity suggested relatively drier and less aquatic plant than before. However, Radix auricularia in the high lake remains of ZZH basin and Planorbids in high lake remains of BRZH basin, which is located in the basin of ZZH profile and 3 km far away from ZZH core, were dated to be 8594 ± 45 cal yr BP and 8438 ± 74 cal yr BP, respectively (Wang et al., 2016). This corroborated the transformation from humid in 10–8.5 ka to relatively dry in 8.5–7.8 ka. The relative dry period in 8.5–7.8 ka was not completely synchronous with the relative cold period in 8.8–8.2 ka, suggesting the local climate change was not the single factor to influence environment change in Sedimentary profile ZZH. The dry event was in phase with the records in Asian Monsoon margin areas, such as Zhuyeze Lake (Long et al., 2010), Qinghai Lake (Ji et al., 2005), Dali Lake (Liu et al., 2015), and Huahai Lake (Li et al., 2016); and Monsoon area, such as Dahu Peat (Zhong et al., 2010) and Erhai Lake (Dearing et al., 2008). But, the records in the western of Tibetan Plateau (Gasse et al., 1991, 1996) implied more humid environment antiphase with the records in the desert, northern, and central Tibetan Plateau. The westerlies area did not show apparent response to the cold event (Chen et al., 2016; Wang and Feng, 2013). The weaker Asian monsoon event (Wang et al., 2005) and low temperature event (Hou and Fang, 2012) triggered less precipitation (Hou et al., 2012; Liu et al., 1998; Wang et al., 2014) and less glacier meltwater (Li et al., 2012; Wischnewski et al., 2011) during 8.5–7.8 ka in northern and central Tibetan Plateau. The humid period of the desert in 10–8.8 ka was inconformity with the dry records in Xinjiang (An et al., 2012; Chen et al., 2016; Wang et al., 2013b), Northern China (Feng et al., 2006; Ran and Feng, 2013; Wen et al., 2010), North Mongolia Plateau (Tarasov et al., 2007; Wang et al., 2011; Wang and Feng, 2013), and conformity with South China (Dearing et al., 2008; Dykoski et al., 2005; Wang et al., 2005; Wei et al., 2010; Yamamoto et al., 2010; Zhao et al., 2011b) and Tibetan Plateau (Gasse et al., 1991, 1996; Herzschuh et al., 2006; Hou et al., 2012; Kramer et al., 2010). The desert lake may be strongly influenced by Asian Monsoon in some way.
Between 7.8 and 5.8 ka, the local maximum of con_nak is evidence for more productivity in situ and most humid environment, in agreement with local maximum EM2, PCA-1 scores, and finer grain size. The most humid period in the desert was in conformity with the records in the Westerlies area (An et al., 2012; Chen et al., 2008, 2016; Huang, 2006; Jiang et al., 2013; Liu et al., 2008; Ran and Feng, 2013; Wang et al., 2013) and northern Mongolia Plateau (Demske et al., 2005; Feng et al., 2013; Tarasov et al., 2007; Wang and Feng, 2013; Wang et al., 2011), a little later than the most humid period in Southern China (Dearing et al., 2008; Ma et al., 2008; Wang et al., 2007; Wei et al., 2010), almost in conformity with the most humid records in northern China (Chen et al., 2015; Jiang et al., 2006), monsoon margin area (Ji et al., 2005; Long et al., 2010; Liu et al., 2015; Xiao et al., 2004; Xu et al., 2010), and northern and Central of Tibetan Plateau (Gasse et al., 1996; Morrill et al., 2006; Wang et al., 2014; Wischnewski et al., 2011). The expansion of desert lake maybe response to strong Asian Monsoon, especially the strong East Asian Monsoon.
Between 5.8 and 5.5 ka, a sharp drop of PCA-1 scores, EM2, and con_nak, in agreement with sharp rise of grain size and salinity, suggests the quickly salinizing and shrinking of lake and more arid environment. Between 5.5 and 3.0 ka, the increasing C/N value, ranging from 8.6 to 19.5, suggests more emergent plant (Finlay and Kendall, 2007; Krishnamurthy et al., 1986; Müller and Voss, 1999) and the higher Paq, ranging from 0.3 to 0.5, also suggests more emergent plant (Cheung et al., 2015; Ficken et al., 2000). Hence, increasing Paq and C/N value suggests more emergent plant and less terrestrial plant or submerged plant, indicating a shallow lake environment between 5.5 and 2.5 ka. It is in agreement with the lithology of limnetic facies. Between 3.0 and 2.5 ka, sharply decreasing Paq and higher C/N value, ranging from 14 to 20, suggests less aquatic plant and more terrestrial plant. And sharp salinization suggested gradually shrinking between 5.8 and 2.5 ka. The particle sediment could only directly derive from emerged paleolake sediment around lake and suspended sediment from farther afield, as the lake gradually shrink, more fine particles from emerged paleolake sediment was transported to remaining lake and more suspended sediment (Lancaster, 1995; Tsoar and Pye, 1987) was directly transported to lake by wind action, which is supported by increasing silt content. The interpretation about grain size needs more study on grain size modern process. A drying trend is identified by the lithology and lower con_nak despite the discrepancy occurred between different proxies in 5.8–2.5 ka. The drying trend in the desert was verified by the absence of high lake level (Wang et al., 2016) and calcareous cement (Yang et al., 2011). The drying trend is inconformity with the warming records in Westerlies area (Chen et al., 2008, 2016; Ran and Feng, 2013) and northern Mongolia Plateau (Wang et al., 2011; Wang and Feng, 2013), conformity with the drying records in northern China, southern China, monsoon margin area, and northern and Central of Tibetan Plateau during 5.8–2.5 ka, that is, the drying trend was in phase with the weakening Monsoon (Dong et al., 2010; Wang et al., 2005, 2010).
Between 2.5 and 0.8 ka, the lithology of aeolian sand and multiproxy, including coarser grain size, minimum EM2, PCA-1 scores, and highest C/N, document the arid environment and less aquatic plant. Between 0.8 and 0.1 ka, the lithology of lake deposit and multiproxy, including finer grain size, maximum EM2, PCA-1 scores, and lower C/N, suggest humid environment. After 0.1 ka, the aeolian sand, higher C/N, lower EM2, and PCA-1 score indicate the desert environment same as today.
The probable forcing mechanisms of Holocene hydroclimate change
In this study, millennial-scale Holocene environmental changes in lake basin from Badain Jaran Desert imply that it was arid to humid in after YD (11–10 ka), relative humid in the early Holocene (10–7.8 ka), most humid in the middle Holocene (7.8–5.8 ka), dry in the mid to late Holocene (5.8–0.8 ka), and a little humid in 0.8–0.1 ka. The moisture change was synchronous with the temperature change in millennial scale before 2 ka, but the phases of higher temperature and higher humidity do not always coincide in century scale, such as the relative humid, proved by higher EM2 and higher lake level (Wang et al., 2016), and cold environment in about 8.3 ka; the relative humid, proved by higher PCA-1 score, and cold environment in about 7.4 ka; dry and warm environment in 1.8–1.4 ka; and humid and cold environment in 0.8–0.1ka.
To clarify the similarities and differences with the lake evolution pattern with runoff, we compare our results with other proxy from Asian Monsoon margin surrounding the desert. The most humid period of the desert was basically conformity with the records from southeastern of Monsoon margin, such as at 7.9–4.5 ka in Daihai Lake (Xiao et al., 2004), 7.7–6 ka in Dali Lake (Liu et al., 2015), 7.4–4.8 ka in Zhuyeze Lake (Li et al., 2009; Long et al., 2010), and 8.1–5.9 ka in Qinghai Lake (Ji et al., 2005), relatively later than the records from northwestern of Monsoon margin, such as 8.8–5.5 ka in Huahai Lake (Li et al., 2016; Wang et al., 2012) and 8.5–7.5 ka in Hongshui River and different with the records in westerlies core area (Chen et al., 2016; Jiang et al., 2013; Wang et al., 2013b) and northwestern of the desert (Hartmann and Wunnemann, 2009, COHMAP Members, 2003). The relative humid period in early Holocene was different with the dry records from eastern of Monsoon margin area, such as Daihai Lake (Xiao et al., 2004), Dali Lake (Liu et al., 2015) and conform with the records from the northeastern of Tibetan Plateau, such as Qinghai Lake (Ji et al., 2005). The environment change pattern was synchronous with the northeastern of Tibetan Plateau.
Despite the synchronism with the Monsoon margin area records, the lake evolution should not be directly dominated by the Monsoon intensity. In fact, the precipitation could barely infiltrate to be groundwater or gather to be runoff to influence the lake evolution in the desert. Groundwater accounts for the main water source of modern lakes in the Badain Jaran Desert; annual precipitation of 87 mm accounts for 10% of the total supply. The reconstructed annual precipitation in the middle Holocene was 300 mm, 37% higher than present, in the Shiyang River Basin in the southeast of the desert (Guo et al., 2000; Zhao et al., 2007) and 340 mm, 10% higher than the present, in the northeast of the Tibetan plateau (Wang et al., 2014). The calcareous root tubes of the Badain Jaran Desert imply that annual precipitation was approximately 200 mm (Li et al., 2015). In the Zhunzhahan Jaran Basin, where Sedimentary profile ZZH was collected, the paleolake inferred from the lake level maintained an area of 1.83 km2 and a depth of 26 m. Annual precipitation is hypothesized to have been 200 mm (2.2 times present annual precipitation) with an annual evaporation capacity of 1450 mm, as much as that of a modern salt-water lake. Wang et al. (2016) calculated the annual groundwater recharge to be 2.3 × 10⁶ m3, 6.3 times the annual precipitation recharge. Given the higher temperature and lower salinity in the early to middle Holocene, the evaporation capacity was likely to be greater than the modern annual evaporation capacity of 1450 mm. Therefore, the annual groundwater recharge was likely greater than 2.3 × 10⁶ m3, and the ratio of groundwater recharge to precipitation recharge was more than 6.3, approximately equal to that in the modern. Consequently, there is reason to infer that change in groundwater recharge and evaporation capacity dominated the evolution of lakes in the Badain Jaran Desert during the Holocene. The groundwater dominated the lake evolution during Holocene (Dong et al., 2016; Ma et al., 2014; Wang et al., 2016) and most of groundwater comes from southeastern of the desert, that is, the Northeastern of Tibetan Plateau (Lu et al., 2010; Wu et al., 2014). Hence, the synchronism with the Monsoon margin area records actually implied correlation between the relative humid in the Monsoon margin area and the groundwater recharged amount to the desert.
To further probe into the possibility and mechanism of groundwater from the Northeastern Tibetan Plateau recharging to the desert lake, we compared our records with the amount of precipitation and glacier meltwater, which are key factors for groundwater recharged amount (Cheng and Jin, 2013; Immerzeel et al., 2010; Zhang et al., 2005; Zhou et al., 2010a). The reconstructed precipitation in northeastern of Tibetan Plateau, such as Donggi Cona Lake (Wang et al., 2014), Kuhai Lake (Wischnewski et al., 2011), and Koucha Lake (Herzschuh et al., 2009), showed highest value during 11–9 ka and second highest value during 7.5–5 ka. Although the precipitation covered highest value (Herzschuh et al., 2009; Wang et al., 2014; Wischnewski et al., 2011), the glaciers had retreated significantly after YD certified by a series of moraine deposit and loessic silts capping a latero-frontal moraine (Hu et al., 2016; Owen et al., 2005, 2003a, 2003b). The only plausible explanation for the apparent discrepancy is the huge amount of glacier meltwater under high temperature. The more glacier meltwater and more precipitation in northeastern of Tibetan Plateau made it possible to provide more groundwater to the desert in early Holocene. Another large-scale glacial recession with high precipitation occurred after 8.2 ka event, which is certified by 14C age (Jiao et al., 2000; Shijie and Keqin, 1990; Zhao et al., 2011a) and cosmogenic radionuclide age (Owen et al., 2003a, 2003b; Rose et al., 1998) of moraine deposit. The higher amount of glacier meltwater and precipitation during 11–9 ka and 7.5–6 ka, as key factors to provide more groundwater recharged amount, mainly match with the humid period in the desert lake. This further determined the importance of precipitation and glacier meltwater in northeastern of Tibetan Plateau for the lake evolution in the hinterland of Badain Jaran Desert.
Conclusion
Based on the grain size, salinity, and n-alkane proxies of Sedimentary profile ZZH from the hinterland of the Badain Jaran Desert, we reconstructed changes in Holocene effective humidity and paleotemperature in a groundwater recharge lake of arid region. The records imply warm and humid environment in early to mid Holocene, and cold and dry in mid to late Holocene. The temperature was broadly synchronous with northeastern of Tibetan Plateau and Northern Hemisphere temperature, driven mainly by orbital factors and Thermohaline Circulation. The effective humidity was consistent with northeastern of Tibetan Plateau and monsoon margin area records. However, the desert lake evolution was mainly dominated by exogenous groundwater rather than local precipitation or runoff. Considering groundwater comes from southeastern of the desert, effective humidity may indicate recharge intensity of groundwater from northeastern of Tibetan Plateau.
Footnotes
Acknowledgements
We are grateful to Shi Xuezhao and Wang Yueguang on experimental work and Prof. Li Yu, anonymous reviewer, for very helpful comments.
Funding
This project was supported by the he National Natural Science Foundation of China (Nos. 41530745 and 41871021), the Fundamental Research Funds for the Central Universities (No. lzujbky-2018-it82) and the Fundamental Research Funds for Chinese Academy of Geological Sciences (No. YYWF201627).